geological engineering department, middle east technical...
TRANSCRIPT
791
THE USE OF METHYLENE BLUE ADSORPTION TEST TO ASSESS THE CLAY CONTENT OF THE CAPPADOCIAN TUFF
TAMER TOPAL
Geological Engineering Department, Middle East Technical University, 06531 , Ankara, Turkey
SUMMARY:
Fairy chimneys formed within the Cappadocian tuft are important landforms. Some of them were
dwelled in the past and contain valuable wall paintings. However, the tuff is chemically and physically deteriorated due to atmospheric effects. the chemical weathering of the volcanic glass of the tuft produces smectite-type clay mineral. Assessment of the clay content of the weathered zones developed within the tuft is essential to understand their engineering behaviour, and thus to take necessary precautions for the purpose of conservation. In this study, the clay content of the tuft is
assessed by the "methylene blue adsorption test" using spot method. The method is based on the replacement of the natural cations of clays by methylene blue dye. The amount of the dye adsorbed by the clays is used to calculate first the cation exchange capacity of the tuft and then its clay content. Based on the test results, the clay content of the tuft ranges between 2% and 14%. It is higher adjecent to joints and lower where lichen cover exists.
1. INTRODUCTION
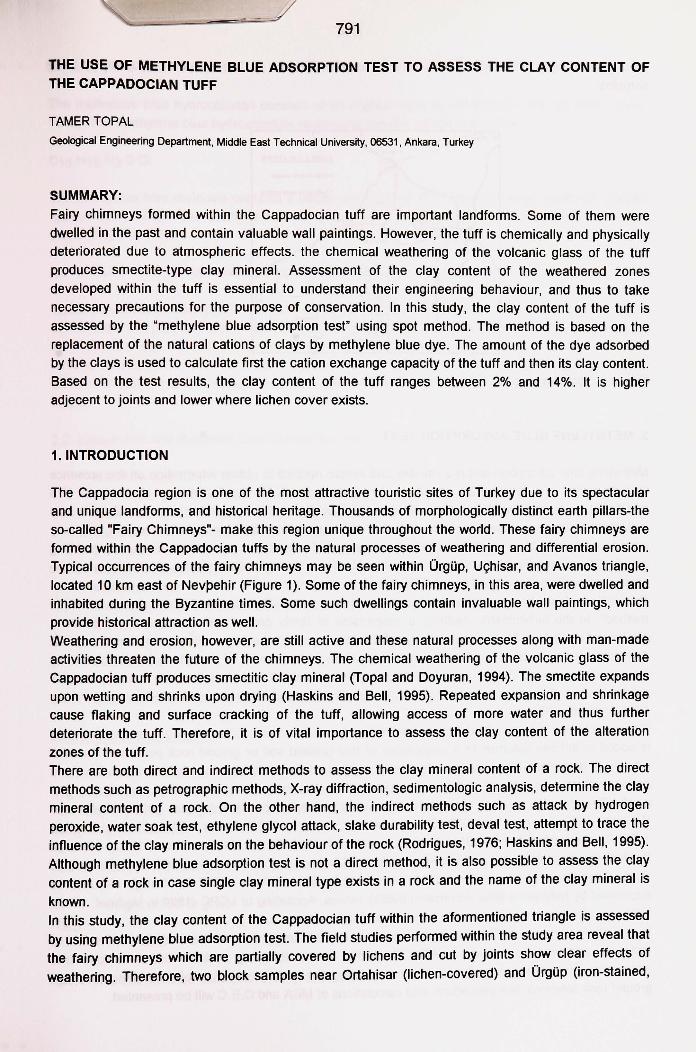
The Cappadocia region is one of the most attractive touristic sites of Turkey due to its spectacular and unique landforms, and historical heritage. Thousands of morphologically distinct earth pillars-the so-called "Fairy Chimneys"- make this region unique throughout the world. These fairy chimneys are formed within the Cappadocian tufts by the natural processes of weathering and differential erosion. Typical occurrences of the fairy chimneys may be seen within Orgup, U9hisar, and Avanos triangle, located 10 km east of Nevpehir (Figure 1). Some of the fairy chimneys, in this area, were dwelled and inhabited during the Byzantine times. Some such dwellings contain invaluable wall paintings, which
provide historical attraction as well. Weathering and erosion, however, are still active and these natural processes along with man-made activities threaten the future of the chimneys. The chemical weathering of the volcanic glass of the Cappadocian tuft produces smectitic clay mineral (Topal and Doyuran, 1994). The smectite expands upon wetting and shrinks upon drying (Haskins and Bell, 1995). Repeated expansion and shrinkage cause flaking and surface cracking of the tuft, allowing access of more water and thus further deteriorate the tuft. Therefore, it is of vital importance to assess the clay content of the alteration
zones of the tuft. There are both direct and indirect methods to assess the clay mineral content of a rock. The direct methods such as petrographic methods, X-ray diffraction, sedimentologic analysis, determine the clay mineral content of a rock. On the other hand, the indirect methods such as attack by hydrogen peroxide, water soak test, ethylene glycol attack, slake durability test, deval test, attempt to trace the influence of the clay minerals on the behaviour of the rock (Rodrigues, 1976; Haskins and Bell, 1995). Although methylene blue adsorption test is not a direct method, it is also possible to assess the clay
content of a rock in case single clay mineral type exists in a rock and the name of the clay mineral is
known. In this study, the clay content of the Cappadocian tuft within the aformentioned triangle is assessed
by using methylene blue adsorption test. The field studies performed within the study area reveal that the fairy chimneys which are partially covered by lichens and cut by joints show clear effects of
weathering. Therefore, two block samples near Ortahisar (lichen-covered) and Orgup (iron-stained,
792
around joints) were collected from two different locations (Figure 1). The tests are perfonned on these
samples.
S . .\.\fPLE LOC .~ noss
"
l Figure 1. Location map of Orgup-Ui;hisar-Avanos area.
2. METHYLENE BLUE ADSORPTION TEST
Methylene blue adsorption test is a reliable and simple method to obtain information on the presence and properties of clay minerals in soils and rocks, especially in the first stages of research. If a significant amount of methylene blue is adsorbed by the soil or ground rock material, this may indicate the presence of swelling clay minerals, although there exist other substances that also may adsorb methylene blue (Verhoef, 1992). Low values of adsorption generally indicate low swelling activity (Stapel and Verhoef, 1989). In other words, low values reveal the presence of either very low amount of swelling clay or certain amount of non-swelling clay. Two test methods have been used in practice, namely, the "turbidimetric" method and the "spot method". In the turbidimetric method, a suspension of finely ground soil or rock is mixed with a solution of methylene blue, and is left over for a few days and then on a diluted solution the optical density is measured by a spectrophotometer, from which the amount of methylene blue adsorbed by the clay is detennined. This is done by comparing the colors of the test solution with a standard set of solutions of varing methylene blue concentrations (Brindley and Thompson, 1970; Hosking and Pike, 1985, Verhoef, 1992).
The spot method is a simplified titration technique. A certain concentration of methylene blue solution is added in definite volumes to a suspension of fine grained soil or ground rock particles. The total amount of methylene blue solution adsorbed is used for the calculation of methylene blue value, and cation exchange capacity (C.E.C.) of the soil or rock. The method is very simple, convenient, and quick. Therefore, it is very commonly used in engineering practice (Jones, 1964; Nevins and Weintritt, 1967; Denis et al., 1980; Steward and McCullough, 1985; Taylor, 1985; Hills and Pettifer, 1985; Bensted, 1985; Higgs, 1986; Stapel and Verhoef, 1989; Qoki;a, 1991; Verhoef, 1992). Although the test is originally developed by Jones (1964), it is improved by French scientists at Laboratoire Central des Ponts et Chaussees (LCPC). Atterberg limits, activity and C.E.C. of clays can also be expressed by Methylene Blue Adsorption (MBA) values. According to LCPC (1990 in Verhoef, 1992), MBA can also be used conveniently in soil classifications.
In this study, the spot method is used to detennine MBA and C.E.C. of the Cappadocian tuff. The tests are performed according to AFNOR (1980). In the following sections the methylene blue adsorption, the apparatus and reagents used during the test, preparation of methylene blue and ground rock solutions, test procedure. and calculations of MBA and C.E.C will be presented.
793
2.1. Methylene Blue Adsorption
The methylene blue hydrochloride consists of an organic base in combination with an acid (Taylor,
1985). The methylene blue hydrochlodide (anhyrous) has the following formula:
C16 H18 N3 S Cl
The methylene blue molecule contains a negatively charged (Cit ion and a large positively charged ion (Verhoef, 1992). The methylene blue replaces natural cations of clay irreversibly as indicated below (Taylor, 1985):
Ca-Na CLAY + MB hydrochloride ---------------------> MB CLAY + Ca-Na Chloride
When a methylene blue solution is added to a watery clay mixture, the positive methylene blue ion
drives away the positive ions at the external surface of the clay. The process contiues until all the other positive ions have been expelled. Up to that point all the methylene blue attach to the clay mineral surfaces. Then the methylene blue ions replace the positive ions of the interlayers. From then on, the remaining methylene blue ions stay in solution.The maximum adsorption corresponds with the
C.E.C.
2.2. Equipments and Reagents Used During the Test
-a burette (capacity = 100 cc or 50 cc) -filter paper (Whatman 40, 12.5 cm diameter) -glass stirring rod (length = 100 mm, Diameter= 8 mm) -magnetic stirrer (speed 400 to 700 rpm) -glass container (capacity= 500 cc or 1000 cc, diameter= 100 mm)
-a balance (sensitivity = 0.01 g.) -a chronometer -medical quality methylene blue (MERK Art.6040 was used in this study)
-distilled water -oven dry soil or ground rock sample (sieved through No.40 sieve, i.e., passing
425 micron)
2.3. Preparation of Methylene Blue and Ground Rock Solutions
a) Methylene Blue Solution:
The normality of methylene blue dye is determined if to be used directly for the test since it is
hygroscopic or oven-dried methylene blue dye is used to expel water. 10 g. methylene blue of known normality is placed in a glass container, 1 It of distilled water is added, and they are mixed very well
using magnetic stirrer.
The normality of the methylene blue dye (MB) can be calculated by the following formula:
weight of MB in gram 100-X
NMB = --------------------------- x ----------320 100
where Xis the moisture content of methylene blue dye.
794
b) Ground Rock Solution: 30 g. (or 7.5 g.) of ground rock sample passing 425 micron is placed in a glass container. 200 cc (or 50 cc in the case of 7.5 g. rock sample) distalled water is added and they are mixed by means of
magnetic stirrer at a speed of about 700 rpm.
2.4. Test Procedure
The methylene blue solution already prepared is put in to a burette and 5 cc of this solution is added to ground rock solution which is continuously being stirred. To perform titration, successive volumes
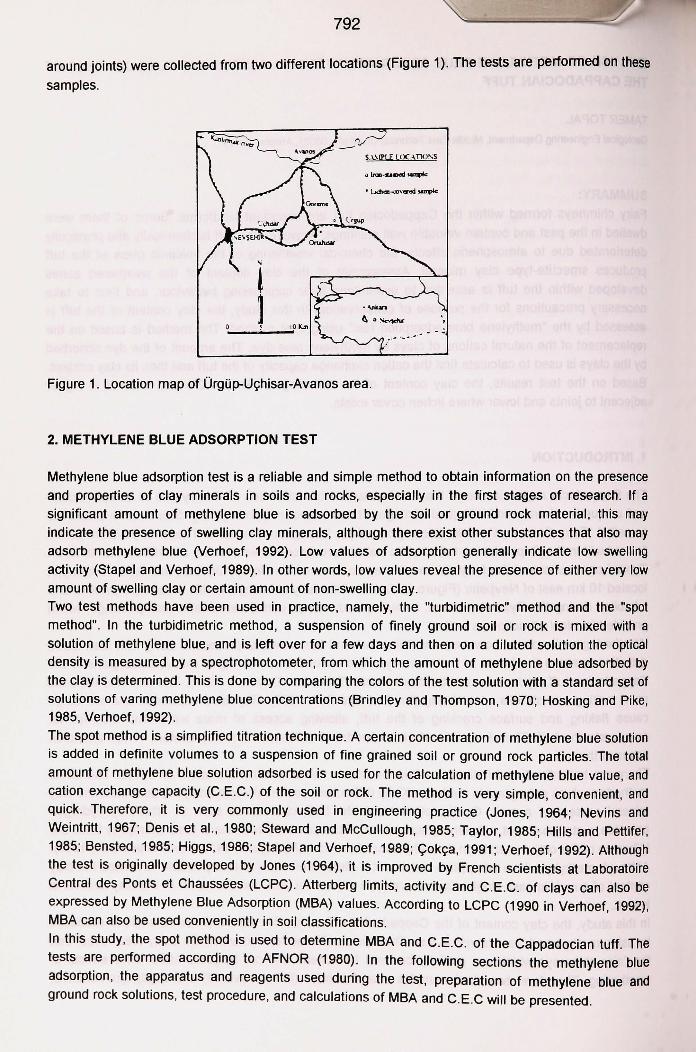
of methylene blue (2 cc or 1 cc) are added to the ground rock solution. After each addition, the mixed solution is agitated for 1 minute and a drop of the dispersion is removed with a glass rod. This is dabbed carefully on a sheet of filter paper. Initially, a circle of dust is formed which is colored dark blue and has a distinct edge, and is surrounded by a ring of clear water (Figure 2). When the edge of the dust circle appears fuzzy and/or is surounding by a narrow light blue halo, another spot test is done after 1 minute. If the halo is disappeared , more blue is added. If there is still a halo, the test is repeated 4 more times at 1 minute intervals. If the light blue halo still exists at the end of the 5.th spot test, this indicates the end-point and the total volume of methylene blue dye added is recorded (Figure 2).
2.5. Calculation of MBA and C.E.C
The Methylene Blue Adsorption value (MBA) is normally expressed in grams Methylene Blue Adsorbed by 100 grams of sample material, mostly given as g/100 g. The MBA of a sample is calculated by the following formula:
MBA= Vcc/f'
where Vee = volume of the methylene blue solution injected to the ground rock solution (cm3)
f' = dry weight of the sample used (g.)
Since the normality of the Methylene Blue solution is known, the net cation exchange capacity (C.E.C.) may be calculated from the following formula:
C.E.C. = (100/f ') x Vee x Normality
9 8cc
7 cc
6 cc
s cc
; in meq/100 g.
lOcc e 10 cc
10 cc 10 cc
Figure 2. Spot tests for finding end point and total volume of methylene blue added.
795
3. METHYLENE BLUE ADSORPTION TESTS ON THE CAPPADOCIAN TUFF
The methylene blue adsorption test is performed to obtain information on the presence and properties of clay minerals in the lichen-covered and iron-stained samples. The spot method proposed by AFNOR (1980) is used during the test. The methylene blue adsorption value (MBA) and the cation exchange capacity (C.E.C.) of the lichen-covered and iron-stained samples are presented in Tables 1
and 2. In order to compare the test results, the MBA values of some common minerals and C.E.C. values of some clay minerals are compiled from the existing literature and are given in Tab. 3 and 4.
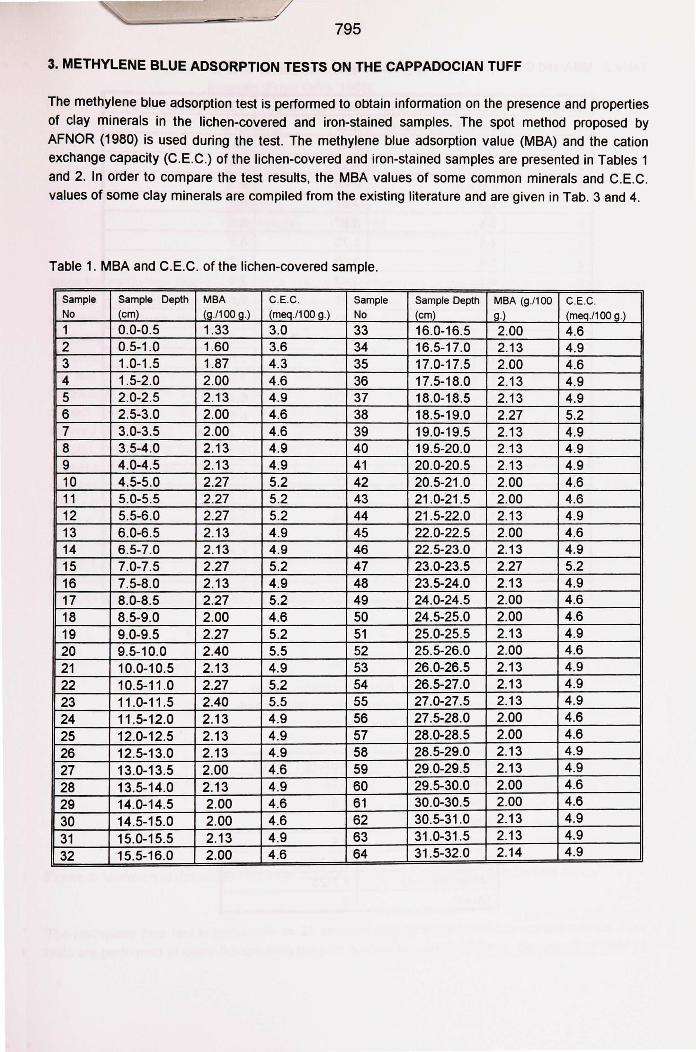
Table 1. MBA and C.E.C. of the lichen-covered sample.
Sample Sample Depth MBA C.E.C. Sample Sample Depth MBA (g./100 C.E.C. No (cm)_ ~./100g.) _(m_~/100 ...21 No 1cm1 Jt) lmeq./100 Jt) 1 0.0-0.5 1.33 3.0 33 16.0-16.5 2.00 4.6 2 0.5-1 .0 1.60 3.6 34 16.5-17.0 2.13 4.9 3 1.0-1.5 1.87 4.3 35 17.0-17.5 2.00 4.6 4 1.5-2.0 2.00 4.6 36 17.5-18.0 2.13 4.9 5 2.0-2.5 2.13 4.9 37 18.0-18.5 2.13 4.9 6 . 2.5-3.0 2.00 4.6 38 18.5-19.0 2.27 5.2 7 3.0-3.5 2.00 4.6 39 19.0-19.5 2.13 4.9 8 3.5-4.0 2.13 4.9 40 19.5-20.0 2.13 4.9 9 4.0-4.5 2.13 4.9 41 20.0-20.5 2.13 4.9 10 4.5-5.0 2.27 5.2 42 20.5-21 .0 2.00 4.6 11 5.0-5.5 2.27 5.2 43 21.0-21 .5 2.00 4.6 12 5.5-6.0 2.27 5.2 44 21 .5-22.0 2.13 4.9 13 6.0-6.5 2.13 4.9 45 22.0-22.5 2.00 4.6 14 6.5-7.0 2.13 4.9 46 22.5-23.0 2.13 4.9 15 7.0-7.5 2.27 5.2 47 23.0-23.5 2.27 5.2 16 7.5-8.0 2.13 4.9 48 23.5-24.0 2.13 4.9 17 8.0-8.5 2.27 5.2 49 24.0-24.5 2.00 4.6 18 8.5-9.0 2.00 4.6 50 24.5-25.0 2.00 4.6 19 9.0-9.5 2.27 5.2 51 25.0-25.5 2.13 4.9 20 9.5-10.0 2.40 5.5 52 25.5-26.0 2.00 4.6 21 10.0-10.5 2.13 4.9 53 26.0-26.5 2.13 4.9
22 10.5-11 .0 2.27 5.2 54 26.5-27.0 2.13 4.9
23 11 .0-11 .5 2.40 5.5 55 27.0-27.5 2.13 4.9
24 11.5-12.0 2.13 4.9 56 27.5-28.0 2.00 4.6
25 12.0-12.5 . 2.13 4.9 57 28.0-28.5 2.00 4.6
26 12.5-13.0 2.13 4.9 58 28.5-29.0 2.13 4.9
27 13.0-13.5 2.00 4.6 59 29.0-29.5 2.13 4.9
28 13.5-14.0 2.13 4.9 60 29.5-30.0 2.00 4.6
29 14.0-14.5 2.00 4.6 61 30.0-30.5 2.00 4.6
30 14.5-15.0 2.00 4.6 62 30.5-31.0 2.13 4.9
31 15.0-15.5 2.13 4.9 63 31.0-31 .5 2.13 4.9
32 15.5-16.0 2.00 4.6 64 31.5-32.0 2.14 4.9
796
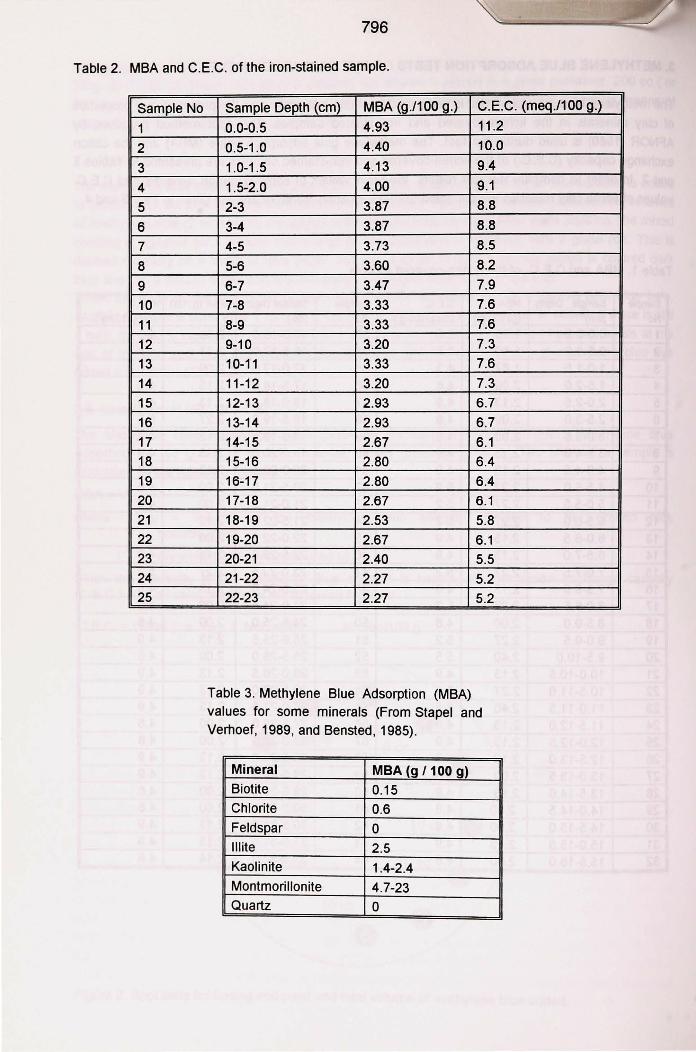
Table 2. MBA and C.E.C. of the iron-stained sample.
Sample No
1
2
3
4
5
6
7
8
9
10
11
12
13
14
15
16
17
18
19
20
21
22
23
24
25
Sample Depth (cm) MBA (g./100 g.) C.E.C. (meq./100 g.)
0.0-0.5 4.93 11 .2
0.5-1 .0 4.40 10.0
1.0-1 .5 4.13 9.4
1.5-2.0 4.00 9.1
2-3 3.87 8.8
3-4 3.87 8.8
4-5 3.73 8.5
5-6 3.60 8.2
6-7 3.47 7.9
7-8 3.33 7.6
8-9 3.33 7.6
9-10 3.20 7.3
10-11 3.33 7.6
11-12 3.20 7.3
12-13 2.93 6.7
13-14 2.93 6.7
14-15 2.67 6.1
15-16 2.80 6.4
16-17 2.80 6.4
17-18 2.67 6.1
18-19 2.53 5.8
19-20 2.67 6.1
20-21 2.40 5.5
21 -22 2.27 5.2 22-23 2.27 5.2
Table 3. Methylene Blue Adsorption (MBA) values for some minerals (From Stapel and Verhoef, 1989, and Bensted, 1985).
Mineral MBA (g / 100 g) Biotite 0.15 Chlorite 0.6 Feldspar 0 lllite 2.5 Kaolinite 1.4-2.4 Montmorillonite 4.7-23 Quartz 0
797
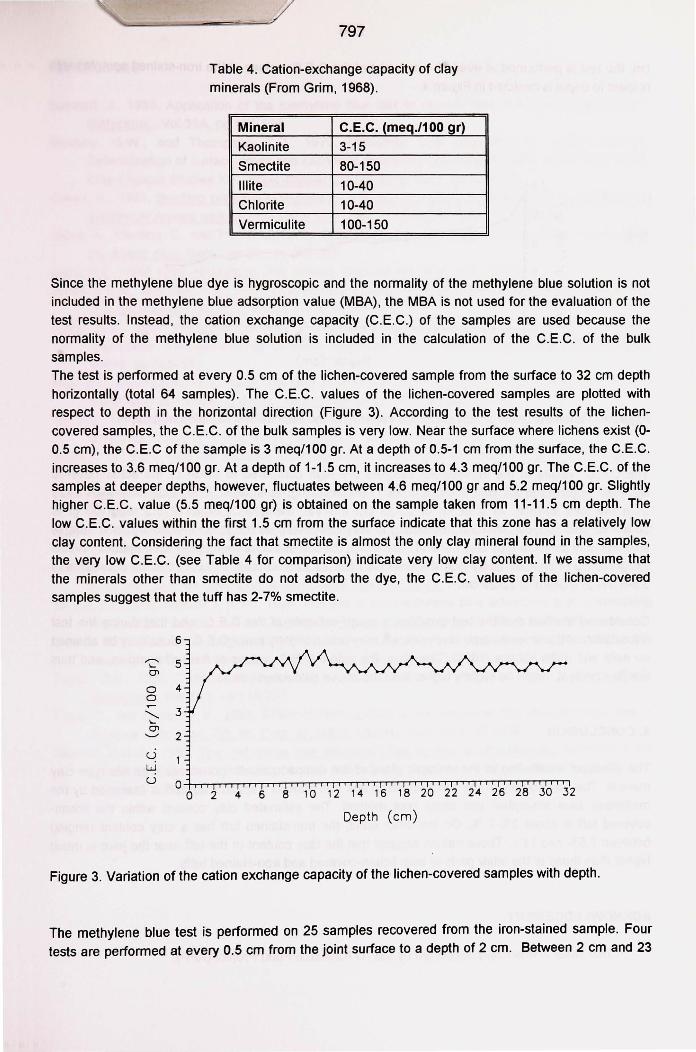
Table 4. Cation-exchange capacity of clay
minerals (From Grim, 1968).
Mineral C.E.C. (meq./100 gr)
Kaolinite 3-15
Smectite 80-150
lllite 10-40
Chlorite 10-40
Vermiculite 100-150
Since the methylene blue dye is hygroscopic and the normality of the methylene blue solution is not included in the methylene blue adsorption value (MBA), the MBA is not used for the evaluation of the
test results. Instead, the cation exchange capacity (C.E.C.) of the samples are used because the normality of the methylene blue solution is included in the calculation of the C.E.C. of the bulk samples. The test is performed at every 0.5 cm of the lichen-covered sample from the surface to 32 cm depth horizontally (total 64 samples). The C.E.C. values of the lichen-covered samples are plotted with respect to depth in the horizontal direction (Figure 3). According to the test results of the lichencovered samples, the C.E.C. of the bulk samples is very low. Near the surface where lichens exist (0-0.5 cm), the C.E.C of the sample is 3 meq/100 gr. At a depth of 0.5-1 cm from the surface, the C.E.C. increases to 3.6 meq/100 gr. At a depth of 1-1.5 cm, it increases to 4.3 meq/100 gr. The C.E.C. of the samples at deeper depths, however, fluctuates between 4.6 meq/100 gr and 5.2 meq/100 gr. Slightly higher C.E.C. value (5.5 meq/100 gr) is obtained on the sample taken from 11-11.5 cm depth. The low C.E.C. values within the first 1.5 cm from the surface indicate that this zone has a relatively low clay content. Considering the fact that smectite is almost the only clay mineral found in the samples, the very low C.E.C. (see Table 4 for comparison) indicate very low clay content. If we assume that the minerals other than smectite do not adsorb the dye, the C.E.C. values of the lichen-covered
samples suggest that the tuff has 2-7% smectite.
2 4 6 8 10 12 14 16 18 20 22 24 26 28 30 32
Depth (cm)
Figure 3. Variation of the cation exchange capacity of the lichen-covered samples with depth.
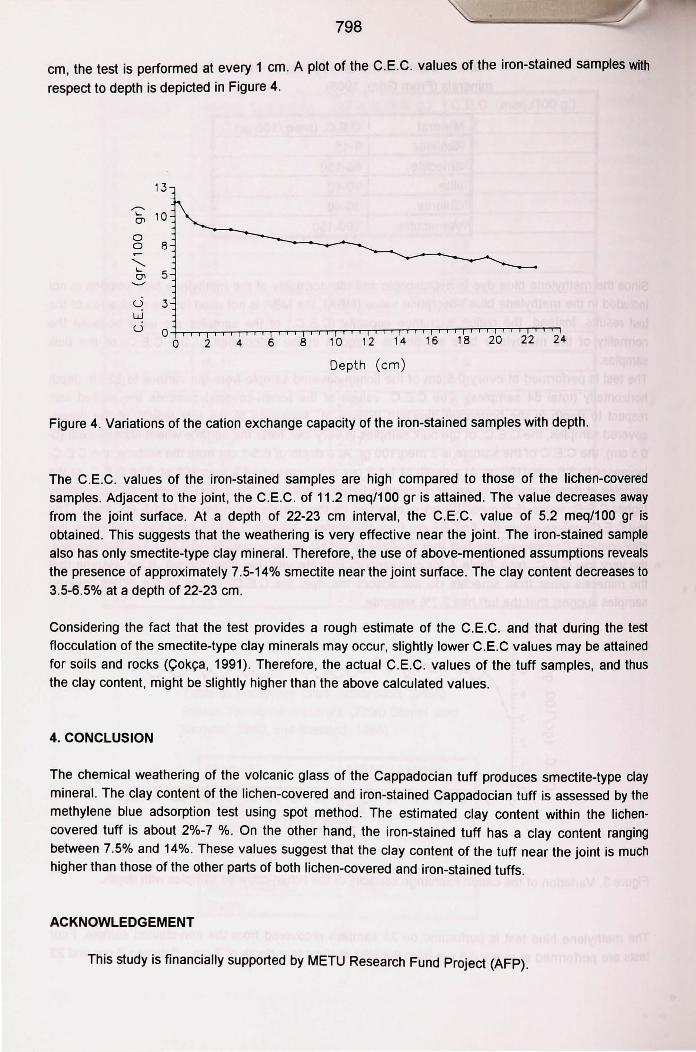
The methylene blue test is performed on 25 samples recovered from the iron-stained sample. Four
tests are performed at every 0.5 cm from the joint surface to a depth of 2 cm. Between 2 cm and 23
798
cm, the test is performed at every 1 cm. A plot of the C.E.C. values of the iron-stained samples with
respect to depth is depicted in Figure 4.
,.-... ...... (Jl
0 0
.......... ...... (Jl ...._,
u w u
13
10
8
5
3
0 0 2 4 6 8 10 12 14 16 18 20 22 24
Depth (cm)
Figure 4. Variations of the cation exchange capacity of the iron-stained samples with depth.
The C.E.C. values of the iron-stained samples are high compared to those of the lichen-covered samples. Adjacent to the joint, the C.E.C. of 11 .2 meq/100 gr is attained. The value decreases away
from the joint surface. At a depth of 22-23 cm interval, the C.E.C. value of 5.2 meq/100 gr is obtained. This suggests that the weathering is very effective near the joint. The iron-stained sample also has only smectite-type clay mineral. Therefore, the use of above-mentioned assumptions reveals the presence of approximately 7.5-14% smectite near the joint surface. The clay content decreases to
3.5-6.5% at a depth of 22-23 cm.
Considering the fact that the test provides a rough estimate of the C.E.C. and that during the test flocculation of the smectite-type clay minerals may occur, slightly lower C.E.C values may be attained for soils and rocks (Qokc;a, 1991). Therefore, the actual C.E.C. values of the tuft samples, and thus the clay content, might be slightly higher than the above calculated values.
4. CONCLUSION
The chemical weathering of the volcanic glass of the Cappadocian tuft produces smectite-type clay
mineral. The clay content of the lichen-covered and iron-stained Cappadocian tuft is assessed by the methylene blue adsorption test using spot method. The estimated clay content within the lichencovered tuft is about 2%-7 %. On the other hand, the iron-stained tuft has a clay content ranging between 7.5% and 14%. These values suggest that the clay content of the tuff near the joint is much higher than those of the other parts of both lichen-covered and iron-stained tufts.
ACKNOWLEDGEMENT
This study is financially supported by METU Research Fund Project (AFP).
799
REFERENCES
Bensted, J., 1985, Application of the methylene blue test to cement raw material, J. Chem. Tech.
Biotechnol., Vol.35A, pp.181-184. Brindley, G.W., and Thompson, T.D .. 1970, Methylene blue adsorption by montmorillonites.
Determination of surface areas and exchange capacities with different initial cation saturations,
Clay-Organic Studies XIX, Israel Journal of Chemistry, Vol.8, pp.409-415. <;ok98, E., 1991 , Swelling potential of expansive soils with a critical appraisal of the identification of
swelling of Ankara soils by methylene blue tests, Ph.D. thesis, M.E.T.U., 323 p. Denis, A. , Tourenq, C., and Tran N.L. , 1980, Capacite d'adsorption d'eau des sols et des roches, Bull.
Int. Assoc. Eng. Geol. , No.22,, pp.201-205.
Grim, R.E., 1968, Clay mineralogy, 2nd. Edition, McGraw Hill, New York, 596 p. Haskins, D.R., and Bell, F.G., 1995, Drakensberg basalts: their alteration, breakdown and durability,
Q.J. Engineering Geology, Vol.28, No.3, pp.287-302. Higgs, N.B., 1986, Preliminary studies of methylene blue adsorption as a method of evaluating
degradable smectite-bearing concrete aggregate sands, Cement and Concrete Research, Vol.16, pp.525-534.
Hills, J.F., and Pettifer, G.S., 1985, The clay mineral content of various rock types compared with the methylene blue value, J. Chem. Tech. Biotechnol. , Vol.35A, pp.168-180.
Hosking, J.R., and Pike, D.C., 1985, The methylene blue dye adsorption test in relation to aggregate drying shrinkage, J. Chem. Tech. Biotechnol. , Vol.35A, pp.185-194.
Jones, F.O., 1964, New fast accurate test measures bentonite in drilling mud, Oil Gas J., June, pp.76-78.
L'Association Francaise De Normalisation (AFNOR), 1980, Essai au bleu de methylene, P18-592, AFNOR 80181 , Paris La Defence.
Nevins, M.J., and Weintritt, D.J., 1967, Determination of cation exchange capacity by methylene blue adsorption, Ceramic Bulletin, Vol.46, No.6, pp.587-592.
Rodrigues, J.D., 1976, Estimation of the content of clay minerals and its significance in stone decay, Proc. Int. Conf. on Deterioration and Conservation of Stone, Athens, pp.105-108.
Stapel, E.E. , and Verhoef, P.N.W., 1989, The use of the methylene blue adsorption test in assessing the quality of basaltic tuft rock aggregate, Engineering Geology, Vol.26, pp.233-246.
Stewart E.T. , and McCullough, L.M., 1985, The use of the methylene blue test to indicate the soundness of road aggregates, J. Chem. Tech. Biotechnol. , Vol.35A, pp.161-167.
Taylor, R.K., 1985, Cation exchange in clays and mudrocks by methylene blue, J. Chem. Tech.
Biotechnol. , Vol.35A, pp.195-207. Topal, T. , and Doyuran, V., 1994, Effect of deterioration on the chemical and physical properties of
Goreme tufts, Proc. 7th. Int. Cogr. of IAEG, Lisboa, Vol.5, pp.3527-3536. Verhoef, P.N.W., 1992, The methylene blue adsorption test applied to geomaterials, Memoirs of the
Centre of Engineering Geology in the Netherlands, Delft University of Technology, No.101 ,
GEOMAT.02, 70 p.