geological mapping and borehole geology … · geological mapping and borehole geology in...
TRANSCRIPT
GEOLOGICAL MAPPING AND BOREHOLE GEOLOGY IN GEOTHERMAL EXPLORATION.
Llbolre MUhagaze*
UNU Geothermal Training Programme
National Energy Authority Grensasvegur 9, 108 Reykjavik
ICELAND
·Permanent address:
Department of Geology,
Ministry of Works, Energy and Mines, B.P. 745, Bujumbura,
BURUNDI.

2
3
ABSTRACT
Geothermal exploration Is carried out by a team of scien tists and engineers of different disciplines such as
geology. geochemistry, geophysics, drilling technology.
geothermal utilization, etc . This report deals with the
contribution of geological mapping and borehole geo l ogy to the understanding of the geothermal systems.
The first section deals briefly with a general procedure of geological exploration and the mapping of the Tr~lladyngja
area Is described as an application of the method. During
the field mapping , a special attempt is made to recon
struct the histories of tectonic and volcanic activity and to combine them into a Single relative timescale for the
area. A correlation Is made of the tectonic
the geothermal surface manifestations.
activity and
The second section of the report describes the borehole geologist in geothermal exploration.
tasks of a A study of
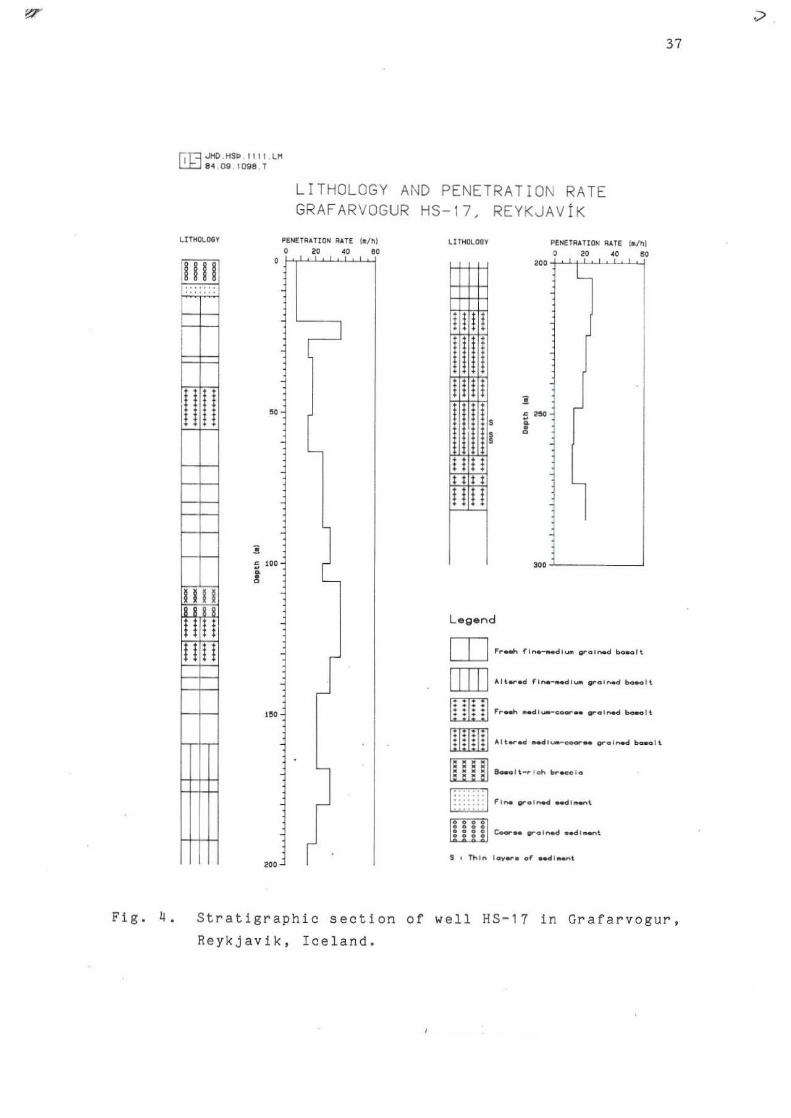
drill cuttings from the well HS - 17 in Grafarvogur, Reykjavik, constitutes a practical example.
In the last part of the report, some conclusions are drawn on geothermal exploration and a brief d iscussion made on a tentative programme of
country of the author .
geological exp l oration in the home

5
TABLE OF CONTENTS
Page
ABSTRACT ................................................ 3
INTRODUCTION
1.1 Purpose and scope of the study.. ..•.•.•........... 6
1.2 Geological setting .••.......•.•.•.•.•..•..••...•.• 7
1.3 Outline of the geology of Iceland •.•....••.... .... 9
2 GEOLOGICAL MAPPING
2.1 General procedure
2.2 Mapping of the Trolladyngja area •.•.•....•..•.••..
2.2.1 General geology of the area .•.............•. 2.2.2 FIeld mapping ••••.........••••••••••••••••••
2.2.2.1 History of the volcanic activity
2.2.2.2 History of the tectonic activity
2.2.3 Geothermal actIvity and hydrothermal altera-
ticn
3 BOREHOLE GEOLOGY
1 1
1 3
1 3 1 4
1 4
18
1 8
3.1 Contribution to geothermal system modelling ....... 20 3.1.1 Drill site study............................ 20
3.1.2 Laboratory work .......•••...•..•.•...•..•.•. 21
3.1.3 Geological modelling ........................ 22
3.2 Well HS-17 of Grafarvogur 22
3.2.1 Location,objective and data .....•...••••.•.. 22
3.2.2 Stratigraphy ...............•...............• 22
3.2.3 Alteration ••.•..•..•.••.•..•......•.••••.•.• 25
4 DISCUSSION AND CONCLUSIONS
ACKNOWLEOGEMENTS
REF ER ENC ES , , . , . " ....................................... . APPENDIX
LIST OF FIGURES
f'1 g • Geological map of Iceland
Fig. 2 The active volcanic zones of the Reykjanes
Peninsula, SW-Iceland
F! g. 3 Geological map of the Trolladyngja area
F1g. ~ Stratigraphic section of well HS-17 in Grafar -vogur, Reykjavik. Iceland .......................
27
30
31
38
35
37
6
INTRODUCTION
1.1 Purpose and scope of the study
The exploitation of geothermal energy within an area Is
based on the possibility of extraction of the natural heat
of the earth's crust in the area. As for any other resources, the feasibility of the exploitation supposes enough abundance and accessibility to be competitive with
other sources of energy. A prospect1ve area will therefore be the one which can deliver a high amount of thermal
energy at relatively shallow depth, or in other words, a
zone of abnormally high heat flux relatively near the
surface of the earth.
This natural heat Is produced either by a magma coolIng at depth or by decay reactions of radioactive elements
contained in the crust such as uranium, thorium and
potassium. Its transfer to the surface can be by conduc
tion, convection or diffusion whereas the most effective
and fast mode is the convection . For this
fer, the heat is conveyed to the surface
type of trans
by Circulating
groundwater. Therefore. the main objective of geothermal
exploration prior to drilling is to locate the areas of
relatively high thermal gradient and within these areas the
zones of high permeability that can serve to the hot water
as paths to the surface or to shallow depths.
Carrying out the difficult tasks of geothermal exploration
needs a team of scientists and engineers of different
disciplines such as geology, geochemistry. geophysics.
drilling technology, etc. The purpose of this report is to
stress the contribution of geology, both surface mapping
and borehole logging, in geothermal exploration.
Such a wide topiC, as well as the training of the author
itself, has been chosen because his home country. Burundi,
is still at an early stage of geothermal development, and
it is thus important that he should be allowed to gather
all the informatIon on the methods used to carry out the
tasks expected from both exploration and borehole
geologists in geothermal exploration.
7
The training of the author was scheduled as follows: fl ve
weeks of introductory lecture course, one week of special
ized literature reading, three weeks of cuttlngs analysis, one week ot X-ray diffraction techniques, four weeks of
excursions, two weeks of geologIcal mappIng and one week of
training on the drill site. The rest of the time was used
on the preparation of this report. The purpose of the
excursions was to have a direct look on geological setting
of geothermal fIelds In Iceland, on the way the explora
tion has been adapted to different field conditions and on
dIfferent pOSSibIlIties of geothermal utilization.
1.2 Geological settIng of seather-mal fields
Economic aspects of geothermal utilization have led to the definition of geothermal fields as areas of anomalous concentrations of heat in rock and water at depths shallow enough to be economically extractible. As the transfer of heat to the surface is mostly by convection of steam or
water, a second condition for good geothermal system will be a permeability high enough to al l ow the extraction of
large Quantities of water or steam for a long time.
Experience from two conditions
geothermal exploration has shown that these
are usually realized in areas of young
tectonism and volcanism, primarily along active plate boundaries. Therefore, the best geothermal fields are localized i n areas of spreading ridges, SUbduction zones or intraplate melting anomalies.
Spreading ridges are zones where a new crust is created by intensive igneous intrusion and extrusion, and accordingly,
they are favourable locus for discharge of hydrothermal
fluids. The probability to find a major hydrothermal
convection system at a spreading zone has been found to be
a direct function of spreading rate (Lister. 1979). In
fact, intracontinental rifts are also the sites of young
volcanism and geothermal fields. But their low rate of extension result in a lower probability of finding major
geothermal areas than along fast-spreading oceanic ridges. Geothermal areas found in Iceland are an example in
8
association with oceanic spreading ridge while those In
Ethiopia, Kenya and Uganda are related to an Intra
continental rIft. the East African Rift.
Subduction zones are belts along which two tectonic plates
move toward each other, resulting In the consumption of the
earth's crus t by the thrustIng of one plat e beneath the
other . Melt ing of the down thrust crust produces pods of
magma that rise into the upper plate and act as heat
sources for overlying hydrothermal convection systems . An
example of such fields are those resulted from the subduc
tion of oceanic crust beneath the continental crust along
the west coast of South America.
Recent volcanism and associated geothermal fields are also
found along intraplate meltin.g anomalies as has been
observed in Hawaii and Yellows tone areas in the Un! ted
States .
The most common geothermal fields in the world are found
along orogenic belts or within intracratonic basins where
the heat flow is significantly greater than the worldwide
normal value of 1.5 hfu (1.5 heat flow units 1 . 5 E- 6
cal/cm2 sec). This high regional heat flow may orIginate
from decay reactions of radioactive elements contained in
the rocks such as uranium, thori urn, potass I urn. Another
possible origin of this heat is the exothermal processes
that accompany the consolIdation and dehydration{during
diagenesis) of rocks with increase of external load or of
depth (Shvetsov, 1975) and the heat produced by friction
along shear planes of orogenic belts . This heat is
transmi tted to the uppermost layers by convect i ve hydro -
thermal cells controlled by tectonic
of geothermal fields associated with
those found in the areas just north
features. An example
orogenic belts are
and south of the
Caucasus Mountains in the USSR , whereas the fields within
the Pannonian Basin of Hungary constitute an example of
association with intracratonic basins.
At last, low entha l py fields have been observed in regions
of normal heat flow where geothermal gradients are 20 to
40 0 C/Km.
of those
The Paris Basin is an example of this type. Some
areas of normal heat flow constitute large,
9
porous aquifers that contain water at pressures In excess
of hydrostatic. The best known fields of that type are
those In the northern part of the Gulf of Mexico Basin.
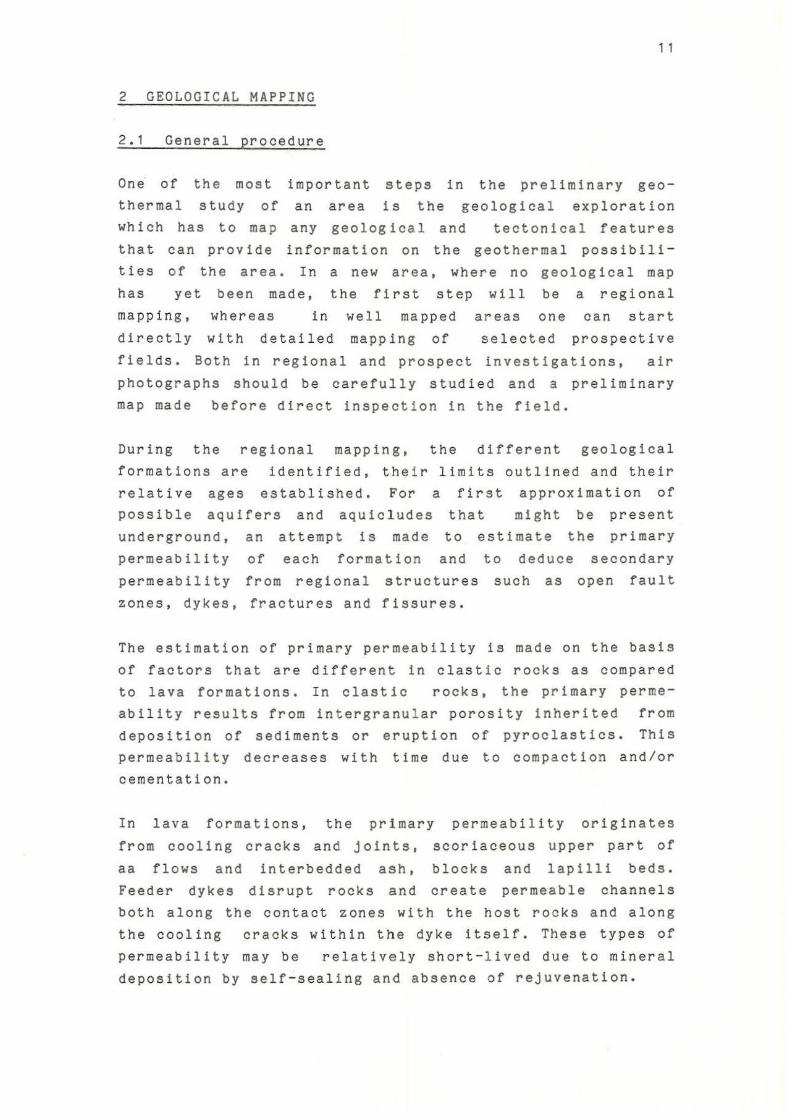
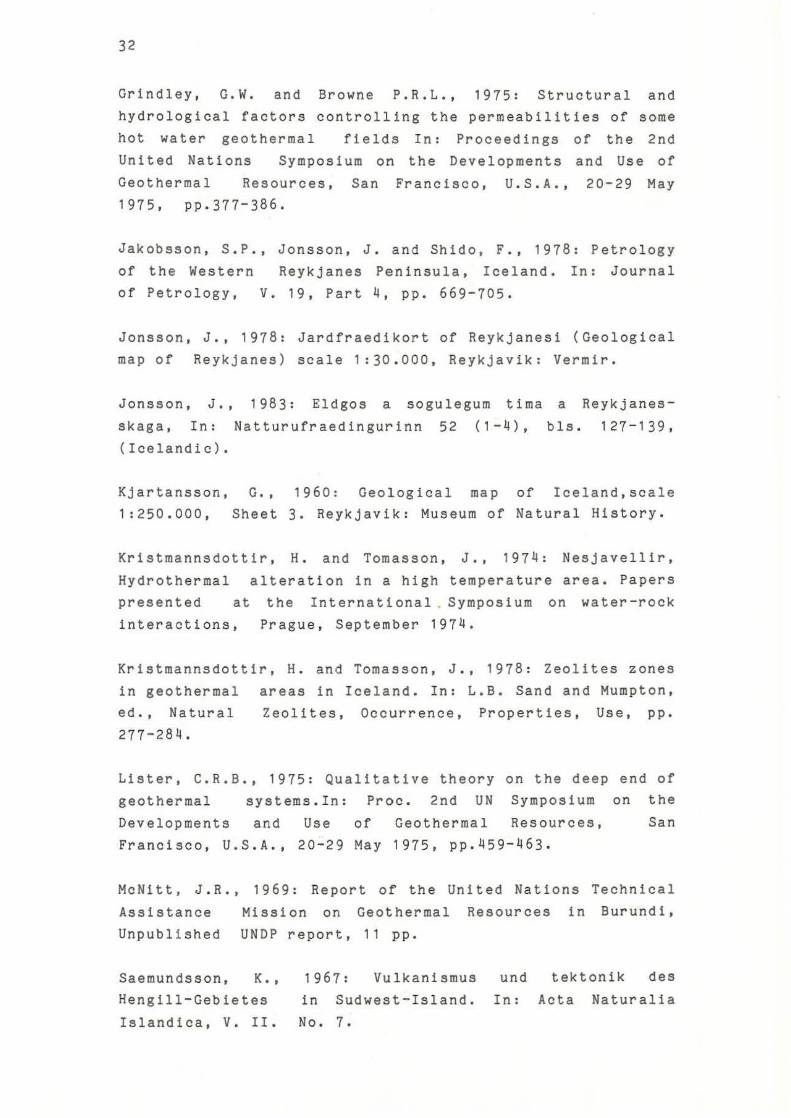
1.3 Outline of the geology of Iceland
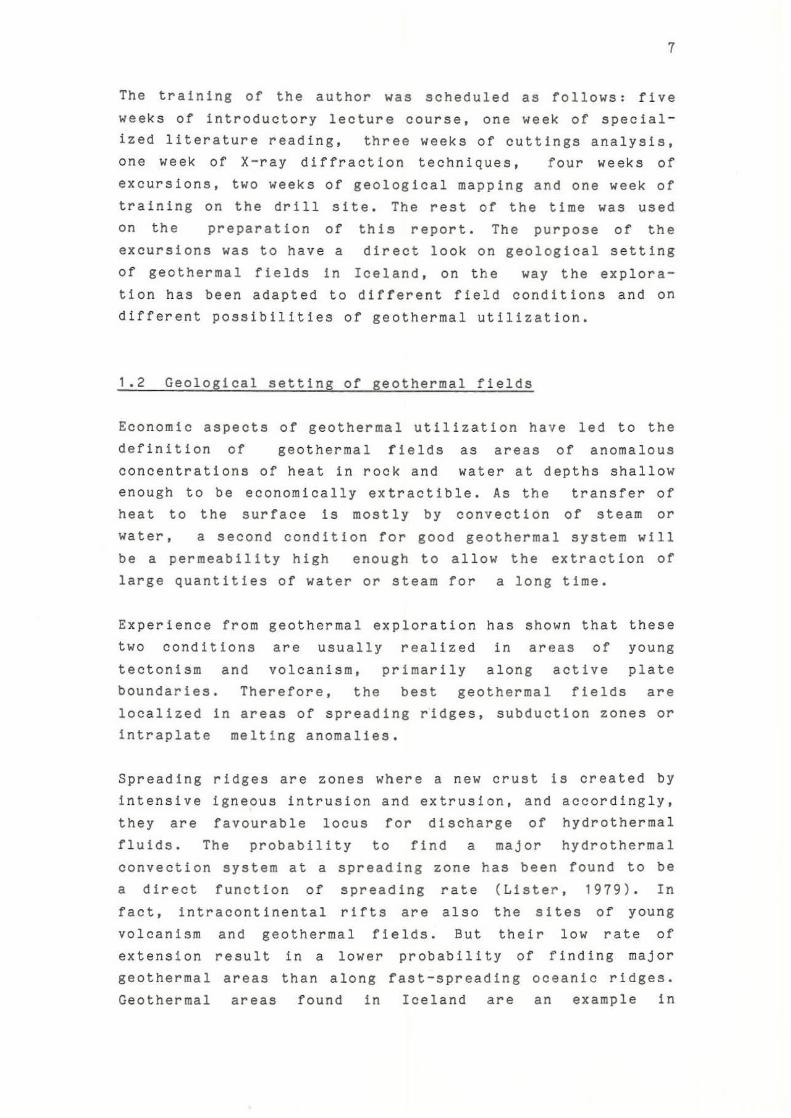
Due to the location of Iceland on the boundary of the
American and Eurasian tectonic plates, its geology Is
dominated by extensional rea turea which result In inten -
sive tectonlsm and active volcanlsm. Both central volcano
and fissure swarm eruption types are observed. The geologi
cal map shows a SW-NE zone of active volcanlsm flanked
successively by Qua t ernary and Tertiary volcanic forma
tions as the distance increases from the neovolcanlc zones
(Fig. 1). In its southern part, the neovolcanlc zone Is
shifted in two b r anches separated by Quaternary formations
(Saemundsson, 1979).
The exposed volcanic pile is predominantly built of basalts
that form 80-85 % of the total outcrops and acidic includ
ing intermediate rocks that constitute about 10 %. The
amount of volcanic sediments is in the order of 5- 10 S in a typical Tertiary pile but much higher in Quaternary rocks
due to subglacial eruptions during the ice ages.
Among the basalts. three main lava types can be distin
guished: compound flows of 0liv1ne tholeiites. s1mple flows
of 011vine poor tholeiites (littl'e or no ol1vine) and flows of plagioclase and/or pyroxene porphyr1tic basalts. A
gradat10n in the occurrence of these three types has been
observed 1n the field.
The acidic rocks are mainly lavas and intrusions (60 - 70 S), but a considerable part (30-40 S) consists of pyroclastic
material depos1ted as agglomerate in vent regions. as ash f l ow tuff sheets or as airfall tuff beds carried downwind
from the source for long distances. Some of the ash flow
sheets form marker horizons of considerable help in
geological mapping of volcanic piles.
1 0
Alkalic rocks are limited to branches of the neovolcanic
zones that are termed flank zones and are superimposed on
the tholel1te rocks that build up the lava pile. Studies
carried out on the dip of the lava pile have shown a
general trend towards the central part of Iceland. The dips increase gradually from near zero at the highest exposed
levels of the pile to about 5-10 degrees at sea level.
On the basis of climatic evidence from i nter-lava sediments or volcanic brecclas and from palaeomagnetic reversal
patterns, the volcanic pile of Iceland has been divided
into four groups which are from the youngest to the oldest:
- Postglaclal: last 9000 to 13000 years
-Upper Pleistocene: back to 0.7 million years (m.y.) ,
corresponding to the pre sent normal geomagnetlc epoch, Brunhes.
- Plio-Pleistocene: 0.7 3.1 m.y., including the Matuyama
epoch and the Gauss epoch upwards of the Mammoth event.
-Tertiary: rocks older than 3.1 m.y. and younger than 16
m.y.
The tectonic features are dominated by an intensive fracturing of the axial rift zones into fissure swarms up
to 20 Km broad and sometimes over 100 Km long . Their trend is slightly variable, but rather uniform within each branch
of the axial rift zones. The eastern branch of the neo-
volcanic zone south of Iceland has poorly developed
ex tensional features, indicating that crusta 1 spreading along the volcanic axis is there negligible and the extra
load of the volcanic edifices is compensated by isostatic subsidence on a more regional scale (Saemundsson, 1979).
The connecting segment between the Reykjanes Peninsula and
the Eastern volcanic branch has been referred to as the South-Iceland seismic zone. It has a slightly more
east-westerly trend than the branch of the neovolcan1c
zone that l1es along the Reykjanes Peninsula (Saemundsson,
1979).
1 1
2 GEOLOGICAL MAPPING
2.1 General procedure
One of the most important
thermal study of an area steps In the preliminary geo -
15 the geologIcal exploratIon
which has to map any geological and tectonical features
that can provide information on the geothermal possIbIlI
ties of the area. In a new area, where no geologIcal map
has yet been made, the first step will be a regional
mapping,
directly
whereas In
with detailed
well mapped areas one can start
mapping of selected prospective
fields. Both In regional and prospect investigations. air
photographs should be carefully studied and a preliminary
map made before direct inspect i on In the field.
During the regIonal mapping, the different geologIcal
formatIons are identified, their limits outlined and their relative ages established. For a first approximation of possible aquifers and aquicludes that might be present
underground, an attempt is made to estimate the primary
permeability of each formation and to deduce secondary permeability from regional structures such as open fault
zones, dykes, fractures and fissures.
The estimation of primary permeability is made on the basis
of factors that are different in clastic rocks as compared to lava formations. In clastic rocks, the primary permeability results from intergranu l ar porosity inherited from deposition of sediments or eruption of pyroclastics. This
permeability decreases with time due to compact ion and/or
cementation.
In lava formations, the primary permeability originates
from cooling cracks and joints, scoriaceous upper part of
aa flows and interbedded ash, blocks and lapilli beds. Feeder dykes disrupt rocks and create permeable channels
both along the contact zones with the host rocks and along the cooling cracks within the dyke itself. These types of
permeability may be relatively short - lived due to mineral deposition by self - sealing and absence of rejuvenation.
1 2
The surface manifestations, hot springs or altered areas,
are mapped with their measured temperature and samples are
taken for chemical analysis and petrographIc determination.
The geochemical interpretation of the results leads to the
estimation of possible underground temperature by the use of geothermometers.
In the laboratory, a petrographic study of thin sections Is
done to check the field identification of the rocks before the establishment of the final version of the map. The
regional geological map obtained can then be used in combination with the geochemical results for the definition
of selected small prospects that must be inspected in the
next step of detailed investIgations.
For detailed mapping of selected prospects, the procedure
used is the same as for regional mapping except that the
scale is larger. As the secondary permeability constitutes by far the most important path for the upflow of geothermal fluids, a special emphasis is is put on the mapping in
detail of every tectonic feature such as faults, dykes,
fractures and fissures. Hot springs and areas of surface
alteration are exactly marked on the map and their alignments correlated with the tectonical features observed
on the surface or inferred from regional and local
structures. Indeed, a surface manifestation may be observed
fairly far from the upflow zone due to permeability
patterns in the uppermost stratigraphic units that result in a lateral flow. Therefore, all the hot springs may not
be obviously correlated with observed local tectonic activity.
The results of detailed mapping are confined on a large
scale geological map (1/25,000 or 1120,000) which shows the
different
activity
geologic
in detail,
formations of the area, tectonic
surface manifestations and their
measured temperature as well as an estimation of the yield
of hot springs.
1 3
Combined with the results from geophysical surveys of the
prospect area, such a map will be useful for the elaboration of a preliminary geological model that Is used for an accurate siting of exploratory wells In the next step of
geothermal exploration.
2.2 Mapping of the Trolladyngja area
2.2.1 General geology of the area
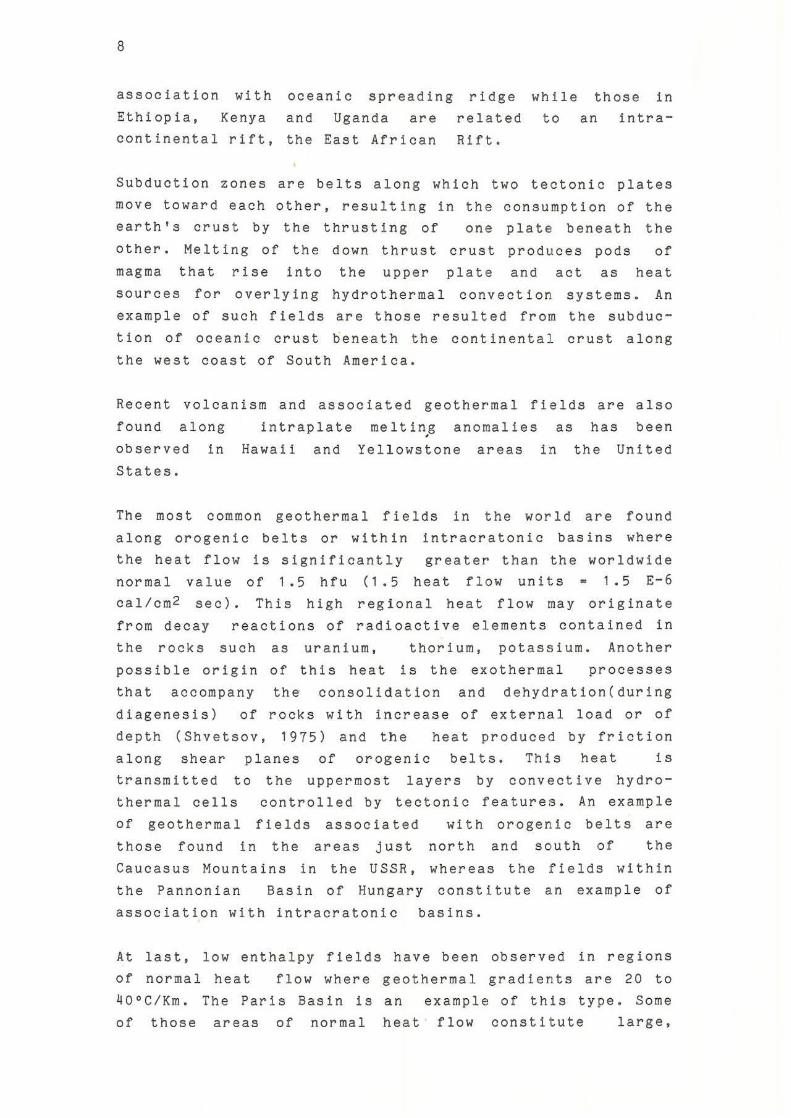
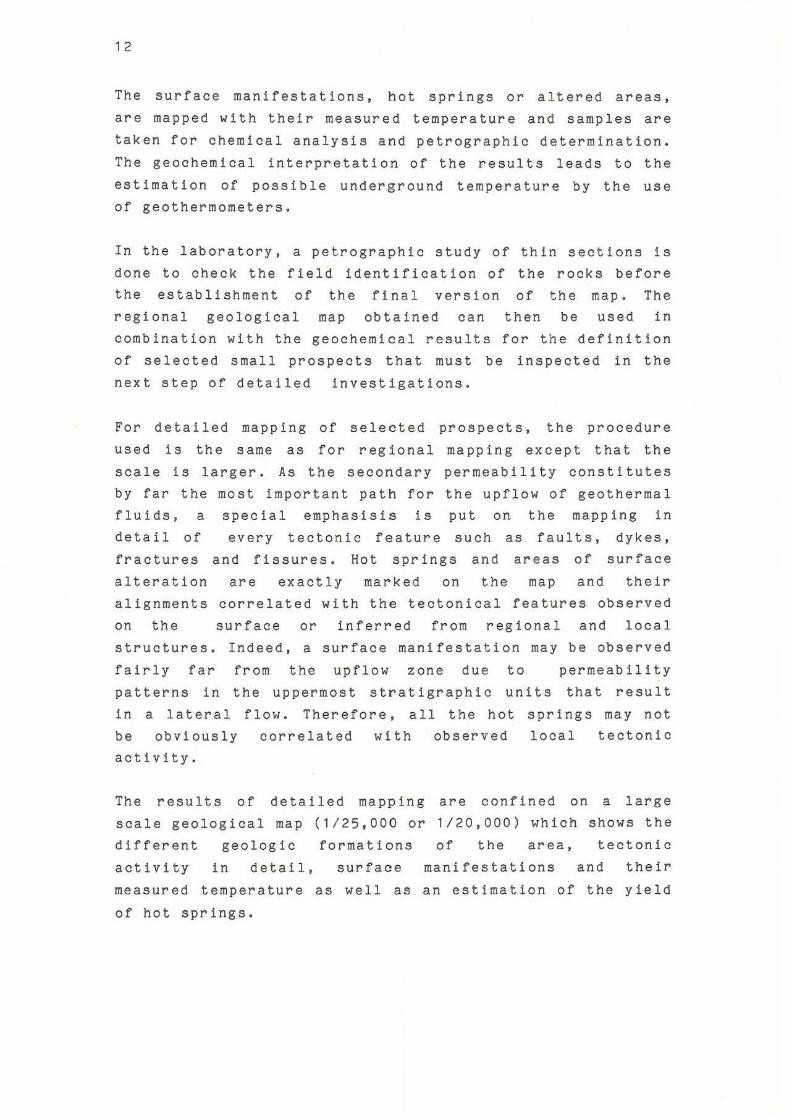
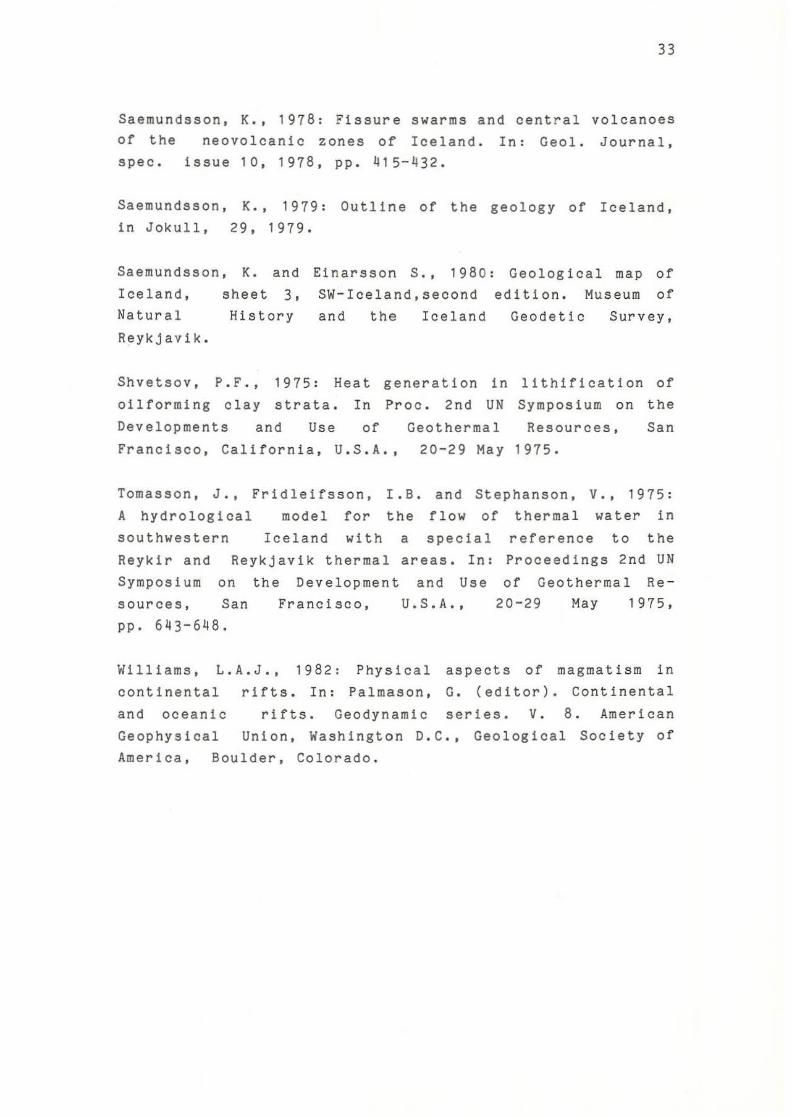
The mapped area Is located near the middle of the Krlsuvlk
fissure swarm, one of the five fissure active volcanic zone of the Reykjanes
These fissure swarms are the surface
swarms related to central volcanoes
swarms that form Peninsula ( F! g •
expressions of
that constitute
the
2) •
dyke
the
continuatIon of the HId-Atlantic Ridge across Iceland. They form en echelon arrays
the controllIng factor tha t may be
being the
dextral or
direction
sinistral,
of max imum tensional stress which is parallel to the direction of
spreading (Jakobsson et al., 1978).
The dominant structures of the fissure swarms are volcanic fissures, open non-eruptive fissures and faults. When
traced along their trend, the faults and fissures appear as
short sinuous and sometimes dendritic en echelon segments.
The active volcanic zone where plate growth is taking place
are the sites of episodic riftlng where an interplay has
been evidenced between magmatic processes in a central
volcano and rifting in the associated fissure swarm (Bj4lrnsson et aI, 1977). During the interval between two successi ve events. tensional stress accumulates which is
released during the rifting episodes. The central volcanoes
appear to play a very active role during such events by allowing the ascent of magma that collects at shallow depth in their roots. From time to time, during the rifting
episode, magma is injected from the shallow reservoir into
the fissure swarm, the controlling factor being the magma
pressure that must reach a certain level to initiate a jerk
of rifting. If the ascent of magma into the magma chamber continues beyond the widening capacity of a fissure swarm,
an eruption may eventually result (Saemundsson, 1978).
1 4
In the Reykjanes Peninsula, eruption fissures appear to
dominate the axial area of each swarm whereas the lava
shield craters, where present, lie on the periphery of the
swarm. Most of the swarms are cut by a shallow graben of
60-80 m of maximum subsidence, with an actually occurring
vertical displacement In the order of several mm per year.
BasaltiC lava flows of Holocene age (Postglac l al) are
dominant In the Reykjanes Peninsula (Kjartansson. 1960;
Jonsson, 1978) whereas vast basaltic lavas probably from
the last interglacial period have been observed on the
western part of the pen i nsula. The axis of the peninsula Is
morphologically dominated by numerous hyaloclastlte ridges
that are considered to have formed by subglacial eruptions during the last glaciation.
2 . 2.2 Field mapping
The aim of this mapping was to get an information on the risk of volcanic activity in the area and to identify the
geological and tectonic features that can enhance understanding of the geothermal reservoir and its hydraulic
links with the surface manifestations obse r ved in the area.
For a good understanding of the heat transfer conditions, an attempt has been made to reconstruct the histories of
the volcanic and the tectonic activity and to combine them to establish a single relative timescale for the area.
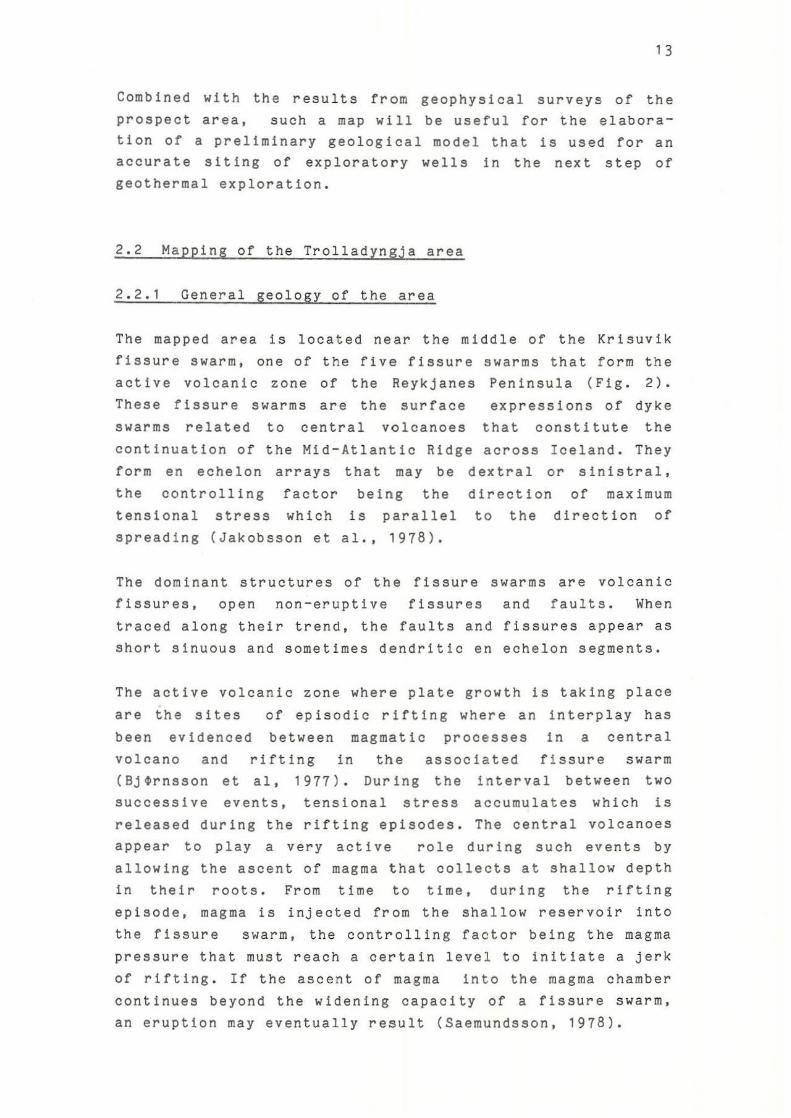
2.2.2 . 1 History of the volcanic activity
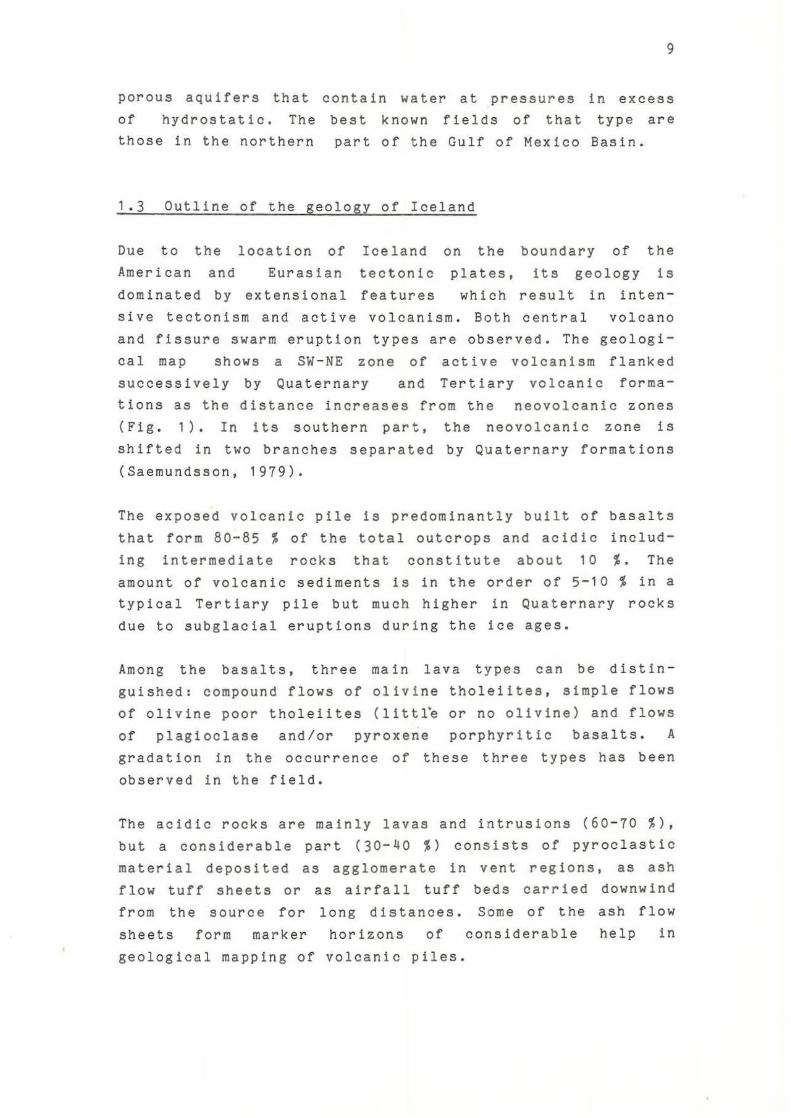
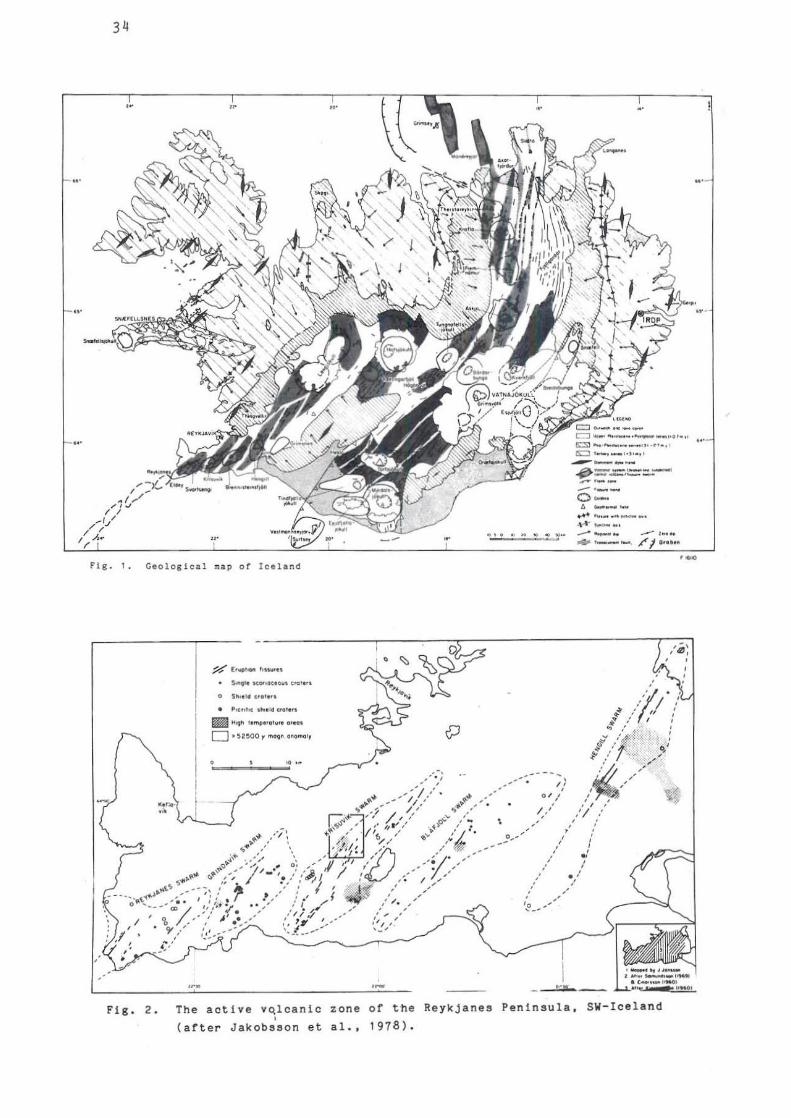
The mapping of the area led to the identification of seven
different lava flows (Fig . 3) distinguished on the basis of petrography, morphology and crater of origin. Several hyaloclastite ridges have been observed with a NE-SW
general trend whereas two areas have been found covered by
recent alluvium . A brief description of each lava flow is
given hereafter in the probable order of extrusion. The order numbers increase from the oldest to the youngest. A
brief summary on the formation of hyaloclastites Is made at
the end of this part.
1 5
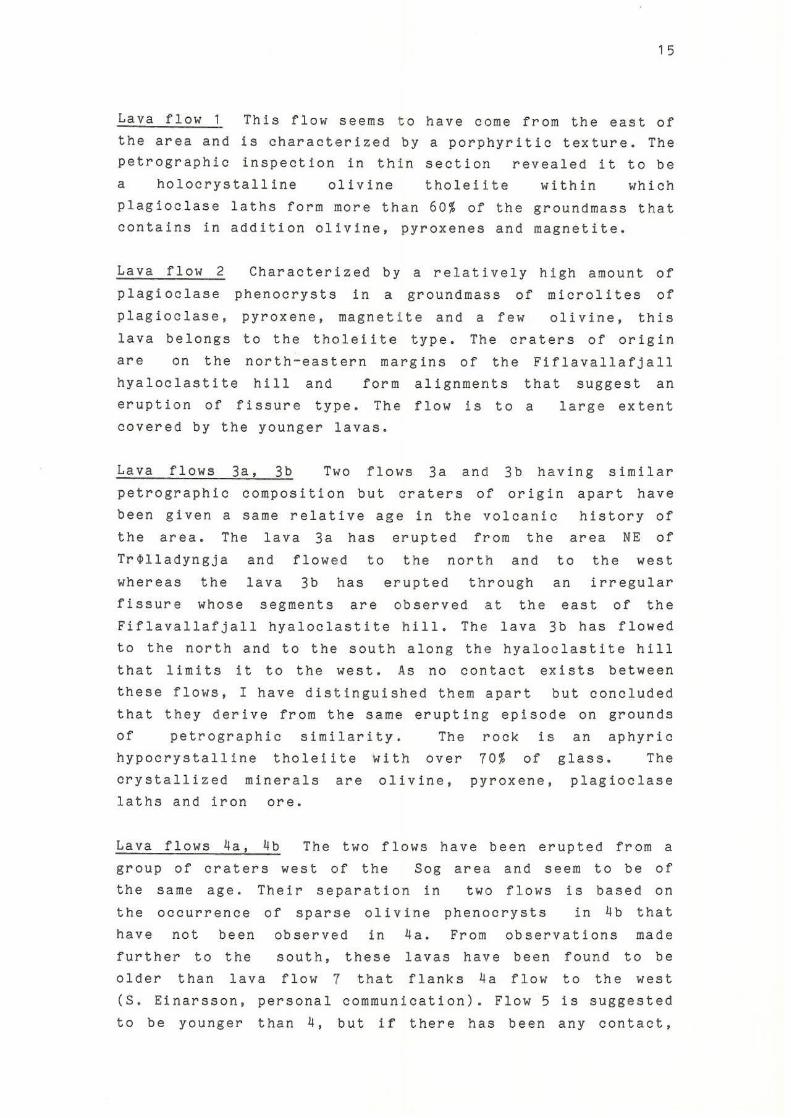
Lava flow 1 This flow seems to have come from the east of the area and Is characterized by a porphyritic texture. The petrographic inspection in thin section revealed it to be
a holocrystal1ine ollvlne tholelite within which
plagioclase laths form more than 60% of the groundmass that
contains in addition olivine, pyroxenes and magnetIte.
Lava flow 2 Characterized by a relatively high amount of
plagioclase phenocrysts in a groundmass of mlcrol1tes of
plagioclase. pyroxene, magnetIte and a few olivine, this
lava belongs to the tholel1te type. The craters of origin
are on the north-eastern margins of the Fiflavallafjall
hyaloclastlte hill and form alignments that suggest an
eruption of fissure type. The flow is to a large extent
covered by the younger lavas.
Lava flows 3a, 3b Two flows 3a and 3b having similar
petrographic composition but craters of origin apart have
been given a same relative age in the volcanic history of
the area. The lava 3a has erupted from the area NE of
Tr~lladyngja and flowed to the north and to the west
whereas the lava 3b has erupted through an irregular
fissure whose segments are observed at the east of the
Fiflavallafjall hyaloclastite hill. The lava 3b has flowed
to the north and to the south along the hyaloclastite hill
that limits it to the west. As no contact exists between
these flows, I have distinguished them apart but concluded
that they derive from the same erupting episode on grounds
of petrographic similarity. The rock is an aphyric
hypocrystalline tholeiite with over 70% of glass. The
crystallized minerals are olivine, pyroxene, plagioclase
laths and iron ore.
Lava flows 4a, 4b The two flows have been erupted from a
group of craters west of the Sog area and seem to be of
the same age. Their separation in two flows is based on
the occurrence of sparse olivine phenocrysts in 4b that
have not been observed in 4a. From observations made
further to the south, these lavas have been found to be
older than lava flow 7 that flanks !la flow to the west
(S. Einarsson. personal communication). Flow 5 is suggested
to be younger than !l, but if there has been any contact,
1 6
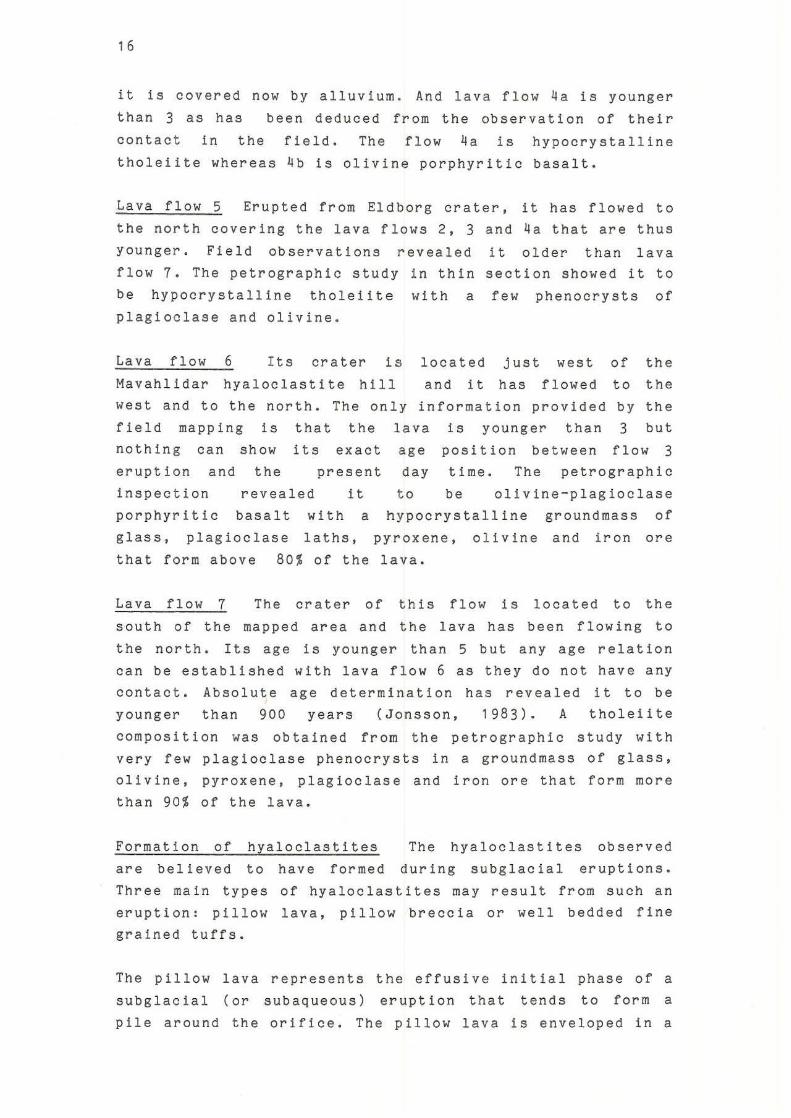
it Is covered now by alluvium. And lava flow 4a Is younger
than 3 as has been deduced from the observation of their
contact in the field. The flow 4a Is hypocrystalllne
tholeilte whereas 4b Is olivine porphyritlc basalt.
Lava flow 5 Erupted from Eldborg crater, it has flowed to
the north covering the lava flows 2, 3 and 4a that are thus
younger. Field observatIons revealed it older than lava
flow 7. The petrographIc study in thin section showed it to
be hypocrystalllne tholelite with a few phenocrysts of
plagioclase and olivine.
Lava flow 6 Its crater is
Mavahlldar hyaloclastlte hill
located just west of the
and it has flowed to the
west and to the north. The only information provided by the
field mapping Is that the lava is younger than 3 but
nothing can show its exact
eruption and the present
age
day
pOSition between flow 3
time. The petrographic
inspection revealed it to be olivine-plagioclase
porphyritic basalt with a hypocrystalline groundmass of
glass. plagioclase laths. pyroxene, o l ivine and iron ore
that form above 80% of the lava.
Lava flow 7 The crater of this flow is located to the
south of the mapped area and the lava has been flowing to
the north. Its age is younger than 5 but any age relation
can be established with lava flow 6 as they do not have any
contact. Absolute age determination has revealed it to be
younger than 900 years (Jonsson, 1983). A tholeiite
composition was obtained from the petrographic study with
very few plagioclase phenocrysts in a groundmass of glass,
olivine, pyroxene, plagioclase and iron ore that form more
than 90% of the lava.
Formation of hyaloclastites The hyaloclastites observed
are believed to have formed during subglacial eruptions.
Three main types of hyaloclastites may result from such an
eruption : pillow lava, pillow breccia or well bedded fine
grained tuffs .
The pillow lava represents the effusive initial phase of a
subglacial (or subaqueous) eruption that tends to form a
pile around the orifice . The pillow lava is enveloped in a
1 7
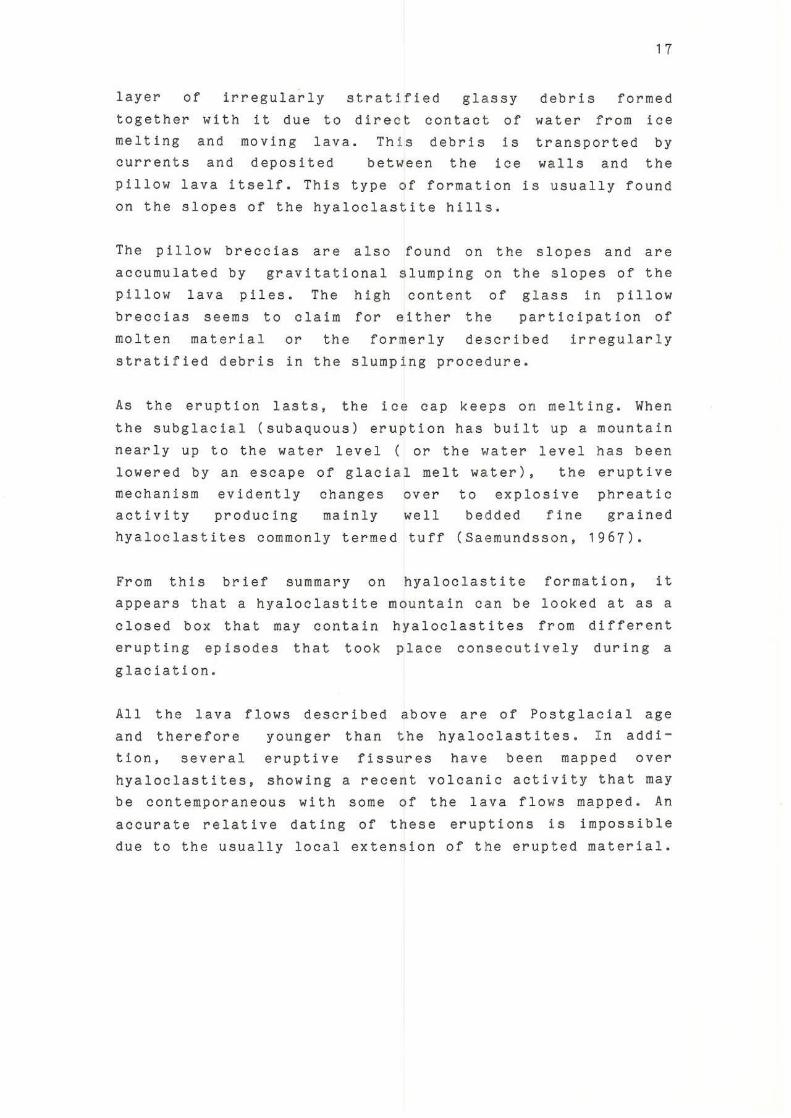
layer of irregularly stratified glassy debris formed together
melting wi th it due to direct
and moving lava. Th i s
contact
debris
of
is
water from
transported
ice
by
currents and deposited between the ice walls and the
pillow lava itself. This type of formation Is usually found
on the slopes of the hyaloclastite hills.
The pillow brecclas are also found on the slopes and are
accumulated by gravitational pillow lava piles. The high
breccias seems to claim for
slumping on the slopes of the
content of glass in pillow
either the participation of
molten material or the formerly described irregularly
stratified debris in the slumping procedure.
As the eruption lasts, the ice cap keeps on melting. When
the subglaclal (subaquous) eruption has built up a mountain
nearly up to the water level ( or the water level has been lowered by an escape of glacial melt water), the eruptive
mechanism evidently changes over to explosive phreatic activity producing mainly well bedded fine grained
hyaloclastites commonly termed tuff (Saemundsson, 1967).
From this brief summary on hyaloclastite formation, it
appears that a hyaloclastite mo untain can be looked at as a
closed box that may contain hyaloclastites from different
erupting episodes that took place consecutively during a
glaciation.
All the lava flows described above are of Postglacial age
and therefore younger than the hyaloclastites. In addi-
tion. several eruptive fissures have been mapped over
hyaloclastites, showing a recent volcanic activity that may
be contemporaneous with some of the lava flows mapped . An
accurate relative dating of these eruptions is impossible
due to the usually local extension of the erupted material .
1 8
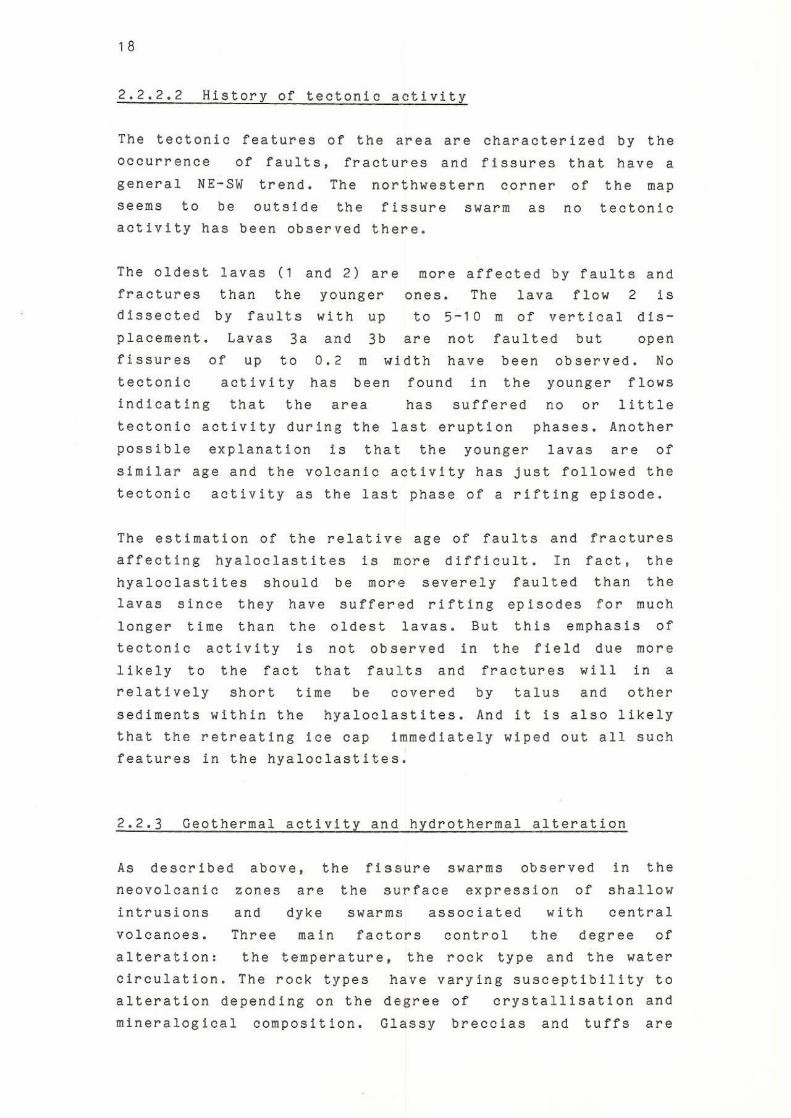
2.2.2.2 History of tectonic activity
The tectonic features of the area are characterized by the occurrence of faults, fractures and fissures that have a
general NE-SW trend. The northwestern corner of the map
seems to be outside the fissure swarm as no tectonic activity has been observed there.
The oldest lavas ( 1 and 2 ) ar e more affected by faults and fractures than the younger ones. The lava flow 2 is dissected by faults with up to 5 -1 0 m of vertical dis-
placement. Lavas 3a and 3b are not faulted but open fissures of up to 0.2 m width have been observed. No
tectonic actIvity has been found in the younger flows
indicating tha t the area has suffered no or little
tectonic actIvIty during the last eruption phases. Another
possible explanatIon Is that the younger lavas are of
similar age and the volcanic activity has just followed the
tectonic activity as the last phase of a rifting episode.
The estimation of the relative age of faults affecting hyaloclastites is more difficult.
and
In fractures
fact, than
the the hyaloclastites should
lavas since they have
longer time than tectonic activity
the
is
be more severely faulted suffered rifting episodes for much
oldest lavas. But this emphasis of
not observed in the field due more likely to the fact that fau l ts and fractures will in a
relatively short time be covered by talus and other
sediments within the hyaloclastites. And it is also likely
that the retreating ice cap immediately wiped out all such features in the hyaloclastites.
2.2.3 Geothermal activity and hydrothermal alteration
As described above, the fissure swarms observed in the
neovolcanic zones are the surface expression of shallow
intrusions
volcanoes . and dyke swarms
Three main factors
associated
control
with central
the degree of alteration: the temperature, the rock type and the water
Circulation. The rock types have varying susceptibility to alteration depending on the degree of crysta l lisation and
mineralogical composition. Glassy breccias and tuffs are
1 9
the most easily altered rocks, whereas holocrystalllne dense basalts are much more resistent. A gradatIon in the alteration state Is observed In the field. The glass
becomes f I rst hydrated and oxidized and the colour of the
rock turns to brownish to yellow or orange, leading to a
typical alteration termed palagonltlzatlon In specialized
literature. Where the rock Is heavily altered, the glass
Is completely replaced by clay minerals. Olivine Is the
first mineral to alter, first to Iddlngsitlc aggregates and later it Is completely replaced by clay mInerals. Pyroxene
Is also altered to clay minerals, but this alteration Is
rare l y completed. The plagloclase is nearly unaffected by
alteration (Kristmannsdottir et al., 1974). Such surface alteration was observed around the Eldborg crater and the Sog craters zone.
Hot springs · were also found associated with the propylitized areas with a maximum outlet temperature of
83°C. The highest temperature measured within an altered
zone was 97°C on the Lambafell hyaloclastite.
The geothermal act i vity and associated hydrothermal
alteration seem to be controlled by a major fault that runs through the Sog crater zone, the Eldborg crater and the
Lambafell hyaloclastite after which a lateral shift of the
fault to the east is observed but still keeping the same
general trend as to the south .
The X- Ray Diffraction analysis of two samples of clays from
the propylitized surface on Trtlladyngja and Lambafell
hyaloclastite mountains respectively showed that
Trtlladyngja clays were of vermiculite - illite mixed layer group whereas Lambafell clays were of serpentine-kaolin
group. But for both samples, no peak was observed after
heating up to 550 - 60QoC, which seems exceptional for those types of clays.
20
3 BOREHOLE GEOLOGY
3.1 Contribution to geothermal system model l ing
After the geothermal reservoir has been broadly outlined by geological and geophysical exploration on the surface. the
next step is the study of the subsurface structure espe-
c1ally as it affects the permeabilIty. For this purpose,
explo r atory wells will be drilled. The decision where to
drill must be based on locatIng
permeability prefe r ably as close as
adequate secondary
possible to upflow
zones. And even where the primary permeabIlIty Is present.
the best places to drjll will be where secondary
permeability may also be inferred.
The main information expected from a well are the location
and yield of aquifers as well as their physical parameters such as temperature and pressure that control their dynamics. Location of aquifers and evaluation of their
yield and geological affinities are tasks of a borehole
geologist whereas a borehole geophysicist will be responsi
ble for physical properties measurements and interpreta
tion. This part of the report deals with the tasks of a borehole geologist as a contribution to the understanding
of a geothermal system. Three sections are deve l oped: drill site duties. laboratory work and geological
modelling.
3.1.1 Drill site duty
Simultaneously with drilling. an analysis of the cuttings is done and a preliminary stratigraphic section constructed
with beside it a graph of mean penetration rate against depth. All information on the proceeding of the drilling
are recorded. These include the penetration rate. the load pressure of the drillstring, the dimensions of the hole,
drillpipes and casings, the quantity of circulation water, the location of aquifers and probably the temperature of the water in the aquifers, diameter and inclination
measurements.
21
From cuttlngs analysis, the exact location of aquifers is
done on evidences such as the petrographic type, the degree of alteration and/or the density of fracturing of the rock. A gain or loss of
drilling may be In that way
circulation recorded during
exactly correlated with the
stratlgraphic section. This data may be very helpful as to
determine the optimal depth of the end of a casing that
must be in hard solid rock and to cement all unwanted
aquifers (e.g.cold aquifers). Therefore. the drilling crew
expects advice from the geolo g ist in matters depending on
geology and stratigraphy.
The identification of hydrothermal mineral assemblages In
cuttlngs or cores will provide information on the range of
temperature and permeability that can be expected downhole.
After drilling, the drill site geologist in some cases performs with the project hydrogeologist the completion
tests of the wells consisting of a permeability assesment
by pumping with compressed air . stimulation with injection
packer, multiple step injection tests , etc. The purpose of these tests is to evaluate the maximum flow rate of the
well, to estimate the drawdown during production and the
bulk permeability of the field. The effects of the tests
on other wells in the surroundings are recorded
contemporaneously.
3.1 . 2 Laboratory work
As the sample boxes are marked by the drillers with the time of collection and the corresponding depth reached, the first task of the drill site geologist is to correct the
sample depth using the penetra t ion rate, the mean settling
velocity of the cuttings, the depth reached and the time
of collection . A petrographic study of t h in sections prepared from cuttings is carr i ed out and the results used
to make the final version of the stratigraphic section of
the well . The dimensions of the hole and casings are marked on the same drawing as well as the load pressure of the
drillstring, location and yield of the aquIfers , penetra-
22
ticn rate and the geophysIcal leggings. The identIfication of alteration minerals Is also completed by the use of both
thin sections inspection and X- Ray dIffraction techniques.
Simultaneously with this work, a geochemlcal study may be
carried out of fluid and host rock compositions. their
interactions and the stability ranges of the alteration
minerals observed during the petrographic study.
3.1.3 Geological modelling
The combination of all the information provided by the
stratI graphIc sections of all the exploratory wells and the different parameters recorded beside them with the results
of geochemical and geophysical interpretation are used to
refine the working geological model derived from the
surface regional and prospect
model is constructed taking
surveys. A new
in to account
geological
subsurface
conditions of temperature and permeability. This model can
then be used in the construction of a general model of the
geothermal area.
3.2 Well HS-17 in Grafarvogur
3.2.1 Location, objective and available data
The well HS-17 is a shallow (282 m) thermal gradient well
drilled in the Reykjavik low temperature area. As the
objective of a gradient well is the study of the
conductive heat flow, the siting of such a well is done in
such a way that no aquifer is encountered. Therefore, the
only available data from the well are information on the
penetration rate, differential measurements of temperature
and drill cuttings.
3.2.2 Stratigraphy
The samples of cuttings are collected in 100 ml boxes at
every second meter of penetration. The sample boxes are
marked with the time of collection and the depth reached.
23
This de pt Is directly read on the geolograph when the latter Is available (big drl11rig In Iceland). or calcu
lated from the length of the drl11strlng already sunk into the hole.
At 100 m interval, bigger samples are taken In 1 - 3 1 boxes
for chemical analysis and mineral separation. as the
normal size samples are too small for that purpose. When
drillIng In new areas, the larger samples are taken at
randomly chosen depths whereas In well-known areas. the
sample depths are chosen from the stratlgraphlc sections of
previous drl11holes.
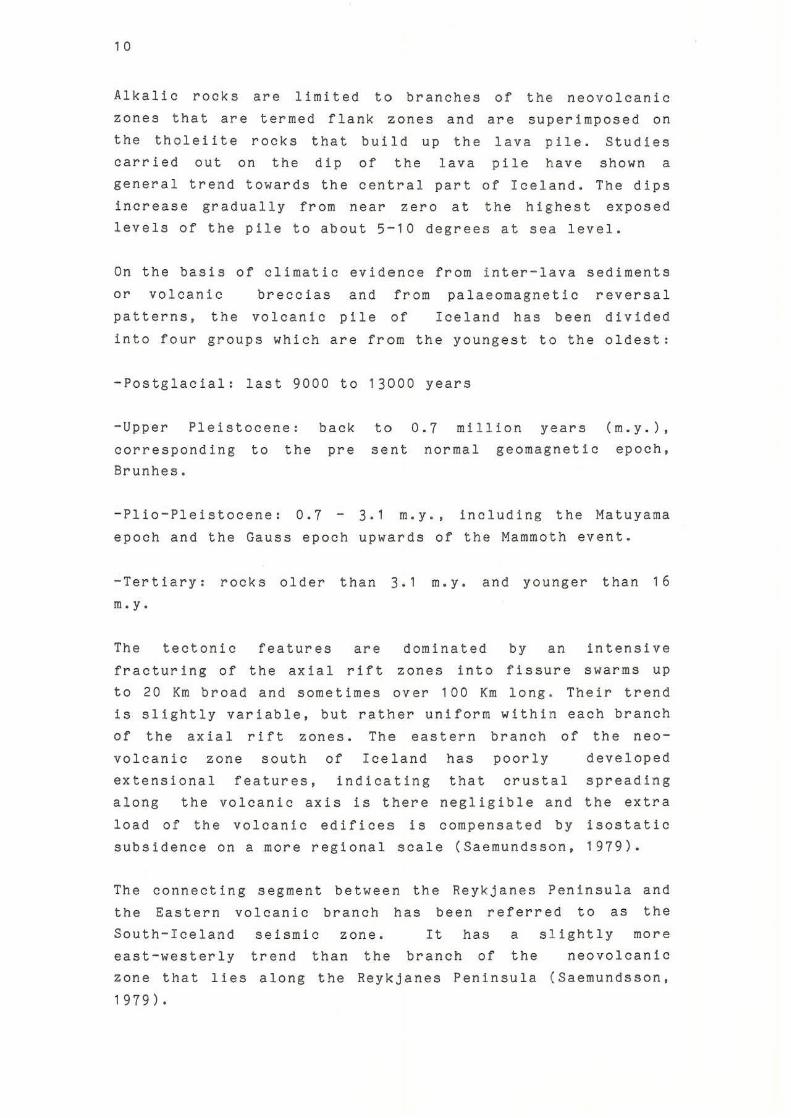
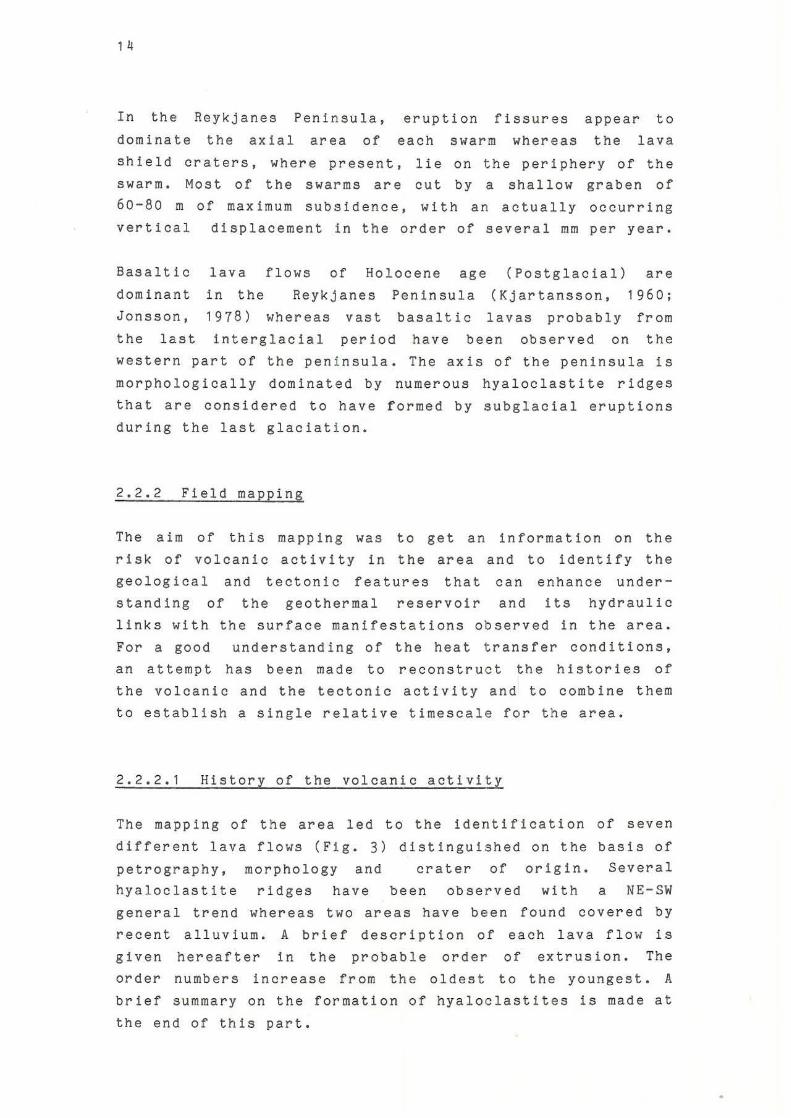
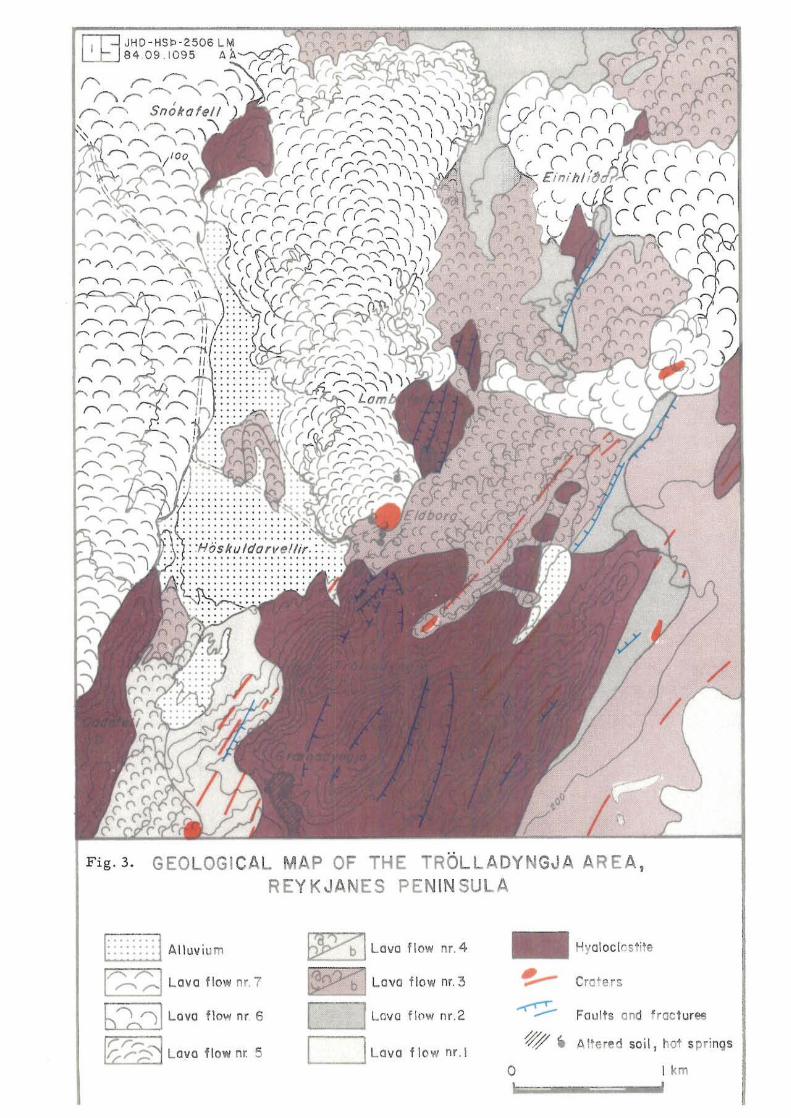
The stratlgraphlc section constructed from the binocular
inspection of drl11cuttlngs and thin sections study of
selected samples Is shown In Fig. lj with beside it a
drawIng of the penetration rate. The latter does not show
any e v ident correlation with the stratigraphy due most
likely to the fact that the penetration rate is not
accurate enough as it is the calculated mean for drilling a
depth equal to the length of one drillpipe. Seven rock
formations have been distinguished on the basis of
petrography and alteration. Each formation will be briefly
described below.
ClastiC sediments <0-12 m): This layer isformed by badly
sorted detrital sediments where the coarse fragments are
finely to intermediately crystalline basalts and the finer
grained matrix is of tuffaceous composition. The proportion
of the tuff seems to increase with depth and is at a
maximum between 8 and 10 m where the tuff constitutes more
than 90," of the cuttings. The lower part of the layer is
slightly oxidized. The sediments are fresh and alteration
minerals rare.
formation Is characterized by fresh finely crystalline tholeiite lavas.
Thirteen different lava flows have been identified by using
the stratification usually observed within a single lava
flow, l.e. the upper part Is often glassy to very fine
grained, highly vesicular and sometimes red due to oxida
tion, whereas the lower part is coarse, darker and more
dense. Within each lava flOW, numerous almost completely
24
ftlled vesicles were observed In the upper part whereas a
few, usually empty vesicles characterize the lower part.
The degree of fracturing Is very low as deduced from the
amount of fragments consisting of single alteration
minerals. The amygdale minerals observed were chabazlte. scolecite and clays.
Basalt-rich breccia (108-114 m) : This layer is composed of almost equal proportions of glass and fInely crystalline
tholel1te. The porosity is characterized by numerous vesicles, mostly empty, but the degree of fracturing Is
very low. The rock Is re l atively fresh.
Detrital tuff (114-118 rn), The petrographic inspection of cuttings shows a few finely to intermediate!y crystallized
basaltic fragments embedded in a groundmass of tuff which
forms over 90% of the whole rock. The tuff is slightly
oxidized but no alteration minerals have been obseved.
This layer is indicative of an erosional episode during an
interglacial period.
Tholeiite formation 11 (118-158 m): This series is formed
by six lava flows of g l assy to crystalline tholelite.
Vesicles are few and half-filled by secondary minerals such
as chabazite, scolecite/mesolite , iron ores and clays. The
degree of fracturing is relatively low and the primary
constituents of the rock are fresh to weakly altered.
Altered olivine tholeiite series (158 - 264 m): The upper
boundary of this series ls found at 158 m whereas the lower
boundary is arbitrarily put at 264 m where the alteration
state of the primary constituents of the rock decreases
considerably. Eleven lava flows have be~n distInguished
formed by finely crystallIne olivine tholeiite. The
petrographic texture seems not to be homogeneous as some
fragments in the cuttings from 188 m have been identified
as olivine - plagioclase porphyritic. The flows display
numerous vesicles half-filled by secondary minerals. The
degree of fracturing is high as well as the alteration of
the rock as deduced from the alteration of olivine and
plagioclase. Chabazlte, mesolite/scolecite, stilblte/-
25
heulandlte and clays have been observed In cuttings and
thin sections. Three thin sediment layers intersect thIs
basaltic profile.
Slightly altered ollvine tholel1te series (264-282 m): The
upper boundary of this layer has been arbitrarily fixed at
264 m on the basis of the alteration state of the rock
whereas the lower boundary Is tentatIvely put at the
bottom of the well. Three lava flows were IdentIfIed. The
cuttlngs are composed of finely to Intermedlately crystal -
line ollvlne tho!eilte fragments which show numerous
vesicles In the upper part of the flows. These vesicles are
half - fIlled by zeolites and clay minerals that have been
identified by the study of thin sections as chabazlte.
mesolite, stllbite/heulandite and clays. The degree of fracturing of the rock is low and the alteration state of
the primary constituents relatively weak.
3.2.3 Alteration
In order to confirm and complete the identification of
secondary minerals in the well, several XRD analysis were
carried out. For that purpose. amygdale minerals were handpicked from cuttings and clay samples prepared from
selected depths. The amygdale samples were taken at depths
where a particularly high amount of zeolites was observed
(166 m, 180 m. 214 m. 236 m). whereas the clay samples were prepared from cuttings from basalt-rich breccia.
detrital tuff and olivine tholeiite layers where an
alteration leading to clay formation could be expected from
the relatively higher permeability. A brief description of the preparation of a clay sample is given in Appendix I.
As shown in Table 1 .the results of XRD analysis confirm and sometimes complete the petrographic study showing the following secondary minerals: chabazite. mesolite/
scolecite, calcite and clays. The 236 m amygdale sample
showed some peaks that have not been well identified and belong probably to the zeolites epistilbite and wairakite/
analcite. The XRD identification of clay samples showed
that all of them were smectites.
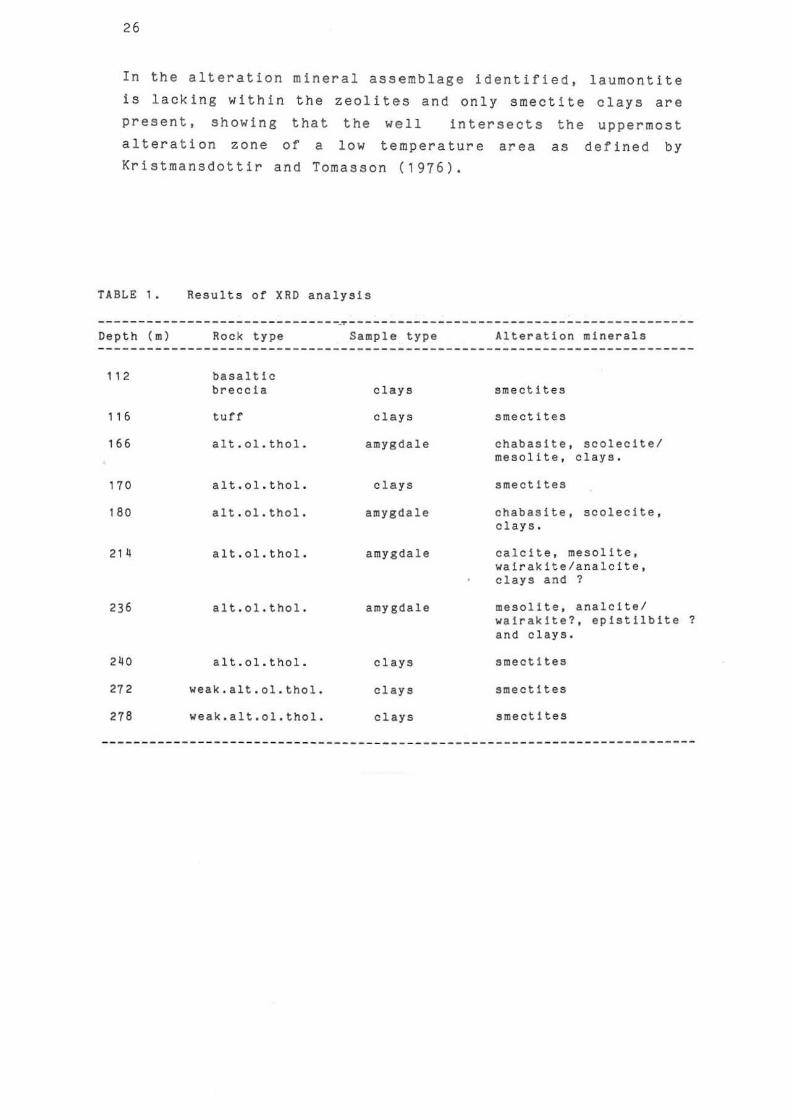
26
In the alteration mineral assemblage identified, Is lacking within the zeolites and only smectite
present, showing that the well intersects the
alteration zone of a low temperature area as
Kristmansdottlr and Tomasson (1976).
laumontlte
clays are
uppermost
def ined by
TABLE 1. Results of XRD analysis
-- - -- - - - - - - - - - - - - - - - - - - - - - - - - - . 't" - - - - - - - _ - - _ - - - - - _ - - - - _ - _ -_ - - - - - - - - - - - - - - - --
Depth (m) Rock type
112 basalt le breccla
116 tuff
166 alt. 01. the!.
170 alt.ol.thel.
180 alt. 01. thel.
214 alt.cl.thal.
236 alt.ol.thol.
240 alt.ol.thol.
272 weak.a1t.ol.thOl.
278 weak.a1t.ol.thol.
Sample type
clays
clays
amygdale
clays
amygdale
amygdale
amygdale
clays
cl ays
clays
Alteration minerals
smectltes
smectltes
chabaslte, scolecltel mesollte, clays.
smectltes
chabaslte, scoleclte, clays.
calcite, mesollte, walraklte/analcite, clays and ?
mesollte, analoitel wairaklte?, eplstl1blte ? and olays.
smeotites
smectites
smectltes
27
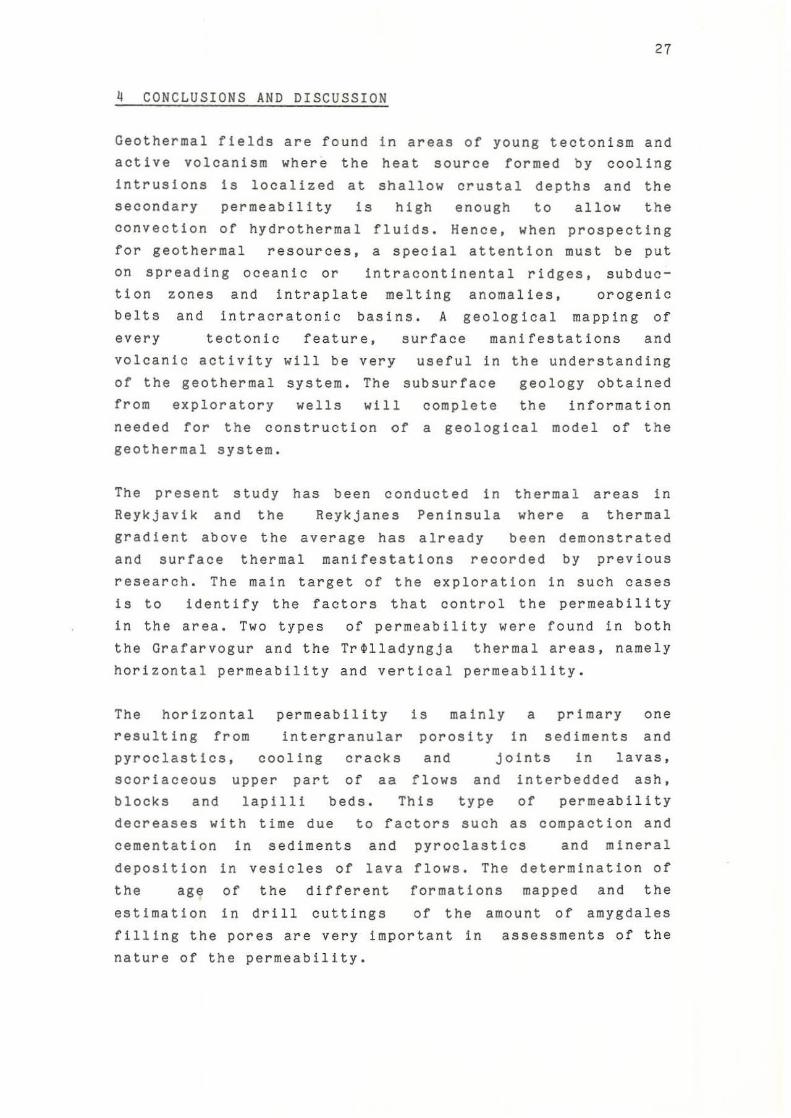
4 CONCLUSIONS AND DISCUSSION
Geothermal fIelds are found in areas of young tectonlsm and active volcanlsm where the heat source formed by coolIng
intruSions Is localized at shallow crusta! depths and the
secondary permeabIlity Is high enough to allow the
convection of hydrothermal fluids. Hence, when prospectIng
for geothermal resources, a specIal attention must be put
on spreading oceanic or intracontlnental ridges, subduc
tion zones and Intraplate melting anomalies. orogenic belts and intracratonic bas i ns. A geologIcal mapping of
every tectonic feature I surface manifestations and
volcanic activity will be very useful In
of the geothermal system. The subsurface
from exploratory wells will complete
the understanding geology obtained
the information needed for the constructIon of a geologIcal model of the
geothermal system.
The present study has been conducted In thermal areas In Reykjavik and the Reykjanes PenInsula where a thermal
gradient above the average has already been demonstrated and surface thermal manifestatIons recorded by prevIous
research. The main target of the exploration In such cases
is to identIfy the factors that control the permeabilIty
In the area. Two types of permeability were found in both
the Grafarvogur and the Tr~lladyngja thermal areas, namely
horizontal permeability and vertical permeabIlity.
The horizontal permeabIlIty is mainly a prImary one
result ing from pyroclastIcs,
intergranular porosity In sediments and
scorIaceous blocks and
cooling cracks and joInts In lavas o
upper part of lap!llI beds.
aa flows and This type
in terbedded ash, of permeability
decreases with time due to factors such as compact ion and
cementation In sedIments and pyroclastIcs and mineral
deposition in vesIcles of lava flows. The determination of the age of the different formations mapped and the
estimation in drill cuttings of the amount of amygdales
fIlling the pores are very important in assessments of the
nature of the permeability.
28
The vertical permeabIlity which Is by far the most Impor-
tant path for the upflow of geothermal fluids is related
to tectonic features such as faults, contact zones between dykes and host rocks, fractures and fissures. When mapping
for geothermal exploration, these features will require a
special attention of the geologist and an attempt will be
made to correlate them with the surface manifestations
observed In the area In order to understand the upflow of
hydrothermal fluids. During the binocular inspection and
the petrographic study of rock cuttlngs,
permeability is estimated on the evidence
fracturing as deduced from the amount of consisting of single alteration minerals.
the vertical
of degree of
fragments
At last, a correlation on cross-sections of several
strati graphic sections of exploratory wells with data from
surface mapping may give complementary information on
permeability due to buried faults, dykes and fractures.
As the home country of the author intends to start a
geothermal exploration in the foreseeable future, a brief
discussion
geological Burund i.
is made below on a tentative programme of
exploration of the geothermal resources of
The geothermal manifestations in Burundi are hot springs or warm water pools where the highest temperature recorded is
68 G e at Ruhwa spring (Mc Nitt 1969, Deelstra et al. 1972,
Edeline et al. 1981, Armannsson et al. 1983). No record
exists of surface steam or mud pools. These hot springs
are associated with the western branch of the East African Rift that runs from Turkey to Mozambique and includes the Dead Sea, the Red Sea, the Gulf of Aden and crosses East
Africa from Ethiopia to Mozambique. The Burundian coast of Lake TanganyIka and the Rusizi Valley belong to that rift.
The formation of the rift Is of Tertiary age whereas the
geological formations crossed by the rift are Proterozoic.
The rift is still active as numerous active volcanoes have
been recorded further to the north, e. g. in Zaire and
Rwanda (Fairhead et al. 1982, Williams 1982, Barberi et a1. 1982). The graben of the western Rift Valley is filled
29
by young sedlments that can rorm a good geothermal reservoir whereas the Precambrian rocks are considered very poor 1n this respect.
The most promising gethermal fields of BUr'undi are expected to be in the northwest on the edge of the Tshlblnde
volcanic region south of Lake Kivu. The highest tempera
ture recorded in Burundl was found 1n sedlments covering
the Rift Valley in that area. Therefore. the geothermal
exploration of Burundl should be concentrated on this
region and should cover the whole Tshibinde volcanic zone
that extends to Zaire and Rwanda. An anomalously high
geothermal gradient may be expected there as a result of
dyke swarms and intrusions associated with central
volcanoes recorded further to the north and cooling at
relatively shallow depths. Therefore. the exploration of
the area should start with a detailed geological mapping of
the Tshibinde volcanic zone where geological formations.
folds.
detail.
faults. fractures and fissures would be mapped
An attempt should also be made to establish
1n
a
relative timescale for tectonic and volcanic activities and
to correlate them with the geothermal manifestations. The
data would then be
geothermal system
confined in a geological model of the
that shows possible heat sources.
reservoir rock. cap rock, possible up flow zones and
different aquifers.

30
ACKNOWLEDGEMENTS
The author wishes to express his thanks to the United
Nations UnIversity for having awarded him a
attend this course. Thanks are also due
Geothermal Training Programme under the
fellowship to
to the 1984
direction of
Dr. Ingvar SIrgir Fridlelfsson for an excellent organiza
tion of the course. Special thanks go to Dr. Arny
E. Sveinbjornsdottlr,Slgmundur Elnarsson and Dr. Hjaltl
Franzson for their enrichIng guidance, constructive
criticisms and suggestIons In the preparation of this
report.
The author thanks also all the lecturers In the training
and all the people of Orkustofnun for their comprehension
and steady assistance.
31
REFERENCES
Armannsson,H. and Gls1ason,G. ,1983: Geothermal resources of
Burundl. Report OS-83025/JHD-06 on a reconnaissance
mission, Reykjavik.
Barber l ,F., Santocroce,R. and Varet, J. t 1982: Chemical
aspects of rift magmatlsm. In: Palmason,G. (editor).
Continental and oceanic rIfts, Geodynamlcs Series. V. 8.
American Geophysical UnIon, Washington D. C. Geological
Society of America. Boulder, Colorado.
Bjarnsson, A., Saemundsson, K., Elnarsson, P" Tryggvason,
E., and Gr$nvold, Ko, 1977: Current riftlng episode In
North I celand. In: Nature, London 266. pp.318-323.
Bjornsson. S .• 1984: The plann i ng of geothermal projects,
Introductory lecture course, UNU Geothermal training Programme, Iceland.
Deelstra, H., Katihabwa, J. and Waleffe, A., 1972: Les
sources thermo-minerales du Burundi. Bull. de la Soc. Belge
d'Etudes Geographiques. Tome XLI No. 2, pp. 233 - 254.
Edeline, F., Fatticioni, M.H., de Morchin, P. and Hissel,
J., 1981: Etude des eaux thermales du Burundi. Cebedeau
ASBL, Etude 80/115, 47 pp.
Fairhead, J.D. and Stuart, G.W., 1982: The seismicity of
the East African Rift System and comparison wi th other
Continental Rifts. In: Palmason, G. editor), Continental
and Oceanic Rifts. Geodynamics series, V. 8. American
Geophysical Union, Washington, D.e., Geological Society of
America, Boulder, Colorado.
Franzson, H. , 1984 : Borehole geology and alteration
mineralogy. IntrOductory lecture course, UNU Geothermal
Training Programme, Iceland.
Fridleifsson, I.B., 1984: Geological exploration, Introduc -
tory lecture
Iceland.
course, UNU Geothermal Training Programme,
32
Grlndley, a.w. and Browne P.R.L., 1975: Structural and
hydrological factors controlling the permeabl11tles of some
hot water geothermal fields In: Proceedings of the 2nd
United Nat10ns Symposium on the Developments and Use of
Geothermal Resources. San FrancIsco, U.S.A., 20 - 29 May
1975. pp.377 - 386.
Jakobsson, S.P., Jonsson. J. and Shldo, F., 1978: Petrology
of the Western Reykjanes Peninsula, Iceland. In: Journal
of Petrology, V. 19, Part 4, pp. 669 - 705.
Jonsson, J., 1978: Jardfraedikort of Reykjanesl (Geological
map of Reykjanes) scale 1:30.000, Reykjavik: Vermlr.
Jonsson, J' t 1983: Eldgos a sogulegum tima a Reykjanes
skaga. In: Natturufraedlngurlnn 52 (1-4), bIs. 127-139.
(Icelandic).
Kjartansson, G., 1960: Geological map of Iceland,scale
1:250.000, Sheet 3. Reykjavik: Museum of Natural History.
Kristmannsdottir. H. and Tomasson. J .• 1974: Nesjavellir,
Hydrothermal alteration in a high temperature area. Papers
presented at the International Symposium on water-rock
interactions, Prague, September 1974.
Kristmannsdottir, H. and Tomasson, J., 1978: Zeolites zones
in geothermal areas in Iceland. In: L.B. Sand and Mumpton,
ed., Natural
277-284.
Zeolites, Occurrence, Properties, Use, pp.
Lister, C.R.B., 1975: Qualitative theory on the deep end of
geothermal systems.In: Proe. 2nd UN Symposium on the
Developments and Use of Geothermal Resources, San
Franc!sco. U.S.A .. 20-29 May 1975. pp.459-463.
McNitt, J.R., 1969: Report of the United Nations Technical
Assistance Mission on Geothermal Resources in Burundi,
Unpublished UNOP report, 11 pp.
Saemundsson, K •• Vulkanismus und tektonik des
Hengill - Gebietes in Sudwest-Island. In: Acta Naturalia
Islandica, V. 11. No. 7.
33
Saemundsson, K., 1978: Fissure swarms and central volcanoes
of the neovolcanlc zones or Iceland. In: Geol. Journal. spec. issue 10, 1978, pp. 415-432.
Saemundsson, K .• 1979: OutlIne of the geology of Iceland.
In Jokull, 29. 1979.
Saemundsson, K. and Elnarsson S .• 1980: GeologIcal map of Iceland, sheet 3. SW-Iceland,second edition. Museum of
Natural History and the Iceland Geodetic Survey, Reykjavik.
ShvetsQv, P.F., 1975: Heat generation In I1thlflcatlon of
o11forming clay strata. In Proc. 2nd UN Symposium on the
Developments and Use of Geothermal Resources. San
Francisco. California, U.S.A., 20-29 May 1975.
Tomasson. J., Fridleifsson , I.B. and Stephanson, V" 1975:
A hydrological
southwestern model for the flow of thermal water in
Iceland with a special reference to the
Reykir and Reykjavik thermal areas. In: Proceedings 2nd UN
Symposium on the Development and Use of Geothermal Re
sources, San FranCiSCO, U.S.A., 20-29 May 1975,
pp. 643-648.
Williams, L.A.J., 1982: Physical
continental rifts. In: Palmason,
rifts. Geodynamlc
aspects of magmatism in
G. (editor), Continental
series. V. 8. American and oceanic
Geophysical Union, Washington D.C., Geological Society of
America, Boulder, Colorado.
34
Fig . 1 . Geologica.l .ap or lee land
% l .... _',.-.. s-.o. _' ... _ < ... , ...
o , ..... "","
. .... H'" .... 1<1 ... ' ... .
fiiI ..... "'" .... , ....... , o >,noo, ,.,,, -"
~-'--= • ..
= .... _-- " .. " ... Cl "_' _ ", •• , ' - - --~=--=,:::==--' """--'--0-, --_ ... _---. . , ... , .. __ . ... ...... - --.. ... '-- -
~ ,,/;;/: ~ .. " f,'/ ,
,-
.- -.', ,:
0' /
1,/
.:I" -I!':' ~6,' ~// /~' .~ ., .
. ' if : , . " : . . , ' · ' · . · .
:' . '/ .. .. .. '!!~./
Fig . 2 . The active vql c anic z on e o f t he Re ykjane $ Pen i nsula , SW-Icela n d , ( after Jakobsso n et al., 1918 ) .
rn JHO - HSp-2506 8409 .109 5 A
F i g . 3. GEOLOGI CAL MAP OF THE TROLLA DYNGJA AREA, REYKJANES PENIN SULA
I: . : : : : : : I . ........ Alluvi um
I~I Lava flow nr, 7
h~ '11 Lava flow nr 6
t&0--~ Lava flow nr. 5
~ Lavo flow nr.4 _ Hyoloc!ostite
Craters
Faults and fractures
Altered soil , hot s prings
o I km
Fl g. ".
rjT'=l JttO . ItS!> 1 11 I LI1 L.:J:..J 84 011 10iI8 T
Ii Ii ....
11 ! 1 !!
c 100
! 11 II
1 11 11 11
'"
LI THOLOGY AND PENETRATION RATE GRAFARVOGUR HS-17. REYKJAViK
~tHETR.HON ~lTE (_1nl 02o~o eo
~ • .L _____ ~
DJ ~~ ..... fI ...... _.II ...... a l.,..! b_olt
[IIJ AII_" "......-, ..... a' ...... _011
I ~ m ~ I 'r ..... _' __ C __ ..... , ...... ~II
EJ ,,- ..... ,"'"'" - , ......
37
Stratigraphlc section of well H5-17 1n Grafarvogur,
Reykjavik, Iceland.
38
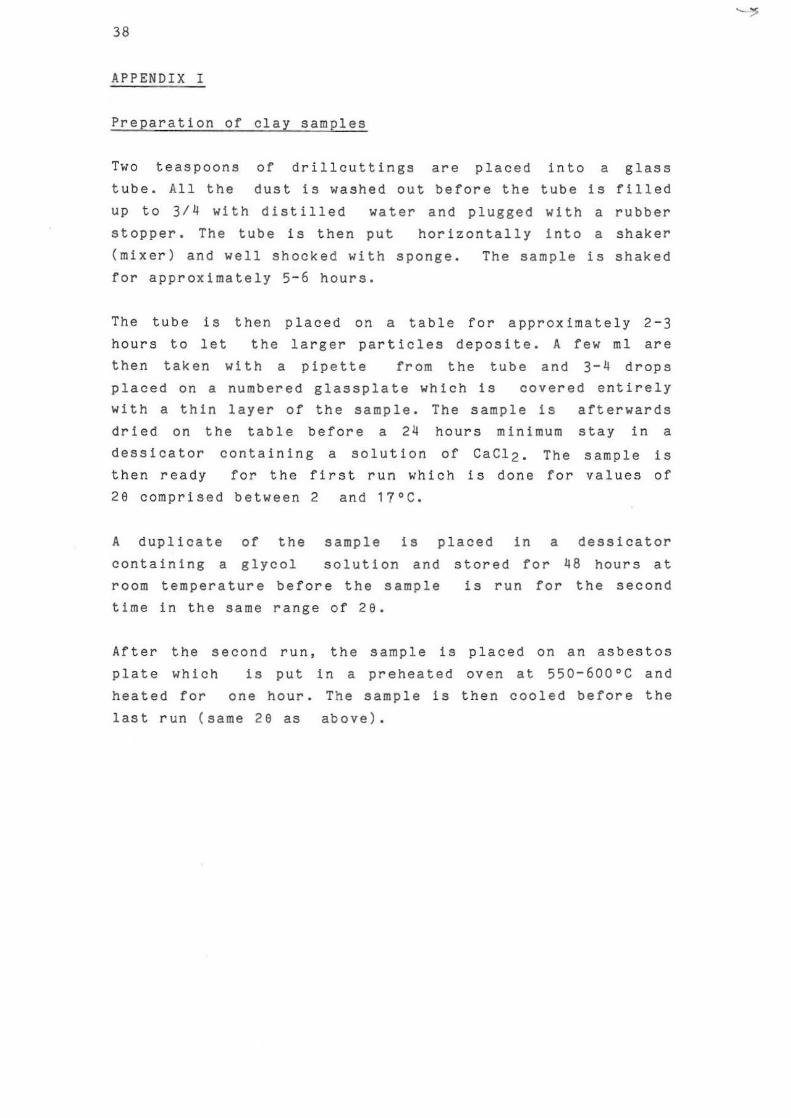
APPENDIX I
Prepa r ation of clay samples
TwO teaspoons of dri l lcuttings are placed into a glass
tube. All the dust Is washed out before the tube Is filled
up to 3/~ with distilled water and plugged with a rubber stopper. The tube Is then put horizontally into a shaker
(mixer) and well shocked with sponge .
for approximately 5-6 hours. The sample is shaked
The tube Is then placed on a table for approxImately 2 - 3
hou r s to let the larger particles deposite. A few rol are
then taken with a pipette from the tube and 3 - 4 drops
placed on a numbered glassp!ate which is covered enti r ely with a thin layer of the sample. The sample I s afterwards dried on the table before a 24 hours minimum stay In a
dessicator containIng a solution of CaCl2. The sample Is
the n ready for the f lrst run whlch Is done for val ue s of
29 comp r ised be t ween 2 and 17°C.
A duplicate of the sample is p l aced in a dess i cator
containing a glycol solution and stored for 48 hours at
room temperature before the sample
time In the same range of 29.
is run fo r the second
After the second run, the sample Is placed on an asbestos
plate which is put in a preheated oven at 550-600 o c and
heated for one hour. The samp l e is then cooled befo r e the
last run ( same 29 as above ) .