geology, geochemistry, and regional resource implications ... · geology, geochemistry, and...
TRANSCRIPT
Geology, Geochemistry, and Regional Resource Implications of a Stratabound Sphalerite Occurrence in the Northwest Adirondacks, New York
GEOLOGICAL SURVEY BULLETIN 1519

Geology, Geochen1istry, and Regional Resource ln1plications of a Stratabound Sphalerite Occurrence in the Northwest Adirondacks, New York By MICHAEL P. FOOSE
GEOLOGICAL SURVEY BULLETIN 1519
Discussion of a stratabound zinc occurrence, its geochemical expression in soil and rock, and its regional implications for other zinc occurrences in the northwest Adirondacks
UNITED STATES GOVERNMENT PRINTING OFFICE, WASHINGTON 1981
UNITED STATES DEPARTMENT OF THE INTERIOR
JAMES G. WATT, Secretary
GEOLOGICAL SURVEY
Dallas L. Peck, Director
Library of Congress Cataloging in Publication Data
Foose, M.P. Geology, geochemistry, and regional resource implications of a stratabound sphalerite occur-
rence in the northwest Adirondacks, New York. (Geological Survey bulletin ; 1519) Includes bibliographical references. Supt. of Docs. no.: .I 19.3:1519 1. Sphalerite-New York (State)-Adirondack Mountains. 2. Geology-New York (State)
Adirondack Mountains. 3. Geochemistry-New York (State)-Adirondack Mountains I. Title. II. Series.
QE75.B9 no. 1519 (QE39l.S65] 557.3s 81-607033 (549'.32] AACR2
For sale by the Superintendent of Documents, U.S. Govemment Printing Office Washington, D.C. 20402
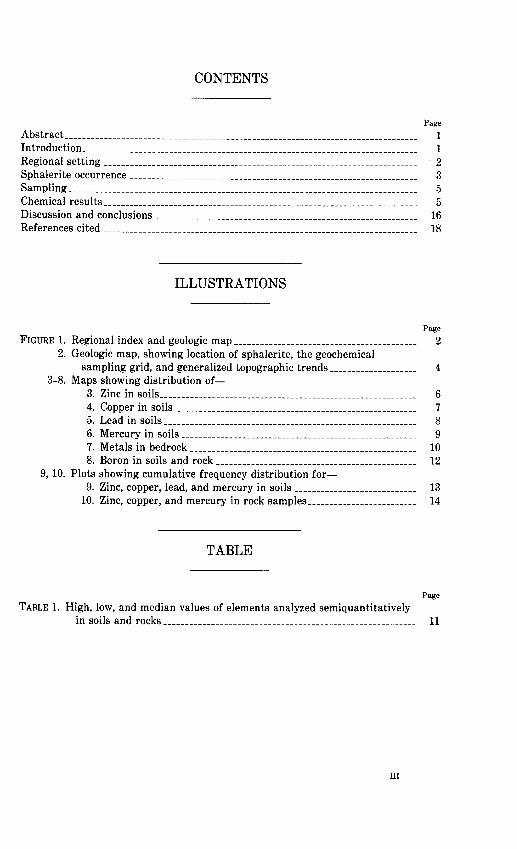
CONTENTS
Page A bs tract_________________________________________________________________________________ 1 Introduction_____________________________________________________________________________ 1
Regional setting ------------------------------------------------------------------------ · 2 Sphalerite occurrence ------------------------------------------------------------------ 3 Sam piing ________ __________ ______ _ _ ________ ________ __ ________ ________ ______________ __ ____ 5
Chemical results------------------------------------------------------------------------ 5 Discussion and conclusions ------------------------------------------------------------ 16 References cited ------------------------------------------------------------------------ 18
ILLUSTRATIONS
Page
FIGURE 1. Regional index and geologic map------------------------------------------ 2 2. Geologic map, showing location of sphalerite, the geochemical
sampling grid, and generalized topographic trends____________________ 4 3-8. Maps showing distribution of-
3. Zinc in soils___________________________________________________________ 6
4. Copper in soils ------------------------------------------------------- 7 5. Lead in soils---------------------------------------------------------- 8 6. Mercury in soils------------------------------------------------------ 9 7. Metals in bedrock---------------------------------------------------- 10 8. Boron in soils and rock ---------------------------------------------- 12
9, 10. Plots showing cumulative frequency distribution for-9. Zinc, copper, lead, and mercury in soils ---------------------------- 13
10. Zinc, copper, and mercury in rock samples_________________________ 14
TABLE
Page
TABLE 1. High, low, and median values of elements analyzed semiquantitatively in soils and rocks---------------------------------------------------------- 11
III

GEOLOGY, GEOCHEMISTRY, AND REGIONAL RESOURCE IMPLICATIONS OF
A STRATABOUND SPHALERITE OCCURRENCE IN THE NORTHWEST
ADIRONDACKS, NEW YORK
By MICHAEL P. FOOSE
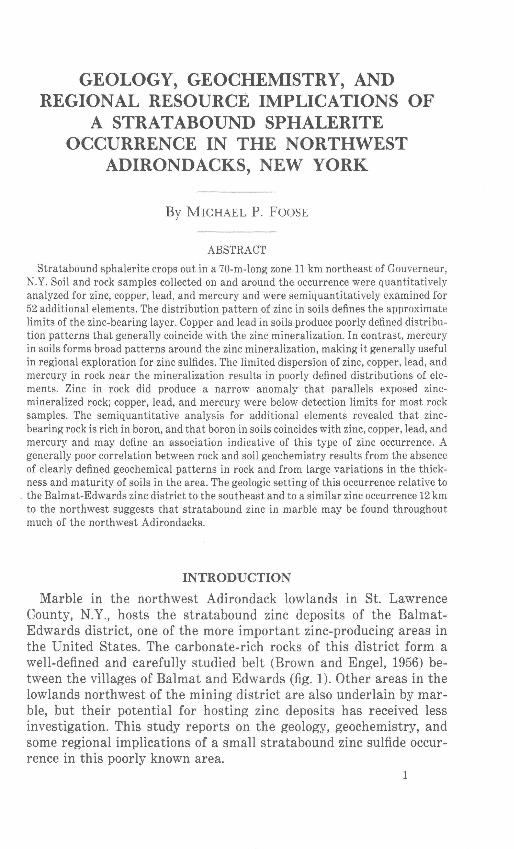
ABSTRACT
Stratabound sphalerite crops out in a 70-m-long zone 11 km northeast of Gouverneur, N.Y. Soil and rock samples collected on and around the occurrence were quantitatively analyzed for zinc, copper, lead, and mercury and were semiquantitatively examined for 52 additional elements. The distribution pattern of zinc in soils defines the approximate limits of the zinc-bearing layer. Copper and lead in soils produce poorly defined distribution patterns that generally coincide with the zinc mineralization. In contrast, mercury in soils forms broad patterns around the zinc mineralization, making it generally useful in regional exploration for zinc sulfides. The limited dispersion of zinc, copper, lead, and mercury in rock near the mineralization results in poorly defined distributions of elements. Zinc in rock did produce a narrow anomaly that parallels exposed zincmineralized rock; copper, lead, and mercury were below detection limits for most rock samples. The semiquantitative analysis for additional elements revealed that zincbearing rock is rich in boron, and that boron in soils coincides with zinc, copper, lead, and mercury and may define an association indicative of this type of zinc occurrence. A generally poor correlation between rock and soil geochemistry results from the absence of clearly defined geochemical patterns in rock and from large variations in the thickness and maturity of soils in the area. The geologic setting of this occurrence relative to
. the Balmat-Edwards zinc district to the southeast and to a similar zinc occurrence 12 km to the northwest suggests that stratabound zinc in marble may be found throughout much of the northwest Adirondacks.
INTRODUCTION
Marble in the northwest Adirondack lowlands in St. Lawrence County, N.Y., hosts the stratabound zinc deposits of the Balmat-Edwards district, one of the more important zinc-producing areas in the United States. The carbonate-rich rocks of this district form a well-defined and carefully studied belt (Brown and Engel, 1956) between the villages of Balmat and Edwards (fig. 1). Other areas in the lowlands northwest of the mining district are also underlain by marble, but their potential for hosting zinc deposits has received less investigation. This study reports on the geology, geochemistry, and some regional implications of a small stratabound zinc sulfide occurrence in this poorly known area.
2 SPHALERITE OCCURRENCE IN NEW YORK
Acknowledgment. -C. E. Brown, U.S. Geological Survey, identified the presence of zinc during a visit to the area and encouraged this study of its setting and geochemistry.
REGIONAL SETTING
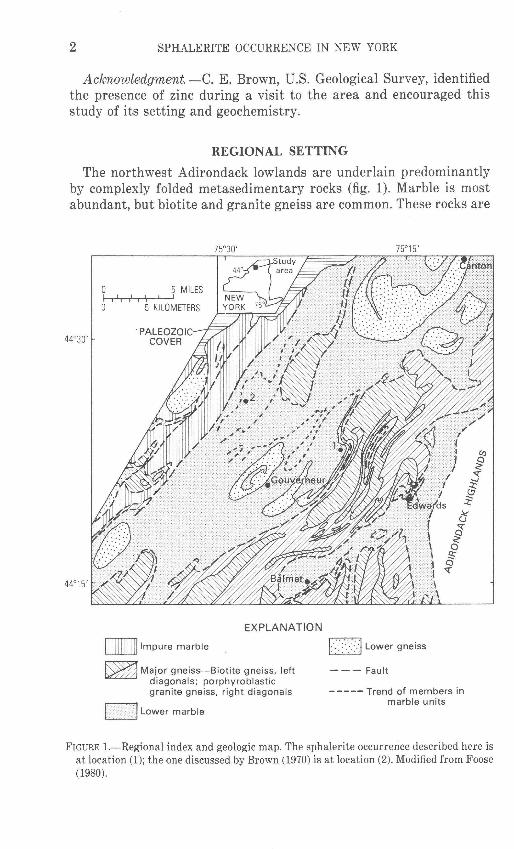
The northwest Adirondack lowlands are underlain predominantly by complexly folded metasedimentary rocks (fig. 1). Marble is most abundant, but biotite and granite gneiss are common. These rocks are
0 5 MILES I I·, I I I I
0 I I 5 KILOMETERS
EXPLANATION
-Impure marble
~Major gneiss-Biotite gneiss, left diagonals; porphyroblastic granite gneiss, right diagonals
r .•... ..... !Lower marble
~:- .· ·.':'·.·_.::.] Lower gneiss
---Fault
-----Trend of members in marble units
FIGURE 1.-Regional index and geologic map. The sphalerite occurrence described here is at location (1); the one discussed by Brown (1970) is at location (2). Modified from Foose (1980).
SPHALERITE OCCURRENCE 3
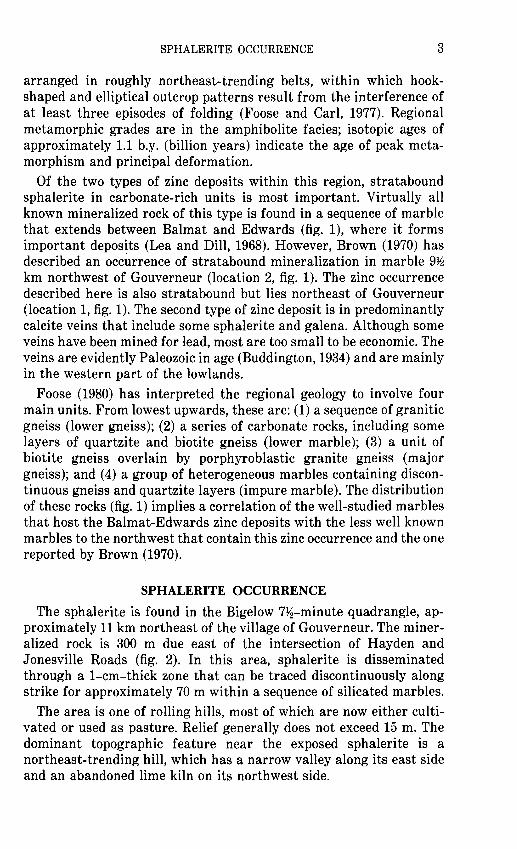
arranged in roughly northeast-trending belts, within which hookshaped and elliptical outcrop patterns result from the interference of at least three episodes of folding (Foose and Carl, 1977). Regional metamorphic grades are in the amphibolite facies; isotopic ages of approximately 1.1 b.y. (billion years) indicate the age of peak metamorphism and principal deformation.
Of the two types of zinc deposits within this region, stratabound sphalerite in carbonate-rich units is most important. Virtually all known mineralized rock of this type is found in a sequence of marble that extends between Balmat and Edwards (fig. 1), where it forms important deposits (Lea and Dill, 1968). However, Brown (1970) has described an occurrence of stratabound mineralization in marble 9~ km northwest of Gouverneur (location 2, fig. 1). The zinc occurrence described here is also stratabound but lies northeast of Gouverneur (location 1, fig. 1). The second type of zinc deposit is in predominantly calcite veins that include some sphalerite and galena. Although some veins have been mined for lead, most are too small to be economic. The veins are evidently Paleozoic in age (Buddington, 1934) and are mainly in the western part of the lowlands.
Foose (1980) has interpreted the regional geology to involve four main units. From lowest upwards, these are: (1) a sequence of granitic gneiss (lower gneiss); (2) a series of carbonate rocks, including some layers of quartzite and biotite gneiss (lower marble); (3) a unit of biotite gneiss overlain by porphyroblastic granite gneiss (major gneiss); and (4) a group of heterogeneous marbles containing discontinuous gneiss and quartzite layers (impure marble). The distribution of these rocks (fig. 1) implies a correlation of the well-studied marbles that host the Balmat-Edwards zinc deposits with the less well known marbles to the northwest that contain this zinc occurrence and the one reported by Brown (1970).
SPHALERITE OCCURRENCE
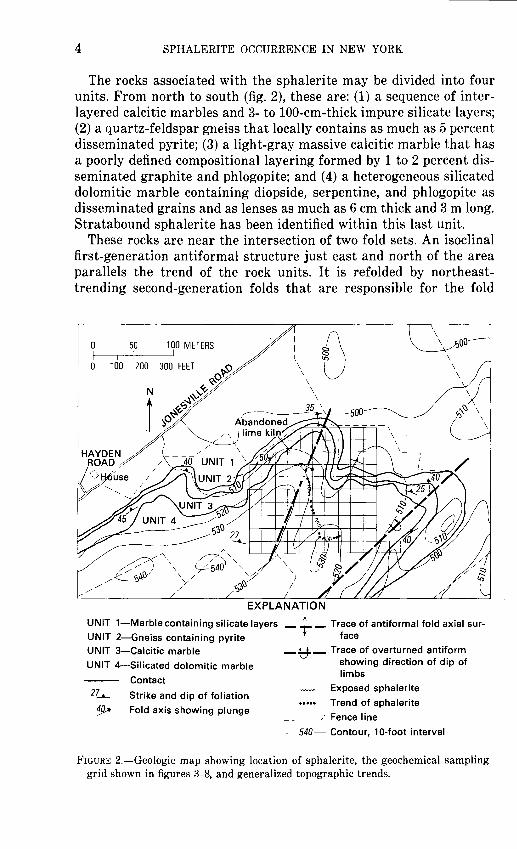
The sphalerite is found in the Bigelow 7}2-minute quadrangle, approximately 11 km northeast of the village of Gouverneur. The mineralized rock is 300 m due east of the intersection of Hayden and Jonesville Roads (fig. 2). In this area, sphalerite is disseminated through a 1-cm-thick zone that can be traced discontinuously along strike for approximately 70 m within a sequence of silicated marbles.
The area is one of rolling hills, most of which are now either cultivated or used as pasture. Relief generally does not exceed 15 m. The dominant topographic feature near the exposed sphalerite is a northeast-trending hill, which has a narrow valley along its east side and an abandoned lime kiln on its northwest side.
4 SPHALERITE OCCURRENCE IN NEW YORK
The rocks associated with the sphalerite may be divided into four units. From north to south (fig. 2), these are: (1) a sequence of interlayered calcitic marbles and 3- to 100-cm-thick impure silicate layers; (2) a quartz-feldspar gneiss that locally contains as much as 5 percent disseminated pyrite; (3) a light-gray massive calcitic marble that has a poorly defined compositional layering formed by 1 to 2 percent disseminated graphite and phlogopite; and (4) a heterogeneous silicated dolomitic marble containing diopside, serpentine, and phlogopite as disseminated grains and as lenses as much as 6 em thick and 3m long. Stratabound sphalerite has been identified within this last unit.
These rocks are near the intersection of two fold sets. An isoclinal first-generation antiformal structure just east and north of the area parallels the trend of the rock units. It is refolded by northeasttrending second-generation folds that are responsible for the fold
EXPLANATION
UNIT 1-Marble containing silicate layers _ + _ Trace of antiformal fold axial sur-
UNIT 2-Gneiss containing pyrite face UNIT 3-Calcitic marble --8-- Trace of overturned antiform UNIT 4--Silicated dolomitic marble showing direction of dip of
Contact
Strike and dip of foliation
Fold axis showing plunge
limbs
Exposed sphalerite
Trend of sphalerite
-----~· Fence line
-540- Contour, 10-foot interval
FIGURE 2.-Geologic map showing location of sphalerite, the geochemical sampling grid shown in figures 3-8, and generalized topographic trends.
CHEMICAL RESULTS 5
patterns shown in figure 2. Because of the refolding, the approximately east-striking rocks that underlie most of the area are interpreted to be overturned .and on the lower limb of an early-generation fold. Northeast-striking rocks along the east edge of the area are thought to be right side up.
Discontinuous stringers as much as 1 em thick and 200 em long and zones of disseminated sphalerite occur within unit 4 at the places shown in figure 2. Although discontinuous, the mineralized rock is always at the same stratigraphic position within unit 4 and is associated with serpentinized green calc-silicate minerals. The sphalerite is readily recognized by its distinctive ochre-red weathering product surrounded by a thin white rind of smithsonite.
SAMPLING
A 500- by 600-foot grid was surveyed over the zinc occurrence by means of tape and compass (fig. 2). Samples were collected every 50 feet, except along margins of the grid that were in flood plains or cultivated fields. Soil in the region is irregular in thickness and often lacks a well-developed profile, but where possible, samples were collected from the B horizon. Rock samples were also collected from outcrops close to soil samples. A total of 116 soil and 73 rock samples was obtained. Samples were analyzed at the analytical laboratories of the U.S. Geological Survey. W. d' Angelo quantitatively analyzed the samples for mercury, zinc, copper, and lead by means of atomicabsorption spectrometry. Detection limits were 10 ppm (parts per million) for zinc, copper, and lead in both soil and rock and were 0.01 ppm for mercury in soil and 0.02 ppm for mercury in rock. In addition, semiquantitative spectrographic analyses were done by J. L. Harris and Norma Rait to determine the approximate concentrations of 52 other elements.
CHEMICAL RESULTS
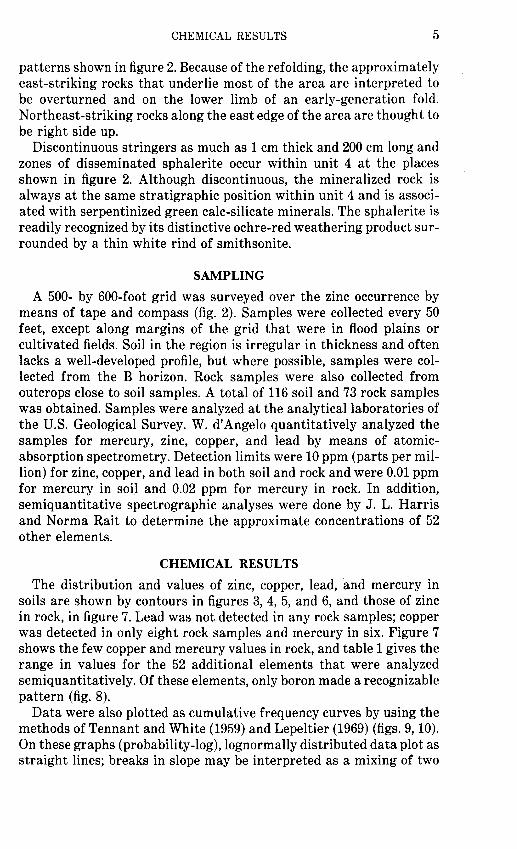
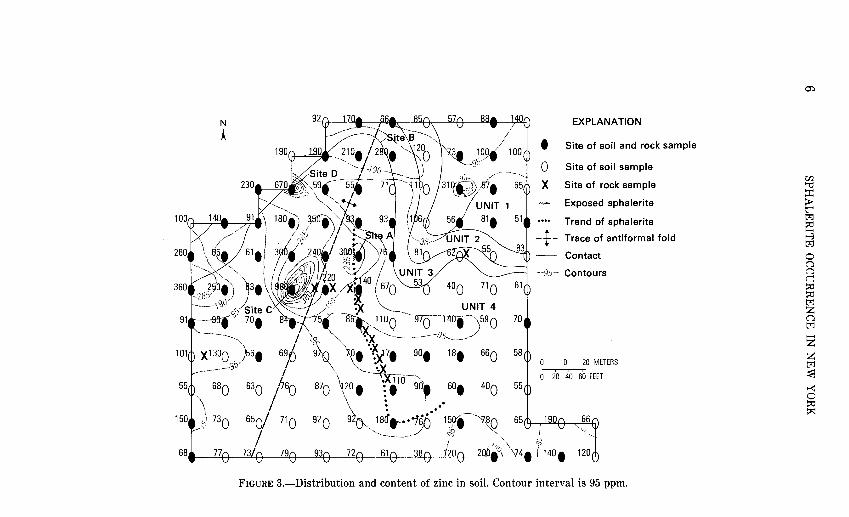
The distribution and values of zinc, copper, lead, and mercury in soils are shown by contours in figures 3, 4, 5, and 6, and those of zinc in rock, in figure 7. Lead was not detected in any rock samples; copper was detected in only eight rock samples and mercury in six. Figure 7 shows the few copper and mercury values in rock, and table 1 gives the range in values for the 52 additional elements that were analyzed semiquantitatively. Of these elements, only boron made a recognizable pattern (fig. 8).
Data were also plotted as cumulative frequency curves by using the methods of Tennant and White (1959) and Lepeltier (1969) (figs. 9, 10). On these graphs (probability-log), lognormally distributed data plot as straight lines; breaks in slope may be interpreted as a mixing of two
N
t
EXPLANATION
I Site of soil and rock sample
0 Site of soil sample
X Site of rock sample
Exposed sphalerite
Trend of sphalerite
Trace of antiformal fold
Contact
--95- Contours
0 10 20 METERS ' ' ' 0 20 40 60 FEET
68. "() ""() '"() ""() '~() uo() -'Y() !L-Y(J ~u .... l p. 1 o-.u. •~v(')
FIGURE 3.-Distribution and content of zinc in soil. Contour interval is 95 ppm.
0)
r:n '"0 :::r:: > t"" t%J :::0 :::3 t%J
0 0 0 c::: :::0 :::0 t%J z 0 t%J
z z t%J ~ ~ 0 :::0 ~
-.:]
00
N
~-· ~ EXPLANATION
t • Site of soil and rock sample < <~·~ <t
"' ""' 0 Site of soil sample
X Site of rock sample en ""0
Exposed sphalerite ::r:: > t""'
Trend of sphalerite t_:l:j =:o
Trace of antiformal fold ~ t_:l:j
Contact 0 0
Contours 0
<o <o < c:::: =:o < Lead content less =:o
~ UNIT 4 than 10 ppm t_:l:j z
'<o <o <e <o < 0 t_:l:j
~
<e ·-~<• <e z x<o <e <;() <o 10. <o 0 10 20 METERS z
-~ t_:l:j
0 20 40 60 FEET ~ <o <o .f<o <o <e <~• <e <e <o ~ 0 . . =:o
~ .... ·~6 . ~ <o <of <o <o <o <e <o ~ .. ~-
I I / <
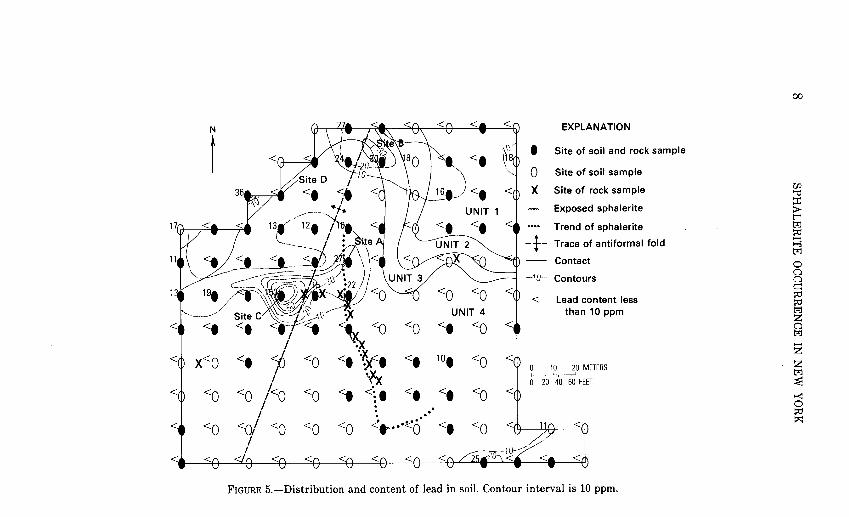
FIGURE 5.-Distribution and content of lead in soil. Contour interval is 10 ppm.
N .UI<l"l' l "I''• .,. "' 'f I "'"'II - '<\i) EXPLANATION
t <~~:\\}' (l~o~ • Site of soil and rock sample
0 Site of soil sample
X Site of rock sample
Exposed sphalerite
Trend of sphalerite
Trace of antiformal fold
Contact
Contours n ::r: l?:l < Mercury content less s= ......
than 0.01 ppm n > t""' ;:o l?:l rn
.o1se <tJ .~52() .042f -~~3· \;01 fit f3~// .ozo .Ull(j) 0
~ 10 20 METERS t""'
1-3 0 20 40 60 FEET rn
IIIII" ~ -~ .ozgo .0280
.02\)
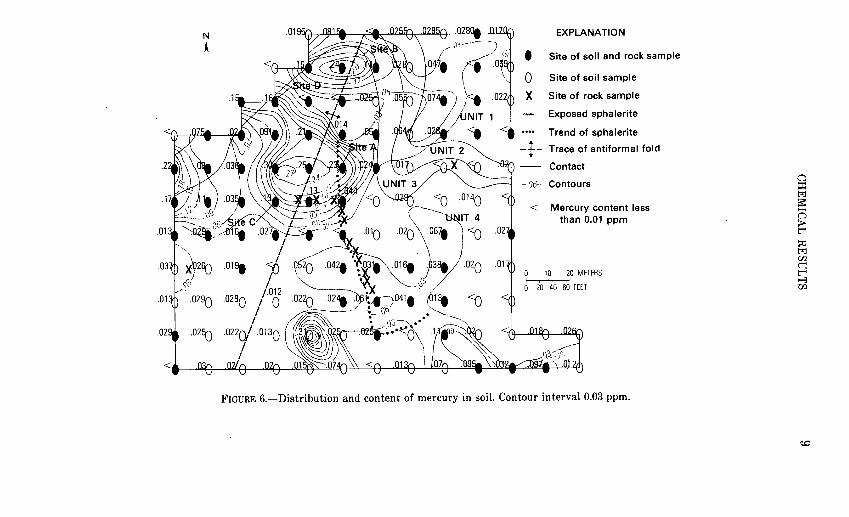
I < FIGURE G.-Distribution and content of mercury in soil. Contour interval 0.03 ppm.
~
<
12
40
N
t 16~
~:,'sl
~3ol/ I
'I
1~· ~ I
14. 19. 1<1 ~~ I • ~·'S I : S•te <• / <• 25, 13w 62u
/28 ppm cu £. I!J-;:, 1 \UNIT 3
42.il 20. )' 30"1 tX'9 11
" 100\\, 0 C'':l'0 I 1900 ppm Zn
Site C I 40 '19 ppm Cu UNIT 4 131 121 151 I 201 0 0 <t 0
/ 120\ I 37\ \. '/
() 0 54. • ~:t 32. ).61 // 0 I 330 ppm Zn ~JJ 0\ ,§J (_I/
I .05 ppm Hg <{} f:co)) "'-.../"1- /
o I o 36 ppocu 15' \ • 54 19.--<1 o 1 3400 ppm Zn.~/v I . I .036 ppm Hg • ,o-5: • •
ol o o 23 ppa cu~~ f·r-; 14' / ~300 plfm Zn
xo
0
0
14.
0
.028 ppm Hg
EXPLANATION
I Site of soil and rock sample
0 Site of soil sample
X Site of rock sample
Exposed sphalerite
Trend of sphalerite
Trace of antiformal fold
Contact
Contours
< Zinc content less than 10 ppm
0 1 0 20 METERS
0 20 40 60 FEET
1 :/'032 ppm Hg
14• A In A A n n 13Pffcu n ,oa -a •ua d1
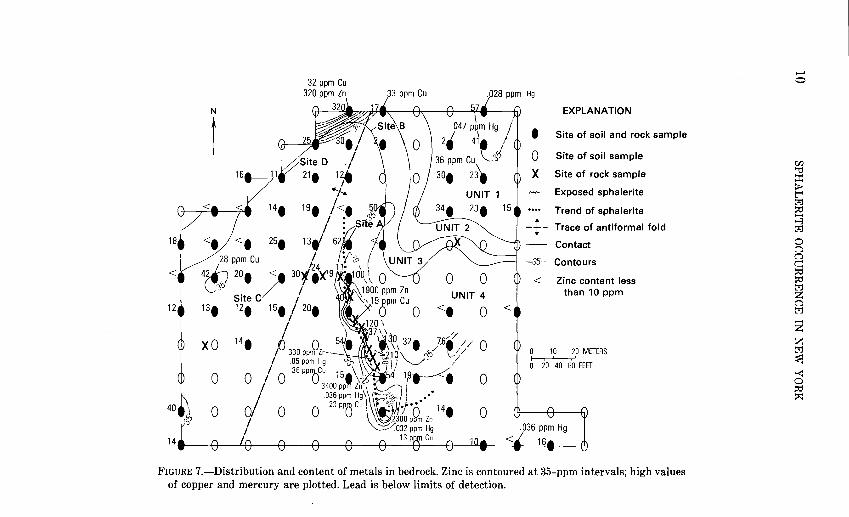
FIGURE 7.-Distribution and content of metals in bedrock. Zinc is contoured at 35-ppm intervals; high values of copper and mercury are plotted. Lead is below limits of detection.
~ 0
r::n ""d ::r: > t'"' trl ~
~ trl
0 l.l l.l c:::: ~ ~ trl z l.l trl
z z trl ~ ~ 0 ~ ~
CHEMICAL RESULTS 11
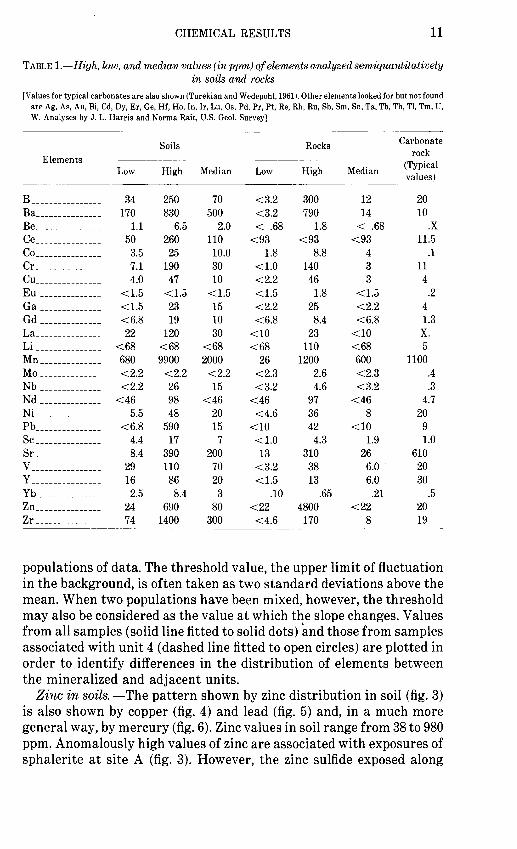
TABLE 1.-High, low, and median values (in ppm) of elements analyzed semiquantitatively in soils and rocks
[Values for typical carbonates are also shown (Turekian and Wedepohl,1961 ). Other elements looked for but not found are Ag, As, Au, Bi, Cd, Dy, Er, Ge, Hf, Ho, In, Ir, Lu, Os, Pd, Pr, Pt, Re, Rh, Ru, Sb, Sm, Sn, Ta, Tb, Th, Tl, Tm, U, W. Analyses by J. L. Harris and Norma Rait, U.S. Geol. Survey)
Soils Rocks Carbonate
Elements rock
Low High Median Low High Median (Typical values)
B ---------------- 34 250 70 <3.2 300 12 20 Ba _______________ 170 830 500 <3.2 790 14 10 Be _______________ 1.1 6.5 2.0 < .68 1.8 < .68 .X Ce _______________ 50 260 110 <93 <93 <93 11.5 Co _______________ 3.5 25 10.0 1.8 8.8 4 .1 Cr _______________ 7.1 190 30 <1.0 140 3 11 Cu _______________ 4.0 47 10 <2.2 46 3 4 Eu ______________ <1.5 <1.5 <1.5 <1.5 1.8 <1.5 .2 Ga ______________ <1.5 23 15 <2.2 25 <2.2 4 Gd ______________ <6.8 19 10 <6.8 8.4 <6.8 1.3 La _______________ 22 120 30 <10 23 <10 X. Li --------------- <68 <68 <68 <68 110 <68 5 Mn ______________ 680 9900 2000 26 1200 600 1100 Mo ______________ <2.2 <2.2 <2.2 <2.3 2.6 <2.3 .4 Nb ______________ <2.2 26 15 <3.2 4.6 <3.2 .3 Nd ______________ <46 98 <46 <46 97 <46 4.7 Ni _______________ 5.5 48 20 <4.6 36 8 20 Pb _______________ <6.8 590 15 <10 42 <10 9 Sc _______________ 4.4 17 7 <1.0 4.3 1.9 1.0 Sr _______________ 8.4 390 200 13 310 26 610 v ---------------- 29 110 70 <3.2 38 6.0 20 y
---------------- 16 86 20 <1.5 13 6.0 30 Yb ______________ 2.5 8.4 3 .10 .65 .21 .5 Zn --------------- 24 690 80 <22 4800 <22 20 Zr _______________ 74 1400 300 <4.6 170 8 19
populations of data. The threshold value, the upper limit of fluctuation in the background, is often taken as two standard deviations above the mean. When two populations have been mixed, however, the threshold may also be considered as the value at which the slope changes. Values from all samples (solid line fitted to solid dots) and those from samples associated with unit 4 (dashed line fitted to open circles) are plotted in order to identify differences in the distribution of elements between the mineralized and adjacent units.
Zinc in soils.-The pattern shown by zinc distribution in soil (fig. 3) is also shown by copper (fig. 4) and lead (fig. 5) and, in a much more general way, by mercury (fig. 6). Zinc values in soil range from 38 to 980 ppm. Anomalously high values of zinc are associated with exposures of sphalerite at site A (fig. 3). However, the zinc sulfide exposed along
N EXPLANATION
t • Site of soil and rock sample
0 Site of soil sample 20 X Site of rock sample 130
Exposed sphalerite
Trend of sphalerite
Trace of antiformal fold
Contact
Contours
-7G-- Contours on soil
Rock analysis
Soil analysis
0 10 20 METERS
0 20 40 60 FEET
I i ~~ ! \ ____ 1\J \ I
12 52 '"- '"'- ''- ~~- Ill....., 1111'1..1 ''"'"' '-""' -·- --- --- 59
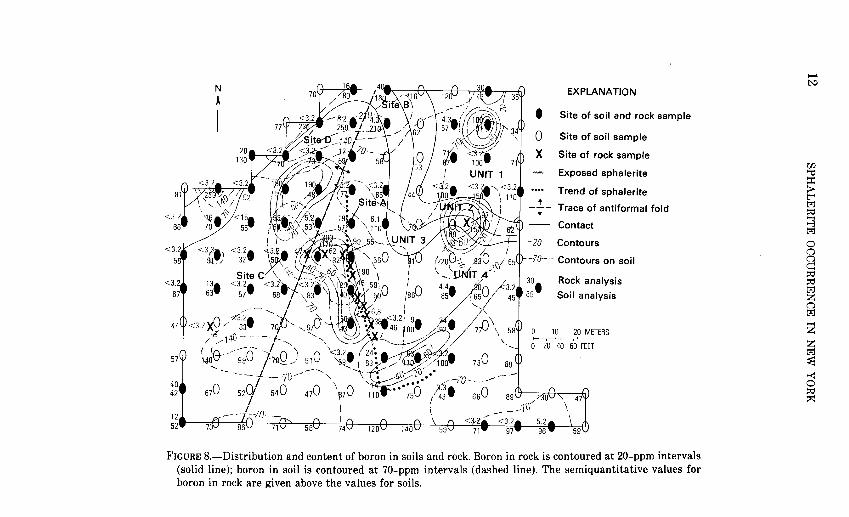
FIGURE 8.-Distribution and content of boron in soils and rock. Boron in rock is contoured at 20-ppm intervals (solid line); boron in soil is contoured at 70-ppm intervals (dashed line). The semiquantitative values for boron in rock are given above the values for soils.
,....... tv
r.n '1::l ::r: > t'"' t:rj ~
:::3 t:rj
0 ("') ("')
c:: ~ ~ t:rj z ("') t:rj
z z t:rj
~ >< 0 ~ ~
z 0 ::J ...J
~ a: w ll..
en ti: ~ ~
> a: ::::> u a: w
:iE 0.03
0.02
0.01 2
EXPLANATION • o Zinc
----,----------,1000 900 800 700 600 500
400
• 6 Copper ...- • , 9'--1300 .~-·· o-/·,/"
• o Mercury ,:/ 0 9- · ,;' .P
• 0 L d .:::.--~. C:.
0-' I; --1200 ea .~/ 0 .- Iii;
~/o-// ~/ . .!0 IJ(/
~P~inc ~~ A100 _.[r" ~ercury . ~8 ...rc 10
~~~-~ L- j60 •/79" / 50 • 0 ..#ffF -1l v A'/+7 . 40
.. ~ /
_.4JF ~~- ~;h,~~ .-esc- 30
Ill~ .t~_ ;; ~Lea_d IIJ-- f <>· • I f) v /~· /f:, .• /... 0· ~20
imit of detection / Copp~~·~ :f /6 .~/ , 0
f ty • '•
or mercury . a ,¥" ;) q_ /~ !Y ,t .\1-~ ... ~ ~ 6 1/ I • _,t ,y I I
. 0 95 /9~ 0
CUMULATIVE DISTRIBUTION, IN PERCENT Limit ~f detection for zmc, copper, and lead
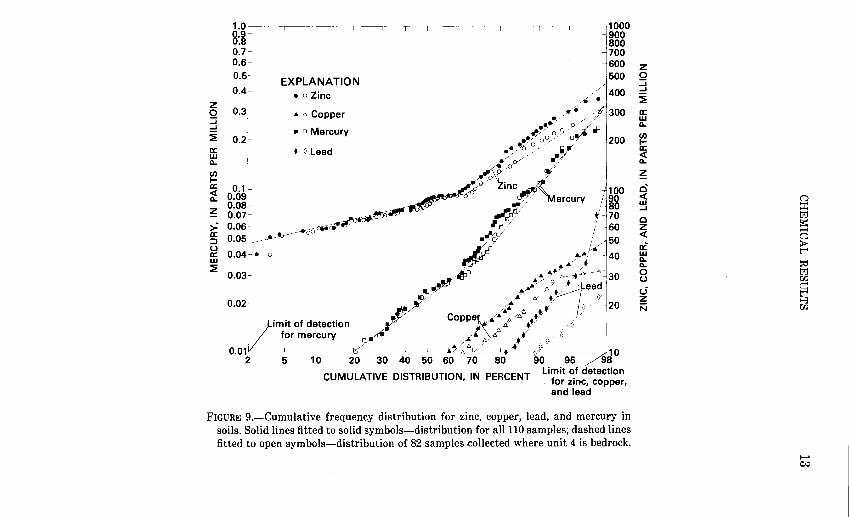
FIGURE 9.-Cumulative frequency distribution for zinc, copper, lead, and mercury in soils. Solid lines fitted to solid symbols-distribution for allllO samples; dashed lines fitted to open symbols-distribution of 82 samples .collected where unit 4 is bedrock.
z 0 ::J ...J
~ a: w ll..
en 1-a: <( ll..
~ ci <( w ...J
0 z <(
ci w ll.. ll.. 0 u cJ z N
0 ::r: t;:lj
a::: (=) > t'"' ~ t;:lj r.n. c:::: t'"' t-3 r.n.
....... ~
14 SPHALERITE OCCURRENCE IN NEW YORK
3T 2.01
z 0 ::::i ...J 0.4 ~
I
a: o.31 ~ I
~ 0.2 a: ~ a..
~ ~ 0.1 a: 0.09 a o.o8 a: 0.07 ~ 0.06
0.05
0.04
0.03f-
EXPLANATION • o Zinc
• t; Copper
• o Mercur-Y
0.02 for mercury rimit of detection
0.011 2 5 10 15
13000
0 2000
II
)1~1000 /;/ .~gg 1;/ 700 ~ f 600 3
II• :~ ;
300 (/) 1-a:
200 ~ ~
ci 1100 ~ ~90 0 j80 u --470 c
60 ~ ·"'50 .... u
z ;::; / / 40
, .. :6-tJ / //~ /•
Mercury~·<'~~~ ~~v
/fcopper
I I J./1 I 110 40 so 60 10 80 as 90 95 /sa
Limit of detection CUMULATIVE DISTRIBUTION, IN PERCENT for zinc: copper,
and lead
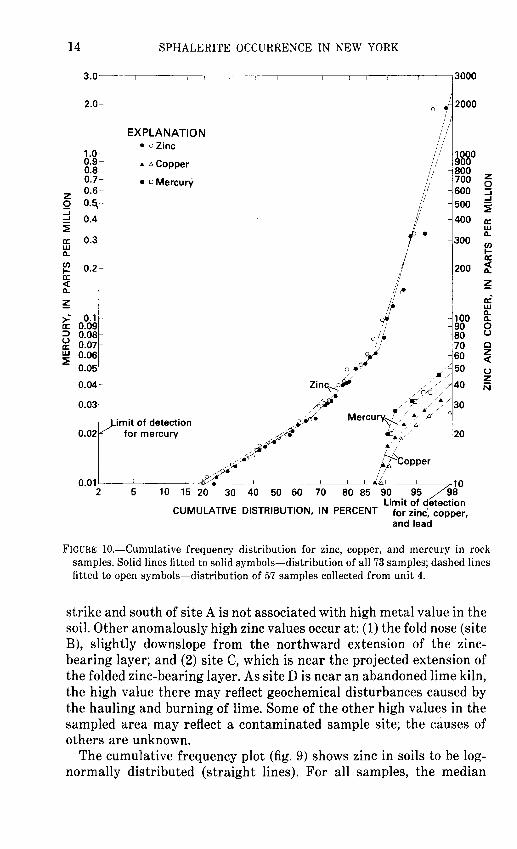
FIGURE 10.-Cumulative frequency distribution for zinc, copper, and mercury in rock samples. Solid lines fitted to solid symbols-distribution of all 73 samples; dashed lines fitted to open symbols-distribution of 57 samples collected from unit 4.
strike and south of site A is not associated with high metal value in the soil. Other anomalously high zinc values occur at: (1) the fold nose (site B), slightly downslope from the northward extension of the zincbearing layer; and (2) site C, which is near the projected extension of the folded zinc-bearing layer. As siteD is near an abandoned lime kiln, the high value there may reflect geochemical disturbances caused by the hauling and burning of lime. Some of the other high values in the sampled area may reflect a contaminated sample site; the causes of others are unknown.
The cumulative frequency plot (fig. 9) shows zinc in soils to be lognormally distributed (straight lines). For all samples, the median
CHEMICAL RESULTS 15
(background) is 88 ppm and the threshold is 94 ppm. The increase in slope above the threshold indicates an excess of high zinc values over background. The distribution of background values from unit 4 appears similar to that for all soil samples, but values above background are slightly lower where unit 4 is bedrock than are those taken from all units.
Copper and lead in soils.-The distribution patterns shown by copper (fig. 4) and lead (fig. 5) are similar to but are less well defined than those shown by zinc. Values for copper range from below the detection limit (10 ppm) to 65 ppm; those for lead range from less than 10 ppm to 180 ppm. Anomalously high values occur at sites A, B, and C, whereas no copper and lead values above detection limits have been found in the area along strike and south of site A. Anomalously high copper values, like those for zinc, are associated with the abandoned lime kiln (site D). Although 57 percent of the lead and 55 percent of the copper values are below limits of detection, the remaining values plot as straight lines (fig. 9), indicating lognormal distribution. The decrease in slope shown by copper above its threshold (25 ppm) is caused by an excess of low values, whereas increase in slope of lead above its threshold (35 ppm) indicates an excess of high values above background. Soils that overlie unit 4 (dashed lines) show lower concentrations of copper and lead than those found for all soil samples (solid line).
Mercury in soils. -Mercury (fig. 6) forms broad distribution patterns that coincide with but extend beyond those made by zinc, copper, and lead. In addition, several anomalously high values for mercury occur in areas where no unusual concentrations of other metals have been found. Straight-line plots above the detection limit for mercury, 0.01 ppm (fig. 9), indicate a lognormal distribution that has a median (background) of 0.025 ppm, a threshold of 0.029 ppm, and a maximum value of 0.31 ppm. A pronounced excess of high values above the threshold value is found. Values associated with unit 4 are virtually identical with those from the entire population of samples.
Zinc, copper, lead, and mercury in rock.-The geochemical patterns from rock samples are inconsistent compared with those from soils, largely because of a much smaller sample size and because many samples have metal values below detection limits.
Of the elements analyzed quantitatively, only zinc values show a well-defined pattern (fig. 7). This arcuate anomaly parallels the exposed zinc sulfide. Values range from a background of 10 to a high of 3,400 ppm; the median is 1,900. The north end of the anomaly roughly coincides with one of the zones of soils that shows anomalously high zinc values (site A). Soils over the southeastern part of this arcuate anomaly, however, do not show unusually high values. Further, the
16 SPHALERITE OCCURRENCE IN NEW YORK
high zinc values in soil at site C do not have a corresponding anomaly in rock. The only other high zinc value is found at the north end of the grid, within unit 3, and may represent either a contaminated sample or a second area of mineralization.
The cumulative frequency plot (fig. 10) for zinc in rock samples shows two breaks in slope. This pattern is that of a background population mixed with a small population of higher ·average value (Lepeltier, 1969). The threshold value may be taken as near the middle of the mixed zone, which in this plot is approximately 35 ppm. Background is 18 ppm; the maximum value is 3,400 ppm. Samples from unit 4 (dashed line) have virtually the same distribution as the total population of rock samples.
Most high values for copper (36 ppm maximum) and mercury (105 ppm maximum) are associated with areas of high zinc values (fig. 7), although some isolated areas of high values for copper and mercury occur. Cumulative distributions of these two elements (fig. 10) are not well defined because of the large number of samples in which these elements were below detection limits; however, for both elements, the average concentration in samples from unit 4 appears to be slightly lower than that for the total population of rock samples. All analyses for lead in rock showed this element to be below detection limits.
Boron in rock and soils. -High values were found in some of the 52 additional elements looked for by means of semiquantitative spectrographic analysis (table 1), but only boron made a recognizable pattern. The distribution pattern of high values of boron in rock (fig. 8) clearly defines the zinc-bearing layer, both in areas where zinc is exposed and along the layer's folded extension where zinc has not been found. Values range from below detection (3.2 ppm) to 300 ppm, with a median of 12 ppm. Values greater than 100 ppm are associated with the zinc-bearing layer. In contrast, boron values in soils make patterns similar to those shown by zinc, copper, lead, and mercury. Values range from 34 to 250 ppm, with a median of 70 ppm. Values greater than 140 ppm are principally associated with exposed zinc and with soils near sites Band C that also show high values of zinc, copper, lead, and mercury. Additionally, several small areas of high boron in soils show no unusual concentration of other elements.
DISCUSSION AND CONCLUSIONS
The principal results of geochemical sampling over the stratabound zinc sulfide exposures are as follows: (1) Soil sampling is useful in locating this type of zinc mineralization. The distribution of zinc in soils is defined by a conspicuous pattern, which is less clearly shown by copper and lead values in soils. This pattern is also coincident with a more dispersed zone of mercury and to some degree with boron
DISCUSSION AND CONCLUSIONS 17
distribution in soils. The metal anomalies in soil approximately coincide with the folded rocks and thus define the general limits of the stratabound mineralization. Mercury and boron are known to be geochemical pathfinders for some zinc sulfide deposits (Levinson, 1974). The broad distribution pattern of mercury in this study shows that this element is particularly useful in locating zinc deposits of this type. Boron appears to be a less useful pathfinder, but its presence together with other metals may be indicative of this type of zinc occurrence. (2) Rock geochemistry appears to be of little use in locating stratabound zinc mineralization because dispersion of metals in rock is extremely restricted. Many samples adjacent to exposed zinc sulfide mineralization had only background values. Locally, however, the boron distribution pattern clearly defines the zinc-bearing layer and shows that the zinc is associated with a boron-rich rock. (3) The correlation of soil samples with rock geochemistry is generally poor. The northern part of the exposed zinc-mineralized zone is associated with high zinc values in soil; the southern part of the exposed zone is not. Development of soil profiles in this recently glaciated area is uneven and, in most places, incomplete. Particularly thin and incompletely developed soils in this southern area may be the reason for the absence of anomalies in soil. Additionally, the strong anomaly at site C suggests the presence of unexposed and previously unrecognized mineralization.
Brown (1970) did a geochemical soil study of a similar sphalerite occurrence (shown in fig. 1). Comparison of results from the two stud- · ies shows some differences but many similarities. Notably, Brown's 50 soil samples have a much higher threshold for both zinc (180 ppm) and mercury (0.6 ppm) than do samples in this study. Further, the zinc distribution found by Brown has an excess of low values (negative break in slope) above the threshold, a feature that he interpreted as being in part due to the small sample size. On the other hand, Brown also found that the trend of the zinc-bearing layer was defined by a narrow band of zinc values greater than 150 ppm and a much broader halo of mercury values greater than 0.2 ppm. As in this study, most copper and lead values were below detection limits, but copper values did form a subdued anomaly over the zinc-mineralized zone. Finally, semiquantitative analysis showed an association of boron concen-: trations with those of zinc, copper, lead, and mercury. Both studies confirm the usefulness of soil sampling (particularly if analyzed for mercury) in locating this type of zinc mineralization. Further, the similarities in mode of occurrence and in geochemical expression of both areas of stratabound sphalerite suggest that the mineralization in both areas is closely related.
This stratabound sphalerite is in a belt of northeast-trending marbles that extends through the village of Gouverneur (fig. 1) and that is
18 SPHALERITE OCCURRENCE IN NEW YORK
approximately halfway between the zinc deposits of the BalmatEdwards district and the zinc occurrence to the northwest described by Brown (1970). Exploration for zinc deposits in the entire region has focused largely on the Balmat-Edwards area because the marbles there were thought to be different from those to the northwest (Engel and Engel, 1953). However, Foose (1980) has suggested that the marbles of the Balmat-Edwards district and those that host the zinc occurrence described here and the one described by Brown may be correlative. Further, a preliminary regional synthesis (Foose and Brown, 1976) has indicated that this mineralization and the one identified by Brown (1970) are at the same approximate stratigraphic level. These relationships suggest that the relatively unexplored marbles of this region are favorable hosts for additional stratabound zinc occurrences and may possibly even contain large deposits similar to those in the Balmat-Edwards district.
REFERENCES CITED Brown, C. E., 1970, A sphalerite vein and associated geochemical anomalies in St. Law
rence County, New York: U.S. Geological Survey Professional Paper 700-D, p. D162-D168.
Brown, J. S., and Engel, A. E. J., 1956, Revision of Grenville stratigraphy and structure in the Balmat-Edwards district, northwest Adirondacks, New York: Geological Society of America Bulletin, v. 67, no. 12, pt. 1, p. 1599-1622.
Buddington, A. F., 1934, Geology and mineral resources of the Hammond, Antwerp, and Lowville quadrangles: New York State Museum Bulletin 296, 251 p.
Engel, A. E. J., and Engel, C. G., 1953, Origin and metamorphism of the major paragneiss, pt. 2 of Grenville series in the northwest Adirondack Mountains, New York: Geological Society of America Bulletin, v. 64, no. 9, p. 1049-1098.
Foose, M. P., 1980, A reinterpretation of the structural and stratigraphic setting of the Balmat-Edwards zinc deposits, northwest Adirondack lowlands, New York: Economic Geology, v. 75, no. 1, p. 130-133.
Foose, M.P., and Brown, C. E., 1976, A preliminary synthesis of structural, stratigraphic, and magnetic data from part of the northwest Adirondacks, New York: U.S. Geological Survey Open-File Report 76-281, 22 p.
Foose, M. P., and Carl, J. D., 1977, Setting of alaskite bodies in the northwestern Adirondacks, New York: Geology, v. 5, no. 2, p. 77-80.
Lea, E. R., and Dill, D. B., Jr., 1968, Zinc deposits of the Balmat-Edwards district, New York, in Ore deposits of the United States, 1933-1967 (Graton-Sales volume), V. 1: New York, American Institute of Mining, Metallurgical, and Petroleum Engineers, p. 20-48.
Lepeltier, Claude, 1969, A simplified statistical treatment of geochemical data by graphical representation: Economic Geology, v. 64, no. 5, p. 538-550.
Levinson, A. A., 1974, Introduction to exploration geochemistry: Calgary, Alberta, Applied Publishing, 612 p.
Tennant, C. B., and White, M. L., 1959, Study of the distribution of some geochemical data: Economic Geology, v. 54, no. 7, p. 1281-1290.
Turekian, K. K., and Wedepohl, K. H., 1961, Distribution of the elements in some major units of the Earth's crust: Geological Society of America Bulletin, v. 72, no. 2, p. 175-191.
*U.S. GOVERNMENT PRINTING OFFICE: 1981-361-614/289