geology, hydrothermal alteration and fluid …...proceedings world geothermal congress 2005 antalya,...
TRANSCRIPT

Proceedings World Geothermal Congress 2005 Antalya, Turkey, 24-29 April 2005
1
Geology, Hydrothermal Alteration and Fluid Inclusion Studies of Olkaria Domes Geothermal Field, Kenya
John Lagat1, Stefan Arnorsson2 and Hjalti Franzson3
Kenya Electricity Generating Company Ltd, Olkaria Geothermal Project, P. O. Box 785, Naivasha 20117, Kenya1
University of Iceland, Science Institute, Dunhagi IS 101 Reykjavik, Iceland2
Icelandic Geosurvey, Grensasvegur 9, IS 108 Reykjavik, Iceland3
[email protected], [email protected], [email protected]
Keywords: Kenya Rift, Olkaria Domes, Geothermal, Geology, Hydrothermal Alteration, Fluid Inclusion
ABSTRACT
Three geothermal exploration wells OW-901, OW-902 and OW-903 were drilled in Olkaria Domes field to evaluate its geothermal potential. The three wells were drilled to a depth of 2200 m and all encountered a high temperature system and discharged on test. Rocks encountered in the wells include pyroclastics, rhyolite, tuff, trachyte, basalt and minor dolerite and microsyenite intrusives. Little or no hydrothermal alteration is observed in the upper parts of the wells but in the deeper parts, hydrothermal alteration ranged from high to extensive. The most important hydrothermal alteration controls in the field are temperature, rock types and permeability. Four hydrothermal alteration zonations can be recognized in the field based on the distribution of the hydrothermal alteration minerals. Hydrothermal alteration temperatures correlate well with the measured formation temperatures in wells OW-901 and OW-903 indicating probable equilibrium conditions with the geothermal system in that sector of the field. In well OW-902, however, a high temperature alteration mineral (garnet) was observed at depths where current measured formation temperature is 246°C. This indicates that cooling must have occurred in that part of the field. Fluid inclusions in quartz and calcite veins from well OW-901 and OW-903 indicate that heating must have occurred in that sector of the field with present temperatures being higher than the average fluid inclusions homogenization temperatures. In well OW-902, however, homogenization temperatures reflect more or less present condition with measured temperatures being close to the average fluid inclusion homogenization temperatures. Feeder zones in the wells are mainly confined to faults, fractures, joints and lithologic contacts.
1. INTRODUCTION
The Greater Olkaria geothermal area is situated south of Lake Naivasha on the floor of the southern segment of the Kenya rift (Figure 1). The Kenya rift is part of the East African rift system that runs from Afar triple junction at the Gulf of Eden in the north to Beira, Mozambique in the south. It is the segment of the eastern arm of the rift that extends from Lake Turkana to the North to Lake Natron, northern Tanzania to the south (Figure 1). The rift is part of a continental divergent zone where spreading occurs resulting to the thinning of the crust hence eruption of lavas and associated volcanic activities.
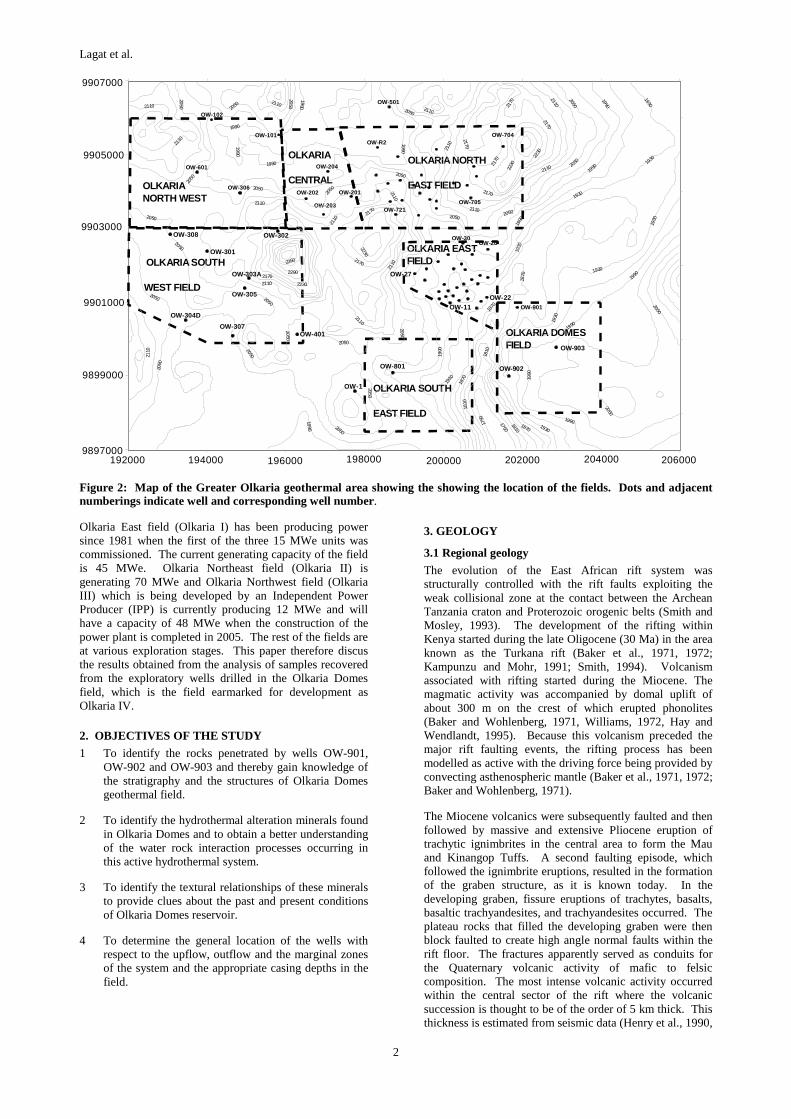
The Greater Olkaria geothermal area is within the Greater Olkaria volcanic complex. It is subdivided into seven fields for geothermal development purposes namely Olkaria East, Olkaria Northeast, Olkaria Central, Olkaria Northwest, Olkaria Southwest, Olkaria Southeast and Olkaria Domes (Figure 2).
Oo
2oS
38oE36oE
North IslandL. Turkana
Central Island
South Island
Barrier Volcano
Emuruangogolak
SilaliPaka KENYA
Nyambeni
Mt. Kenya
Longonot
Nairobi
Olorgesaille
ShomboleChyulu
Ol'Doinyo Lengai
0 50 100 150
Kilometers
Volcanic center
Lake
Rift Fault
Kilimanjaro
Cenozoicvolcanics
Suswa
OlkariaEburru
Menengai
Ol'Esakut
UGANDA
Korosi
Kisumu
ETHIOPIA4oN
38oE
Mt. Elgon
L. Magadi
Geothermal Prospect
Geothermal Field
L. Naivasha
Arus-BogoriaL. Baringo
Namarunu
Figure 1: Map of the Kenya rift showing the showing the location of Olkaria geothermal field and other quaternary volcanoes along the rift axis.
Lagat et al.
2
OLKARIA SOUTH
EAST FIELD
OLKARIANORTH WEST
OLKARIA
CENTRAL
OW-R2
OW-501
OW-202
OW-203
OW-308
OW-304D
OLKARIA SOUTH
WEST FIELDOW-305
OLKARIA NORTH
EAST FIELD
OLKARIA EASTFIELD
OLKARIA DOMESFIELD
192000 194000 196000 200000198000 202000 204000 2060009897000
9899000
9901000
9903000
9905000
9907000
2110
2110
2050
2110
2050
2050
1990
1990
2050
1990
1990
2110
OW-102
OW-601
2110
2050
OW-101
OW-306
OW-204
2110
2050
OW-201
OW-7212170
1990
20502050
2170
2170
2230
OW-7052110
OW-704
2110
2110
2110
2170
2170
2170
2230
2110
OW-401OW-307
2050
2050
2110
2050
2050
1930
1 990
19301870
1810
1750
1750
1810
1870
1870
1870
1930
2050
2050
2050
20 50
1990 2050
2050
1810
1990
21102170
2230
2290
2350
OW-801
OW-1
OW-26OW-30
OW-22
OW-902
OW-903
1930
2230
2170
2110
OW-27
OW-11 OW-901
2050
1990
2050
2050
OW-301
OW-302
OW-303A
1990
2050
1990
1930
1990
2050
2110
1930
199020
50 1930
1930
1930
2050
1990
Figure 2: Map of the Greater Olkaria geothermal area showing the showing the location of the fields. Dots and adjacent numberings indicate well and corresponding well number.
Olkaria East field (Olkaria I) has been producing power since 1981 when the first of the three 15 MWe units was commissioned. The current generating capacity of the field is 45 MWe. Olkaria Northeast field (Olkaria II) is generating 70 MWe and Olkaria Northwest field (Olkaria III) which is being developed by an Independent Power Producer (IPP) is currently producing 12 MWe and will have a capacity of 48 MWe when the construction of the power plant is completed in 2005. The rest of the fields are at various exploration stages. This paper therefore discus the results obtained from the analysis of samples recovered from the exploratory wells drilled in the Olkaria Domes field, which is the field earmarked for development as Olkaria IV.
2. OBJECTIVES OF THE STUDY
1 To identify the rocks penetrated by wells OW-901, OW-902 and OW-903 and thereby gain knowledge of the stratigraphy and the structures of Olkaria Domes geothermal field.
2 To identify the hydrothermal alteration minerals found in Olkaria Domes and to obtain a better understanding of the water rock interaction processes occurring in this active hydrothermal system.
3 To identify the textural relationships of these minerals to provide clues about the past and present conditions of Olkaria Domes reservoir.
4 To determine the general location of the wells with respect to the upflow, outflow and the marginal zones of the system and the appropriate casing depths in the field.
3. GEOLOGY
3.1 Regional geology
The evolution of the East African rift system was structurally controlled with the rift faults exploiting the weak collisional zone at the contact between the Archean Tanzania craton and Proterozoic orogenic belts (Smith and Mosley, 1993). The development of the rifting within Kenya started during the late Oligocene (30 Ma) in the area known as the Turkana rift (Baker et al., 1971, 1972; Kampunzu and Mohr, 1991; Smith, 1994). Volcanism associated with rifting started during the Miocene. The magmatic activity was accompanied by domal uplift of about 300 m on the crest of which erupted phonolites (Baker and Wohlenberg, 1971, Williams, 1972, Hay and Wendlandt, 1995). Because this volcanism preceded the major rift faulting events, the rifting process has been modelled as active with the driving force being provided by convecting asthenospheric mantle (Baker et al., 1971, 1972; Baker and Wohlenberg, 1971).
The Miocene volcanics were subsequently faulted and then followed by massive and extensive Pliocene eruption of trachytic ignimbrites in the central area to form the Mau and Kinangop Tuffs. A second faulting episode, which followed the ignimbrite eruptions, resulted in the formation of the graben structure, as it is known today. In the developing graben, fissure eruptions of trachytes, basalts, basaltic trachyandesites, and trachyandesites occurred. The plateau rocks that filled the developing graben were then block faulted to create high angle normal faults within the rift floor. The fractures apparently served as conduits for the Quaternary volcanic activity of mafic to felsic composition. The most intense volcanic activity occurred within the central sector of the rift where the volcanic succession is thought to be of the order of 5 km thick. This thickness is estimated from seismic data (Henry et al., 1990,

Lagat et al.
3
Simiyu et al., 1997), stratigraphic correlation (e.g. Baker et al., 1972), and drilled geothermal wells in Olkaria area.
3.1 Geology of Olkaria volcanic complex
The Greater Olkaria volcanic complex is characterized by numerous volcanic centers of Quaternary age and is the only area within the Kenya rift with occurrences of comendite on the surface. Other Quaternary volcanic centers adjacent to Olkaria include Longonot volcano to the southeast, Suswa caldera to the south, and the Eburru volcanic complex to the north. Whereas the other volcanoes are associated with calderas of varying sizes, Olkaria volcanic complex does not have a clear caldera association. The presence of a ring of volcanic domes in the east and south, and southwest has been used to invoke the presence of a buried caldera (Naylor, 1972, Virkir, 1980, Clarke et al., 1990, Mungania, 1992).
Magmatic activity associated with Olkaria volcanic complex commenced during the late Pleistocene and continues to Recent as indicated by Ololbutot comendite, which has been dated at 180±50 yrs B.P using 14C from carbonized wood obtained from a pumice flow associated with the lava (Clarke et al., 1990).
The litho-stratigraphy of the Olkaria geothermal area as revealed by data from geothermal wells and regional geology can be divided into six main groups; namely Proterozoic “basement” formations, Pre-Mau volcanics, Mau tuffs, plateau trachytes, Olkaria basalt and Upper Olkaria volcanics (Omenda, 2000).
The “basement” rock in the area is considered to be the Proterozoic amphibolite grade gneisses and schists and the associated marble and quartzites of the Mozambiquan group (Shackleton, 1986, Smith and Mosley, 1993). The rocks outcrop on the far flanks of the rift, more so, toward Magadi area in the south. In the south-central sector of the Kenya rift, the rocks are largely composed of gneisses and schists. The Pre-Mau formation is not exposed in the area but outcrops on the rift scarps in the parts of the southern Kenya rift. The rocks are composed of trachytes, basalts and ignimbrites and are of unknown thickness. These rocks are directly overlain by the Mau tuffs that are Pleistocene in age. Mau tuffs are the oldest rocks that crop out in the Olkaria area. These rocks are common in the area west of Olkaria Hill, but are absent in the east due to an east dipping high angle normal fault that passes through Olkaria Hill (Omenda 1994, Omenda, 2000). The Olkaria basalt underlies the Upper Olkaria volcanics in the area to the east of Olkaria Hill while the formation is absent to the west. The formation consists of basalt flows and minor pyroclastics and trachytes. The formation varies in thickness from 100 m to 500 m
The Upper Olkaria formation consists of comendite lavas and their pyroclastic equivalents, ashes from Suswa and Longonot volcanoes and minor trachytes and basalts (Thompson et al., 1963, Ogoso-Odongo, 1986, Clarke et al., 1990, Omenda, 2000). These rocks occur from the surface down to about 500 m depth. Comendite is the dominant rock in this formation. The youngest of the lavas is the Ololbutot comendite, which, has been dated at 180±50 yrs (Clarke et al., 1990
3.2 Structures in the Greater Olkaria volcanic complex
Structures in the Greater Olkaria volcanic complex include; the ring structure, the Ol’Njorowa gorge, the ENE-WSW Olkaria fault and N-S, NNE-SSW, NW-SE and WNW-ESE
trending faults (Figure 3). The faults are more prominent in the East, Northeast and West Olkaria fields but are scarce in the Olkaria Domes area, possibly due to the thick pyroclastics cover. The NW-SE and WNW-ESE faults are thought to be the oldest and are associated with the development of the rift. The most prominent of these faults is the Gorge Farm fault, which bounds the geothermal fields in the northeastern part and extends to the Olkaria Domes area. The most recent structures are the N-S and the NNE-SSW faults. Hydroclastic craters located on the northern edge of the Olkaria Domes area mark magmatic explosions, which occurred in submerged country (Mungania, 1992). These craters form a row along where the extrapolated caldera rim trace passes.
Dike swarms exposed in the Ol’Njorowa gorge trend in a NNE direction further attesting to the recent reactivation of faults with that trend. The development of the Ol’Njorowa gorge was initiated by faulting along the trend of the gorge but the feature as it is known today was mainly due to catastrophic outflow of Lake Naivasha during its high stands (Clarke et al., 1990). Volcanic plugs (necks) and felsic dikes occurring along the gorge further attests to the fault control in the development of this feature. Subsurface faults have been encountered in most Olkaria wells (KenGen, 2000). The wells encountered drilling problems when these faults were dissected due to cave-ins and loss of drilling fluids and cement. Materials recovered from these zones were mainly fault breccia.
0 4 km
L. NAIVASHA
Ololbutot
LE GEND Volcanic center
Rhyolite flow front
Eruptive crater
30o20'E
0o55'S
Volcanic plug
Ring fracture
Fault
Crater Lake
30o15'E
0o50'S
Olkaria Hill OLKARIAEAST FIELDOLKARIA
WEST FIELD
OLKARIADOMES FIELD
OLKARIA NEFIELD
Figure 3: The volcano tectonic map of the greater Olkaria volcanic complex showing the structures in the area.
4. GEOPHYSICS
Geophysical studies carried out in Olkaria geothermal area included resistivity, gravity, seismology and magnetics. The study is based on transient electromagnetic (TEM), DC schlumberger and Magnetotelluric (MT) soundings. The results from these measurements indicate that the low resistivity anomalies are controlled by structural trends and

Lagat et al.
4
that the geothermal resource is defined by a low resistivity of 15 Ω m at 1000 masl (Onacha 1990, 1993).
Gravity data within the Greater Olkaria area indicate that a dense body occurs at the southern part of Olkaria between the Ol’Njorowa gorge and the Suswa lineament. The Olkaria West, Olkaria East and Olkaria northeast fields occur within gravity lows. Dense dike material of rhyolitic composition occurs along the Ololbutot fault separating the western and eastern sectors of Greater Olkaria geothermal area. This system of dikes is thought to be a significant hydrogeological barrier between Olkaria West and Olkaria East and Olkaria Northeast fields.
Seismic monitoring of micro-earthquakes indicates that the Greater Olkaria geothermal area is characterized by a relatively high level of micro-earthquake activity (Simiyu et al., 1997, Simiyu et al., 2000). The analysis of focal depth, event location and classification shows that the high frequency events and deep low frequency events occur at the intersection of structures in the area. These shallow events are associated with fluid movements along the structures.
Residual aeromagnetic data acquired within the Rift Valley shows that Olkaria area has a positive anomaly that has a NW-SE trend. The negative anomalies correspond to normally magnetized rocks whereas the positive anomaly occurs in a demagnetized zone corresponding to the heat source that is of silicic origin. This provides some evidence for heat source at a temperature above the Curie point of magnetite (above 575oC) close to the surface (Onacha, 1990).
Figure 4: Cl-SO4-HCO3 diagram showing distribution of f reservoir fluid composition in Olkaria.
5. GEOCHEMISTRY OF OLKARIA FIELDS FLUIDS
The fluid chemistry of Olkaria fields indicates that the fluids in Olkaria West field contrasts with those of Olkaria East field and Olkaria Northeast field (Figure 4). In the Olkaria West field, the discharge is typically rich in bicarbonates but the Cl- content is very low. The Olkaria East fluid discharges have similar bicarbonates-carbonate concentration those in the Olkaria Northeast and relatively low deep reservoir Cl- concentrations as compared to Olkaria Northeast concentrations. Olkaria Central wells give deep reservoir Cl- concentrations except for well OW-201, which gives higher values. These wells produce waters with relatively high reservoir CO2 concentrations similar to those of Olkaria West field wells. Olkaria Domes wells discharge mixed sodium bicarbonate-chloride-sulphate type
with low chloride concentrations (Karingithi et al., 1997, Karingithi, 2000).
Reservoir temperatures have been calculated using chemical geothermometers and the results indicate the K/Na ratio function by Arnorsson et al (1983) give aquifer temperature values for the Olkaria East field ranging from 199-275°C. In the Olkaria Northeast field, the temperatures range is from 215-302°C for the Olkaria West field, temperatures indicate values of 180-264°C. Reservoir temperatures calculated using the quartz geothermometry function by Fournier et al (1982) indicate Olkaria East field wells give aquifer temperatures ranging from 172-272°C, Olkaria Northeast field wells have values ranging from 195-304°C whereas Olkaria Central field give values ranging from 186-259°C. In Olkaria Domes field, the highest mean solute equilibrium temperatures of 242°C was shown in well OW-903 while wells OW-901 and OW-902 showed slightly lower mean equilibrium temperatures of 238°C and 232°C respectively.
6. SAMPLING AND ANALYTICAL METHODS
Cuttings samples from Olkaria Domes wells were taken at every 2 m interval. Very few and unrepresentative cores were cut in Olkaria Domes field and therefore nearly all the descriptions and interpretations are based on cuttings samples.
Binocular analysis of the cuttings samples was done using the Wild Heerbrugg binocular microscope. A sample is scooped from the sample bag into a petri dish and washed with clean water to remove impurities and dust. Wetting the cuttings is necessary to enhance visibility of samples and obscure features such as finely disseminated sulphides e.g. pyrite.
Representative samples from all the lithologic units encountered in the three wells were selected and thin sections prepared for petrographic studies. The thin sections were analyzed using the Leitz Wetzler petrographic microscope.
The X-ray diffractometer is used to identify individual minerals especially clays and zeolites. Samples were selected from all the lithologic units and analysed for clays. The <4 microns fractions were prepared for X-ray diffraction by use of a mechanical shaker to separate the phyllosilicates from the rock matrix. Qualitative analysis samples of the selected minerals were crushed into fine powder (5-10 microns) and smeared into a quartz plate. To avoid loss of samples, acetone is normally added to the sample. A Phillips PW 1800 diffractometer, with CuKα radiation (at 40 kV and 50 mA), automatic divergence slit, fine receiving slit, and graphite monochrometor was used for both analyses.
Double-polished thick sections (approximately 70 microns) of cuttings from Olkaria Domes wells, which contained abundant quartz and calcite in veins, were prepared for fluid inclusion analysis. The fluid inclusions were heated until the fluid homogenizes in a single phase (i.e. bubble disappears) and the temperature of homogenization (Th) is measured.
Electron microprobes permit the non-destructive, major and trace element analysis of small areas (~4µm diameter) of solid materials insitu. Selected thin sections from Olkaria Domes which were prepared and analysed by Karingithi (2002) using the electron microprobe have been made use for the present study. The analysis of minerals was carried

Lagat et al.
5
out using an updated ARL-SEMQ (Scanning Electron Microprobe Quantometer). The analysis was done at 15 kV with sample current of 15 nA and a beam diameter of 2-3 micrometers.
XRF analysis of major elements of cuttings samples from Olkaria Domes was carried out at Activation Laboratories Ltd, Canada. The samples were run for major oxides and selected trace elements on a combination simultaneous/sequential Thermo Jarrell-Ash ENVIRO II ICP.
7. RESULTS
7.1 Lithology
Wells OW-901, OW-902 and OW-903 whose altitudes are 1890 masl, 1957 masl and 2043 masl were drilled to depths
of -309 meters above sea level (masl), -243 masl and -159 masl respectively. The drilled lithological column is composed of unconsolidated pyroclastics that are dominant in the shallow levels overlying a volcanic sequence whose lithological composition is dominated by comenditic rhyolite, trachyte, basalt, tuff and some doleritic and syenitic dykes. The lithologic units encountered in the three wells are shown in Figures 5, 6 and 7. Chemical analysis of surface and subsurface rock samples from the flanks and within Greater Olkaria geothermal area show that the volcano complex is composed of rocks ranging in composition from basalt to rhyolite (Browne, 1984, Clarke et al., 1990, MacDonalds et al, 1987, Omenda, 2000).
Figure 5: Lithology, distribution of hydrothermal alteration minerals, mineral zonations, and location of aquifers in well OW-901. Legend on lithology is as in Figure 8 below.

Lagat et al.
6
Figure 6: Lithology, distribution of hydrothermal alteration minerals, mineral zonations, and location of aquifers in well OW-902. Legend on lithology is as in Figure 8 below.
7.1.1 Stratigraphic cross section along Olkaria East and Olkaria Domes fields
Geologic cross section across wells OW-08, OW-09, OW-15, OW-19 and OW-22 in Olkaria East field and wells OW-901, OW-903 and 902 in Olkaria Domes shown in Figure 7 has revealed to some extent the geological structural system between the two fields. The structures in the area are composed of faults, intrusions and extrusion of rhyolitic domes. The stratigraphy of Olkaria Domes field shows some similarity to that of Olkaria East field, with the top 200 m being made up of mainly unconsolidated pyroclastics. The pyroclastic unit thins towards well OW-903 due to erosion because the area is topographically high but thickens towards well OW-902. The upper trachytes and upper basalts are thick in Olkaria East field but thin towards Olkaria Domes.
7.2 Hydrothermal alteration
In the Olkaria Domes geothermal field, hydrothermal alteration minerals appear both as replacement of the primary minerals, as well as fillings in vesicles, vugs and fractures. The distribution and abundance of the hydrothermal minerals were obtained from the petrographic studies of drill cuttings samples taken after every 2 m from the three exploration wells drilled in the area.
Factors that influence the distribution and kind of mineral assemblages present in hydrothermal systems include permeability, rock and water composition, temperature, pressure and duration of hydrothermal alteration (Browne and Ellis, 1970). These factors are largely independent, but the effects of one or more of the factors can exert a

Lagat et al.
7
dominant influence in the location and extent of hydrothermal alteration.
Permeability of the rocks controls the access of thermal fluids, which cause hydrothermal alteration of the rocks and precipitation of secondary minerals in open spaces. The chemical composition of the host rock determines the availability of components to form alteration minerals as well as possible fugitive components from the presumed
magmatic heat source. Temperature is the most significant factor in hydrothermal alteration because most of the chemical reactions require elevated temperatures and also minerals are thermodynamically stable at high temperatures. Pressures at the depths penetrated by Olkaria Domes drill holes, like in other geothermal fields elsewhere in the world are not sufficient to greatly affect hydrothermal alteration minerals transformation (Browne and Ellis, 1970).
Figure 7: Lithology, distribution of hydrothermal alteration minerals, mineral zonations, and location of aquifers in well OW-903. Legend on lithology is as in Figure 8.

Lagat et al.
8
Figure 8: Lithologic cross-section across Olkaria East and Olkaria Domes fields
Although hydrothermal alteration has changed the primary minerals in different ways and magnitude, often the original textures and minerals are still recognizable. The main hydrothermal minerals in Olkaria Domes field are albite, amphibole (actinolite), biotite, calcite, chlorite, chalcedony, epidote, fluorite, garnet, illite, K-feldspar (adularia), mordenite, secondary Fe-Ti oxides, sulfides (pyrite), titanite (sphene) and quartz. In addition, minor amounts of wairakite and prehnite are present. Mineral associations in vesicles are common and consist of two or more of the following minerals; chlorite, quartz, calcite, epidote and pyrite with the paragenetic sequence varying with depth and from one well to another. Table 1 below shows the primary minerals observed in Olkaria Domes geothermal field and their alteration products.
Table 1: Primary minerals, order of replacement and alteration products of Olkaria Domes volcanics (modified from Browne, 1984a)
Primary phases Alteration products
Volcanic glass Zeolites, clays, quartz, calcite
Olivine Chlorite, actinolite, hematite, clay minerals
Pyroxenes, amphiboles
Chlorite, illite, quartz, pyrite, calcite
Ca-plagioclase Calcite, albite, adularia, quartz, illite, epidote sphene
Sanidine, orthoclase, microcline
Adularia
Magnetite Pyrite, sphene, haematite
7.2.1 Distribution of hydrothermal alteration minerals
The distribution of hydrothermal alteration minerals in wells OW-901, OW-902 and OW-903 are shown in Figures 5, 6 and 7 respectively. In all the three wells at shallow depths, low temperature phases occur with mainly silica, calcite, zeolites, phyllosilicates, oxides and sulphides being the alteration minerals present. In the deeper parts of the wells, however, hydrothermal alteration to ranged from
high to extensive. Hydrothermal zeolites, calcite, epidote, phyllosilicates, silica, sulphides, epidote, albite, adularia, biotite, garnet, fluorite, prehnite, oxides and titanite are the alteration minerals observed. The hydrothermal alteration mineralogy patterns show prograde alteration with increase in temperature and depth with the low temperature phases disappearing as the high temperature phases appear. In well OW-902, however, garnet, which is a high temperature alteration mineral was observed at depths where the current measured formation temperature is 246°C. This phase now exist where the present temperature is much lower than what would be expected from its thermal stability range, which is over 300°C. This indicates that cooling must have occurred in that part of the field and that the mineral is relict.
7.2.1 Hydrothermal mineral zonations
Based on hydrothermal alteration minerals assemblages in Olkaria Domes geothermal field, four alteration zonations can be recognized with a possibility of one or two sub-zones (Figure 5, 6 and 7). The zones are; (1) the zeolite-chlorite zone, (2) the illite-chlorite zone, (3) the epidote-illite-chlorite zone and (4) the garnet-biotite-actinolite zone. The upper few hundred meters of each well is unaltered. The zeolite-chlorite zone, which occurs immediately below the unaltered zone, is about 400 m in wells OW-901 and OW-902 and 500 m thick in well OW-903. Other minerals characterized by this zone include chalcedony, pyrite and to a lesser extent calcite. The illite-chlorite zone is not present in well OW-902 and is about 330 m thick in wells OW-901 and OW-903. The chlorite-illite-epidote zone is 450 m in both wells OW-901 and OW-903 and in well OW-902 the zone occurs to the bottom of the well. The garnet-biotite-actinolite zone is over 650 m in both wells OW-901 and OW-903 but is absent in well OW-902. The mineral assemblages (biotite and actinolite) representing the zone were not observed in well OW-902 and although petrographic analysis did not detect garnet, electron microprobe analysis was able to detect it at 9-3 masl. Other minerals associations in this zone include chlorite, pyrite, epidote, prehnite and wairakite.
7.4 Mineralogical evolutions
The paragenetic sequences in hydrothermal systems are identified from crosscutting veins and amygdale infilling

Lagat et al.
9
sequences. Due to exclusive use of rotary bits and very few and unrepresentative cores having been cut at Olkaria Domes field, most of the macroscopic vein fillings and amygdales textures providing information on the time relationships were lost. The reconstruction of the paragenetic sequences is difficult from the microscopic veins and vesicles since the sequences are highly variable and depict local conditions. Most likely all the high temperature veins or vesicle filling minerals have been forming over a period of time and all forming at more or less the same time with their deposition being governed by the kinetics of mineral dissolution and their precipitation.
7.5 Fluid inclusion geothermometry
The homogenization temperatures (Th) of fluid inclusions in Olkaria Domes field samples were measured to determine the formation temperatures during their entrapment. These inclusions are all hosted by calcite and quartz, which occurs widely in the geothermal system. The Th values at 240 masl in well OW-901 ranged from 238-272°C in quartz veins and from 280-320°C in calcite veins. The formation temperature at this depth is 314°C. The lowest Th value (238°C) in quartz veins from this well is 76°C below the measured formation temperature and the highest value (272°C) is 42°C below to the measured formation temperature (314°C). The average value for the inclusions in quartz veins is 256 °C and is 58 °C below the measured formation temperature. In the calcite veins the lowest Th value of 280°C is 34°C below the measured formation temperature and the highest Th value (320°C) is 6°C above the measured formation temperatures (314°C). The average value for the inclusions in the calcite vein is 301°C and is 13°C below the measured formation temperature. These measurements indicate the inclusions in calcite vein represent close to the current formation temperatures whereas the quartz veins indicate past cooler conditions. If this interpretation is valid, it implies that the silica in quartz precipitated from hotter fluids is mostly derived from the primary feldspars of the rock and not of the earlier quartz precipitated under cooler conditions.
In well OW-902 at 689 masl Th values in inclusions hosted in quartz veins ranged from 210-256°C with an average of 237°C, whereas the formation temperature at this depth is 247°C. In well OW-902, the highest value from the Th value (256°C) is equivalent to the boiling point curve value (256°C) and 8°C above the measured formation temperature of 247°C. The lowest Th value (210°C) is 37°C lower than the maximum measured formation temperature. The average Th value of 237°C in this well corresponds fairly well with the present day conditions.
The Th values of inclusions in quartz veins at 517 masl in well OW-903 varied widely between 178-275°C with an average of 219°C whereas the formation temperature at this depth is 265°C. The lowest Th value of 178°C is 87°C lower than the measured formation temperature suggesting that the fluids were trapped when temperatures were lower than the present day values. The highest Th measurement of 275°C is 10°C higher that the measured formation temperature indicating that the fluids in these inclusions were trapped at nearly the same temperatures as current measured formation temperatures. The fluid compositions could not be determined because the inclusions were very tiny and was difficult to measure the melting temperature (Tm)
7.6 Measured, hydrothermal alteration and fluid inclusion temperatures
In any geothermal system, there is always some uncertainty whether observed minerals distribution and zonations reflect current formation temperatures or are related to some previous thermal events or regimes. In the Greater Olkaria geothermal area as in other geothermal fields throughout the world, hydrothermal alteration minerals are important indicators of subsurface thermal changes. A correlation between measured, hydrothermal alteration and fluid inclusion temperatures indicate how a particular geothermal system has evolved with time.
Figure 9 shows the correlation between measured, interpreted hydrothermal alteration and fluid inclusion temperatures in well OW-901. Geothermometry of alteration minerals and fluid inclusions in well OW-901 indicate that there has been some heating. However, calcite veins with homogenization temperatures averaging 301°C closely reflect current conditions in the reservoir. High temperature hydrothermal alteration minerals e.g. epidote, biotite, actinolite and garnet seem to be in equilibrium with the present geothermal system in well OW-901, with all the minerals occurring within their temperature stability ranges.
Figure 9: Plot of lithology and correlation between measured, interpreted hydrothermal alteration minerals and fluid inclusion temperatures with depth of well OW-901.
The correlation between measured, interpreted hydrothermal alteration and fluid inclusion temperatures in well OW-902 shown in Figure 10 indicate probable cooling with hydrothermal minerals occurring below their stability temperature ranges. Here garnet occurs where the measured formation temperature is below its temperature stability range indicating it is relict. Fluid inclusion temperatures, however, seem to reflect current conditions with the average homogenization temperature of 237°C being close to the measured formation temperatures of 247°C.

Lagat et al.
10
Figure 10: Plot of lithology and correlation between measured, interpreted hydrothermal alteration minerals and fluid inclusion temperatures with depth of well OW-902.
Figure 11: Plot of lithology and correlation between measured, interpreted hydrothermal alteration minerals and fluid inclusion temperatures with depth of well OW-903.
Well OW-903 (Figure 11) had average fluid inclusion temperatures in quartz veins way below the measured formation temperatures with an average of 219°C while the measured formation temperature at that depth is 265°C.
This indicates that there has been heating in the system since the inclusions were trapped. The interpreted hydrothermal alteration temperatures indicate that the alteration minerals are in equilibrium with the geothermal system with illite, epidote, biotite, garnet and actinolite all occurring within their temperature stability ranges.
Index minerals used to construct isograds across wells OW-901, OW-903 and OW-903 in Olkaria Domes field include actinolite, chlorite, epidote, garnet and illite. Isograds give a general picture of the temperature distribution in a geothermal system. Strictly speaking, however, a definite isograd (e.g. the epidote isograd) does not necessarily represent a definite temperature. The distribution of hydrothermal minerals isograds is not distinctly parallel to the isothermal contours (Figure 12) indicating that hydrothermal alteration is not a function of subsurface temperature only but the rock composition also influences the kinetics of the hydrothermal alteration minerals formation. The isograds clearly indicate high and shallow temperatures towards well OW-901 and low temperatures towards well OW-902. In well OW-902, below 1000 masl, the temperature becomes more or less isothermal, with very little or no change with depth. Biotite and actinolite were not encountered in the well, but garnet was encountered at temperatures well below its stability temperature range.
2100
1500
1100
900
300
-100
-300
1900
1700
1300
700
500
100
Dep
th(m
.a.s
.l)
OW-901
OW -903
OW-902
100°C
125°C
150°C
175°C
225°C
200°C
230°C240°C240°C
245°C
248°C
275°C
300°C
325°C
340°C
Epidote isograd
Act inoliteisograde
Chlorite isograd
Illiteisograd
Garnet isograd
?
Figure 12: Plot of epidote, illite, chlorite, actinolite and garnet isograds and measured temperature isotherms across wells OW-901, OW-903 and OW-902
4.9 Aquifers
Sources of permeability in Olkaria Domes geothermal field include fractures and joints due to intrusions and along edges of plugs and domes, lithological contacts, joints, clast-matrix or fragment contacts in some breccias. Permeable zones in the field were interpreted by loss or gain of circulation fluid, hydrothermal alteration mineralogy patterns, and temperature recovery tests. Indicators of high permeability in Olkaria Domes geothermal system apart from high alteration intensity and sheared rocks include presence of abundant pyrite and

Lagat et al.
11
calcite. These minerals are commonly found in or adjacent to aquifers penetrated by the wells and occur as alteration of the rock as well as in veins often as coarse grains. Low permeability on the other hand apart from absence of the above minerals is indicated by low alteration and presence of tight veins.
Completion test carried out in Olkaria Domes wells indicated that OW-903 is more permeable than the two other exploration wells OW-901 and OW-902. This agrees with the higher fracture permeability encountered in well OW-903 compared to wells OW-901 and OW-902 (Ofwona 1999).
8. CONCEPTUALIZED GEOLOGICAL MODEL OF OLKARIA AREA
The conceptualized geological model, which is an update of the earlier model (KenGen 2000) and includes Olkaria Domes field indicate an inflow along the N-S striking fault west of the drill holes, an upflow around well OW-901 and the outflow to the south and east towards well OW-902 and OW-903. The pressure pivot point in well OW-901 is at 790 masl and the average pressure at that depth is 65.4 bars. In well OW-902 the pressure pivot point is located at 1057 masl and the pressure at the point averages 40.6 bars and in well OW-903 the pressure pivot point is located at 1143 masl and the averages pressure at the point averages 39.6 bars. From the pressure differences between the wells, it is clear that there is a pressure drop from well OW-901 towards wells OW-902 and OW-903 indicating that these wells are located in the outflow zones. The upflow zone is located in area around well OW-901. The updated model is shown in Figure 13.
9. DISCUSSION
The geology of the Greater Olkaria geothermal area is dominated by Pleistocene to Holocene comenditic rhyolite flows on the surface and tuffs, basalts, trachytes and minor
dolerite and microsyenite intrusives in the subsurface. Major elements analyses of rocks from Olkaria Domes indicate their composition to range from basalt through trachyte to rhyolite. Their compositions plot in the same field as those of analysed samples from Olkaria East, Olkaria Northeast and the unaltered surface rocks. A geological cross section across wells from Olkaria East field and Olkaria Domes indicate no major structural divide between the two fields and the same formations occur in both fields.
Understanding subsurface geological structures of a geothermal area is essential in determining the factors that control the ascent of the geothermal fluid. It is also necessary to determine whether all faults in the existing fault pattern are equally important as channelways, or whether some faults are more permeable than others. The form of mineralization and alteration associated with faults is highly variable, and may include massive to fine-grained, networks of veinlets, and occasionally vuggy textures in some breccias as observed in Olkaria Domes wells.
On the surface at Olkaria Domes area, the distribution of geothermal manifestations is strongly associated with structural features. Fumarolic activities are concentrated along the ring structure on the eastern side of the field and along the N-S trending fault (Mungania, 1992; Clarke et al 1990). The manifestations indicate these structures are deep seated and extend into the geothermal system. Drilling of the three exploration wells in the Olkaria Domes field has revealed to some extent the structural patterns of the area. The area is crossed by faults and fractures as revealed by fault breccias, sheared zones and circulation losses experienced during drilling. Only certain buried faults provide efficient conduits for the ascent of geothermal fluid.
Figure 13: Updated conceptualized geological model of the Greater Olkaria geothermal area showing generalized geology and the locations of the field with respect downflow, upflow and the outflow zones.
Lagat et al.
12
Primary feeders of geothermal fluids seem to be fissured zones associated with subsurface faults and contact zones between the formations. Main feeders of geothermal fluids in the area seem to be fissured zones associated with subsurface faults and contact zones between the formations. Such feeders were intercepted by all the three wells and are identified by loss zones, quick recovery in temperature profiles, sheared rocks and abundant calcite and pyrite in veins.
Hydrothermal minerals are mainly present in veinlets, vugs and as replacements of primary minerals in the volcanic rocks. Their distribution in this geothermal system is similar to the prograde variations observed in other geothermal fields. Due to their ubiquity and reactivity as a function of the physico-chemical environment of crystallization, clay minerals have been used as markers of paleoconditions in both fossil and active geothermal systems. They have proved to be useful in particular temperature estimations, which were based either on modification of crystal structure or modification of crystal chemistry of the crystallites. The regular change with depth seen in Olkaria Domes is from chlorite at shallower levels, followed by both illite and chlorite virtually to the bottom of the wells. Swelling chlorite and corrensite were restricted to basaltic formations at medium depths. On the basis of hydrothermal alteration minerals and their variation with depth, four hydrothermal mineral zonations can be recognized in the order of increasing temperature and depth. They are; (1) the zeolite-chlorite zone, (2) the illite-chlorite zone, (3) the epidote-illite-chlorite zone and (4) the garnet-biotite-actinolite zone. The upper few hundred meter of each well is unaltered. The illite-chlorite zone is absent in well OW-902 due to the presence of epidote at shallow levels, hence illite-chlorite-epidote occurring at a shallower depth. The garnet-biotite-actinolite is also absent in well OW-902 due to the absence of the index minerals representing the zone.
The homogenization temperatures (Th) of fluid inclusions in quartz and calcite are particularly reliable predictors of past to present subsurface temperatures. The fluid inclusion temperatures in Olkaria Domes wells generally ranged from 178 to 320°C. The Th values at 240 masl in well OW-901 ranged from 238-272°C in quartz veins and from 280-320°C in calcite veins. The formation temperature at the depth is 314°C. In well OW-902 at 689 masl, the Th values in inclusions hosted in quartz veins ranged from 210-256°C with an average of 237°C. The formation temperature at the depth is 247°C. The Th values at 517 masl in well OW-903 varied widely between 178-275°C with an average of 219°C. The formation temperature at the depth is 265°C. Under ideal conditions the quartz in veins is supposed to dissolve and precipitate if the geothermal fluid is undersaturated with respect to silica and new inclusions are formed. In this case the source of silica could be from the feldspars hence the geothermal fluid is saturated with respect to silica and the quartz veins hosting past fluid inclusions are preserved. The fluid inclusions in calcite veins have Th values close to the measured formation temperatures and therefore it must have been deposited in the present conditions of the reservoir, hence represent the current state of the reservoir. The inclusions therefore indicate that wells OW-901 and OW-903 have undergone some heating while well OW-902 has undergone some cooling.
Temporal changes in Olkaria Domes field must have occurred in the past. The age of the geothermal system at Olkaria system is not exactly known but there is evidence
that during its lifetime, the thermal activity has changed both in location and character. The occurrence of quartz and other hydrothermal alteration minerals, which line joints in dykes, exposed within Ol’Njorowa gorge show that at some time in the past these dikes clearly served as fluid channels. Intuitively one would expect that the intrusion of Holocene lavas such as Ololbutot would induce profound changes in the Olkaria subsurface thermal regime (Browne 1984). There are no data available on the alteration ages, however, textures and fluid inclusion temperatures show the existence of at least two thermal episodes in the past. The presence of high-temperature minerals at shallow depths is associated with an early stage of hydrothermal activity. Petrographic studies show that some high temperature minerals, such as garnet are present at depths whose formation temperatures are low. A sample analysed using electrode microprobe in well OW-902 at 9-3 masl had garnet and the measured temperatures at that depth is 246°C. This phase now exist where the present temperature is much lower than what would be expected from the thermal stability range of garnet, which is above 300°C (Bird et al., 1984). Homogenization temperatures indicate there has been some heating in the portion of the field around wells OW-901 and OW-903. The portion of the field around well OW-902 indicates cooling must have occurred. It can be concluded that some part of the active geothermal system at Olkaria Domes field as undergone some heating while some parts have undergone some cooling. The heating could be attributed to tectonics leading to increased activity in the area as evident by the recent Ololbutot eruption, which has been dated at 180±50 yrs B.P (Clarke et al., 1990).
Subsurface temperature distribution in the Olkaria Domes geothermal field was estimated from temperature recovery tests, shut-in temperature profiles, hydrothermal alteration mineralogy and fluid inclusion measurements. Well OW-901 in its undisturbed state, the formation temperature profile is close to the boiling point curve. The thermal pattern indicates clearly that the maximum temperatures in the Olkaria Domes geothermal field occur around well OW-901. The temperature in well OW-901 is over 342°C close to the bottom at a depth of -260 masl. The thermal gradient at depth decreases slightly to the southeast towards well OW-903 and sharply to the southwest towards well OW-902, suggesting that the area towards well OW-902 is cold and probably in the marginal parts of the field. The observation from the temperature and pressure profiles indicate both pressure and temperature drop from well OW-901 to wells OW-902 and OW-903 indicating that the latter two wells are located in the outflow zones. Hydrothermal alteration mineralogy, fluid inclusion temperatures and temperature profiles indicate well OW-902 to be in the marginal zones of the field.
10. CONCLUSIONS
1. The lithology of Olkaria Domes is composed of pyroclastics, tuffs, rhyolites, trachytes and basalts with minor dolerite and microsyenite intrusives and are similar to those encountered in other Olkaria fields
2. Apart from a major fault occurring between Olkaria Domes and Olkaria East field, there is no major structural divide between the two fields.
3. Sources of permeability in Olkaria Domes field are both primary and secondary and include; fractures and thermally induced joints, lithologic contacts, clast-matrix or fragment contacts in breccias.

Lagat et al.
13
4. Indicators of high permeability in Olkaria Domes geothermal area are; high alteration intensity and sheared rocks, large veins and occurrence of abundant pyrite and calcite. Low permeability on the other hand low alteration is indicated by and absence of the above minerals and tight veins.
5. Hydrothermal alteration mineral assemblages in Olkaria Domes are mainly controlled by temperature, rock type and permeability.
6. Hydrothermal alteration mineralogy indicate equilibrium conditions in the sector around wells OW-901 and OW-903. However in the sector around well OW-902, hydrothermal alteration mineralogy indicate possible reservoir cooling.
7. Four hydrothermal zonations are recognized in Olkaria Domes. They are the zeolite-chlorite zone, the illite-chlorite zone, the epidote-illite-chlorite zone and the garnet-biotite-actinolite zone.
8. Temporal changes have occurred in Olkaria Domes with heating of up to 60°C recorded. This could be attributed tectonics in the area resulting to intrusion and extrusion of lavas such as Ololbutot, which would induce profound changes in the subsurface thermal regime resulting to heating.
9. The observation from alteration minerals isograds, pressure and temperature profiles indicate that well OW-901 is drilled close to the upflow zone whereas well OW-902 and OW-903 are in the outflow zones of the field. Well OW-902 is in the marginal zone of the field.
10. Olkaria Domes having the same lithology like those of other Olkaria fields and no influx of cold water is noted below 700 m, the production casing should be set at similar depths like other Olkaria wells.
11. REFERENCES
Arnorsson, S., Gunnlaugsson, E., and Svarvarson, H., 1983: The chemistry of geothermal waters in Iceland III. Chemical geothermometry in geothermal investigations. Geochim. Cosmochim. Acta, 46, 1513-1532.
Baker, B. H., Williams, L. A. J., Miller, J. A., and Fitch, F. J., 1971: Sequence and geochronology of the Kenya Rift volcanics. Tectonophysics, Vol. 11, 191-215.
Baker, B. H. and Wohlenberg, J., 1971: Structural evolution of the Kenya Rift Valley. Nature Vol. 229, 538-542.
Baker, B. H, Mohr, P. A, and Williams, L. A. J., 1972: Geology of the Eastern Rift System of Africa. Geological Society of America. Special Paper 136, 1-67.
Baker, B. H., 1987: Outline of the petrology of the Kenya rift alkaline province. In Fitton, J. G., and Upton, B. G. J., (Eds), Alkaline igneous rocks. Geol. Soc. Spec. Publ. #30, 293-311.
Bird, D. K., Schiffman, P., Elders, W. A., Williams, A. E. and McDowell, S. D., (1984): Calc-silicate mineralization in active geothermal systems. Economic geology, Vol. 79, 671-695.
Browne, P. R. L., Ellis, A. J., 1970: The Ohaki-Broadlands hydrothermal area, New Zealand: Mineralogy and
related chemistry. American Journal. of Science 269, 97-133.
Browne, P. R. L., 1984: Subsurface stratigraphy and hydrothermal alteration of Eastern section of the Olkaria geothermal field, Kenya. Proceeding, 6th New Zealand Geothermal Workshop, Geothermal Institute, Auckland, 33-41.
Clarke, M. C. G., Woodhall, D. G., Allen, D. and Darling, G., 1990: Geological, volcanological and hydogeological controls of the occurrence of geothermal activity in the area surrounding Lake Naivasha, Kenya. Ministry of Energy report.
Fournier et al, R. O and Potter, R. W. II, 1982: A revised and expanded silica (quartz) geothermometer. Geothermal Resource Council Bulletin, 11-10, 3-13.
Hay, D. E., Wendlandt, R. F and, Wendlandt, E. D., 1995a: The origin of Kenya rift plateau type flood phonolites: evidence from geochemical studies for fusion of lower crust modified by alkali basaltic magmatism. Journal of Geophysics Research, Vol. 100, 411-422.
Henry, W. J., Mechie, J., Maguire, P. K. H., Khan, M. A., Prodehl, C., Keller, G. R., and Patel, J., 1990: A seismic investigation of the Kenya rift valley. Geophysics Journal International, Vol. 100, 107-130.
Kampunzu, A. B. and Mohr, P., 1991: Magmatic evolution and petrogenesis in the East African Rift System. In Kampunzu, A. B. and Lubala, R. T. (eds.), Magmatism in extensional structural settings: The Phanerozoic African plate. Springer-Verlag, 85-136.
Karingithi, C.W., and Wambugu, J.M., 1997: Olkaria Geochemical Model. Kenya Power Company internal report.
Karingithi, C.W., 2002: Hydrothermal mineral buffers controlling reactive gases concentration in the Greater Olkaria geothermal system, Kenya. United Nations University, Report 2, Geothermal Programme MSc thesis, University of Iceland, 46-47.
KenGen, 2000: Conceptualized model of Olkaria geothermal field. Compiled by Muchemi G. G. The Kenya Electricity Generating Company Ltd internal report p. 13
Macdonald, R., Davies, G.R., Bliss, C.M., Leat, P.T., Bailey, D.K. and Smith, R.L., (1987): Geochemistry of high silica peralkaline rhyolites, Naivasha, Kenya rift valley. Journal of Petrology, Vol. 28, 979-1008.
Mungania, J., (992: Preliminary field report on geology of Olkaria volcanic complex with emphasis on Domes area field investigations. Kenya Power Company internal report.
Naylor, W. I., 1972: The geology of the Eburru and Olkaria geothermal projects. Geothermal Resource Exploration Prospects, UNDP report. Restricted.
Ofwona, C. O., 1999: Completion tests report for well OW-903. KenGen internal report.
Ogoso-Odongo, M., E., 1986: Geology of Olkaria geothermal field. Geothermics, Vol. 15, 741-748.
Omenda, P. A., 2000: Anatectic origin for Comendite in Olkaria geothermal field, Kenya Rift; Geochemical evidence for syenitic protholith. African Journal of

Lagat et al.
14
Science and Technology. Science and Engineering series, Vol. 1, 39-47.
Omenda, P.A. 1990. Update of the geology of the Olkaria West and Central fields. Kenya Power Company internal report.
Onacha, S. A., 1990: Olkaria West Field information report. Kenya Power Company internal report.
Omenda, P. A., 1994: The geological structure of the Olkaria west geothermal field, Kenya. Stanford Geothermal Reservoir Engineering Workshop, Vol. 19, 125-130.
Onacha, S. A., 1993: Resistivity studies of the Olkaria-Domes geothermal project. Kenya Power Company internal report.
Shackleton, R. M., 1986: Precambrian collision tectonics in Africa. In: Coward, M. P. and Ries, A. C. (eds.). Collision Tectonics. Geol. Soc. Spec. Publ. No. 19, 329-349.
Simiyu, S. M. and Keller, G. R., 1997: An integrated analysis of lithospheric structure across the East African plateau based on gravity anomalies and recent seismic studies. In: Structure and dynamic processes in the lithosphere of the Afro-Arabian rift system. Fuchs, K., Altherr, R., Müller, B., and Prodehl, C. (eds.). Tectonophysics, Vol. 278, 291-313.
Simiyu, S. M., Malin, P. E., 2000: A “volcano seismic” approach to geothermal exploration and reservoir monitoring: Olkaria, Kenya and Casa Diablo, U. S. A. Proceedings of the World Geothermal Congress 200, Kyoto-Tohoku Japan, 1759-1763
Smith, M. and Mosley, P., 1993: Crustal heterogeneity and basement influence on the development of the Kenya rift, East Africa. Tectonics, Vol. 12, 591-606.
Smith, M., 1994: Stratigraphic and structural constraints on mechanisms of active rifting in the Gregory Rift, Kenya. In: Prodehl, C., Keller, G. R., and Khan, M. A., (eds.): Crustal and upper mantle structure of the Kenya rift. Tectonophysics, Vol. 236, 3-22.
Thompson, A.O. and Dodson, R.G., 1963: Geology of the Naivasha area. Geological Survey Kenya, report No. 55.
VIRKIR Consulting Group. 1980: Geothermal development at Olkaria. Report prepared for Kenya Power Company.
Williams, L. A. J., 1972: The Kenya rift volcanics: a note on volumes and chemical composition. Tectonophysics, Vol. 15, 83 - 96.