geometallurgical block model vs geometallurgical units · megascopic rock mass geological mapping...
TRANSCRIPT
Geometallurgical Block Model vsGeometallurgical Units
Bch. Ing. MSc.Samuel CanchayaMoya
Gerente General SAMPLING OK SACCatedrático UNI y PUCP-Lima Perú
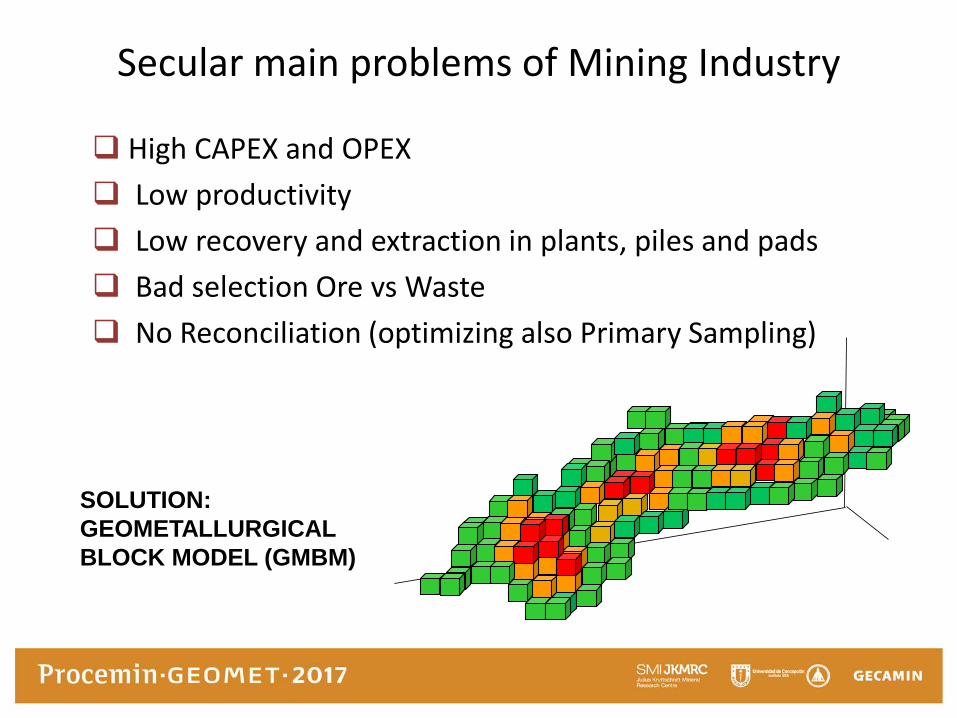
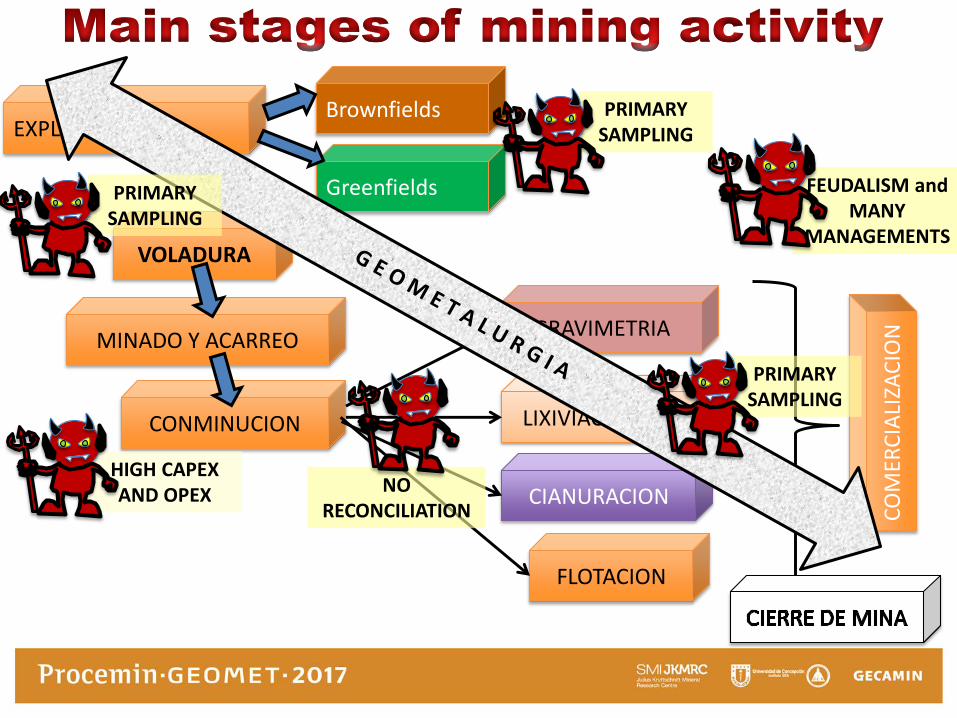
Secular main problems of Mining Industry
High CAPEX and OPEX
Low productivity
Low recovery and extraction in plants, piles and pads
Bad selection Ore vs Waste
No Reconciliation (optimizing also Primary Sampling)
SOLUTION:
GEOMETALLURGICAL
BLOCK MODEL (GMBM)
EXPLORACIONESBrownfields
Greenfields
MINADO Y ACARREO
CONMINUCION
GRAVIMETRIA
LIXIVIACION
FLOTACION
VOLADURA
CIANURACION
CO
MER
CIA
LIZA
CIO
N
HIGH CAPEX AND OPEX
PRIMARYSAMPLING
FEUDALISM andMANY
MANAGEMENTS
PRIMARYSAMPLING
NO RECONCILIATION
PRIMARYSAMPLING
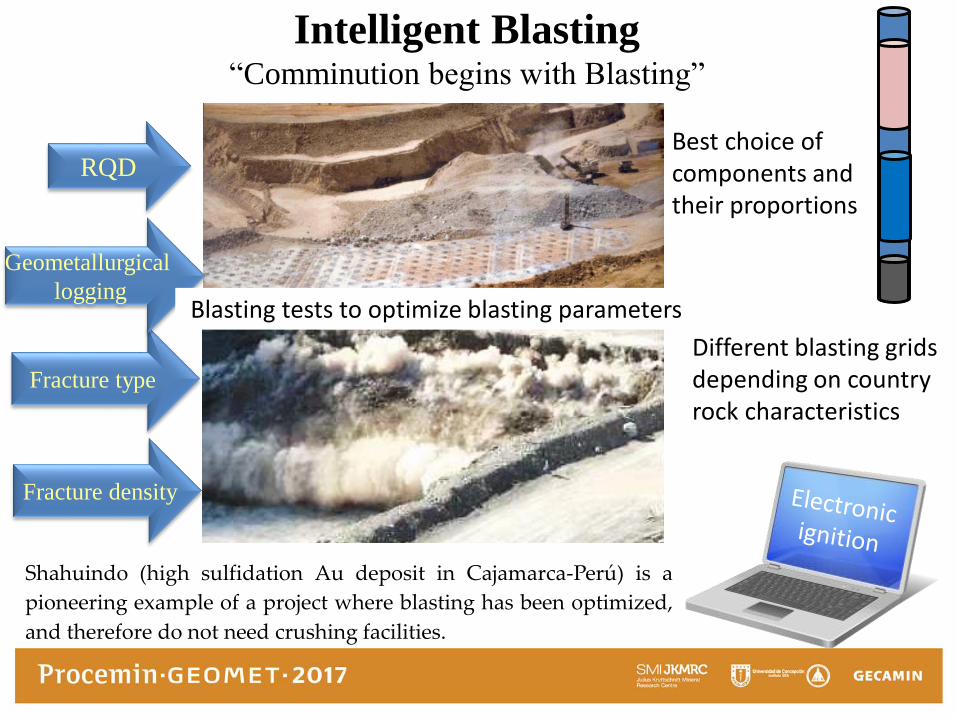
Intelligent Blasting“Comminution begins with Blasting”
RQD
Fracture type
Fracture density
Best choice of components and their proportions
Different blasting grids depending on country rock characteristics
Geometallurgical
logging
Shahuindo (high sulfidation Au deposit in Cajamarca-Perú) is a
pioneering example of a project where blasting has been optimized,
and therefore do not need crushing facilities.
Blasting tests to optimize blasting parameters
The “Total Rock Concept” (TRC)
The philosophical basis of the Geometallurgy, in how we propose and apply it, is the TOTAL ROCK CONCEPT (TRC) as defined by Canchaya (2008).
This concept considers the rock as a whole and that designations of ore and waste are circumstantial and established by the human being based on their requirements or currently needs generally juncture or cultural.
Therefore, the differentiation between ore and gangue will be only a valid exercise if they are considered as parts of a whole.
The assumption of the TRC means the reconciliation of the ORE with the GANGUE; in a certain way is the claim of the gangue, sometimes called in a very derogatory way as "waste", when we know that gangue minerals are the main actors in different metallurgical circuits, such as crushing, grinding, flotation, cyanidation, acid leaching, etc.
Additionally the main problems that occur in plants are mainly related to gangues, especially due to its relative abundance, which in some types of deposits, especially in the low-grade, are largely predominant.
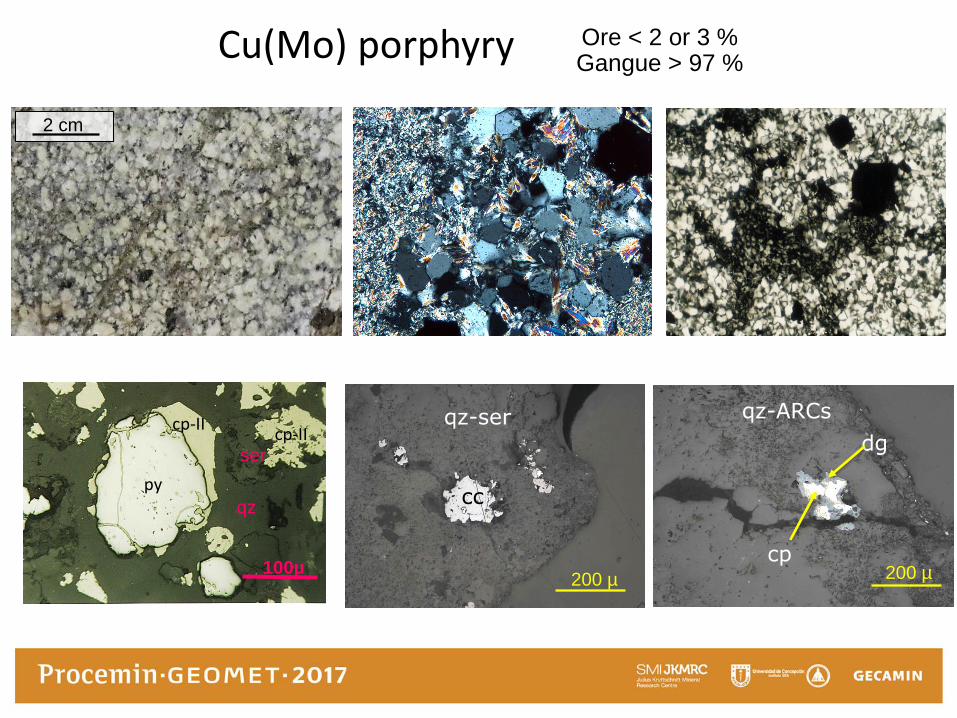
Cu(Mo) porphyry
200 µ
cc
qz-ser
200 µ
py
cp-IIcp-II
qz
ser
100µ
2 cm
Ore < 2 or 3 %Gangue > 97 %
dg
qz-ARCs
cp200 µ
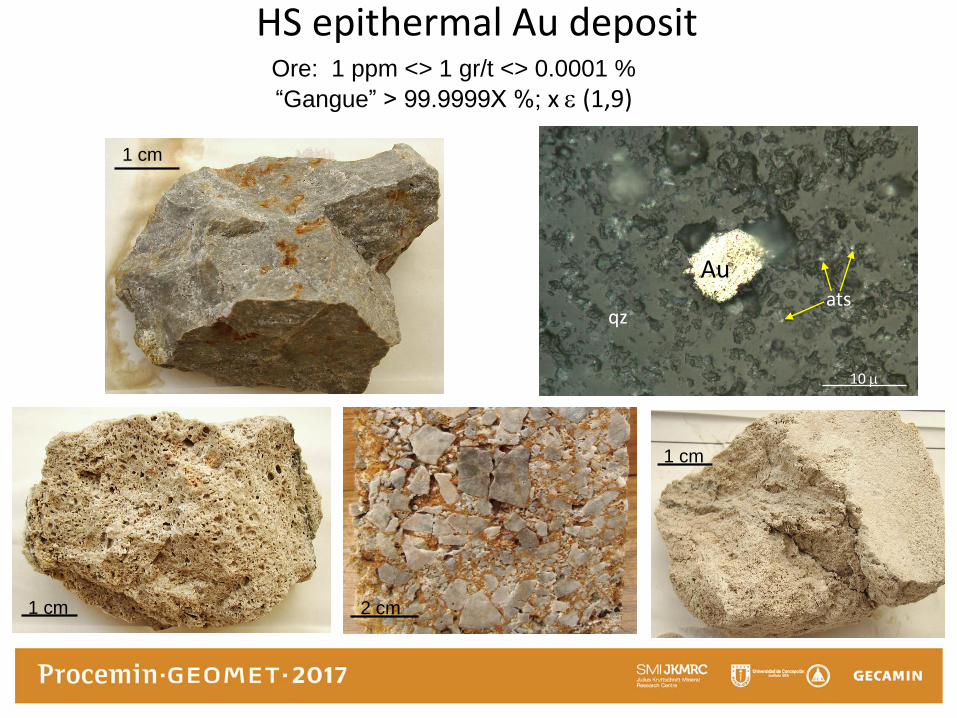
HS epithermal Au depositOre: 1 ppm <> 1 gr/t <> 0.0001 %
“Gangue” > 99.9999X %; x e (1,9)
1 cm
1 cm
2 cm1 cm
Au
qz
10 m
ats
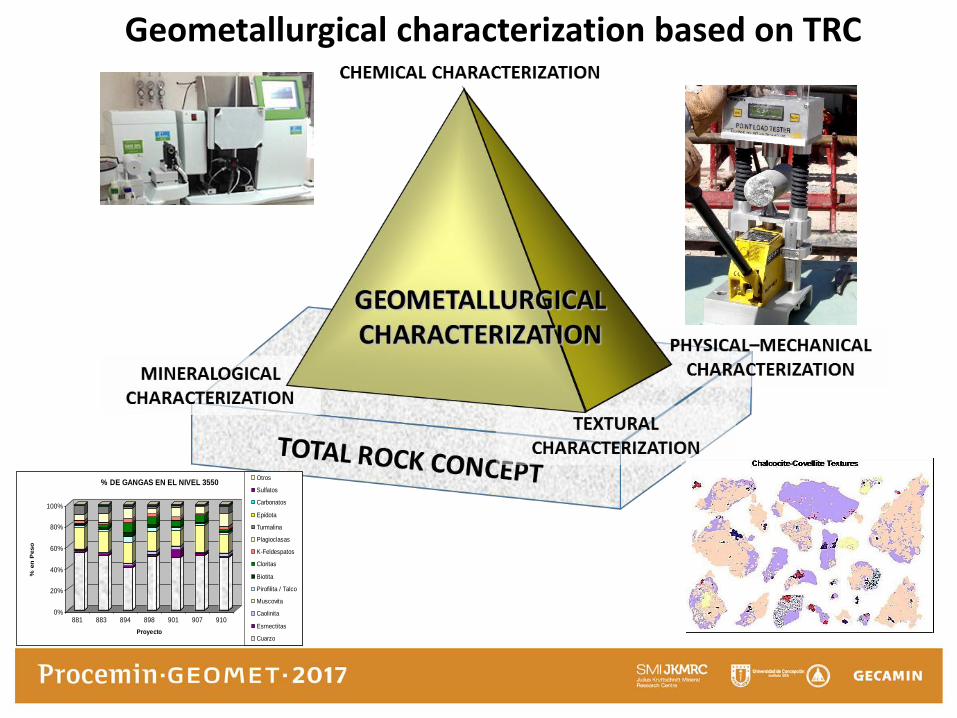
Geometallurgical characterization based on TRC
0%
20%
40%
60%
80%
100%
% e
n P
eso
881 883 894 898 901 907 910
Proyecto
% DE GANGAS EN EL NIVEL 3550Otros
Sulfatos
Carbonatos
Epídota
Turmalina
Plagioclasas
K-Feldespatos
Cloritas
Biotita
Pirofilita / Talco
Muscovita
Caolinita
Esmectitas
Cuarzo
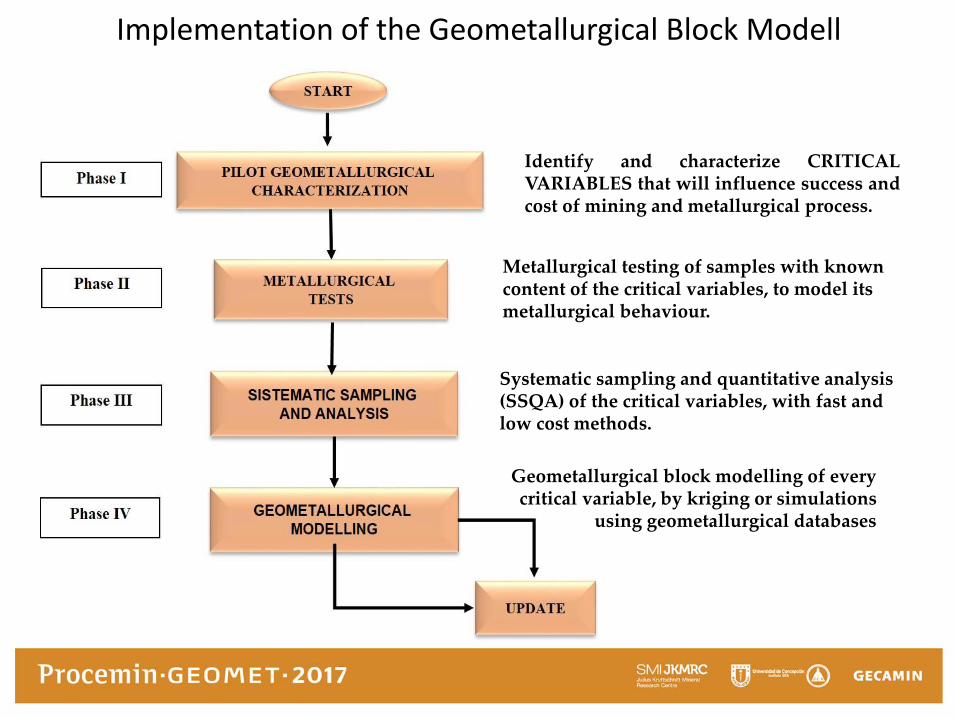
Implementation of the Geometallurgical Block Modell
Identify and characterize CRITICALVARIABLES that will influence success andcost of mining and metallurgical process.
Metallurgical testing of samples with known content of the critical variables, to model its metallurgical behaviour.
Systematic sampling and quantitative analysis (SSQA) of the critical variables, with fast and low cost methods.
Geometallurgical block modelling of every critical variable, by kriging or simulations
using geometallurgical databases
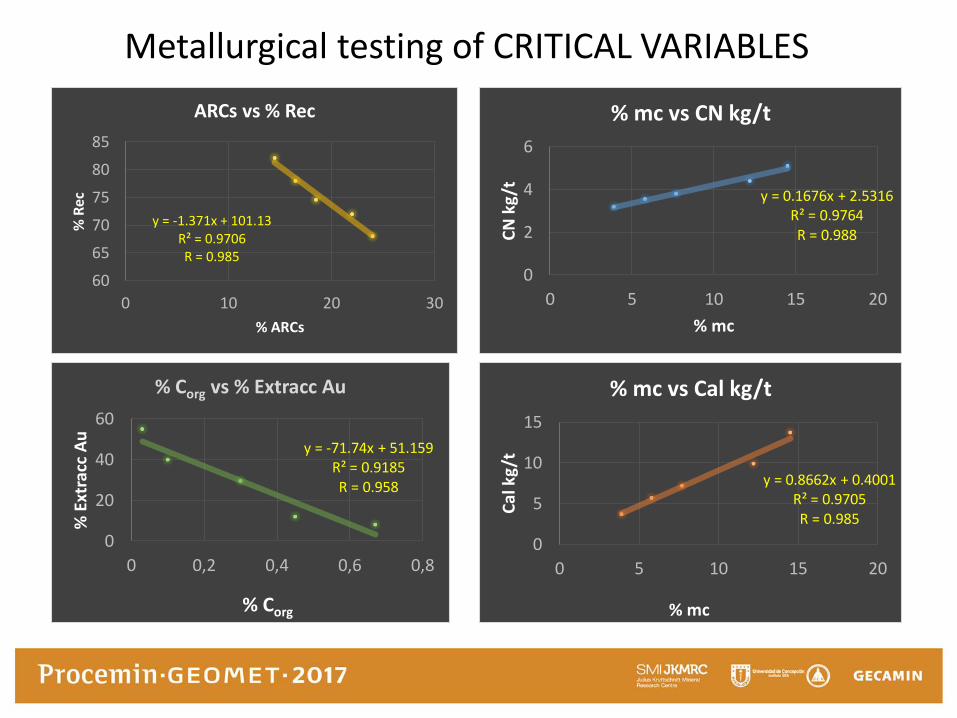
Metallurgical testing of CRITICAL VARIABLES
y = -1.371x + 101.13R² = 0.9706R = 0.985
60
65
70
75
80
85
0 10 20 30
% R
ec
% ARCs
ARCs vs % Rec
y = -71.74x + 51.159R² = 0.9185R = 0.958
0
20
40
60
0 0,2 0,4 0,6 0,8
% E
xtra
cc A
u
% Corg
% Corg vs % Extracc Au
y = 0.1676x + 2.5316R² = 0.9764R = 0.988
0
2
4
6
0 5 10 15 20
CN
kg/
t
% mc
% mc vs CN kg/t
y = 0.8662x + 0.4001R² = 0.9705R = 0.985
0
5
10
15
0 5 10 15 20
Cal
kg/
t
% mc
% mc vs Cal kg/t
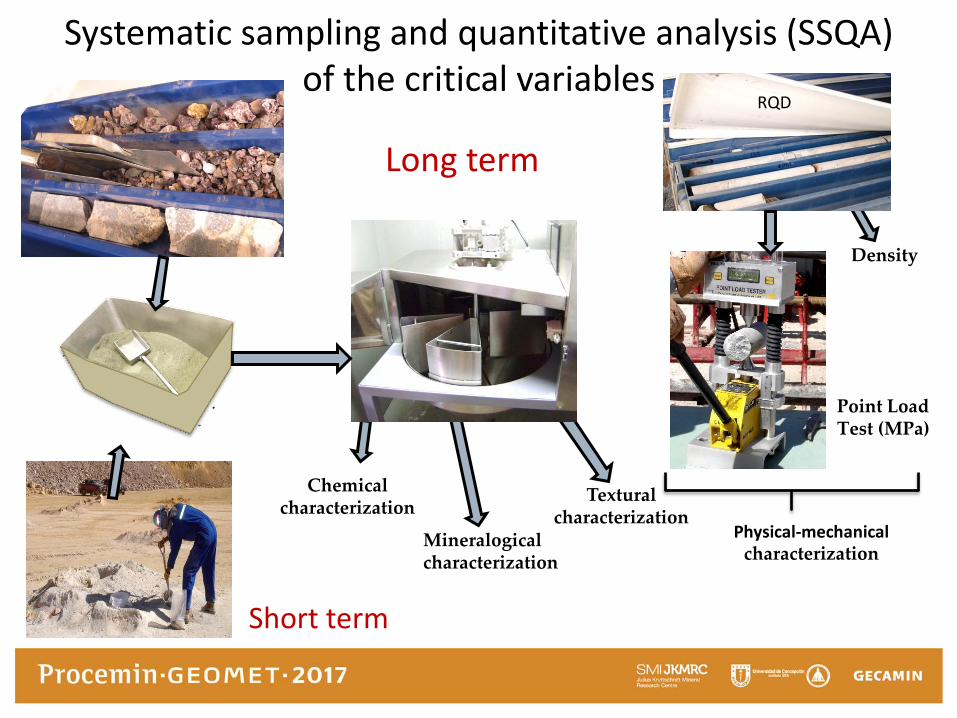
Systematic sampling and quantitative analysis (SSQA) of the critical variables
Point Load Test (MPa)
RQD
Density
Physical-mechanical characterization
Chemical characterization
Mineralogical characterization
Textural characterization
Long term
Short term
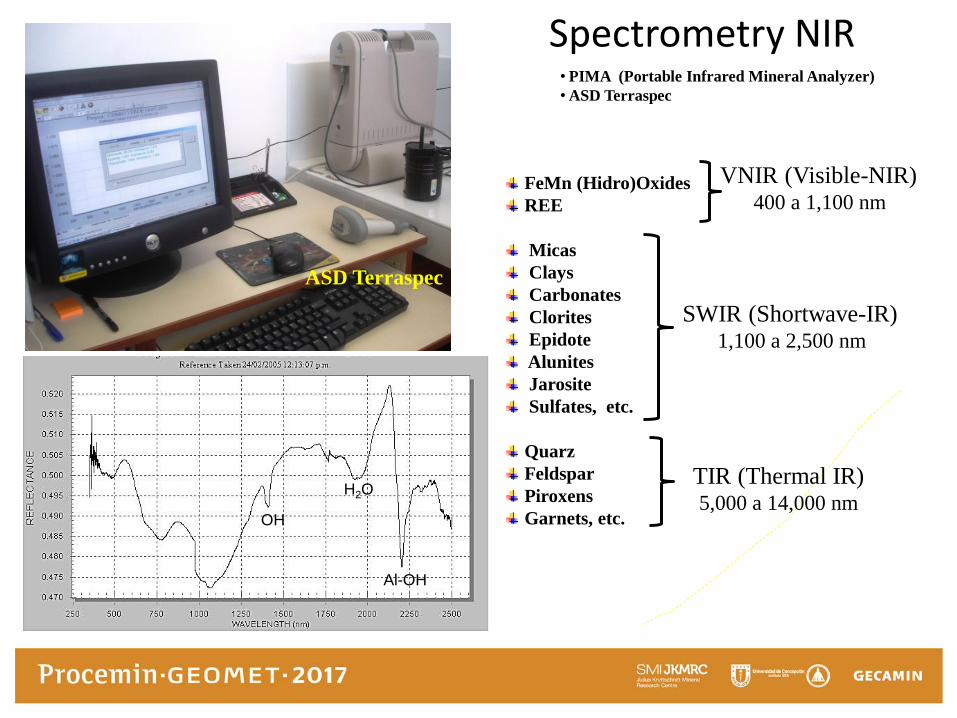
• PIMA (Portable Infrared Mineral Analyzer)
• ASD Terraspec
OH
H2O
Al-OH
FeMn (Hidro)Oxides
REE
Micas
Clays
Carbonates
Clorites
Epidote
Alunites
Jarosite
Sulfates, etc.
Quarz
Feldspar
Piroxens
Garnets, etc.
TIR (Thermal IR)5,000 a 14,000 nm
VNIR (Visible-NIR)400 a 1,100 nm
SWIR (Shortwave-IR)1,100 a 2,500 nm
ASD Terraspec
Spectrometry NIR
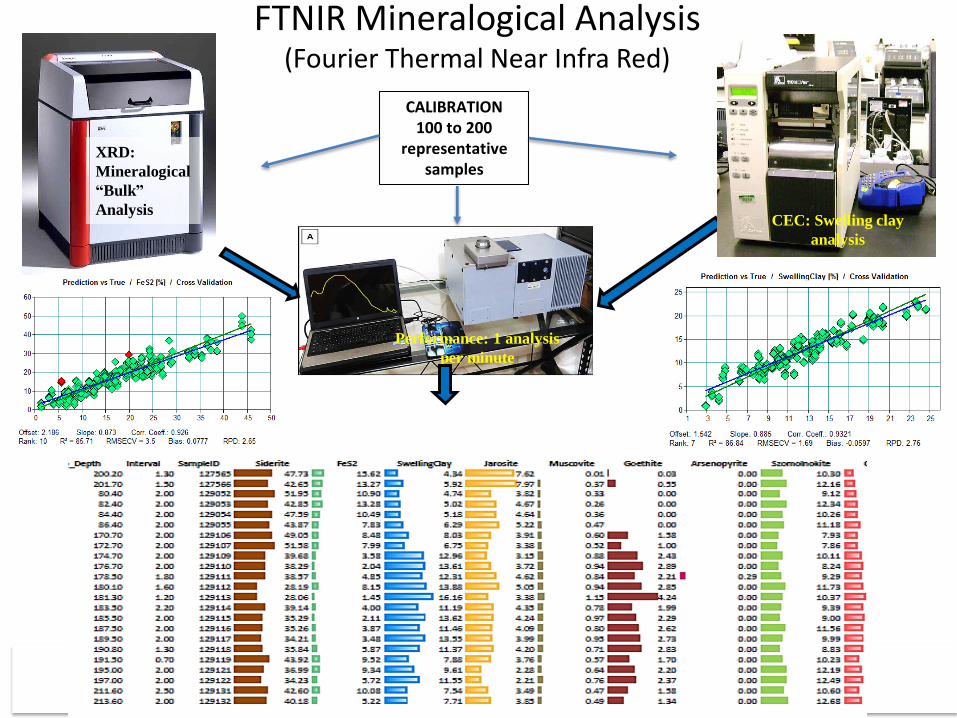
FTNIR Mineralogical Analysis(Fourier Thermal Near Infra Red)
Performance: 1 analysis
per minute
XRD:
Mineralogical
“Bulk”
AnalysisCEC: Swelling clay
analysis
CALIBRATION100 to 200
representativesamples
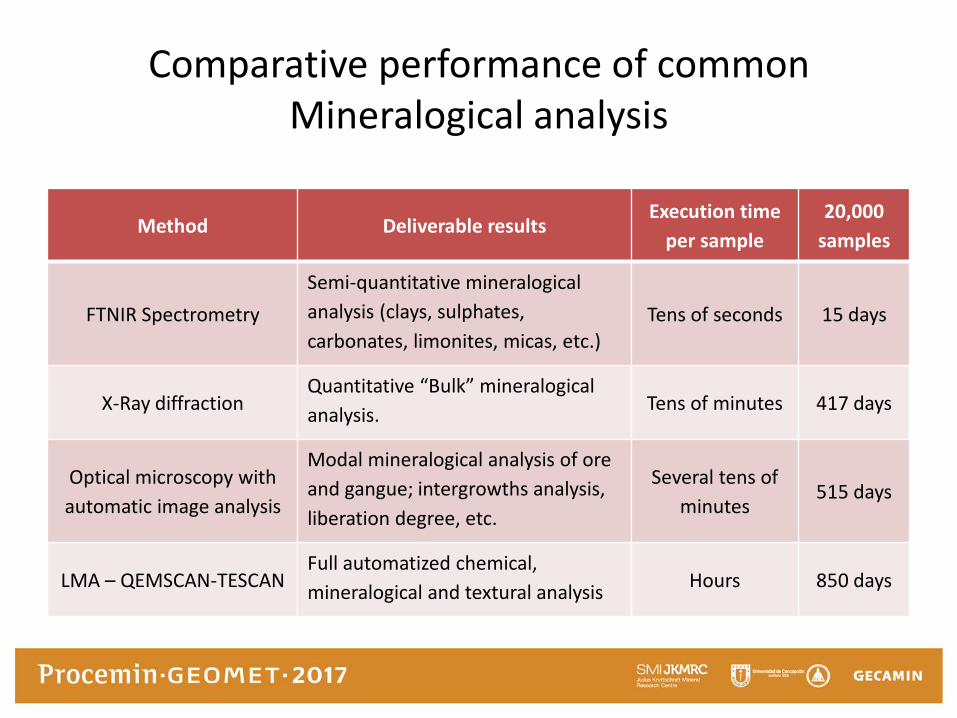
Comparative performance of commonMineralogical analysis
Method Deliverable resultsExecution time
per sample
20,000
samples
FTNIR Spectrometry
Semi-quantitative mineralogical
analysis (clays, sulphates,
carbonates, limonites, micas, etc.)Tens of seconds 15 days
X-Ray diffractionQuantitative “Bulk” mineralogical
analysis.Tens of minutes 417 days
Optical microscopy with
automatic image analysis
Modal mineralogical analysis of ore
and gangue; intergrowths analysis,
liberation degree, etc.
Several tens of
minutes515 days
LMA – QEMSCAN-TESCANFull automatized chemical,
mineralogical and textural analysisHours 850 days
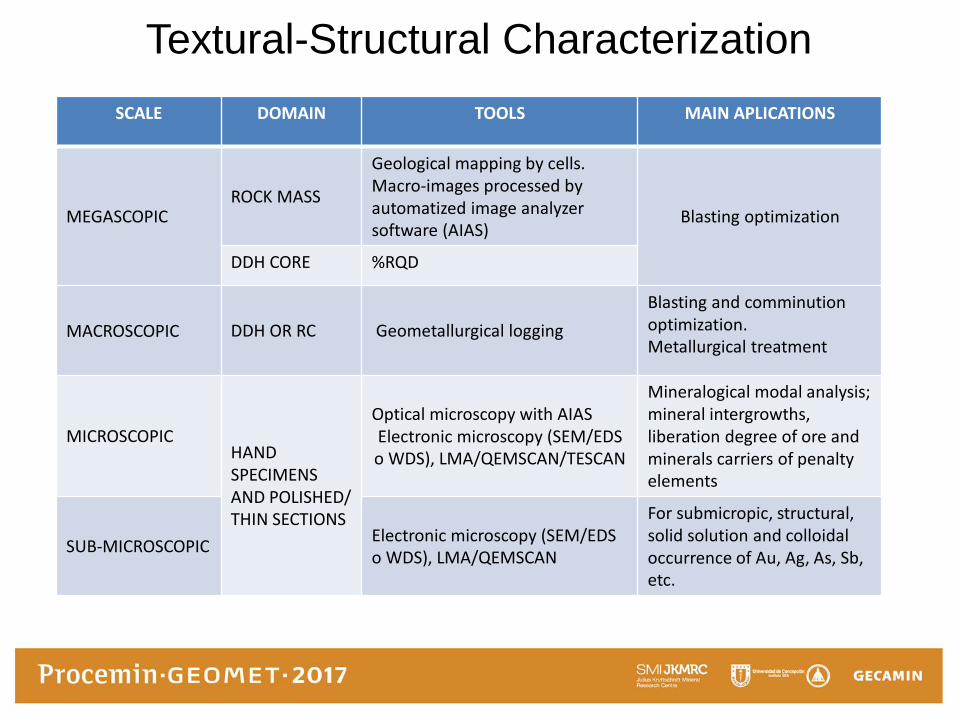
Textural-Structural Characterization
SCALE DOMAIN TOOLS MAIN APLICATIONS
MEGASCOPICROCK MASS
Geological mapping by cells. Macro-images processed by automatized image analyzer software (AIAS)
Blasting optimization
DDH CORE %RQD
MACROSCOPIC DDH OR RC Geometallurgical logging
Blasting and comminutionoptimization.Metallurgical treatment
MICROSCOPICHAND SPECIMENS AND POLISHED/ THIN SECTIONS
Optical microscopy with AIASElectronic microscopy (SEM/EDS o WDS), LMA/QEMSCAN/TESCAN
Mineralogical modal analysis;mineral intergrowths, liberation degree of ore and minerals carriers of penalty elements
SUB-MICROSCOPICElectronic microscopy (SEM/EDS o WDS), LMA/QEMSCAN
For submicropic, structural,solid solution and colloidal occurrence of Au, Ag, As, Sb, etc.
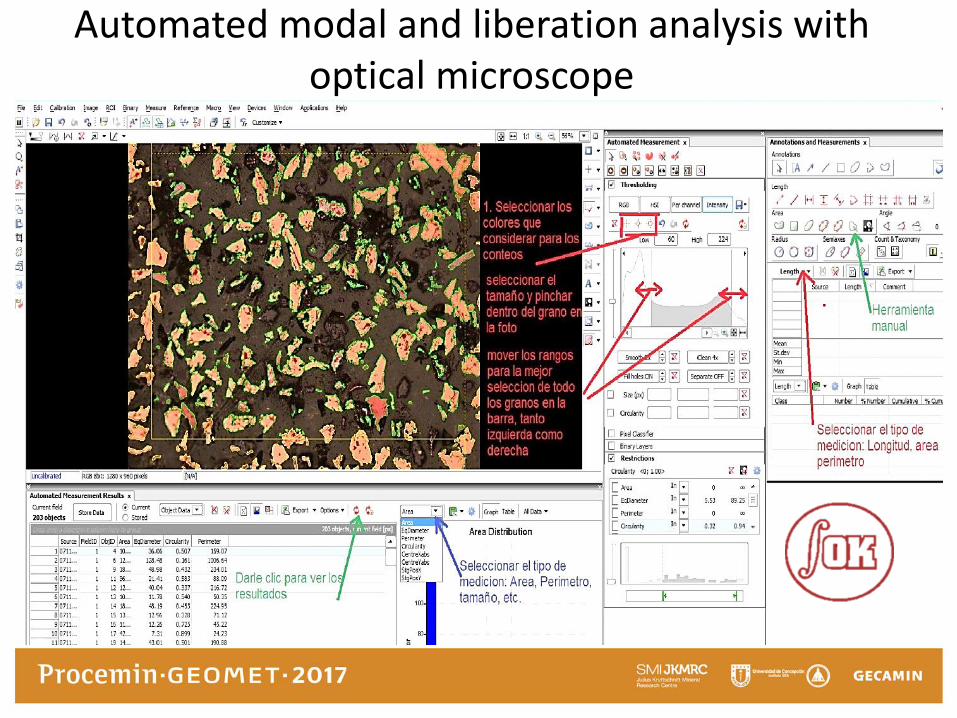
Automated modal and liberation analysis withoptical microscope
Diplomado de Geometalurgia
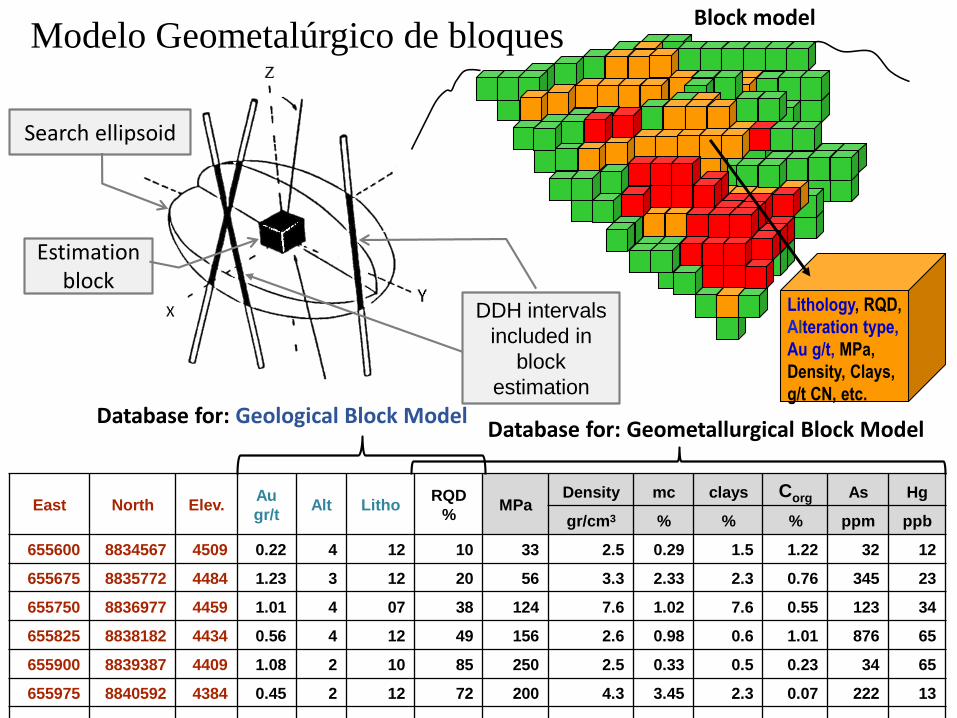
Lithology, RQD,
Alteration type,
Au g/t, MPa,
Density, Clays,
g/t CN, etc.
East North Elev.Au
gr/tAlt Litho
RQD
%MPa
Density mc clays Corg As Hg
gr/cm3 % % % ppm ppb
655600 8834567 4509 0.22 4 12 10 33 2.5 0.29 1.5 1.22 32 12
655675 8835772 4484 1.23 3 12 20 56 3.3 2.33 2.3 0.76 345 23
655750 8836977 4459 1.01 4 07 38 124 7.6 1.02 7.6 0.55 123 34
655825 8838182 4434 0.56 4 12 49 156 2.6 0.98 0.6 1.01 876 65
655900 8839387 4409 1.08 2 10 85 250 2.5 0.33 0.5 0.23 34 65
655975 8840592 4384 0.45 2 12 72 200 4.3 3.45 2.3 0.07 222 13
Database for: Geological Block ModelDatabase for: Geometallurgical Block Model
DDH intervals
included in
block
estimation
Search ellipsoid
Estimation block
Block modelModelo Geometalúrgico de bloques
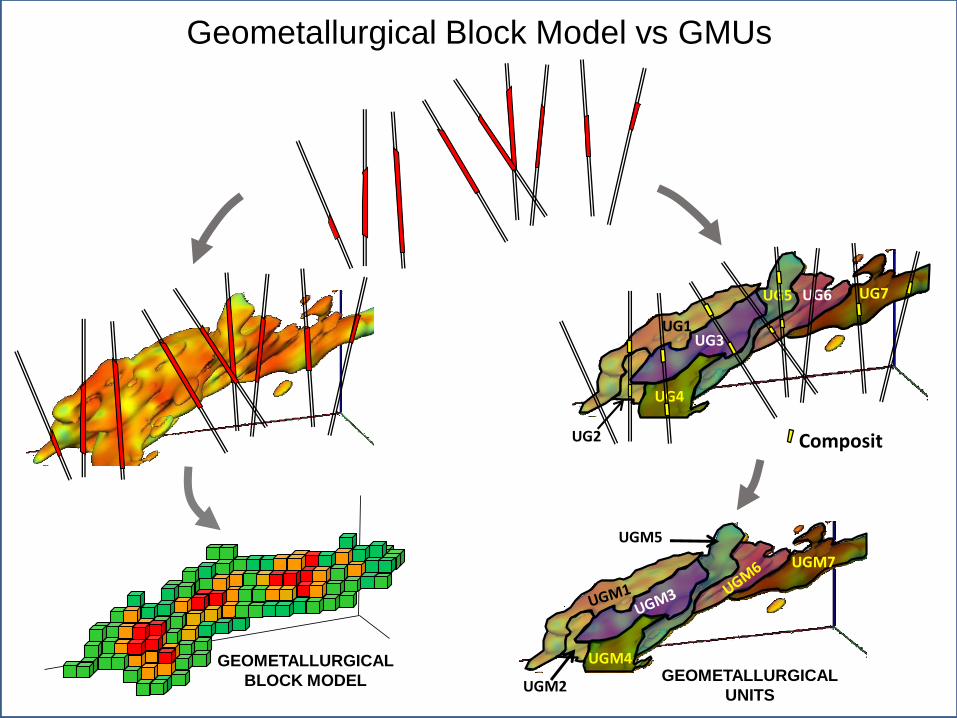
Diplomado de GeometalurgiaUGM2
UGM4
UGM5
UGM7
GEOMETALLURGICAL
BLOCK MODEL
UG3
UG1UG3
UG4
UG6 UG7
UG2
UG5
Composit
GEOMETALLURGICAL
UNITS
Geometallurgical Block Model vs GMUs
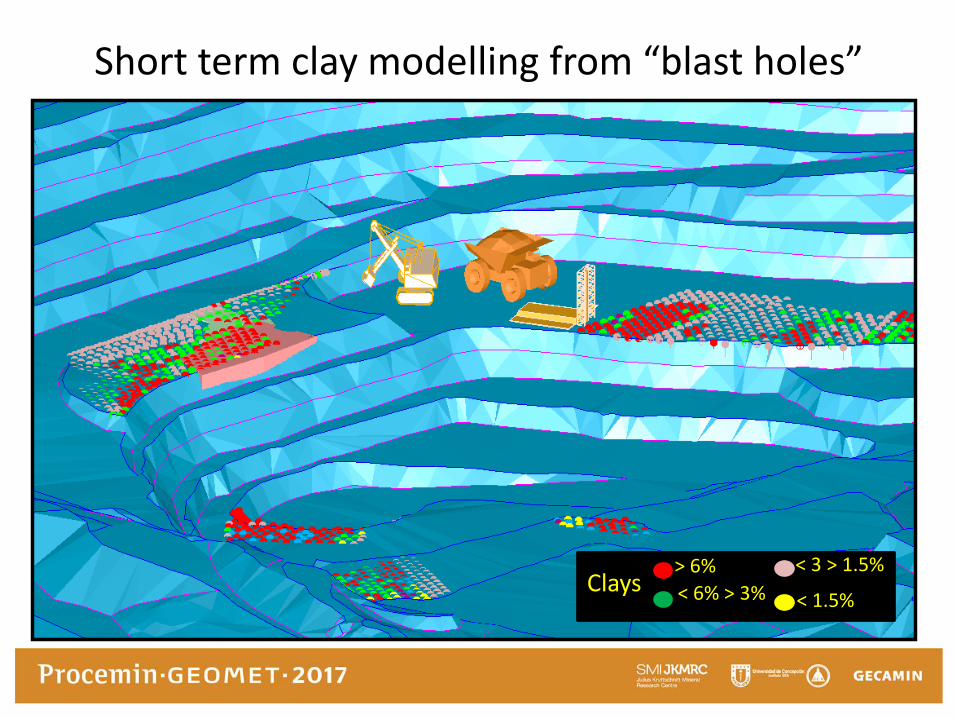
Short term clay modelling from “blast holes”
> 6% Clays < 6% > 3%
< 3 > 1.5%
< 1.5%
Conclusions
Currently there are still a few cases of application of GMBM and in general only partially:
Cu-Mo porphyry Cerro Verde (Fennel et al. 2005), Cu-Mo porphyry Trapiche (3,227 MPa
and 1,050 density determinations), the mesotermal deposits San Gabriel (Canchaya et al.
2013; 3064 MPa, 5200 density determinations, 3030 FTNIR analysis, and thousands of
RQD), La Granja-Río Alto (almost 3 year of Qemscan analysis) and Marcapunta
(Huallpallunca & Zapata 2017; this event).
With recent technological advances of infrared spectrometers, it is already
currently possible to obtain rapid semi-quantitative mineralogical analysis, less than a
minute per sample. If we add systematic quick measurements of uniaxial point load, RQD
and density; it is now possible to have thousands of data required
to implement a probabilistic GMBM; which by far constitutes currently
the best deliverable product of Geometallurgy.