geometric characterization of polymeric macrofibers
TRANSCRIPT
© 2015 IBRACON
Geometric characterization of polymeric macrofibers
Caracterização geométrica de macrofibras poliméricas
a Departamento de Engenharia Civil, Escola Politécnica da Universidade de São Paulo, São Paulo, SP, Brasil.
Received:23 Mar 2015 • Accepted: 25 Jun 2015 • Available Online: 13 Oct 2015
Abstract
Resumo
The geometric characteristics of synthetic macrofibers are important because they affect the behavior of fiber-reinforced concrete (FRC). Because there is a lack of specific, relevant publications in Brazil, the European standard EN14889-2:2006 was adopted as a reference to perform the char-acterization. Thus, an experimental plan was developed to assess the adequacy of testing procedures for the qualification of synthetic macrofibers for use in FRC. Two types of macrofibers were evaluated. The length measurement was performed using two methods: the caliper method, which is a manual measurement, and the digital image analysis method using the ImageJ software for image processing. These aforementioned meth-ods were used to determine the diameter together with the density method, which is an indirect method that uses the developed length obtained by one of the previous methods. The statistical analyses revealed that the length results are similar regardless of the method used. However, the macrofibers must be pre-stretched to maximize the accuracy of caliper measurements. The caliper method for diameter determination has the disadvantage of underestimating the macrofiber cross-section because of the pressure applied by the load claws. In contrast, the digital image analysis method obtains the projected diameter in a single plane, which overestimate the diameter because the macrofibers are oriented with the pressure of the scanner cover. Thus, these techniques may result in false projections of the diameters that will depend on the level of torsion in the macrofibers. It was concluded that both the caliper method using previously stretched macrofibers and the digital imaging method can be used to measure length. The density method presented the best results for the diameter determination because these results were not affected by the method chosen to determine the length.
Keywords: fiber-reinforced concrete, synthetic macrofibers, geometric characterization, length measurement, diameter measurement, test method.
As características geométricas das macrofibras poliméricas são importantes porque afetam o comportamento do concreto reforçado com fibras (CRF). Em vista da carência de publicações específicas no Brasil, adotou-se a norma europeia EN14889-2:2006 como parâmetro de referência para efetuar a caracterização. Assim, foi desenvolvido um plano experimental com o objetivo de avaliar a adequação de procedimentos de ensaio para a qualificação das macrofibras poliméricas destinadas ao CRF. Foram avaliados dois tipos de macrofibras. As medições do comprimento se efetuaram por dois métodos: o método do paquímetro, o qual consiste em uma medição manual, e o método de análise de imagens digitais, empregando o software ImageJ para processamento das imagens. Para a medição do diâmetro, além das metodologias já mencionadas, foi utilizado ainda o método da densidade, um método indireto que precisa do comprimento desenvolvido obtido por um dos métodos mencionados anteriormente. Da análise estatística se conclui que ambos os métodos de medição do comprimento são semelhantes e apresentam resultados equivalentes do ponto de vista estatístico. Porém, salienta-se que as macrofibras precisam ser previamente esticadas para ter maior exatidão nas medições com o paquímetro. Na determinação do diâmetro, o método do paquímetro tem a desvantagem de subestimar a seção transversal da macrofibra pela pressão que exercem as garras. Por outra parte, o método de imagens digitais apresenta a projeção do diâmetro em um único plano, com muita variação dimensional, porque as macrofibras são orientadas com a pressão da tampa do escâner. Assim, podem-se ter falsas projeções do diâmetro o que também depende do nível de torção das macrofibras. Conclui-se que o método do paquímetro, com o cuidado de esticar previamente as macrofibras, e o método das imagens digitais podem ser igualmente utilizados para medir o comprimento. Já para de-terminar o diâmetro da macrofibra, recomenda-se o método da densidade, cujos resultados não são influenciados pelo método escolhido para determinar o comprimento.
Palavras-chave: concreto reforçado com fibras, macrofibras poliméricas, caracterização geométrica, medição do comprimento, medição do diâmetro, método de ensaio.
A. R. E. CÁCERES a
I. GALOBARDES a
M. S. REBMANN a
R. MONTE a
A. D. DE FIGUEIREDO a
Volume 8, Number 5 (October 2015) p. 644-668 • ISSN 1983-4195http://dx.doi.org/10.1590/S1983-41952015000500006
1. Introduction
The use of fiber-reinforced concrete (FRC) is increasing in the in-ternational and Brazilian markets. This technology is associated with important advantages because the reinforcement is added to concrete during the mixing process, which reduces the number of application steps. Moreover, FRC minimizes the technological limitations of simple concrete, such as brittleness and low deform-ability when subjected to tensile stresses. However, the fiber-rein-forcement efficiency depends on various characteristics, including geometry (NAAMAN, 2003; PRUDENCIO Jr. et al, 2006; HTUT, 2010; ZĪLE; ZĪLE, 2013). As a result, the geometry of the macrofi-bers must be parameterized, as is already done for steel fibers in various international (ASTM A820/A820M:2011; EN14889-1:2006) and Brazilian standards (ABNT NBR 15575:2007).The need for parameterization is based on the fact that fiber geometry affects the reinforcement capacity (NAAMAN, 2003; FIGUEIREDO, 2008). The specific standard for polymeric macrofibers (EN14889-2:2006) also requires the geometric qualification of such macrofibers and establishes variation tolerances of the main geometrical charac-teristics: developed length, equivalent diameter and aspect ratio. How-ever, given the wide variety of potential geometric shapes of polymeric macrofibers, a number of different procedures can be followed to com-pare measured values with those reported by the manufacturers. For this reason, the measurement of the geometric characteristics of the polymeric macrofibers is much more complex than that of steel fibers, for which using a caliper is sufficient (FIGUEIREDO et al., 2008).The European standard EN14889-2:2006 indicates that length must be measured using a measuring device with a minimum precision of 0.1 mm. Determination of the equivalent diameter is somewhat more complex. For example, if a manufacturer states that the macrofiber’s cross-section is circular, the test should be performed using a microm-eter with a precision of 0.001 mm if the diameter is greater than 0.3 mm or an “optical measuring device” if the diameter is smaller than 0.3 mm. The omission of the diameter measurement precision in the case of the optical device is problematic, as are the difficulties encountered in ensuring the accuracy of measuring the developed length. These values can be determined with different error levels as a function of the measurement quality, but the relevant procedure is not completely established in this standard, although it is the only specific standard for polymeric macrofibers used in concrete reinforcement.Because Brazil does not have a specific standard for polymeric macrofibers and because there are no specific studies focused on the geometric evaluation of polymeric macrofibers, all these im-portant aspects should be considered for future standardization. The quality of geometric characterization is also critical for other important determinations, such as characterization of the mechani-cal behavior of macrofibers. Therefore, to analyze the reliability of geometric characterization procedures for the polymeric macrofi-bers used in FRC, an experimental study was performed with the objective of identifying reliable methods.
2. Experimental methodology
The experimental study sought to use macrofibers available in Bra-zil with geometries that are difficult to determine. The macrofibers employed in the experimental study and the various test methods used for their characterization are described below.
2.1 Types of macrofibers
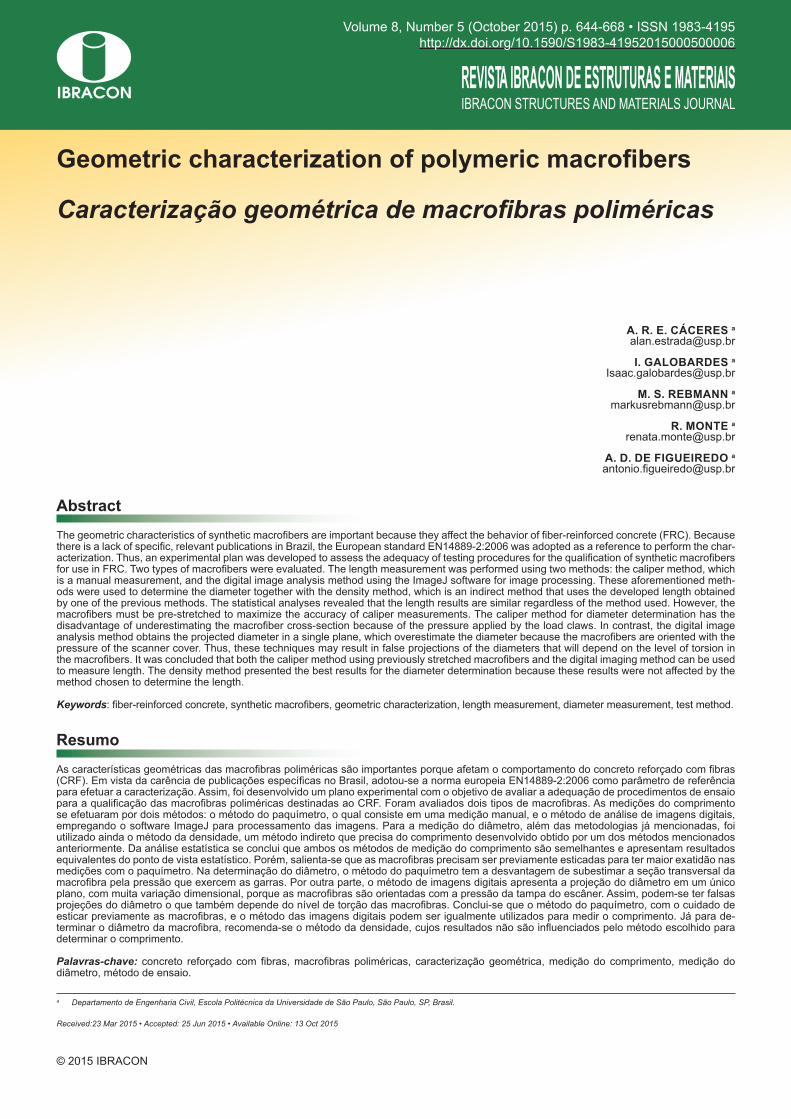
Two commercially available polymeric macrofibers (denoted A and B) composed of polypropylene were evaluated in this experiment. The main characteristics of these macrofibers, according to the in-formation provided by the manufacturers, are shown in Table 1. Note that the macrofiber aspect ratio is the relationship between the length (L) and the diameter (D).Macrofiber A exhibited a cord shape (Figure 1a). These cords may be broken down into approximately 20 macrofiber bundles (Figure 1b), which present multiple levels of twisting, generating a compli-cated geometry. Each bundle has one to three filaments bundled together, so that the bundle is composed of irregular cross-sec-tions along its length. Supplying this macrofiber in the form of bun-dles coiled in cords is done to facilitate the FRC mixing procedure, avoiding the macrofiber entanglement associated with a larger as-pect ratio (CECCATO, 1998). Thus, the cords may be considered as fibers with a low aspect ratio that will disperse relatively easily in the mixture and simultaneously provide the dispersion of filaments with high aspect ratio. As a result, it is possible to use a macrofiber with a high final aspect ratio to provide better mechanical perfor-mance in the post-cracking behavior of FRC.Macrofiber B (Figure 1.c) presented an oval cross-section formed by grouped bundles but with an arrangement unlike that of mac-rofiber A. Figure 1.d shows the individual bundles of macrofiber B, which may be composed of one, two, three or more filaments grouped together. This macrofiber is produced in this way for the same reason as macrofiber A, i.e., to increase the aspect ratio with minimal impact on the mixing conditions to ensure homogenization of the material.
2.2 Assays To determine the length of the macrofibers, two basic methods were considered: the use of a caliper and the analysis of scanned images of the material. To determine the equivalent diameter of the macrofibers, three types of assays were performed: the cali-per, digital imaging, and density methods. The density method is a way of determining the diameter that depends on prior mea-surements of the length of the macrofiber, which can be per-formed by one of the two methods mentioned above. The mea-surements of diameter and length were performed on individual filaments because they, and not the bundles, interfere with the post-cracking performance of FRC. A total of 60 macrofibers of each type considered (A and B) were characterized by each of the assays listed here.
645IBRACON Structures and Materials Journal • 2015 • vol. 8 • nº 5
A. R. E. CÁCERES | I. GALOBARDES | M. S. REBMANN | R. MONTE | A. D. DE FIGUEIREDO
Table 1– Main characteristics of the macrofibers provided by the manufacturer
Characteristics Macrofiber A Macrofiber B
Density (g/cm3) 0.91 0.90-0.92
Length (mm) 54 58
Aspect ratio 158 *
* Information not provided by the manufacturer.
646 IBRACON Structures and Materials Journal • 2015 • vol. 8 • nº 5
Geometric characterization of polymeric macrofibers
2.2.1 Caliper
The use of a caliper was considered because the European stan-dard EN14889-2:2006 indicates the use of this tool to assess the geometric characteristics of polymeric macrofibers. A digital caliper
(Digimess, model 100_174BL) with a precision of 0.01 mm was used herein to obtain the diameter and length. Considering the standard EN14889-2:2006 and given the similarity of their geo-metrical configurations, both macrofibers were evaluated as Class II macrofibers.
Figure 1 – Sample of macrofiber A a) and its separate elements b); Sample of macrofiber B c) and its separate elements d)
A B
C D
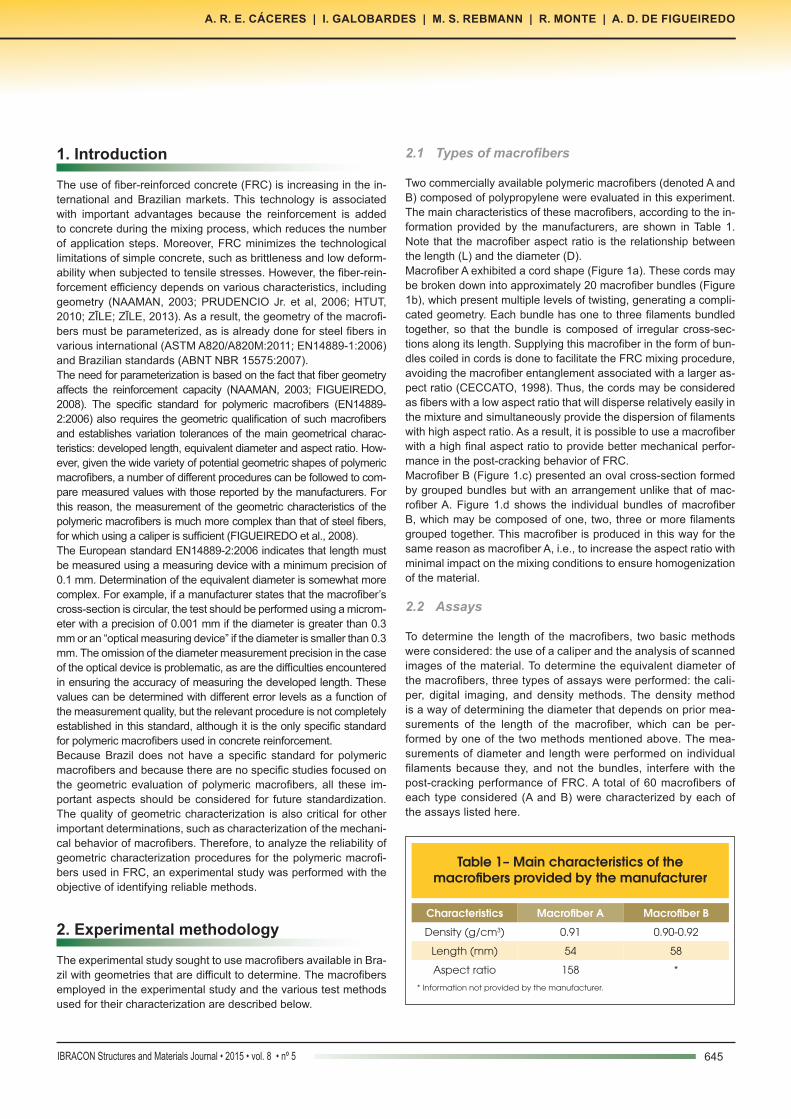
Figure 2 – Measurement of the length of the undulated macrofiber A a); Measurement of the length of the stretched macrofiber A b); Measurement of the length of macrofiber B
c); Measurement of the diameter d)
A CB D

647IBRACON Structures and Materials Journal • 2015 • vol. 8 • nº 5
A. R. E. CÁCERES | I. GALOBARDES | M. S. REBMANN | R. MONTE | A. D. DE FIGUEIREDO
Regarding length, only one value was obtained in each mea-surement. The undulating shape presented by macrofiber A that results from the level of torsion does not allow for ac-curate determination of the developed length in their natu-ral state (Figure 2.a). Therefore, they were stretched prior to measurement to obtain a more accurate value (Figure 2.b). Unlike macrofiber A, undulation did not affect the length mea-surement of macrofiber B (Figure 2.c). However, regardless of the measured macrofiber, care must be taken to avoid applying excessive pressure, which causes bending of the macrofibers when using the caliper. The measurement of the diameter of each type of macrofiber was performed at three points—at both extremities and at the midpoint (Figure 2.d)—and two orthogonal measurements of the cross-section were obtained at each point.
2.2.2 Digital imaging
To minimize the influence of human error in determining the di-mensions of the macrofibers, which affects the caliper method, a method based on the analysis of digital images, which has been widely used in other studies (SHIN; CHO; KIM, 2008; DENG; KE, 2010; LI; YI; SHANG, 2012; ÖZNERGIZ et al., 2014), was also considered. This method also has the advan-tage of measuring the developed length and thus takes into account macrofiber bending and torsion. The images were ob-tained using a desktop scanner (HP, model Scanjet 8350).First, the macrofibers were individually placed on the scan-ner in a manner that prevented them from touching each other during scanning. The macrofibers were then carefully covered with a black plastic sheet, and the room lights were turned off to ensure the sharpest possible contrast between the macrofi-bers and the dark background. A resolution of 2400 ppi (pixels
per inch) was used during scanning to obtain a grayscale im-age, which was saved in the PNG format. An example of the generated images is shown in Figure 3.a. Images were sub-sequently processed and analyzed with the ImageJ imaging software, which is available in the public domain, programmed in Java and developed by the National Institutes of Health (“Im-ageJ”, 2015).The treatment of images was based on the following procedure: First, the contrast was adjusted with the Threshold tool (Figure 3.b) to define the boundary between the macrofiber and the image background. Next, the images were transformed into a binary color system using the ‘Make Binary’ tool, and two types of colors were defined: black and white. As seen in Figure 3.c, the black pixels represent the macrofibers, and the white pix-els represent the empty space. Next, the ‘Fill Holes’ tool was used to fill any voids present inside the macrofiber images, which can occur in some situations due to light reflection or the presence of translucent parts of the macrofiber.The contours of the macrofibers were also softened by em-ploying three stages of erosion (deletion of one pixel from the contour), followed by three dilation stages (addition of one pix-el to the contour). This process was implemented with the tools ‘Erode’ and ‘Dilate’ and allowed for the elimination of much of the image noise and the generation of well-defined contours without affecting the projected area. In a few cases, small in-terventions were still needed for minor corrections of the im-age to eliminate defibrillated filaments, which could cause an overestimation of the projected area. After this treatment, the macrofibers were ready for their dimensions to be measured (Figure 3.c).To measure the length, the central axis of the scanned projection was initially determined using the ‘Skeletonize’ tool. Then, with the aid of the plugin “Analyze Skeleton (2D/3D)” (ARGANDA-CAR-
Figure 3 – Scanned images a); with contrast adjustment b); and ready for evaluation c)
A B C
648 IBRACON Structures and Materials Journal • 2015 • vol. 8 • nº 5
Geometric characterization of polymeric macrofibers
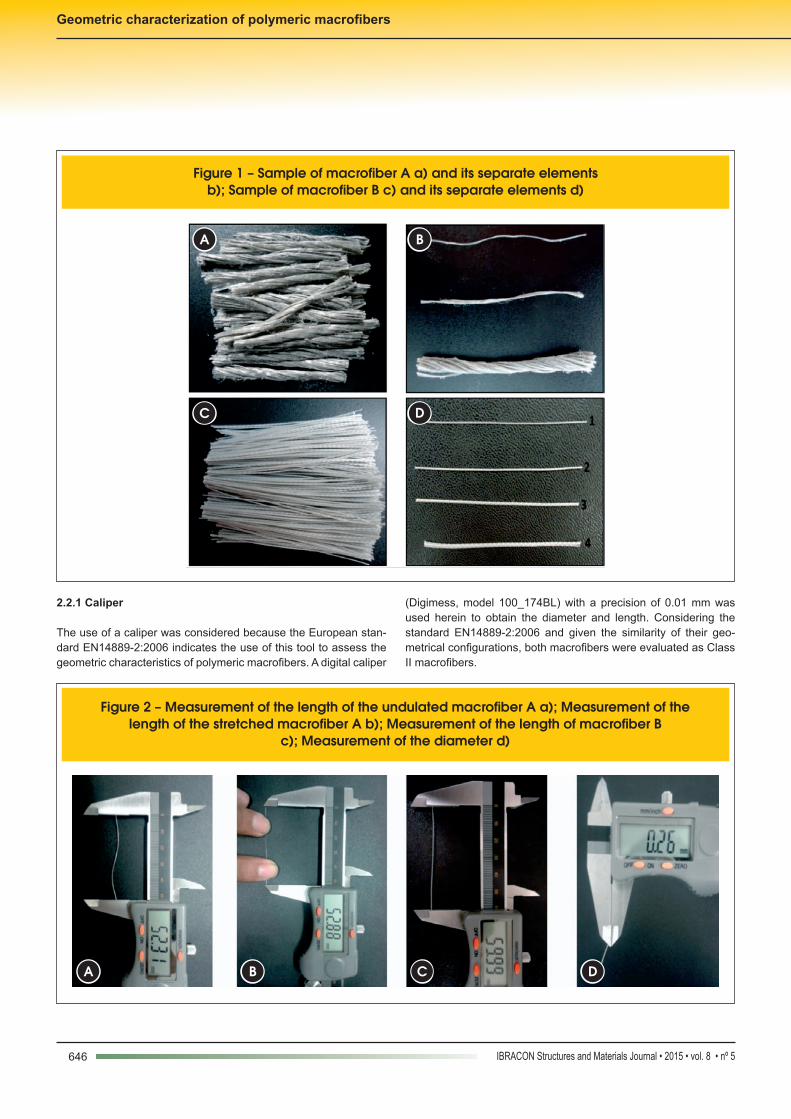
RERAS, 2014), the longest path of this skeleton was determined (shown as dark gray section in the enlarged detail of Figure 4). Note that performing a correction was necessary at both ends of the longest section because the definition of the central axis results in a division in the shape of a “Y” at the extremities (Figure 4). Fur-thermore, it was still necessary to develop a method to smooth the longest path because the pixel-in-pixel measurements may over-estimate the actual length by up to 8%. Finally, the diameter of the macrofiber was obtained by dividing the total projected area by the developed length, where the area was determined by the ‘Analyze Particles...’ tool of the ImageJ software.The results obtained in the form of pixels were converted to mil-limeters using a conversion factor of 0.0106 mm/pixel. This value was determined by scanning a calibrated ruler (Hirox digital micro-scope ruler, model KH-7700).
2.2.3 Density method
The density method, which is also included in the European stan-dard EN14889-2:2006, is an indirect method and allows the aver-age diameter of the macrofiber to be obtained using Equation 1. This equation expresses the relationship between different macrofi-ber parameters: diameter (D), length (L), mass (m) and density (ρ), where the units of these parameters must be mutually compatible.
(1)
To estimate the diameter using this method, it is necessary to de-termine the developed length of the macrofiber with one of the methods presented above. Determination of the macrofiber mass was performed individually on an analytical balance with a preci-sion of 0.0001 g (Metler-Toledo, model AB204-S). Finally, the den-sity of the macrofibers was evaluated using a helium gas pycnom-eter (Multipycnometer Quantachrome MVP 5DC) at 26 °C. Three samples of chopped macrofibers, each weighing approximately 30 g, were used to evaluate the density of both macrofibers. In addi-tion to geometrical measurements, the density of the macrofibers is also useful with regard to the amount of macrofibers incorpo-rated in the concrete (NAAMAN, 2003).
3. Experimental results and analysis
The experimental results obtained for the diameters and lengths of the macrofibers are presented and analyzed according to the di-mensional tolerances specified by the standard EN14889-2:2006, which is specific for polymeric macrofibers. This enables compari-son of requirements established for the material. These results are
Figure 4 – Skeleton of the fiber. Note that at the extremity, the fiber presents a bifurcation
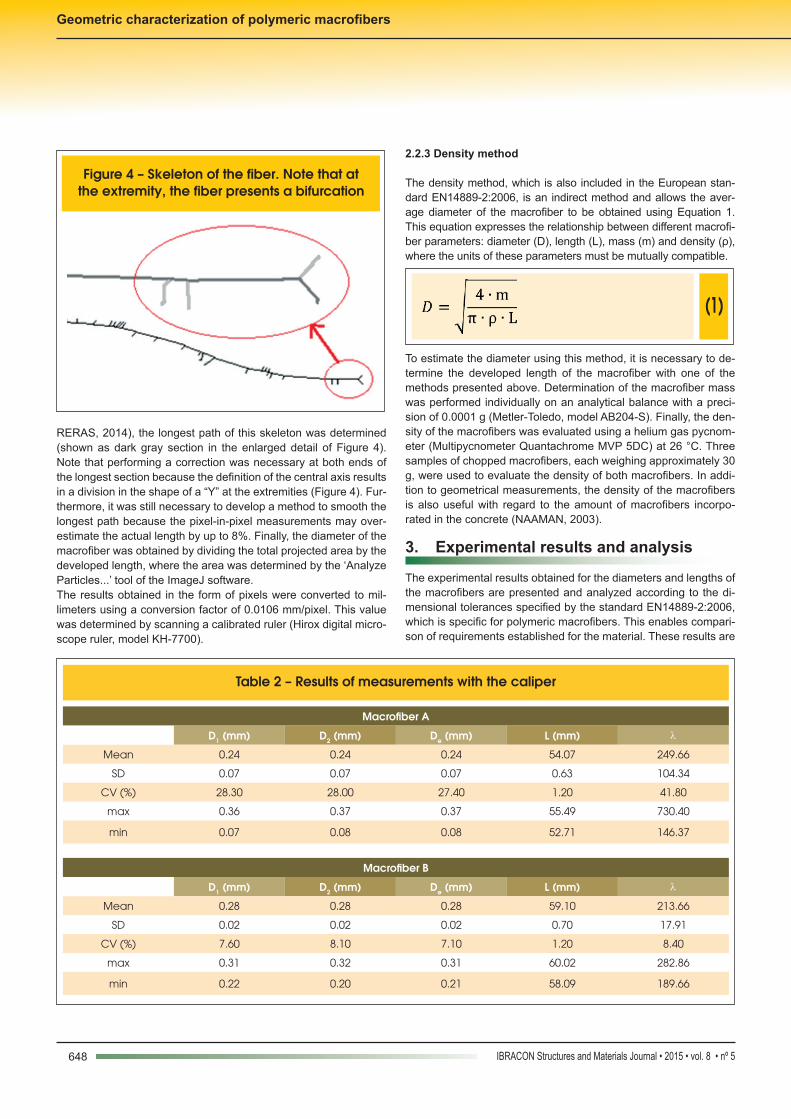
Table 2 – Results of measurements with the caliper
Macrofiber A
D1 (mm) D2 (mm) De (mm) L (mm) λ
Mean 0.24 0.24 0.24 54.07 249.66
SD 0.07 0.07 0.07 0.63 104.34
CV (%) 28.30 28.00 27.40 1.20 41.80
max 0.36 0.37 0.37 55.49 730.40
min 0.07 0.08 0.08 52.71 146.37
Macrofiber B
D1 (mm) D2 (mm) De (mm) L (mm) λ
Mean 0.28 0.28 0.28 59.10 213.66
SD 0.02 0.02 0.02 0.70 17.91
CV (%) 7.60 8.10 7.10 1.20 8.40
max 0.31 0.32 0.31 60.02 282.86
min 0.22 0.20 0.21 58.09 189.66

649IBRACON Structures and Materials Journal • 2015 • vol. 8 • nº 5
A. R. E. CÁCERES | I. GALOBARDES | M. S. REBMANN | R. MONTE | A. D. DE FIGUEIREDO
organized according to the type of test performed (caliper, digital imaging, and density methods).
3.1 Caliper
Table 2 summarizes the results of the geometric characteristics evaluated with the caliper. Because of the space constraints in this work, individual determinations obtained in samples of 60 macrofi-bers were excluded. The results presented for macrofibers A and B are as follows: the average diameters measured at the extremities and in the middle section of the macrofibers (D1); the average di-ameters measured at the same points but on an orthogonal section (D2); the equivalent diameter (De) calculated as the average of D1 and D2; the length (L); and finally, the aspect ratio (λ) or the ratio between L and De. In addition to the average results, the standard deviation (SD), coefficient of variation (CV), maximum value (max) and minimum value (min) are also shown.In the case of macrofiber A, the nominal diameter was not provided by the manufacturer; therefore, this value was calculated from the nominal values of length (54 mm) and aspect ratio (158), which were provided. In this case, the nominal diameter was equal to 0.34 mm. For macrofiber B, neither the equivalent diameter nor the aspect ratio was provided by the manufacturer. Thus, it was not possible to compare the measurements with a nominal value or to evaluate the dimensional tolerances relative to the declared equivalent diameter. It should be noted that this omission does not satisfy the EN14889-2:2006 standard, which indicates that these values must be provided by the manufacturer or its sales repre-sentative.As previously mentioned, macrofibers A and B were classified as Class II according to the European standard EN14889-2:2006. This standard states that the maximum variation of the individual diameter and individual aspect ratio in relation to the nominal value is ±50%. The maximum variations of the mean diameter and mean aspect ratio compared to the nominal values are ±5% and ±10%, respectively. For length, the maximum variations of the individual values and the average in relation to the nominal values must be ±10% and ±5%, respectively.When applying the dimensional tolerance criteria of the European standard EN14889-2:2006 for macrofiber A, 15% of the macro-fibers were found to have individual diameters differing from the nominal value by ±50%. The average diameter was within the ±5% tolerance. Regarding the individual aspect ratio, 37% of the mac-rofibers presented values exceeding the tolerance of ±50%. The
average aspect ratio also presented a difference greater than the ±5% tolerance. Regarding length, all macrofibers presented values within the tolerances required for the individual value in relation to the nominal value. Similarly, the average length presented a varia-tion smaller than the tolerance of ±5%. Thus, macrofiber A can only be considered to be in accordance with the tolerances of the Euro-pean standard EN14889-2:2006 with respect to its length.In the case of macrofiber B, it should be noted that the manufac-turer did not provide nominal values of the diameter and aspect ratio. Therefore, no benchmark was available for applying the di-mensional tolerances of the European standard EN14889-2:2006. As a result, the evaluation was performed only for length, which al-lowed the conclusion that all macrofibers met the specifications of the standard regarding both individual and average length values.
3.2 Digital imaging
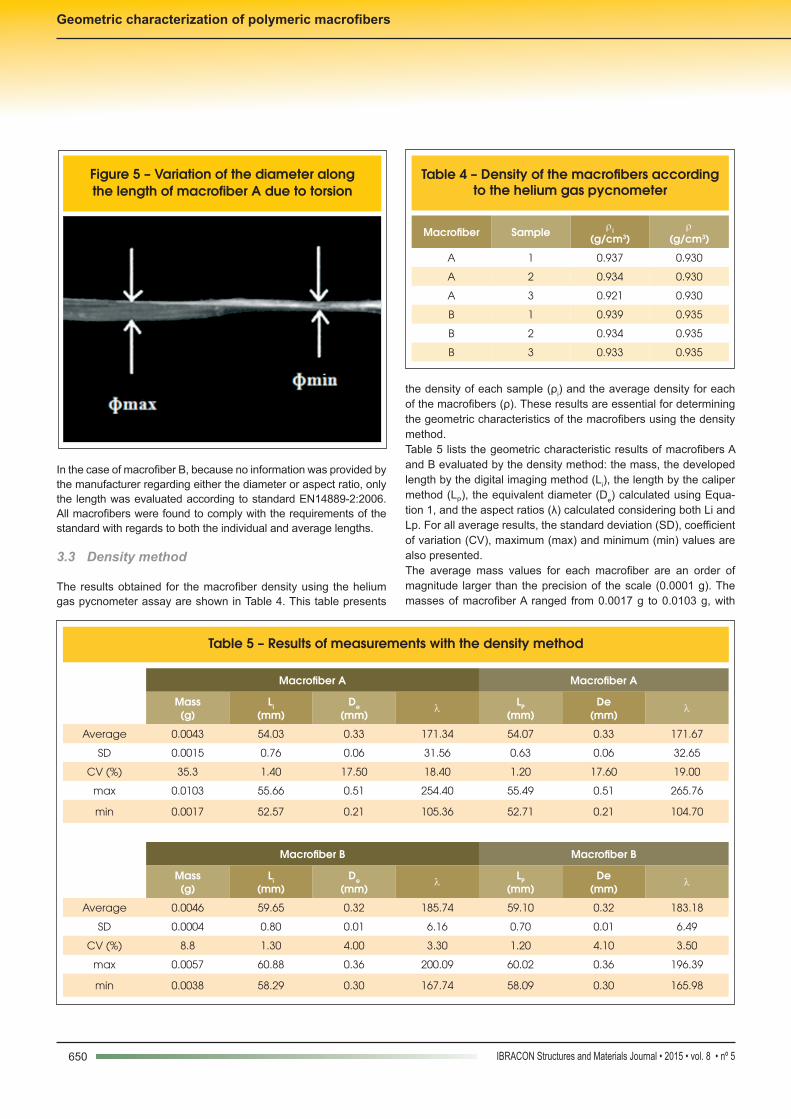
Table 3 shows the geometric characteristics of the macrofibers evaluated by digital imaging. For macrofibers A and B, the results presented are as follows: the measured average diameter of the macrofiber on a single plane according to the projection of the scanned image (D), the developed length (L), and finally, the as-pect ratio (λ) considering the ratio between L and D. For all average results, the standard deviation (SD), coefficient of variation (CV), maximum (max) and minimum (min) values are also presented.Only the projected macrofiber image on a single plane was consid-ered when calculating the diameter by the digital imaging method. Therefore, it was not possible to obtain a more accurate assess-ment because the macrofibers had variable cross-sections along their lengths. This is especially true for macrofiber A, which is thin-ner in some parts and thicker in other parts, according to the ex-hibited torsion (Figure 5).According to the dimensional tolerance criteria of the European standard EN14889-2:2006, it was found that 3% of the macrofiber A presented individual diameters that did not meet the tolerance of ±50% in relation to the nominal value. Additionally, the mean di-ameter falls outside the tolerance of ±5% in relation to the nominal value. Regarding the individual aspect ratio, all macrofibers are within the maximum tolerance of ± 50%. The mean aspect ratio also lies within the maximum permitted tolerance of ±10%. All in-dividual values of the length are within the tolerance of ±10%. The average length is also within the tolerance of ±5% in relation to the nominal value. Therefore, macrofiber A is within the tolerances of European standard EN14889-2:2006 only with respect to length.
Table 3 – Results of measurements with digital imaging
Macrofiber A Macrofiber A
L (mm) D (mm) λ L (mm) D (mm) λ
Average 54.03 0.37 149.70 59.65 0.32 189.71
SD 0.76 0.07 26.05 0.80 0.03 15.28
CV (%) 1.40 17.90 17.40 1.30 10.00 8.10
max 55.66 0.56 234.11 60.88 0.43 215.69
min 52.57 0.23 96.25 58.29 0.27 141.21
650 IBRACON Structures and Materials Journal • 2015 • vol. 8 • nº 5
Geometric characterization of polymeric macrofibers
In the case of macrofiber B, because no information was provided by the manufacturer regarding either the diameter or aspect ratio, only the length was evaluated according to standard EN14889-2:2006. All macrofibers were found to comply with the requirements of the standard with regards to both the individual and average lengths.
3.3 Density method
The results obtained for the macrofiber density using the helium gas pycnometer assay are shown in Table 4. This table presents
the density of each sample (ρi) and the average density for each of the macrofibers (ρ). These results are essential for determining the geometric characteristics of the macrofibers using the density method.Table 5 lists the geometric characteristic results of macrofibers A and B evaluated by the density method: the mass, the developed length by the digital imaging method (Li), the length by the caliper method (LP), the equivalent diameter (De) calculated using Equa-tion 1, and the aspect ratios (λ) calculated considering both Li and Lp. For all average results, the standard deviation (SD), coefficient of variation (CV), maximum (max) and minimum (min) values are also presented.The average mass values for each macrofiber are an order of magnitude larger than the precision of the scale (0.0001 g). The masses of macrofiber A ranged from 0.0017 g to 0.0103 g, with
Figure 5 – Variation of the diameter along the length of macrofiber A due to torsion
Table 4 – Density of the macrofibers according to the helium gas pycnometer
Macrofiber Sample ρi(g/cm3)
ρ(g/cm3)
A 1 0.937 0.930
A 2 0.934 0.930
A 3 0.921 0.930
B 1 0.939 0.935
B 2 0.934 0.935
B 3 0.933 0.935
Table 5 – Results of measurements with the density method
Macrofiber A Macrofiber A
Mass(g)
Li(mm)
De(mm)
λ LP(mm)
De(mm)
λ
Average 0.0043 54.03 0.33 171.34 54.07 0.33 171.67
SD 0.0015 0.76 0.06 31.56 0.63 0.06 32.65
CV (%) 35.3 1.40 17.50 18.40 1.20 17.60 19.00
max 0.0103 55.66 0.51 254.40 55.49 0.51 265.76
min 0.0017 52.57 0.21 105.36 52.71 0.21 104.70
Macrofiber B Macrofiber B
Mass(g)
Li(mm)
De(mm)
λ LP(mm)
De(mm)
λ
Average 0.0046 59.65 0.32 185.74 59.10 0.32 183.18
SD 0.0004 0.80 0.01 6.16 0.70 0.01 6.49
CV (%) 8.8 1.30 4.00 3.30 1.20 4.10 3.50
max 0.0057 60.88 0.36 200.09 60.02 0.36 196.39
min 0.0038 58.29 0.30 167.74 58.09 0.30 165.98
651IBRACON Structures and Materials Journal • 2015 • vol. 8 • nº 5
A. R. E. CÁCERES | I. GALOBARDES | M. S. REBMANN | R. MONTE | A. D. DE FIGUEIREDO
a coefficient of variation of 35.3%, which demonstrates that when separating the individual filaments of the bundles, the filaments present variable sections with great mass variation between individual macrofibers. In the case of macrofiber B, the masses vary from 0.0038 g to 0.0057 g, with a coefficient of variation of 8.8%, corresponding to a relatively small varia-tion in the mass.Using the density method, the average equivalent diameter of each macrofiber was calculated directly. The ranges of variation of this diameter were similar when using the length obtained by either the digital imaging method (Li) or caliper method (LP): from 0.21 mm to 0.51 mm with a mean value of 0.33 mm for macrofiber A and from 0.30 mm to 0.36 mm with a mean value of 0.32 mm for macrofiber B. This similarity was confirmed by applying the paired t-test for both macrofiber A and B, in which the difference between the values of the average diameter is essentially zero at a 95% confidence level. When the devel-oped length obtained by the digital imaging method was used, the values of the aspect ratio were 171.34 and 185.74 for mac-rofibers A and B, respectively. However, when the length mea-surements obtained via the caliper method were used, a slight variation in the aspect ratio was observed, resulting values of 171.67 and 183.18 for macrofibers A and B, respectively.Considering the tolerances of the standard EN14889-2:2006, all individual diameters of macrofiber A are within the tolerance of ±50% when compared with the nominal value. Similarly, the average diameter value is within the tolerance of ±5%. Re-garding the individual aspect ratio, 8% of the macrofibers are outside the ±50% tolerance, and the average aspect ratio is within the tolerance of ±10% compared to the nominal value. Therefore, macrofiber A does not comply with the European standard because 8% of the macrofibers were not within the tolerance level for the individual aspect ratio.For macrofiber B, it was not possible to determine whether the diameter obtained by the density method satisfies the dimen-sional tolerances established by European standard EN14889-2:2006 because the nominal diameter was not reported by the manufacturer. This value is important and should be provided by the manufacturer.
4. Comparative analysis of the methods
A comparative analysis of the diameter and length values of the macrofibers obtained by the different test methods is pre-sented here. Additionally, the experimental results are com-pared with the data provided by the manufacturers. The length results determined with the caliper and digital imaging meth-ods reported first, followed by the experimental results for the diameters obtained using the three methods applied (caliper, digital imaging and density).Statistical analysis was performed using the software MINITAB 17. To evaluate whether the results had a normal distribution, the Anderson-Darling normality test was applied at a 95% con-fidence level. The results were also analyzed for their degree of distortion with respect to a symmetric distribution by calcu-lating the skewness coefficient. When this coefficient is close to zero, the distribution can be considered symmetrical. For positive or negative skewness coefficients, the distribution is
considered asymmetrical to the right or to the left, respectively. A box plot was used as a criterion for the detection of spurious values. In this method, the spurious values are those included outside the upper and lower limits of the box (MONTGOMERY; RUNGER, 2004).
4.1 Comparison of the lengths
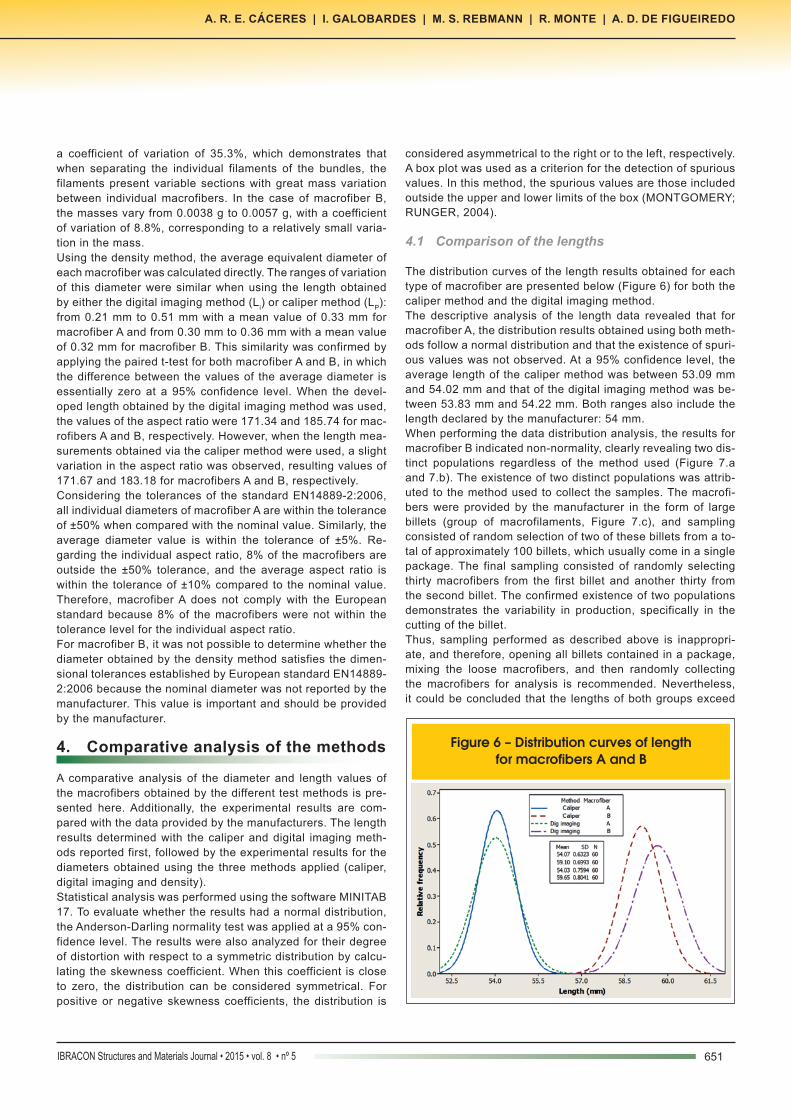
The distribution curves of the length results obtained for each type of macrofiber are presented below (Figure 6) for both the caliper method and the digital imaging method.The descriptive analysis of the length data revealed that for macrofiber A, the distribution results obtained using both meth-ods follow a normal distribution and that the existence of spuri-ous values was not observed. At a 95% confidence level, the average length of the caliper method was between 53.09 mm and 54.02 mm and that of the digital imaging method was be-tween 53.83 mm and 54.22 mm. Both ranges also include the length declared by the manufacturer: 54 mm.When performing the data distribution analysis, the results for macrofiber B indicated non-normality, clearly revealing two dis-tinct populations regardless of the method used (Figure 7.a and 7.b). The existence of two distinct populations was attrib-uted to the method used to collect the samples. The macrofi-bers were provided by the manufacturer in the form of large billets (group of macrofilaments, Figure 7.c), and sampling consisted of random selection of two of these billets from a to-tal of approximately 100 billets, which usually come in a single package. The final sampling consisted of randomly selecting thirty macrofibers from the first billet and another thirty from the second billet. The confirmed existence of two populations demonstrates the variability in production, specifically in the cutting of the billet. Thus, sampling performed as described above is inappropri-ate, and therefore, opening all billets contained in a package, mixing the loose macrofibers, and then randomly collecting the macrofibers for analysis is recommended. Nevertheless, it could be concluded that the lengths of both groups exceed
Figure 6 – Distribution curves of length for macrofibers A and B

652 IBRACON Structures and Materials Journal • 2015 • vol. 8 • nº 5
Geometric characterization of polymeric macrofibers
the length specified by the manufacturer: 58 mm. At a 95% confidence level, the average value is between 58.92 mm and 59.28 mm by the caliper method and between 59.44 mm and 59.86 mm by the digital imaging method.According to the paired t-test, comparing the length of macrofiber A measured by the caliper method with that measured by the digital imaging method did not reveal a significant difference. The aver-age value of the difference was found to be essentially zero with a 95% confidence interval of -0.11 mm to 0.18 mm, confirming that these methods can be considered equivalent. This similarity oc-curred because the individual macrofibers of macrofiber A were stretched prior to being measured with the calipers (Figure 2.b).For macrofiber B, the same comparative analysis via the paired t-test revealed a slight variation between the methods. The differ-ence in the means was found to range from -0.62 mm to -0.48 mm. The fact that both values are negative confirms that the length of macrofiber B determined by the caliper method was always smaller than that of the digital imaging method. As a result, the averages were found to be significantly different at a 95% confidence level. It is possible that this difference arises from the fact that these mac-rofibers were measured directly (without stretching) with the cali-
pers, which led to a slight decrease in the length despite applying the smallest possible pressure between the caliper ends (Figure 2.c). Because these macrofibers did not exhibit undulation similar to that of macrofiber A, it was not necessary to stretch them prior to performing the measurement. However, the smaller difference observed in the caliper results indicates that stretching is a good practice, even when the macrofiber presents no tortuosity.
4.2 Comparison of the diameters
The statistical analysis based on the paired t-test is first presented for the diameter obtained using the density method. This method was performed to allow for comparison with the diameter values found using the length obtained by the caliper and digital image analysis methods. For macrofiber A, the results do not differ signifi-cantly. It was observed that the difference in averages was practi-cally zero with a 95% confidence interval of between -0.000382 mm and 0.000457 mm, confirming that both methods for determin-ing the length may be used to calculate the diameter.When the same analysis was applied to the results of mac-rofiber B, a slight variation in the diameter determined by the
Figure 7 – Histograms of the length distribution of macrofiber B by the caliper method a) and by the digital imaging method b); Billet or group of macrofibers B c)
C
A B
653IBRACON Structures and Materials Journal • 2015 • vol. 8 • nº 5
A. R. E. CÁCERES | I. GALOBARDES | M. S. REBMANN | R. MONTE | A. D. DE FIGUEIREDO
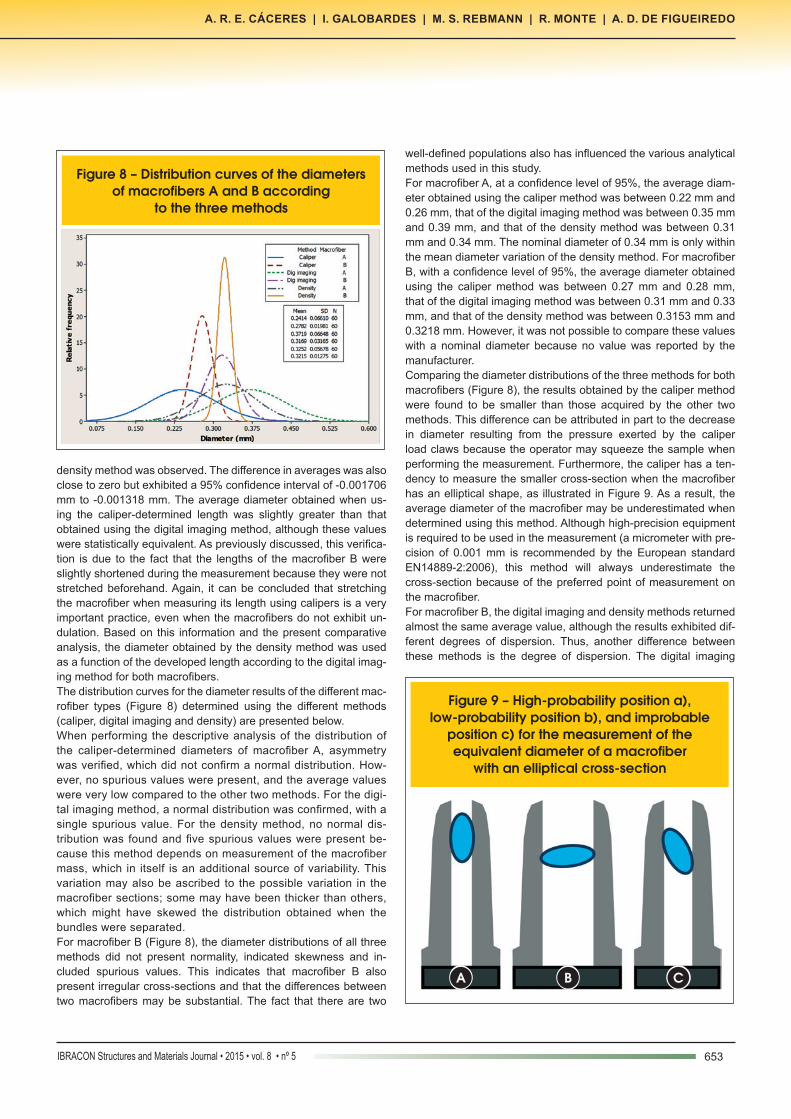
density method was observed. The difference in averages was also close to zero but exhibited a 95% confidence interval of -0.001706 mm to -0.001318 mm. The average diameter obtained when us-ing the caliper-determined length was slightly greater than that obtained using the digital imaging method, although these values were statistically equivalent. As previously discussed, this verifica-tion is due to the fact that the lengths of the macrofiber B were slightly shortened during the measurement because they were not stretched beforehand. Again, it can be concluded that stretching the macrofiber when measuring its length using calipers is a very important practice, even when the macrofibers do not exhibit un-dulation. Based on this information and the present comparative analysis, the diameter obtained by the density method was used as a function of the developed length according to the digital imag-ing method for both macrofibers.The distribution curves for the diameter results of the different mac-rofiber types (Figure 8) determined using the different methods (caliper, digital imaging and density) are presented below.When performing the descriptive analysis of the distribution of the caliper-determined diameters of macrofiber A, asymmetry was verified, which did not confirm a normal distribution. How-ever, no spurious values were present, and the average values were very low compared to the other two methods. For the digi-tal imaging method, a normal distribution was confirmed, with a single spurious value. For the density method, no normal dis-tribution was found and five spurious values were present be-cause this method depends on measurement of the macrofiber mass, which in itself is an additional source of variability. This variation may also be ascribed to the possible variation in the macrofiber sections; some may have been thicker than others, which might have skewed the distribution obtained when the bundles were separated.For macrofiber B (Figure 8), the diameter distributions of all three methods did not present normality, indicated skewness and in-cluded spurious values. This indicates that macrofiber B also present irregular cross-sections and that the differences between two macrofibers may be substantial. The fact that there are two
well-defined populations also has influenced the various analytical methods used in this study.For macrofiber A, at a confidence level of 95%, the average diam-eter obtained using the caliper method was between 0.22 mm and 0.26 mm, that of the digital imaging method was between 0.35 mm and 0.39 mm, and that of the density method was between 0.31 mm and 0.34 mm. The nominal diameter of 0.34 mm is only within the mean diameter variation of the density method. For macrofiber B, with a confidence level of 95%, the average diameter obtained using the caliper method was between 0.27 mm and 0.28 mm, that of the digital imaging method was between 0.31 mm and 0.33 mm, and that of the density method was between 0.3153 mm and 0.3218 mm. However, it was not possible to compare these values with a nominal diameter because no value was reported by the manufacturer.Comparing the diameter distributions of the three methods for both macrofibers (Figure 8), the results obtained by the caliper method were found to be smaller than those acquired by the other two methods. This difference can be attributed in part to the decrease in diameter resulting from the pressure exerted by the caliper load claws because the operator may squeeze the sample when performing the measurement. Furthermore, the caliper has a ten-dency to measure the smaller cross-section when the macrofiber has an elliptical shape, as illustrated in Figure 9. As a result, the average diameter of the macrofiber may be underestimated when determined using this method. Although high-precision equipment is required to be used in the measurement (a micrometer with pre-cision of 0.001 mm is recommended by the European standard EN14889-2:2006), this method will always underestimate the cross-section because of the preferred point of measurement on the macrofiber.For macrofiber B, the digital imaging and density methods returned almost the same average value, although the results exhibited dif-ferent degrees of dispersion. Thus, another difference between these methods is the degree of dispersion. The digital imaging
Figure 8 – Distribution curves of the diameters of macrofibers A and B according
to the three methods
Figure 9 – High-probability position a), low-probability position b), and improbable
position c) for the measurement of the equivalent diameter of a macrofiber
with an elliptical cross-section
A B C
654 IBRACON Structures and Materials Journal • 2015 • vol. 8 • nº 5
Geometric characterization of polymeric macrofibers
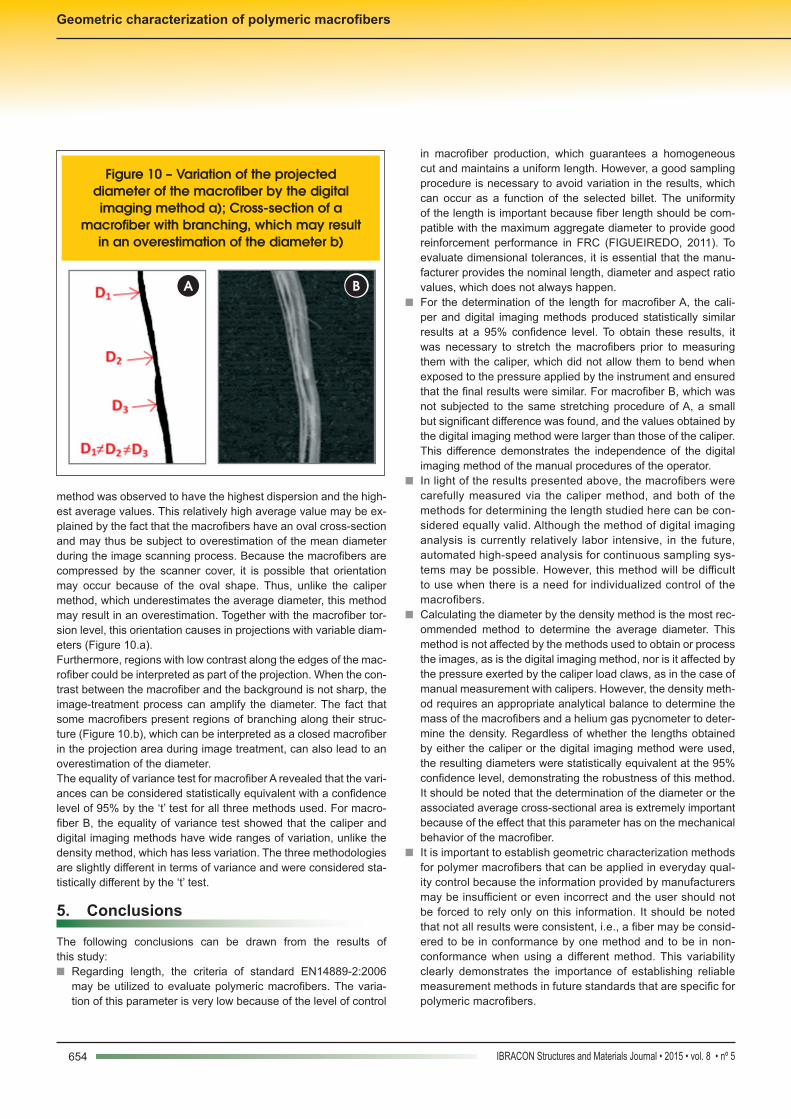
method was observed to have the highest dispersion and the high-est average values. This relatively high average value may be ex-plained by the fact that the macrofibers have an oval cross-section and may thus be subject to overestimation of the mean diameter during the image scanning process. Because the macrofibers are compressed by the scanner cover, it is possible that orientation may occur because of the oval shape. Thus, unlike the caliper method, which underestimates the average diameter, this method may result in an overestimation. Together with the macrofiber tor-sion level, this orientation causes in projections with variable diam-eters (Figure 10.a).Furthermore, regions with low contrast along the edges of the mac-rofiber could be interpreted as part of the projection. When the con-trast between the macrofiber and the background is not sharp, the image-treatment process can amplify the diameter. The fact that some macrofibers present regions of branching along their struc-ture (Figure 10.b), which can be interpreted as a closed macrofiber in the projection area during image treatment, can also lead to an overestimation of the diameter.The equality of variance test for macrofiber A revealed that the vari-ances can be considered statistically equivalent with a confidence level of 95% by the ‘t’ test for all three methods used. For macro-fiber B, the equality of variance test showed that the caliper and digital imaging methods have wide ranges of variation, unlike the density method, which has less variation. The three methodologies are slightly different in terms of variance and were considered sta-tistically different by the ‘t’ test.
5. Conclusions
The following conclusions can be drawn from the results of this study:n Regarding length, the criteria of standard EN14889-2:2006
may be utilized to evaluate polymeric macrofibers. The varia-tion of this parameter is very low because of the level of control
Figure 10 – Variation of the projected diameter of the macrofiber by the digital imaging method a); Cross-section of a
macrofiber with branching, which may result in an overestimation of the diameter b)
A B
in macrofiber production, which guarantees a homogeneous cut and maintains a uniform length. However, a good sampling procedure is necessary to avoid variation in the results, which can occur as a function of the selected billet. The uniformity of the length is important because fiber length should be com-patible with the maximum aggregate diameter to provide good reinforcement performance in FRC (FIGUEIREDO, 2011). To evaluate dimensional tolerances, it is essential that the manu-facturer provides the nominal length, diameter and aspect ratio values, which does not always happen.
n For the determination of the length for macrofiber A, the cali-per and digital imaging methods produced statistically similar results at a 95% confidence level. To obtain these results, it was necessary to stretch the macrofibers prior to measuring them with the caliper, which did not allow them to bend when exposed to the pressure applied by the instrument and ensured that the final results were similar. For macrofiber B, which was not subjected to the same stretching procedure of A, a small but significant difference was found, and the values obtained by the digital imaging method were larger than those of the caliper. This difference demonstrates the independence of the digital imaging method of the manual procedures of the operator.
n In light of the results presented above, the macrofibers were carefully measured via the caliper method, and both of the methods for determining the length studied here can be con-sidered equally valid. Although the method of digital imaging analysis is currently relatively labor intensive, in the future, automated high-speed analysis for continuous sampling sys-tems may be possible. However, this method will be difficult to use when there is a need for individualized control of the macrofibers.
n Calculating the diameter by the density method is the most rec-ommended method to determine the average diameter. This method is not affected by the methods used to obtain or process the images, as is the digital imaging method, nor is it affected by the pressure exerted by the caliper load claws, as in the case of manual measurement with calipers. However, the density meth-od requires an appropriate analytical balance to determine the mass of the macrofibers and a helium gas pycnometer to deter-mine the density. Regardless of whether the lengths obtained by either the caliper or the digital imaging method were used, the resulting diameters were statistically equivalent at the 95% confidence level, demonstrating the robustness of this method. It should be noted that the determination of the diameter or the associated average cross-sectional area is extremely important because of the effect that this parameter has on the mechanical behavior of the macrofiber.
n It is important to establish geometric characterization methods for polymer macrofibers that can be applied in everyday qual-ity control because the information provided by manufacturers may be insufficient or even incorrect and the user should not be forced to rely only on this information. It should be noted that not all results were consistent, i.e., a fiber may be consid-ered to be in conformance by one method and to be in non- conformance when using a different method. This variability clearly demonstrates the importance of establishing reliable measurement methods in future standards that are specific for polymeric macrofibers.

655IBRACON Structures and Materials Journal • 2015 • vol. 8 • nº 5
A. R. E. CÁCERES | I. GALOBARDES | M. S. REBMANN | R. MONTE | A. D. DE FIGUEIREDO
6. Acknowledgements
The authors would like to thank the São Paulo Research Foun-dation (Fundação de Amparo à Pesquisa do Estado de São Paulo – FAPESP) for the financial support provided via the post-doctoral fellowship to the second author (process 2014/24410-6) and the doctoral scholarship provided to the third author (process 2012/21134-2).The authors also thank the Foundation for Technological Devel-opment of Engineering (Fundação para o Desenvolvimento Tec-nológico da Engenharia) project (USP/BRASKEM) module 1: Me-chanical characterization of polypropylene macrofibers.
7. References
[1] AMERICA SOCIETY FOR TESTING MATERIALS. ASTM A820/A820M: Standard specification for steel fiber for fiber-reinforced concrete, 2011.
[2] ARGANDA-CARRERAS, I. AnalyzeSkeleton. Available from: http://fiji.sc/AnalyzeSkeleton. Accessed on: 26 fev. 2015.
[3] ASSOCIAÇÃO BRASILEIRA NORMAS TÉCNICAS – ABNT. NBR 15530: fibras de aço para concreto [NBR 15530: steel fibers for concrete]. Rio de Janeiro, 2007.
[4] CECCATO, M. R. Estudo da trabalhabilidade do concreto refor-çado com fibras de aço [Study on the workability of steel fibers-reinforced concrete]. 1998. Dissertation (Masters). Escola Poli-técnica da Universidade de São Paulo, São Paulo. 1998.
[5] DENG, Z.; KE, WE. A new measuring method of wool fiber diameter based on image processing. 2nd International Con-ference on Signal Processing Systems (ICSPS), Jul. 2010, [S.l: s.n.], Jul. 2010. p. V2–587–V2–590.
[6] EN 14889-1. Fibres for concrete – Part 1: Steel fibres – Defi-nitions, specifications and conformity. European Standard, 2006.
[7] EN 14889-2. Fibres for concrete – Part 2: Polymer fibres – Definitions, specifications and conformity. European Stan-dard, 2006.
[8] FIGUEIREDO, A. D. A nova especificação brasileira das fi-bras de aço para concreto [The new Brazilian specification for steel fibers for concrete]. In: 50o. Congresso Brasileiro do Concreto - IBRACON 2008, 2008, Salvador. São Paulo: Instituto Brasileiro do Concreto - IBRACON, 2008.
[9] FIGUEIREDO, A. D.; CHAMA NETO, P. J.; FARIA, H. M. A nova normalização brasileira sobre fibras de aço [The new Brazilian standard on steel fibers]. Concreto e Contrução. , v.XXXVI, p.67 - 76, 2008.
[10] FIGUEIREDO, A. D. Concreto com fibras [Concrete with fi-bers]. In: CONCRETO: Ciência e tecnologia. 2ed. São Pau-lo: Instituto Brasileiro do Concreto (IBRACON), 2011, v.2, p. 1327-1365.
[11] HTUT TNS. Fracture processes in steel fibre reinforced con-crete. PhD Dissertation, School of Civil and Environmental Engineering, University of New South Wales, Sydney, 2010.
[12] IMAGEJ. Available from: http://imagej.nih.gov/ij/. Accessed on: 24 fev. 2015.
[13] LI, S.; YI, H.; SHANG, S. Measurement of diameter and scale of cashmere fibers by computer image analysis. Journal of
Fiber Bioengineering and Informatics, v. 5, n. 1, p. 95–103, 5 mar. 2012.
[14] MONTGOMERY, D.; RUNGER, G. Probabilidad y estadísti-ca aplicadas a la ingeniería. 2. ed., México, D.F.: Limusa Wiley, 2004.
[15] NAAMAN, A. Engineered Steel Fibers with Optimal Proper-ties for Reinforcement of Cement Composites. Journal of Advanced Concrete Technology, v. 1, n. 3, p. 241–252, 2003.
[16] OZNERGIZ, E.; KIYAK, Y. E.; KAMASAK, M. E.; YILDIRIM, I. Automated nanofiber measurement in SEM imagens us-ing a robust image analysis method. Volume 2014, Article ID 738490, 6 pages. Journal of Nanomaterials, v. 2014, p. e738490, 6 nov. 2014.
[17] PRUDENCIO Jr., L.; AUSTIN, S.; JONES, P.; ARMELIN, H.; ROBINS, P. Prediction of steel fibre reinforced concrete un-der flexural from an inferred fibre pull-out response. Materi-als and Structures, v. 39, n. 6, p. 601–610, 16 jun. 2006.
[18] SHIN, E. H.; CHO, K. S.; KIM, M.H.S. Determination of elec-trospun fiber diameter distributions using image analysis processing. Macromolecular Research, v. 16, n. 4, p. 314–319, 1 jun. 2008.
[19] ZĪLE, E.; ZĪLE, O. Effect of the fiber geometry on the pull-out response of mechanically deformed steel fibers. Cement and Concrete Research, v. 44, p. 18–24, fev. 2013.