geomorphological hazard mapping of … abstract: marani barzani m. & salleh k.b.o,...
TRANSCRIPT
13
AbstrAct: Marani Barzani M. & Salleh K.B.O, Geomorpholog-ical mapping hazard of the Zayandeh Rood Basin, Iran. (IT ISSN 0391 - 9838, 2016)
River basins are morphological manifestations of the earth’s sur-face and tend to be the focus of human activities and human popula-tion concentrations since the earliest human civilizations. This paper discusses a methodology that utilizes the combined use of different types of geomorphological hazards to describe the geomorphological hazard threat in the Zayandeh Rood Basin in Iran. Two major clusters of geomorphological hazards associated with tectonic and desertifica-tion processes were identified. The tectonic hazard parameters used in the analysis are magnitude, depth, faults zone and plate boundary activity. Whilst, the desertification hazard parameters are soil charac-teristics, climate quality, land use type, landform type, elevation and the location the sites.
Key WOrdS: Geomorphological hazard, Geomorphological hazard mapping, tectonic hazard, desertification hazard, hazard parameters, Central Iran.
1. INTRODUCTION
Geomorphological hazards are attributed to the im-pact of geomorphological processes. These hazards result from the endogenic and exogenic processes that occur on the earth surface. Earthquakes and volcanoes are endog-enic processes and are exogenic hazards. Desertification, soil erosion and droughts are associated with sub-surface process and are categorized as exogenic hazards. Geomor-phological hazards that describe each of the earthquake & desertification hazard were mapped and an integrated assessment carried out to create a composite geomorpho-logical hazard map.
Slaymaker (1996) and (Alcántara (2002) states that haz-ards are the result of the sudden changes in the long-term behavior of process behavior from their initial conditions. Geomorphic hazards are categorized as endogenous (vol-canism and tectonics) and exogenous (floods, karst col-lapse, snow avalanche, channel erosion, sedimentation, mass movement, tsunamis and coastal erosion), and those induced by the climate and land-use change (desertifica-tion, permafrost, degradation, soil erosion, salinization and floods).
Hazard classification map are efficient tools for spatial viewing, assessing, predicting, preventing and managing of hazards (Kamp, 2008; Matteuccia, 2009). When an area is exposed to more than one hazard a composite hazard analysis of hazards based on overlaying of individual haz-ard map can identify the critical center of the composite hazard. Classification of hazard maps depend on the pa-rameters that describe the hazard. Combination methods are used to associate hazard factors through the classifi-cation method. Several methods were used to integrate hazard parameters in a composite hazard analysis and in-cludes using weighted averages, and the algebra and fuzzy model (Azarkar 2006; Ahmadi 2006; Afif 2010; Lee, 2010). A weighted average method is an average of two quanti-ty variables. These weightings determine the relative im-portance of each quantity based on averages. Weightings are the equivalents of many similar items with the same average values. Through the weighted average method, one can estimate the conditional probability of the hazard in an area. To combine information of the selected layers for hazard, the weighted sum can be used. The combination method can also be used to combine the hazard map to display a multi-hazard map in a single map.
Earthquake and desertification are types of geomor-phological hazards as a result of endogenic and exogen-ic geomorphological processes (Alcantara, 2002). In the Zayandeh Rood Basin, geomorphological hazards are ac-tive and affect human activities. It is very important to rec-
(*) Department of Geography, University of Malaya Kuala Lumpur, Malaysia
Corresponding author: Maryam Marani Barzani.
The work was supported by the University of Malaya and the data gath-ering was supported by Natural Resources Organization of Isfahan, Iran.
Geogr. Fis. Dinam. Quat. DOI 10.4461/GFDQ. 2016. 39.239 (2016). 13-20, 8 figg., 5 tabb.
MaryaM MARANI BARZANI (*) & KhairulMaini Bin OSMan SALLEH (*)
GEOMORPHOLOGICAL HAZARD MAPPINGOF THE ZAYANDEH ROOD BASIN, IRAN

14
ognize the critical center of these hazards so as to decide on the right management approach. In this area, more atten-tion should be paid to the most important hazards, such as earthquake, due to the existence of factors of fault, tectonic plate boundary and desertification hazard. Otherwise, this area will be at risk of further deterioration.
Qualitative and quantitative factors were used to assess the desertification hazard. (Ekhtesasi & Mohajeri 1995; FAO 1990) for dried lands some of Asian countries. The factors identified with climatic quality and human activ-ities. Additionally, a semi-quantitative method was intro-duced for desertification mapping based on the soil indi-cators. The desertification aspects were classified as the potential and inherent risk as well as the rate and total risk. The desertification intensity was subdivided on a scale of four: from slight to very severe (Sepehr 2007).
In the ESAS project, referred to as the MEDALUS, four major criteria of Soil, Vegetation, Management and Climate were investigated using the main indicators for each major criterion. The geometric mean was used for quality map-ping. Landform and geology characteristics were excluded from the assessment.
The USGS (1996) used these parameters to contribute to the earthquake hazard map. During 1996-2008, the US Geological Survey produced an earthquake hazard map to classify the seismic hazard map. For example, a seismic hazard map was produced based on the historic seismicity and fault characteristics to classify a seismic hazard map for Alaska and Hawaii.
This study focuses on the spatial distribution and clas-sification earthquake and desertification hazards in the Zayandeh Rood Basin. Earthquake and desertification haz-ards maps were based on previous studies on the area. The main objective of this study is to produce a multi-hazards map, and to identify critical and safe areas using the Arc map 10.1 software. The weighted average will be used for the computation of a composite hazard map.
The study had two stages: 1) to investigate parameters of the classified earthquake and classified desertification hazard maps separately, and 2) to investigate the classi-fied earthquake and classified desertification hazard maps through five classes of hazard in the same category of very low, low, moderate, high and very high.
2. THE STUDY AREA
The Zayandeh Rood Basin (Z.R.B) is located in the central part of Iran. The area of the basin is about 42,000 km2. Figure 1 shows the location of this basin on the map. Geomorphological processes caused geomorphological hazards in Z.R.B, including tectonic activities, such as convergence of the Arabian and Eurasia plate locations. Fault types were the main cause of earthquake in Z.R.B. Desertification hazard parameters of climate parameters, land use, geographical location and geomorphological landform were recognized as the causes of desertification in this area.
Fig. 1 - Location of Zayandeh Rood Basin in Iran (Marani M. Barzani & O. S. Khairulmaini, 2013).

15
The maximum precipitation of the basin occurs during Winter in January and February, while the minimum is during Summer in July and August. The average annual precipitation is 105.84 mm, the average annual tempera-ture is 14.9ºC and the average evaporation is 2219.3 mm. The wind erosion in the area shows the orientation of powerful winds blowing from west to southeast and an average wind speed is 3.5 m/s (Khodagholi, 2006). The most important factors in the drought in the study area are geographical location, non-normative exploitation of the surface mineral of gypsum, non-normative exploita-tion of land, reduced entrance runoff from upstream re-gions, a sharp drop in the groundwater level, winds and-storms laden with chalk, dust and suspended particles, low precipitation and high evaporation.
3. MATERIALS AND METHODS
Classification hazard maps were used in this research, including the classified earthquake hazard map and the classified desertification hazard map. This data set includes series of sum and scoring factors of the hazards. The clas-sified hazards maps were obtained based on the parame-ters of the hazard, which depend on the situation of Z.R.B. through the weighted sum estimation
Figure 2 shows the parameters of earthquake hazard and desertification hazard. To produce the map, the clas-sified factors by the weighted average were combined and then were re-classified. Also, the flow chart presents the combination of hazards as the classification hazard.
3.1. Investigation of parameters of classified earthquake hazard map
Map of classification earthquake hazard was obtained using the earthquake parameters of fault line, earthquake point, magnitude, depth and boundary of the tectonic plate (tab. 2) in the GIS environment. Tables 1 and 2 shows the attributes of magnitude (2.6-4.6), depth (6-51) and fault earthquake hazard in the Z.R.B. The map of classified earthquake hazard (fig. 3) shows five levels of hazard in the Z.R.B. Based on the measured earth quake parameters, the highest class of hazard is located in South, North-West and East parts of the basin.
This step focused on the classification of parameters based on the range of attributes, scoring the parameters, the sum of scores and analysis interpolation. The ranges of parameters are shown in table 2.
The magnitude comprised of five classes with a range of 2.6 to 4.6 (tab. 1). The range of scores for the magni-tude was 0-25, with five clasess (6 -51) for the depth (tab. 1) with range of 25-0. The classified faults were based on the types of fault in the area. The classes of the fault line map with respect to three types of fault were the fault thrust, major and minor, and the range of fault type was 1-3 (tab. 2). Classification parameters were calculated by scoring the parameters for the attributes and the sum of scores. The charateristics of earthquake and classification are ex-plained below.
Magnitude: Range of the earthquake magnitue in the Z.R.B is <2 – <4. In this reseach, the magnitude of earth-quake was grouped into five classes in the Arc Map 9. 3 (fig. 3).
Depth: The depth was recorded by the magnitudes of the earthquake point of the Z.R.B classification of depth is has been done in Arc Map 9. 3 to classify the earthquake hazards. Fig. 2 - Stages in the integrated assessment of hazards and the composite
hazard map.
TaBle 1 - Classes and estimate magnitudes for classification hazard map
MS class Depth Range Fault Active score
2. 6-2. 8 0-2 6 10-8 Thrust 3
2. 9-3. 2 2-4 6-18 8-6 Major 23. 3-3. 6 4-6 18-26 6-4 Minor 1
3. 7-4. 2 6-8 26-33 4-24. 2-4. 6 8-10 33-51 2-0
TaBle 2 - Classes and estimate parameters of classification earthquake map
parameters Range of scoreMagnitude 0-10Fault 1-3DepthBoundary of Tectonic plate
10-00-1

16
Fault: The fault classification was done using the fault line map. There are three types of faults, including the thrust, major and minor faults in the Arc Map 9. 3 (fig. 4).
Boundary of Tectonic Plate: In the Z.R.B, the Arabian tectonic plate and the Eurasian plate converge 22 + 2 mm yr-1 (Vernant & alii, 2004). In order to measure the bound-ary of tectonic plates, two groups were used, namely 0 that is far from the plate and 1, which is near to the plate (fig. 6).
The parameters were classified based on the preview models. The sum of factors served as indicators of the level classification. The grid map was used as a base map for scor-ing. The scores were calculated and then using a weighted average, all the factors were computed. The weighted aver-age of the values obtained from the factors within each grid as well as the classified parameters used for weighing were evaluated in a polygon-attribute table and displayed as the classification hazard maps (fig. 6).
3.2. Parameters of classified desertification hazard map
Classification of each factor was based on the scoring and mapping of the desertification hazard map in the GIS environment. The following section will explain the maps for the classified vectors and raster for the classified deser-tification hazard map.
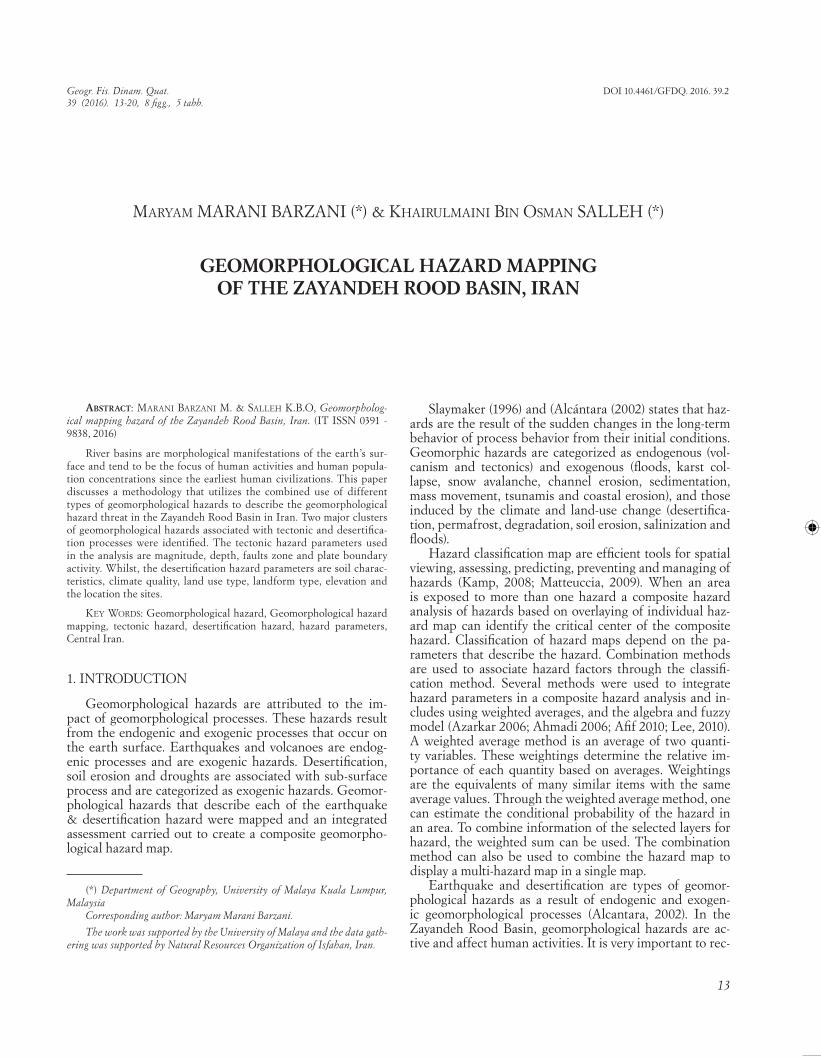
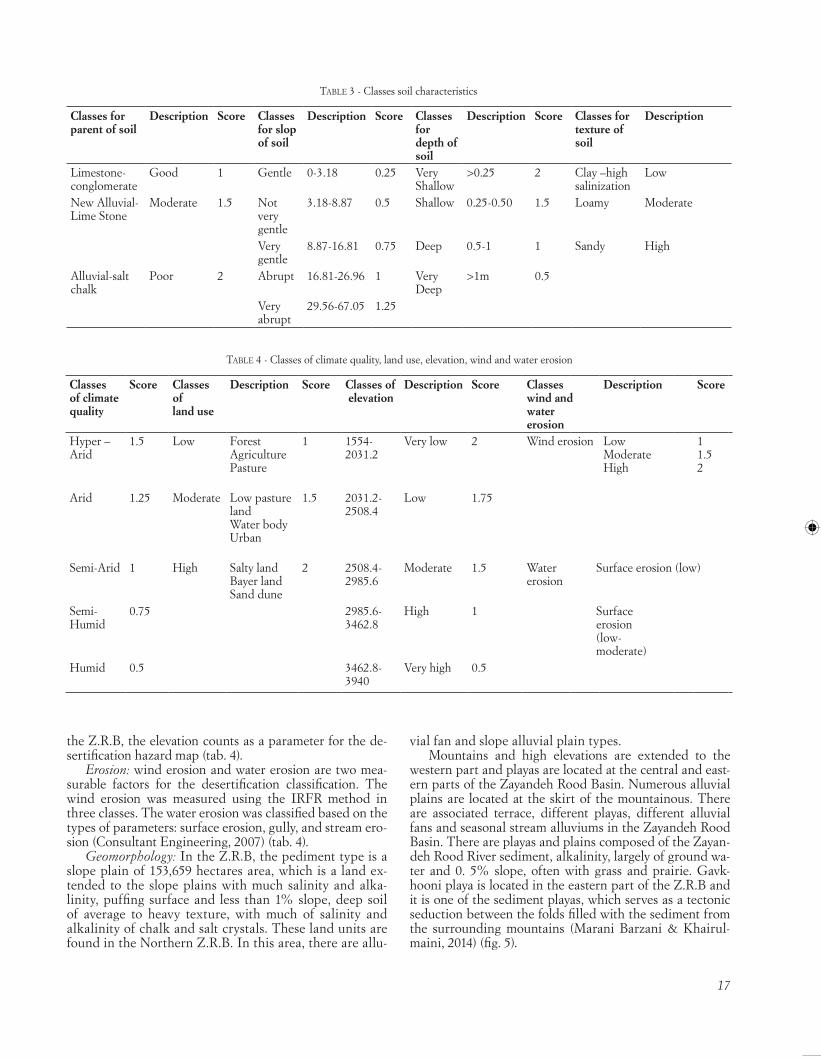
Soil: in the desert area, soil loss plays an important role in increasing the desertification rate. Soil temperature, soil organic matter, soil slope and soil depth play roles in the desert ecosystem. In this study, the soil dataset was used for soil characteristics, such as the depth, texture and parent soil. The soil information was extracted using a vector map. The soil depth and texture were classified in the GIS en-vironment. Table 3 shows the classes of soil characteristics in this study. The soil information was collected from the reports of the Iran Natural Resources Organization.
Climate quality: climatic factors, such as wind, evapo-ration, precipitation and temperature are important in the development of deserts in the arid and semi-arid areas. A climate quality map was classified on the annual precip-itation and potential for evaporation by the climatologic organizations (tab. 4).
Land use: one of the direct effects of the factors re-sponsible for desertification and land degradation is the land use. The land use is a function of human activities. In the Z.R.B, the climate and topography are different; thus, the land use varies. In this study, the land use clas-sification was re-classified based on the purpose of the study (tab. 4).
Elevation: an important parameter for assessment and desertification is elevation. Due to the height difference in
Fig. 3 - Location of earthquake and fault in study area. Fig. 4 - Location of tectonical zone in study area.
17
the Z.R.B, the elevation counts as a parameter for the de-sertification hazard map (tab. 4).
Erosion: wind erosion and water erosion are two mea-surable factors for the desertification classification. The wind erosion was measured using the IRFR method in three classes. The water erosion was classified based on the types of parameters: surface erosion, gully, and stream ero-sion (Consultant Engineering, 2007) (tab. 4).
Geomorphology: In the Z.R.B, the pediment type is a slope plain of 153,659 hectares area, which is a land ex-tended to the slope plains with much salinity and alka-linity, puffing surface and less than 1% slope, deep soil of average to heavy texture, with much of salinity and alkalinity of chalk and salt crystals. These land units are found in the Northern Z.R.B. In this area, there are allu-
vial fan and slope alluvial plain types.Mountains and high elevations are extended to the
western part and playas are located at the central and east-ern parts of the Zayandeh Rood Basin. Numerous alluvial plains are located at the skirt of the mountainous. There are associated terrace, different playas, different alluvial fans and seasonal stream alluviums in the Zayandeh Rood Basin. There are playas and plains composed of the Zayan-deh Rood River sediment, alkalinity, largely of ground wa-ter and 0. 5% slope, often with grass and prairie. Gavk-hooni playa is located in the eastern part of the Z.R.B and it is one of the sediment playas, which serves as a tectonic seduction between the folds filled with the sediment from the surrounding mountains (Marani Barzani & Khairul-maini, 2014) (fig. 5).
TaBle 3 - Classes soil characteristics
Classes for parent of soil
Description Score Classes for slop of soil
Description Score Classes for depth of soil
Description Score Classes for texture of soil
Description
Limestone- conglomerate
Good 1 Gentle 0-3.18 0.25 Very Shallow
>0.25 2 Clay –high salinization
Low
New Alluvial- Lime Stone
Moderate 1.5 Not very gentle
3.18-8.87 0.5 Shallow 0.25-0.50 1.5 Loamy Moderate
Very gentle
8.87-16.81 0.75 Deep 0.5-1 1 Sandy High
Alluvial-salt chalk
Poor 2 Abrupt 16.81-26.96 1 Very Deep
>1m 0.5
Very abrupt
29.56-67.05 1.25
TaBle 4 - Classes of climate quality, land use, elevation, wind and water erosion
Classes of climate quality
Score Classes ofland use
Description Score Classes of elevation
Description Score Classes wind and watererosion
Description Score
Hyper –Arid
1.5 Low ForestAgriculturePasture
1 1554-2031.2
Very low 2 Wind erosion LowModerateHigh
11.52
Arid 1.25 Moderate Low pasture landWater bodyUrban
1.5 2031.2-2508.4
Low 1.75
Semi-Arid 1 High Salty landBayer land Sand dune
2 2508.4-2985.6
Moderate 1.5 Water erosion
Surface erosion (low)
Semi-Humid
0.75 2985.6-3462.8
High 1 Surface erosion (low-moderate)
Humid 0.5 3462.8-3940
Very high 0.5

18
Lithology: In the study area, granite, gneiss, schist and andesite stone massifs belong to the Precambrian period, the oldest formation. Stones of Triassic period can be di-vided into two parts. The lower part is composed of lime and dolomite stones, new and old alluvial and the upper part is generated from tafoni, shale and sandstone. In the eastern part of the basin, there is shale and in the western part of the basin, there is Jurassic formation. In its upper part, there are lime stones and in the lower part, there are lime and shale.
In the eastern part of the study area, there are sand-stones, dolomite and lime extending from the Carbon-iferous period. Non-conformity among the sedimentary
stones (lime, shale and marl), Barmin-Apsin and different Jurassic stones and Triassic shows the advancement of the cretaceous sea in the region. The faces from the cretaceous period are largely found at the basin level extending more towards the southern part. In the Zayandeh Rood Basin, the pediment type is a slope plain of 153,659 hectares area which is a land unit slope plain with much salinity and al-kalinity, puffing surface and less than 1% slope, deep soil of average to- heavy texture, with much of salinity and alkalinity of chalk and salt crystals. These land units are found in the northern part of the area, where are alluvial fan and slope alluvial plain type.
Parameters were classified based on the preview mod-els. The sum of factors serves as an indicator for level clas-sification. The grid map was used as a base map for scoring. The scores were calculated and then using a weighted aver-age, all the factors were computed.
The weighted average of the values obtained from the factors within each grid as well as the classified parame-ters used for weighing were evaluated in a polygon-attri-bute table and displayed as the classification hazard maps (fig. 7).
3.3. To produce classified composite hazards map
In order to combine the classified hazards maps, ho-mogenous of hazards map was produced. The parameters are hazard level of the classified earthquake and deserti-
Fig. 5 - Geomorphological map in Z.R.B. Fig. 6 - Classified Earthquake hazard map in Z.R.B.
TaBle 5 - Distribution of hazards classes area and percentage in Z.R.B.
Class Desertification D% Earthquake E%
1 571.97 1.376 101.1 0.242
2 2323.04 5.583 527.13 1.266
3 3603.75 8.661 642.42 1.543
4 4166.46 10.013 341.63 0.821
5 9024.41 21.689
Total 19689.63 47.321 1612.28 3.874

19
fication hazards map. In GIS environment, desertification and earthquake hazard layers was converted to raster layer and then the two raster layers was calculated by weighted sum and interpolated. All class of desertification hazard was compared with five class of earthquake hazard and investigated their overlapping in index weight attribute (fig. 8).
This analysis is values of earthquake class that shows the overlap and sum with desertification class. These val-ues were averaged of five classes using weight the class of earthquake and desertification and result will shows com-bine earthquake and desertification classes.
RESULTS AND DISCUSSION
This study provided the classification hazards maps of the Zayandeh Rood Basin, which feature the earthquake and desertification. The hazards maps included five levels of hazard. This step is focused on the investigation of the geomorphological hazards. Figure 5 shows the exposure of earthquake in the Z.R.B. The hazards map shows five classes of hazards in the Z.R.B. The “very high” class is the one with the highest density of hazards located in the Northwest, North and South of the Z.R.B, while the “very low” class is located in parts of the Center and South-West
of the Z.R.B. Distribution of other classes is extended to the whole area.
Most important factors of the earthquake hazard in the Zayandeh Rood Basin are the tectonic activities and the existing faults. In the West and South of the basin, earth-quake has occurred with magnitudes higher than 4.
Desertification has extended to the East part of the Zayandeh Rood Basin by the geographical location (close to the desert area) and the other factors, such as the climate quality, characteristic of soil, topography and human activ-ities. The most important factors are the “high” classes if the desertification hazard is close to the Isfahan city as it is the center of human activities in the Z.R.B (fig. 6).
Table 1 shows the hazards classification and area for each class of hazard. High class of desertification area is 9024.41 km2 , which is 21.689% of the whole basin area. The maturity of the hazard is located at the North and east of the Zayandeh Rood Basin High classes of earthquake area are 341.63 km2, which is 0.821% of the whole basin area. The maturity of earthquake is located at the West-North and South of the basin. High classes of land use area is 86.94 km2 that is 0.208% of the whole basin area.
Figure 8 shows the result of composite classification map of earthquake and desertification classification map. The composite hazard map included five classes, namely very low-low-moderate-high and very high.
Fig. 8 - Composite hazards map in Z.R.B.Fig. 7 - Classified Desertification hazard map in Z.R.B.

20
5. CONCLUSIONS
The integrated assessment of earthquake and desert-ification hazards were carried out using an Arc GIS soft-ware to create a composite geomorphological hazard map. The composite hazard map shows the scales of intensity of the hazard threat ranging from very low, low, medium, high and very high hazard threat that predominates an area. For a country like Iran, composite hazard analysis is very significant in hazard and risk management because of the presence of multi-hazards in an area. Composite hazard maps thus creates an awareness amongst resource developers, urban and rural planners, settlement devel-opment and the general population of the impending multi-hazard threats and precaution, adjustment and ad-aptation that needs to be carried out so as to minimize the individual hazard threat on population and its many forms of livelihood activities. The composite hazard map also describes that the hazard and risk management to be carried out for an area under high to very high hazard threat could involve generic adjustments(activities that covers all forms of hazards threat) and specific adjustment (activities that are specific to a particular hazard threat). This hazard map have a number of overarching charac-teristics that describe not only the intensity of the mul-tiple hazard threat (both earthquake and desertification )in an area but also the cluster and direction of hazard occurrence for an area. Spatial-Trend surface composite mapping can also be carried out to describe the direction of threat in the future for an area
REFERENCES
aFiF A. (2010) - Use of GIS and Remote Sensing for Environmental Sensi-tivity Assessment of North Coastal Part, Egypt, Journal of American Science; 6(11), 632-646.
ahMadi H. (Ed.) (2006) - Applied Geomorphology (Vol. 1). Tehran. Uni-versity of Tehran.
alcánTara-ayala I. (2002) - Geomorphology, natural hazards, vulnera-bility and prevention of natural disasters in developing countries. Geo-morphology, 47, 107-124.
azarKar S.M., ahMadi h., KhOraSani n. & KaraMi M. (2006) - Inves-tigating the relationship between wind erosion and value of animal hab-itats in desert areas. International Journal of Environmental Science and Technology, 2 (4), 387-393.
cOnSulTanT engineering (2007) - Zayandeh Rood Basin and Gov-khooni Marsh reports; Natural Resources Organization of Isfahan.
eKhTeSaSi M.r. & MOhajeri S. (1995) - Method of classification for type and intensity of desertification in Iran erosion sedimentation poten-tial with use of IRIFR. E. A and MPSIAK Models in Semi-Arid. Su-pervising Engineers in Iran Society: Sharing Solutions. National of Desertification and Control Desertification Conference, University Kerman, Iran.
KaMp a., ghazanFar B.j.g, KhaTTaK a. & OWen l. a. (2008) - Gis-based landslide susceptibility mapping for 2005 Kashmir earthquake region. Geomorphology, 101, 631-642.
KhOdaghOli M. (2006) - A survey of phyto-climatology of Zayandehroud basin. Pajouhesh Sazandegi, 70, 41-53.
lee S. T., yu T. T., peng W. F. & Wang C.L. (2010) - Incorporating the ef-fects of topographic amplification in the analysis of earthquake-induced landslide hazards using logistic regression. Natural Hazards Earth Sys-tem Science, 10, 2475-2488.
Marani Barzani M. & KhairulMaini O. S. (2013). Desertification risk mapping of the Zayandeh Rood Basin in Iran, Journal of Earth System Science. Indian Academy of Sciences. 122, No. 5, 1269-1282.
Marani Barzani M. & KhairulMaini O.S. (2014) - Earthquake hazard mapping of the Zayandeh Rood Basin in Iran. (2014) International Journal of Applied Engineering Research, 9 (20),6987-6999 © Re-search India Publications.
MaTTeuccia S.d., cOlMaa a. & laura plaa L. (2009)- Desertification Maps of Falcon State, Venezuela. Environmental Conservation; 9 (03), 217-224.
Sepehr A. (2007) - Quantitative assessment of desertification in south of Iran using MEDALUS method. Environment Monitorimg Assess-ment, 134, 243-254.
SlayMaKer, O., (1996). Geomorphic Hazards. Wiley, Chichester, 1-7.
USGS (1996)-U.S. Geological Survey Earthquake Data Base.
VernanT ph., nilFOrOuShan F., haTzFeld d., aBBaSSi M.r., Vigny c., MaSSOn F., nanKali h., MarTinOd j., aShTiani a., BaySer r., TaVaKOli F.& chery J.(2004), present day crustal deformation and plate kinematics in the Middle East constrained by GPS measurements in Iran and northern Oman. Geophysical International Journal, 157(1), 381-398.
(Ms presented 15 January 2015; accepted 15 April 2016)

Edizioni ETSPiazza Carrara, 16-19, I-56126 Pisa
[email protected] - www.edizioniets.comFinito di stampare nel mese di ottobre 2016