geophysical interpretations of the libby thrust belt ... · geophysical interpretations of the...
TRANSCRIPT

U . S . G E O L O G I C A L S U R V E Y P R O F E S S I O N A L P A P E R
Geophysical Interpretations of the Libby Thrust Belt,Northwestern Montana
M A R C H 3, 1849
U.S
.D
EPA
RTMENT OF THEINTE
RIO
R
Geophysical Interpretations of the Libby Thrust Belt,Northwestern Montana
By M. Dean Kleinkopf
With a section on Deep Folds and Faults Interpreted from Seismic DataBy Jack E. Harrison
And a section on Interpretation of Magnetotelluric SoundingsBy W.D. Stanley
DE
PARTMENT OF THE
INTER
U.S. GEOLOGICAL SURVEY PROFESSIONAL PAPER 1546
M A R C H 3, 1849
U.S
. IOR
UNITED STATES GOVERNMENT PRINTING OFFICE, WASHINGTON : 1997
For sale by U.S. Geological Survey, Information ServicesBox 25286, Federal Center
Denver, CO 80225
Any use of trade, product, or firm names in this publication is for descriptive purposes only anddoes not imply endorsement by the U.S. Government
Library of Congress Cataloging-in-Publication Data
U.S. DEPARTMENT OF THE INTERIOR
BRUCE BABBITT, Secretary
U.S. GEOLOGICAL SURVEY
Gordon P. Eaton, Director
Kleinkopf, M. Dean (Merlin Dean), 1926–Geophysical interpretations of the Libby thrust belt, northwestern Montana / by M.
Dean Kleinkopf ; with a section on deep folds and faults interpreted from seismic databy Jack E. Harrison and a section on interpretation on magnetotelluric soundings byW.D. Stanley.
p. cm. — (U.S. Geological Survey professional paper ; 1546)Includes bibliographical references.Supt. of Docs. no.: I 19.16: 15461. Thrust faults (Geology)—Montana. 2. Geology, Stratigraphic—Proterozoic.
3. Geology, Structural—Montana. 4. Geophysical prospecting—Montana.I. Title. II. Title: Libby thrust belt, northwestern Montana. III. Series.QE606.5.U6K52 1995551.8
′
7—dc20 94–1628CIP

CONTENTS
Abstract ........................................................................................................................... 1Introduction ..................................................................................................................... 2Geology........................................................................................................................... 2Aeromagnetic Anomaly Data.......................................................................................... 5Gravity Anomaly Data .................................................................................................... 5Geologic Interpretation of Aeromagnetic Anomalies ..................................................... 6Geologic Interpretation of Bouguer Gravity Anomalies................................................. 8Geophysical Interpretation of Deep-Seated Geologic Features ...................................... 9
Modeling of Gravity Profiles .................................................................................. 9Deep Folds and Faults Interpreted from Seismic Data, by Jack E. Harrison .......... 13Interpretation of Magnetotelluric Soundings, by W.D. Stanley.............................. 13
Summary and Conclusions.............................................................................................. 19References Cited ............................................................................................................. 19
PLATES
[Plates are in pocket]
1, 2. Maps of the area of the Libby thrust belt, northwestern Montana, showing:1. Total-intensity aeromagnetic anomalies, Bouguer gravity anomalies, and generalized geology.2. Residual total-intensity aeromagnetic anomalies, complete Bouguer gravity anomalies,
and structural features.
FIGURES
1, 2. Maps showing:1. Generalized geology of Belt terrane .................................................................................................................. 32. Structural features, lines of sections and profiles, and locations of magnetotelluric soundings,
Libby thrust belt.................................................................................................................................................. 43. Generalized lithologic and geophysical logs, Gibbs No.1 borehole.......................................................................... 10
4, 5. Gravity block models of extended geologic cross sections:4. B–B'.................................................................................................................................................................... 125. J–J' ..................................................................................................................................................................... 14
6. Diagram showing interpretation of seismic reflection profiles MT–1 and MT–2..................................................... 167. Generalized resistivity log of the Gibbs No. 1 borehole ........................................................................................... 178. Magnetotelluric and geologic section across the eastern part of the Libby thrust belt and the western part
of the Purcell anticlinorium ....................................................................................................................................... 18
TABLE
1. Lithologies and densities assumed for gravity models of extended geologic sections B–B' and J–J', Libby thrust belt, northwestern Montana................................................................................................................... 11
III

GEOPHYSICAL INTERPRETATIONS OF THE LIBBY THRUST BELT, NORTHWESTERN MONTANA
By M. Dean Kleinkopf
ABSTRACT
Interpretations of gravity and aeromagnetic anomalydata, as well as results from two seismic reflection profilesand five magnetotelluric soundings, were used to studyburied structure and lithology of the Libby thrust belt ofnorthwestern Montana. Gravity modeling, supplemented bystructural data from the seismic reflection profiles and geo-logic contraints derived from projection of surface geology,measured sections, and lateral consistency of sills, leads tothe interpretation that thrust slices of folded crystalline base-ment form the core of the Purcell anticlinorium and Sylva-nite anticline, which consist mainly of rocks of the MiddleProterozoic Belt Supergroup.
Gravity anomaly data show marked correlation withmajor structure of the area. The Purcell anticlinoriumexhibits positive anomalies in excess of 20 mGal and theSylvanite anticline anomalies in excess of 10 mGal. In thenorthern part of the study area, a distinct northwest-trendinghigh-gradient zone suggests that a buried crustal shear zonemay be present just north of Libby. The Rainy Creek andBobtail Creek stocks, which show distinct positive magneticanomalies, lie along this trend, and their emplacement mayhave been influenced by the postulated zone of deformation.
The most distinct magnetic anomalies in the principalstudy area are five positive anomalies associated with Creta-ceous or younger cupolas and stocks that either are exposedor are known from drillholes to be present in the near-sur-face. Amplitudes range from 100 to more than 3,000 nT.Short-wavelength anomalies are associated with outcrops ofmagnetite-bearing sedimentary rocks of the Ravalli Groupof the Belt Supergroup. A strip of high magnetic gradientcorrelates with the Hope fault zone. Modeling of the mag-netic anomaly data was not done because of the absence oflong-wavelength magnetic anomalies having likely sourcesin deeply buried Proterozoic crystalline basement. Themafic sills of dioritic to gabbroic composition show little orno magnetic response in outcrop, probably because the mag-netite content in the sills was reduced by chemical processesrelated to interaction of hydrothermal fluids with coolingmagmas of the intrusions.
Evidence from the magnetic and gravity anomaly datasuggests that the Cabinet Mountains Wilderness is underlainby a major batholith of felsic composition that extends fromnorth of the Dry Creek stock south almost to the VermilionRiver stock. Along this trend are a number of smallhigh-amplitude positive anomalies of 60–100 nT in areas ofoutcrops of the Wallace Formation of the Belt Supergroupand, in a few cases, the Ravalli Group. In the case of theRavalli rocks, the highs probably are not related to outcropsof magnetite-bearing Ravalli group rocks that in other placescause linear magnetic highs along ridge tops; instead,because of their equidimensional shape on the map, theymay indicate near-surface sources related to granitic intru-sions or cupolas of a larger batholith mass at a few kilome-ters depth beneath the Cabinet Mountains Wilderness.
A basal surface of detachment is inferred from a seriesof seismic reflections. Depth to the basal surface is 9–18 km,and this surface dips about 15° in inferred crystalline base-ment rocks. Strong reflections at and below 4 seconds areattributed to stratification in the basement such as layeredgneiss or mylonite along the detachment zone for the oldertectonic folding. No seismic reflection is present for theBelt-crystalline basement contact. Just below the Pinkhamthrust fault, strong reflections attributed to stratification incrystalline basement rocks image relief in the basement onthe western flank of the Purcell anticline.
Interpretation of the magnetotelluric data suggests athick conductive section that is incompatible with acrystalline basement composed of granitic gneiss, maficintrusive rocks, and high-grade metasedimentary rocks con-sidered typical for the region. Thus, there are major differ-ences between the deep crustal model developed from themagnetotelluric data and the model obtained from thegravity and seismic data. This heterogeneous type of crust isgenerally not low in resistivity unless partial melting hasoccurred. Low resistivities may be possible in granitic rocksat depths of 10–15 km and temperatures of 500°C –600°C if1–3 percent free water is present; however, there is noevidence in the study area for these levels of temperature. Athermally related basement conductive zone could possiblybe present now at depth where a low-resistivity (3–5
1
GEOPHYSICAL INTERPRETATIONS, LIBBY THRUST BELT, MONTANA
2
ohm-m) zone forms the bottom layer in the western part ofthe magnetotelluric profile. This zone corresponds approxi-mately with the interpreted basal surface of detachment thatseparates basement rocks from the Prichard Formation of theBelt Supergroup. Some of the low resistivities observedlikely are caused by pre-Prichard crystalline rocks (meta-morphic (metasedimentary) or igneous) that are conductivebecause they contain large amounts of metallic minerals.The striking variations in observed resistivities in thePrichard Formation of from 0.6 to more than 400ohm-meters probably reflect the percentage and continuityof iron-sulfide-rich zones. Another possible line of thermalevidence is the absence of magnetic sources in pre-Beltcrystalline rocks at depths of 10–15 km. The lack of mag-netic anomalies may relate to shallow Curie-point tempera-tures, above which magnetism does not exist.
The magnetotelluric data have limitations in structuralanalysis because resistivities are mostly controlled by thepercentages of metallic minerals and not by lithology. Accu-racy of the interfaces obtained from the magnetotelluric datais not great, both because of the widely spaced soundinglocations and because of the very large contrasts in resistiv-ity between unmineralized and mineralized zones in the BeltSupergroup.
INTRODUCTION
Regional geophysical studies conducted by the U.S.Geological Survey in the northern Rocky Mountains duringthe past 25 years provide new insights about the geologicframework and mineral resources of the region. In thisreport, the emphasis is on interpretation of geophysical datacompiled for the Libby thrust belt in northwestern Montana(fig. 1). Interpretations complement the results of geologicmapping described by Harrison and Cressman (1993), whoalso discussed the geology and structural framework of theLibby thrust belt. During the course of their studies, Harrisonand Cressman constructed geologic cross sections across theLibby thrust belt on the basis of measured sections and pro-jections of surface geology. Depth cutoff of these sectionswas 4.3 km (14,000 ft) below sea level.
In the study described herein modeling of gravityanomaly data was done along two of the geologic cross sec-tions to provide information about structure and lithology ofthe Purcell anticlinorium and Sylvanite anticline from depthsgreater than 4.3 km to at least as deep as Precambrian crys-talline basement in the middle part of the crust. No magneticmodeling was done because of the absence of magneticanomalies having sources likely in deeply buried crystallinebasement.
Included in this report are sections on interpretation ofseismic and magnetotelluric data. J.E. Harrison describesinterpretations of data from about 70 km of COCORP (TheConsortium for Continental Reflection Profiling) seismic
reflection surveying along two profiles that cross the Sylva-nite anticline and Purcell anticlinorium. W.D. Stanleydescribes analysis of five magnetotelluric soundings along aprofile that extends across the Libby thrust belt and the Pur-cell anticlinorium. The lines of section of the gravity modelsand the COCORP profiles and the locations of the magneto-telluric soundings are shown in figure 2. Data from 13audiomagnetotelluric soundings in two profiles on the Syl-vanite anticline provide information about resistivities ofrocks in the upper few kilometers of the crust (Long, 1988).
The geology shown on plate 1 is a simplified version ofthe 1:125,000-scale geologic map compiled by Harrison andCressman (1993). The western parts of geologic maps for theWallace and Kalispell 1°×2°quadrangles (Harrison and oth-ers, 1986, 1992) provide the regional geologic context of theLibby thrust belt.
Magnetic and gravity anomaly data are also shown onplate 1. To provide a broader perspective of the geophysicalsetting, magnetic and gravity anomaly maps (pl. 2) werecompiled at a scale of 1:500,000 for the Libby thrust belt andadjacent areas, extending from near lat 47°20' N. to lat49°00′ N. and from near long 114°45′ W. to long 116°15′W.
Previous studies of gravity and magnetic anomaly dataapplied to geologic framework and mineral resource investi-gations of the region are described in King and others(1970), Harrison and others (1972, 1980, 1985), Kleinkopfand others (1972, 1982, 1988), Wynn and others (1977),Kleinkopf (1977, 1981, 1983, 1984), Kleinkopf and Long(1979), Kleinkopf and Wilson (1981), Kleinkopf and Ban-key (1982), Kleinkopf and Harrison (1982), Fountain andMcDonough (1984), and Harris (1985).
The author thanks the many U.S. Geological Surveycolleagues who contributed to this project. Jack Harrisonoffered many constructive suggestions and provided manystimulating discussions during various phases of the projectand report preparation. The sections on seismic and magne-totelluric investigations by Jack Harrison and Dal Stanleyprovide substantive contributions to the conclusions of thispaper. The geology was digitized and compiled under super-vision of Stanton H. Moll; the geologic map of plate 1 wascompleted in final digital form by Nancy Shock. Viki Ban-key and Mike Brickey collected gravity data in the field.Viki Bankey compiled and edited the gravity and magneticdata and prepared early versions of the gravity and magneticanomaly maps, and Gerda Abrams prepared later versions ofthe gravity and magnetic anomaly maps used in this report.Several colleagues offered valuable constructive commentsduring the technical review process.
GEOLOGY
The Libby thrust belt (fig. 1) is in the northwestern partof the Belt basin, which formed along the western edge of the
3
GEOLOGY
����
������������
yyyyyyyyyyyy
������
�����������������������
��������
������
���������
������
������
������
������
��������
����������
��yy�z�y
��Tertiary volcanic rocks
Tertiary to Jurassic intrusive rocks
Quaternary to Cambrian sedimentary rocks
Late Proterozoic rocks (Windermere System of Canada) Middle Proterozoic Belt Supergroup (Purcell Supergroup of Canada)—Stipple shows areas of high– grade metamorphism; may include some pre– Belt rocks
����yyyyEarly Proterozoic pre–
Belt metamorphic rocks
Contact
High–angle fault
Right–lateral faultÁ
Á
Á
Á
�
�����
118° 116° 114° 112° 110°
Banff
50°
48°
46°
44°
CANADA
UNITED STATES
PUR
CELL A
NTIC
LINO
RIU
M
FAULTB
ELTT
HR
US
T
MO
NT
LEWIS
AND CLARKLINE
eQ s
eQ s
eQ s
TJi
Zw
Yb
Yb
Yb
eQ s
Yb
Zw
TvXo
Yb
TJi
Tv
HOPE
LIBB
Y
Libby
EXPLANATION
SpokaneCoeur
d'Alene
Yb
Zw
TJi
TJi
RO
CK
Y
Area ofplate 2
eQ s
Xo
eQ s
Á
MO
UN
TAIN
TRENCH
Anticline
Syncline
Thrust fault—Sawteeth on upper plate
Area ofplate 1��
Á
Xo
TvTv
WASHINGTONOREGON
IDA
HO
Tv
Clark Fork
0 100 KILOMETERS50
Helena
Figure 1.
Map showing generalized geology of the Belt terrane in the region of the Libby thrust belt, northwestern Montana and sur-rounding area. Modified from King (1969) and Harrison and Cressman (1993).
North American craton in Middle Proterozoic time(Harrison, 1972; Harrison and Cressman, 1993). The Beltterrane is the oldest of a series of tectonostratigraphic assem-blages that make up a wedge of supracrustal rocks along thewestern edge of the continental craton (Price, 1981). TheLibby thrust belt is one of a series of major north-north-west-trending structural features north of the Lewis andClark line, a major intraplate tectonic boundary (Reynoldsand Kleinkopf, 1977). The Libby thrust belt was character-ized by Harrison and Cressman (1993) as a “ripped-apartsyncline between two anticlinal structures,” between thePurcell anticlinorium to the east and the Sylvanite anticlineto the northwest. The Moyie thrust system is along the
western and northwestern margin of the Libby thrust beltand overrides it on the southwest (Harrison and Cressman,1993). The thrust belt is limited to the south by the Hopefault (fig. 1), which Harrison and Cressman described as a“crustal flaw.”
Some 15 km of Middle Proterozoic Belt Supergrouprocks underlies the Libby thrust belt. Rocks of the BeltSupergroup grade upward from turbidites through mar-ginal-marine, tidal-flat, and shallow-shelf deposits. Thesequence consists mostly of fine-grained sedimentary rocks,mainly argillite, siltite, quartzite, and carbonate. The Pri-chard Formation, the oldest of the Belt units, is dominantlyquartzite but contains beds of pyritic-pyrrhotitic argillite,
GEOPHYSICAL INTERPRETATIONS, LIBBY THRUST BELT, MONTANA
4
116° 115°49°
Eureka
Clark Fork
Study area
5
4
Composite line ofsection shown in
figure 5
J'
J
B
B'
J''
J'''
Composite line ofsection shown in
figure 5
48°
Troy
Libby
BonnersFerry
IDA
HO
MO
NT
AN
A
MONTANA
CANADA
ROCKY
MOUNTAIN
TRENCH
PURCELL
AN
TICLINO
RIUM
NO. 1 GIBBSBOREHOLE
Line of sectionshown infigure 4
SY
LVAN
ITE
AN
TIC
LINE
MO
YIE
TH
RU
ST
SYSTEM
0 10 20 30 40 50 KILOMETERS
3
Normal fault—Bar and ball on downthrown side
Thrust fault—Sawteeth on upper plate
Strike–slip fault—Arrows show direction of apparent movement
Anticline—Showing direction of plunge. Dashed where inferred
Overturned anticline
Syncline—Showing direction of plunge. Dashed where inferred
Location and number of magnetotelluric sounding
Line of seismic reflection profile
EXPLANATION
MT–1
32
1
LIBB
Y
THR
US
T
BELT
MT–2
HOPEFAULT
ZONE
PINK
HA
MTH
RUST
FAULT
Figure 2.
Map showing major structural features in the area of the Libby thrust belt, northwestern Montana. Lines of extended geologiccross sections
B–B'
and
J–J'
(Harrison and Cressman, 1993) used in gravity modeling, lines of seismic reflection profiles MT–1 and MT–2,and locations of magnetotelluric soundings 1 through 5 and Gibbs No. 1 borehole are also shown.
5
AEROMAGNETIC AND GRAVITY ANOMALY DATA
which is more dense than overlying rocks of the RavalliGroup. The thickest exposures of Prichard rocks in the maparea are in the Sylvanite anticline, west of Yaak (pl. 1A),where some 5.6 km of Prichard rocks is exposed (Harrisonand Cressman, 1993). Almost 1,000 m of mafic sills isrecorded in measured sections in the Yaak area. Succesivelyoverlying the Prichard Formation are the Ravalli Group, theHelena and Wallace Formations, and the Missoula Group.
A number of short-wavelength positive magneticanomalies (pl. 1A) are associated with outcropping metased-imentary rocks of the Burke and Revett Formations of thelower part of the Ravalli Group. In hand specimen, particu-larly those of the Burke Formation, euhedral grains of mag-netite were observed in siltite (Kleinkopf and others, 1972).The overlying Wallace Formation consists mainly of calcar-eous and dolomitic fine- to medium-grained clastic rocks.Above the Wallace Formation is the Missoula Group, whichconsists primarily of interbedded red and green clastic rocksthat are less dense than other Belt rocks. Rocks of the Mis-soula Group produce negative gravity anomalies where thicksequences are juxtaposed against denser Belt rocks. Onlyminor amounts of Cambrian sedimentary rocks are pre-served in outcrop, and no other Phanerozoic sedimentaryrocks are present in the study area except for alluvial,lake-bed, and glacial deposits and other low-density sedi-ments of Pleistocene to Holocene age that have accumulatedin modern stream valleys.
Rocks of the Belt Supergroup exhibit an increase inmetamorphic grade from east to west across the basin andwith depth in the stratigraphic section. Metamorphic graderanges from the biotite zone of the greenschist facies in thelowest exposed part of the Prichard Formation through chlo-rite-sericite rocks in middle Belt to high-grade diagenesis atthe top of the Belt Supergroup (Harrison and Cressman,1993). Because the sedimentary rocks are mostly argilliteand siltite, the average rock density generally increasesdownsection with depth and with increased metamorphicgrade. Exceptions are rocks of carbonate sequences of theHelena and Wallace Formations, which are more dense thanthe underlying rocks of the Ravalli Group. Although massivequartzite is present throughout the section, its volume ascompared to that of the total section is low, and thus its influ-ence on gravity patterns is minimal.
The Belt sequence in the Libby thrust belt has beenintruded by Precambrian sills of diorite to gabbro, early Cre-taceous plutons ranging from granite to pyroxenite, andEocene plutonic rocks of quartz monzonite porphyry togranodiorite. Middle to Late Proterozoic mafic sills areabundant in the lower part of the Prichard Formation and areless abundant in the Ravalli Group, Wallace Formation, andMissoula Group. The best exposures of sills are in cirques,particularly on the Sylvanite anticline, and on ridges (Harri-son and Cressman, 1993). The sills are altered (King andothers, 1970; Bishop, 1973) and commonly exhibit little orno magnetic expression.
Scattered exposures of Early Cretaceous and Eoceneplutonic igneous rocks are present in the study area. Theserocks, ranging in composition from granite and granodioriteto syenite and pyroxenite, have been intruded into Belt strata(Harrison and Cressman, 1993). The largest exposed plutonsare the Dry Creek stock (unit Kg, pl. 1), about 15 kmsouthwest of Libby in the Cabinet Mountains, and theVermilion River stock (unit Kg), just east of the town ofTrout Creek. Smaller exposures of granitic rocks similar tothe rocks of the Dry Creek stock are present a few kilometersnorth, west, and south of the stock. Mafic intrusive com-plexes, principally pyroxenite and syenite (unit Kps), areexposed at Vermiculite Mountain, 10 km east-northeast ofLibby. At Bobtail Creek, 12 km north of Libby, a pluton ofpredominantly coarse grained, porphyritic syenite (unitKps) contains segregations of pyroxene and amphibole.
AEROMAGNETIC ANOMALY DATA
Aeromagnetic anomaly data for the study area werecompiled from analog records obtained from two regionalaerial surveys flown under contract to the U.S. GeologicalSurvey. The elevation of most of the study area is between 1and 2 km, and several mountain peaks are higher than 2.3km. Both surveys were flown east-west at a nominal altitudeof 2.1 km above sea level, except to clear the high peaks. Thesurvey north of lat 48°30' N. was flown in 1972 by ScintrexMinerals Inc., at a line spacing of 3.2 km (U.S. GeologicalSurvey, 1973). The survey south of lat 48°30' N. was flownin 1968 by Lockwood, Kessler, and Bartlett, Inc., at a linespacing of 1.6 km (U.S. Geological Survey, 1969a–j;Kleinkopf and others, 1972).
The total-intensity aeromagnetic anomaly data areshown at scales of 1:250,000 and 1:500,000 (pl. 1A, 2A).Plate 1A is a mosaic of the aeromagnetic anomaly mapsreceived from the contractors and is superimposed on a gen-eralized version of the digital geologic map of Harrison andCressman (1993). The residual total-intensity data werereduced to a single datum, then continued to a common alti-tude of 2.1 km above sea level and merged by fitting alongmap boundaries using programs developed by M.W.Webring (written commun., 1981) and R.E. Sweeney (writ-ten commun., 1981). The merged data were then gridded ata spacing of 1 km and contoured at an interval of 20 nT (pl.2A). The International Geomagnetic Reference Field (IGRF)for Epoch 1975 (Peddie and others, 1976), which is about 6.6gammas per kilometer to the northeast, was removed fromthe data.
GRAVITY ANOMALY DATA
Gravity data for 775 stations were extracted fromregional digital data sets compiled in support of U.S.
GEOPHYSICAL INTERPRETATIONS, LIBBY THRUST BELT, MONTANA
6
Geological Survey programs in geologic framework andmineral resource appraisal. The data originate from a varietyof sources including unpublished files of the U.S. GeologicalSurvey, Wynn and others (1977), Kleinkopf (1981),Kleinkopf and Wilson (1981), Bankey and others (1985),and a U.S. Department of Defense, Defense MappingAgency (DMA), data base (written commun., 1989).Measurements were made with high-sensitivity gravitymeters using four-wheel-drive vehicles and, in some cases,foot traverses (Bankey and others, 1982, 1985; Brickey andothers, 1980). The station spacing is variable, ranging from2–3 km along roads to greater than 5 km in roadless areas.
Gravity observations were made at locations of known,or recoverable, horizontal and vertical positions in terms oflongitude, latitude, and elevations. These positions includesurvey bench marks, photogrammetric elevation pointsshown on U.S. Geological Survey 7.5- and 15-minute topo-graphic maps, and locations of low topographic relief atwhich elevations and horizontal positions could be estimatedwith confidence. The observed gravity is referenced to theIGSN–71 (International Gravity Standardization Net) datum(Morelli and others, 1974) by means of ties to U.S. Depart-ment of Defense bases ACIC–0442 at Missoula, Mont., andACIC–4006–1 at Wallace, Idaho (U.S. Department ofDefense, 1974). Gravity reduction procedures are based onequations discussed by Cordell and others (1982). Allgravity stations were reduced to the complete Bougueranomaly, assuming a mean crustal density of 2.67 g/cm3,using the 1967 gravity formula (International Association ofGeodesy, 1967). Terrain corrections were made using com-puter software to access digital terrain files. Terrain correc-tions were calculated radially around each station to adistance of 166.7 km (Plouff, 1977). The final-processeddata, consisting of complete Bouguer gravity anomalies,were gridded and contoured using computer routines basedon minimum curvature (Briggs, 1974; Webring, 1981).
GEOLOGIC INTERPRETATION OF AEROMAGNETIC ANOMALIES
The dominant anomaly patterns on the 1:250,000-scaleaeromagnetic anomaly map (pl. 1A) consist of equidimen-sional positive anomalies, short-wavelength positive andnegative anomalies elongated generally north to northwest,and zones of steep magnetic gradient. Three types of geo-logic sources that contain relatively high percentages ofmagnetite account for most of the anomalies. The sourcesmainly are in outcrop but in some cases are partly or totallyburied in the near-surface. The principal magnetic anomalysources are igneous intrusive rocks, magnetite-bearing sedi-mentary rocks of the Ravalli Group, and major fault zones.
The Proterozoic basement, where drilled in westernMontana, is primarily a mixture of granite and granitic
gneiss, both of which typically are of low magnetization(Harrison and others, 1972). Long-wavelength anomaliesthat may have sources in deeply buried crystalline basementrocks at about 15 km are not known to be present in theregion (Harrison and others, 1980). The lack of detectablemagnetic anomalies in the study area is attributed to therelatively nonmagnetic character of the basement rocks andtheir deep burial. Resistivites measured at crystalline base-ment levels may be due to high-temperature crystalline base-ment rocks (see discussion on magnetotelluric data).Correspondingly, the lack of magnetic anomalies may beascribed to a crystalline basement complex at depths of10–15 km that has temperatures above the Curie point, atwhich magnetization of the rocks is lost. The mafic sills ofdioritic to gabbroic composition normally would beexpected to be magnetic but show little or no magneticresponse in outcrop. This anomalous low magnetization isattributed to reduction of magnetite content in the sills bychemical processes related to interaction between hydrother-mal fluids and cooling magma of the intrusions (King andothers, 1970; Harrison and others, 1972). Gravity anomalydata, on the other hand, show distinct anomalies that havesources, as determined from modeling, at or near crystallinebasement levels.
The most distinctive magnetic anomalies in the princi-pal study area are five positive anomalies (numbered 1, 2, 3,4, and 5 on pl. 1A) associated with Cretaceous or youngercupolas and stocks that are exposed or are known from drill-holes to be present in the near-surface. These anomaliesrange in amplitude from 100 to more than 3,000 nT. Themagnetic data provide information about the subsurfaceextent of these igneous intrusions and give clues for locatingother buried intrusions that have subtle expressions.
The most prominent of the five magnetic anomalies(anomaly 1, pl. 1A) is associated with a pyroxenite-syenitecomplex (unit Kps) that is partly exposed at RainyCreek–Vermiculite Mountain, about 6 km east-northeast ofLibby. The anomaly has an amplitude exceeding 3,000 nT,and it correlates with the main mass of ultramafic rocks.Pyroxenite is the principal ultramafic rock, and alteredpyroxenite in this stock has been a major source of vermicu-lite in the United States. Various aspects of the geology ofthe complex and adjacent areas were studied by Larsen andPardee (1929), Boettcher (1966), and Harrison and Cress-man (1993), who concluded that the complex is a laccolith.The complex consists of a biotitic core surrounded by biotitepyroxenite and an outer ring of magnetite pyroxenite. Alarge pluton of syenite and associated alkaline syenite dikesare in the southwestern part of the complex. The resultinganomaly is a combined expression of the total complex anddoes not distinguish syenite from pyroxenite rocks. Larsenand Pardee (1929) reported that the syenite locally contains3–12 percent magnetite. Boettcher (1966) speculated thatminor fenitization of Belt rocks along the northern contact ofthe complex may indicate a large body of carbonatite at
7
GEOLOGIC INTERPRETATION OF AEROMAGNETIC ANOMALIES
depth. The Bouguer gravity anomaly data show a residualhigh resulting from a change in gradient along a nosing in thecontours (pl. 1B) that is attributed to mafic rocks of the com-plex that are denser than the enclosing rocks. The residualgravity high correlates with the positive magnetic anomalyover outcrops of the complex.
Northwest of the Rainy Creek complex, about 8 kmnorth-northwest of Libby, a pluton (unit Ks, pl. 1) crops outin two places near Bobtail Creek. The associated single pos-itive magnetic anomaly (anomaly 2, pl. 1A) has an amplitudeof 900 nT and is slightly elongated north-northwest. The plu-ton is mainly syenite and includes segregations of pyroxeneand amphibole (Gibson, 1948). A high nosing in the gravitycontours correlates with the positive magnetic anomaly overthe complex in much the same character as at anomaly 1.Both the Rainy Creek and Bobtail Creek complexes are esti-mated to be about 100 m.y. old (Harrison and Cressman,1993). A northwest-trending belt of high gradient in the Bou-guer gravity anomaly data suggests that the two features maybe connected in the subsurface, possibly along a north-west-trending structural zone, although no surface indicationof such a zone is evident in the geologic mapping. Boettcher(1966) stated that the syenite and ultramafic rocks at BobtailCreek and Rainy Creek may be comagmatic.
A low-amplitude positive magnetic platform extends tothe south of anomaly 1 across the Kootenai River for some15 km in the form of a wide plunging nose in the magneticcontours (pl. 1A). A small, but distinct nose is superimposedon the magnetic platform anomaly (pl. 2A) near FisherMountain. The anomaly sources may be a shallow cupolaand a large related mass of moderately magnetic rock thatgives rise to the platform anomaly.
In the southwestern part of the map, just east of TroutCreek, a positive magnetic anomaly (anomaly 3, pl. 1A) ofalmost 300 nT is associated with outcrops of hornblendegranodiorite (unit Kg) of the Vermilion River stock. The axisof the anomaly is oriented north-northeast and is offsettoward the northwest edge of the outcrops. Intrusive rocksprobably are present in the subsurface beneath lower Pri-chard rocks that crop out northwest of the outcrops of thestock. The associated broad gravity high reflects thehigh-density hornblende granodiorite rocks that are in con-tact with rocks of the lower part of the Prichard Formation.
Near the southern end of the Libby thrust belt study areaand just northeast of Thompson Falls, a circular positiveanomaly (anomaly 4, pl. 1A) of more than 200 nT amplitudeindicates the presence of a buried intrusion. According todrill-core information provided by the staff of NorandaExploration, Inc. (unpub. data, 1979), quartz monzoniteporphyry is present about 775 m below the ground surface(Kleinkopf and others, 1988). The configuration of theanomaly and the horizontal extent of the steepest gradient onthe flanks of the anomaly are consistent with depth of burialas indicated by the core-hole information. Usingpotassium-argon techniques, analysis of biotite and
potasssium feldspar from the quartz monzonite gave radio-metric ages of 40–50 Ma (Marvin and others, 1984), youngerthan ages for the major intrusions to the north. An associatedgravity low is discussed in the section on interpretation of thegravity anomaly data.
Another well-exposed intrusive complex, the DryCreek stock, about 15 km southwest of Libby, has less prom-inent magnetic expression (anomaly 5, pl. 1A). The expres-sion is composite and consists of three small positiveanomalies of less than 100 nT in areas of granitic outcrops inhigh elevations of the eastern part of the stock. To the west,magnetic gradients decrease rapidly, and there is no anomalyover exposures of the stock (Kleinkopf, 1981). The lithologyof the Dry Creek stock is quartz monzonite to granodiorite(Gibson, 1948), and the granitic rock here probably belongsto a 100-m.y.-old intrusive event (Marvin and others, 1984;Harrison and Cressman, 1993). The complex character of themagnetic response of the Dry Creek stock is strikingly dif-ferent than the distinct 300-nT positive anomalies associatedwith the Vermilion River and Liver Peak stocks. Magneticsusceptibilities of three samples of granodiorite from theeastern part of the Dry Creek complex range from 0.019 to0.072 International System (SI) units (Kleinkopf, 1981) andgenerally correlate with topographic highs. The magnetichighs may relate to small stocks that formed as apophyses ofthe larger, relatively less magnetic granitic complex of theDry Creek stock. Harrison and Cressman, 1993) reportedthat all stocks and plutons in the map area have contact meta-morphic aureoles. In particular, the Dry Creek stock has a1,000-m-wide hornfels zone where it intrudes rocks of theWallace Formation and Missoula Group. The stock issheared and foliated by faulting, particularly on the west side(Wells and others, 1981) where the magnetic map showslittle or no magnetic expression. I infer from the lack of mag-netic expression that little primary magnetite was present inthe intrusion. Gibson (1948) reported no alteration of thestock but observed that magnetite formed after initial crystal-lization of the magma and probably is interstitial to pyroxeneand other minerals. A small outcrop of granodiorite is about12 km south of the Dry Creek stock (pl. 1A). No magneticanomaly was detected on two flight lines that passed just tothe north and to the south of this outcrop, which further indi-cates that the granodiorite is of low magnetization(Kleinkopf, 1981).
Many of the elongated short-wavelength magneticanomalies are related to magnetite-rich horizons predomi-nantly in siltite layers of the Burke and Revett Formations ofthe Ravalli Group (Kleinkopf and others, 1972). Theseanomalies are typically 50–100 nT in amplitude, and manyare elongated north-northwest along outcrops of RavalliGroup rocks that are topographically high and, in somecases, structurally controlled. Field checks in the east-centralpart of the area show that positive anomalies are associatedmainly with outcrops of the Burke Formation. Hand speci-ments of the Burke exhibit abundant euhedral magnetite
GEOPHYSICAL INTERPRETATIONS, LIBBY THRUST BELT, MONTANA
8
grains. Magnetic susceptibilities for three samples collectedin this area of from 0.013 to 0.035 SI units can account forthe observed anomalies. In the northern part of the area atMount Henry, and just to the south, two distinct positiveanomalies correlate with outcrops of Revett Formation inhigh topography (Bankey and others, 1986).
The Hope fault zone and faults of the Lewis and Clarkline are expressed by parallel magnetic alignments (pl. 2A).The Hope fault is along the southwestern margin of theLibby thrust belt and is delineated in the magnetic anomalydata by zones of steep gradients approximately parallel withthe fault (pl. 1A). In general, the magnetic patterns are morevariable on the northeastern side of the fault (Kleinkopf andothers, 1972).
Southwest of the Libby thrust belt, the magnetic anom-aly data show expressions of igneous intrusions and faultzones. A few kilometers north of Wallace, Idaho, theregional aeromagnetic anomaly map (pl. 2A) shows anorth-northeast-elongated, 200–300-nT, positive anomalythat correlates with quartz monzonite exposures of the Gemstock intrusive complex (Hobbs and others, 1965; Kleinkopfand others, 1988). Also in the Wallace area, distinctwest-northwest linear magnetic trends reflect structuralalignments of the Thompson Pass, Osburn, and Placer Creekfaults, which are part of the Lewis and Clark line (Kleinkopfand others, 1988). A large, complex positive magneticanomaly 25 km west of Thompson Falls correlates with out-crops of granitic intrusions (unit Ks) that are composed ofsyenite. The elongate shape of the anomaly suggests thatgranitic rocks are present as an extension of, or possibly as aseparate, pluton in the subsurface southwest of the outcrop.
GEOLOGIC INTERPRETATION OF BOUGUER GRAVITY ANOMALIES
In the area of the Libby thrust belt, there is a strong cor-relation of gravity anomalies with both geologic frameworkand major lithologic units. The geology and principal struc-tural features are shown, together with the Bouguer gravityanomaly, to illustrate the gravity signatures and to provide areference for discussions of the geologic interpretations ofthe gravity anomaly data (pls. 1B, 2B). The regional gravityfield dips gently to the east across the study area and exhibitsa complex of regional-scale positive and negative anomaliesthat correspond to broad open folds west of the RockyMountain trench (Harrison and others, 1980).
The gravity anomaly patterns can be discussed in termsof configurations of the –130- to –140-mGal contours (pls.1B, 2B). In the middle and southern parts of the study area,structurally deformed rocks of the Missoula Group generallyare less dense than less deformed adjacent rocks of olderparts of the Belt Supergroup. The –140-mGal contour delim-its a broad negative area whose source is attributed to
low-density Missoula Group rocks that also have experi-enced some reduction in density due to faulting and fractur-ing associated with development of the Libby thrust belt.Much of the grain of the gravity anomaly patterns within thebroad negative area is approximately parallel with the strikeof thrust and normal faults of the Libby thrust belt (pls. 1B,2B). The broad negative gravity feature has its lowest valueof –160 mGal just east of Thompson Falls, where it isapproximately coincident with the Liver Peak magneticanomaly (anomaly 4, pl. 1A). This deep gravity low (–160mGal) forms the southern part of a horseshoe-shapednegative anomaly that is open to the north and has residuallows at both ends of the horseshoe. The distinct low (–160mGal) centered on the south flank of Liver Peak may reflectlow-density felsic rocks of the intrusion. In addition, thedeepest part of the gravity low may relate to low-densityhydrothermally altered rocks associated with molybde-num-tungsten-mineralized rock at Liver Peak. The west andnorthwest extension of the horseshoe anomaly may reflect astructural trough of low-density Quaternary sediments andlocalized fracturing of Belt rocks at the intersection of theHope fault and south-trending thrust faults of the Libbythrust belt. Alternatively, a less magnetic phase oflow-density intrusive rocks at Liver Peak may be extensivein the subsurface in the west and northwest areas.
North of lat 48° N., about 25 km northeast of TroutCreek, the regional gravity low defined by the –140-mGalcontour narrows and follows the north- to northeast-trendingFisher River where it cuts around geologic structure. Thelow gravity values may express crossfaulting that controlsthe river direction here. Northwest of the river, anortheast-trending gravity divide is defined by –140-mGalcontours. Northwest of the divide, gravity values decrease toless than –144 mGal over the alluvial valley south of Libby,which is in the center of a broad, relatively flat bottomed lowapproximately defined by the –130- to –140-mGal contours.Assuming that about 6 mGal of relief is associated with thealluvial valley, the thickness of valley fill may exceed 400 m.
North of Libby, north-northwest gravity trends corre-late with major thrust faults of the Libby thrust belt as itpasses north into Canada. The broad, but distinctnorth-trending gravity low that extends south of Yaakseparates the well-defined gravity highs associated with thePurcell anticlinorium on the east and the Sylvanite anticlineon the west.
The Sylvanite anticline and the Purcell anticlinoriumexhibit prominent gravity highs that have amplitudesexceeding 10 and 20 mGal, respectively (pls. 1B, 2B). Thehigh associated with the Purcell anticlinorium generallytrends northwesterly; however, on close inspection, gravitypatterns show that the broad high is composed of three sepa-rate northerly trending highs arranged en echelon along anorthwest trend. The small anticlinal axis passing just westof the Gibbs No. 1 drillhole correlates with the southernmostgravity high. The gravity high associated with the Purcell
9
GEOPHYSICAL INTERPRETATION OF DEEP-SEATED GEOLOGIC FEATURES
anticlinorium is broken and offset at a location about 10 kmeast of Libby. The offset is part of a west-northwest trend inthe gravity anomaly data that passes just north of Libby andextends to the Moyie thrust fault near Troy. In addition,discontinuous trends in the magnetic anomaly data correlatewith the gravity trends, notably just south of the RaineyCreek intrusive complex (anomaly 1, pl. 1A). The compositegravity high associated with the Sylvanite anticline exhibitsa distinct northerly trend and subtle, superimposed north-westerly trends. The mapped axis of the anticline is offsetsouthwest of the axis of the gravity high. Gravity modeling,discussed in the next section of this paper, indicates that thePurcell anticlinorium and the Sylvanite anticline are verylikely cored by stacks of thrust slices of dense crystallinebasement rocks that account for the large gravity highsacross these two structures.
West of the Cabinet Mountain Wilderness, the Moyiethrust fault is along the west side of a narrow troughlikegravity anomaly related to the north-trending Bull Rivervalley (pl. 2B). At the north end of the valley, the thrust turnsand follows the northwest extension of the gravity troughinto Idaho. The deepest part of the trough is about 10 kmnorthwest of Troy. Three distinct lows are along the troughassociated with Bull River valley. The deepest low, whichexceeds 6 mGal amplitude, is at the north end of the valley,an area of complex geologic structure (pl. 1B). This deep lowis separated from the next low to the south by an east-north-east-trending gravity ridge. Contour alignments and trendprojection across the Cabinet Mountain Wilderness providessome evidence that the ridge may express a buried fault zonethat extends northeast as far as the gravity platform just northof Libby. Although no continuous fault zone has beenmapped in the surface geology, the geologic map shows dis-continous northeast-trending faults and areas of fault inter-section along the projected gravity feature.
In the Cabinet Mountains Wilderness, in the central partof the Libby thrust belt, a line of positive gravity anomalies,uniformly about 6–10 mGal amplitude above background,extends south-southeast from near the Kootenai River to asfar as the latitude of Trout Creek. One of the highs is cen-tered north of the exposures of the Dry Creek stock about 15km southwest of Libby but is much more extensive thaneither outcrops of the stock or the associated magnetic anom-alies described earlier in this report as well as in Kleinkopf(1981). The second gravity high is at Snowshoe Peak, and apossible correlative magnetic source is in the subsurfacebeneath outcrops of the Wallace and Helena Formations andthe Ravalli Group. The third gravity high is at Flat TopMountain, about 20 km south-southeast of the second; thehighest part of this anomaly is about 5 km west of Flat TopMountain. Between the second and third highs, thesouth-southeast trend of the highs is broken by a disconti-nous zone of gravity patterns that trend east-northeast towardFisher Mountain; crosscutting gravity contour alignmentsare along the east-northeast trend. In addition, both in the
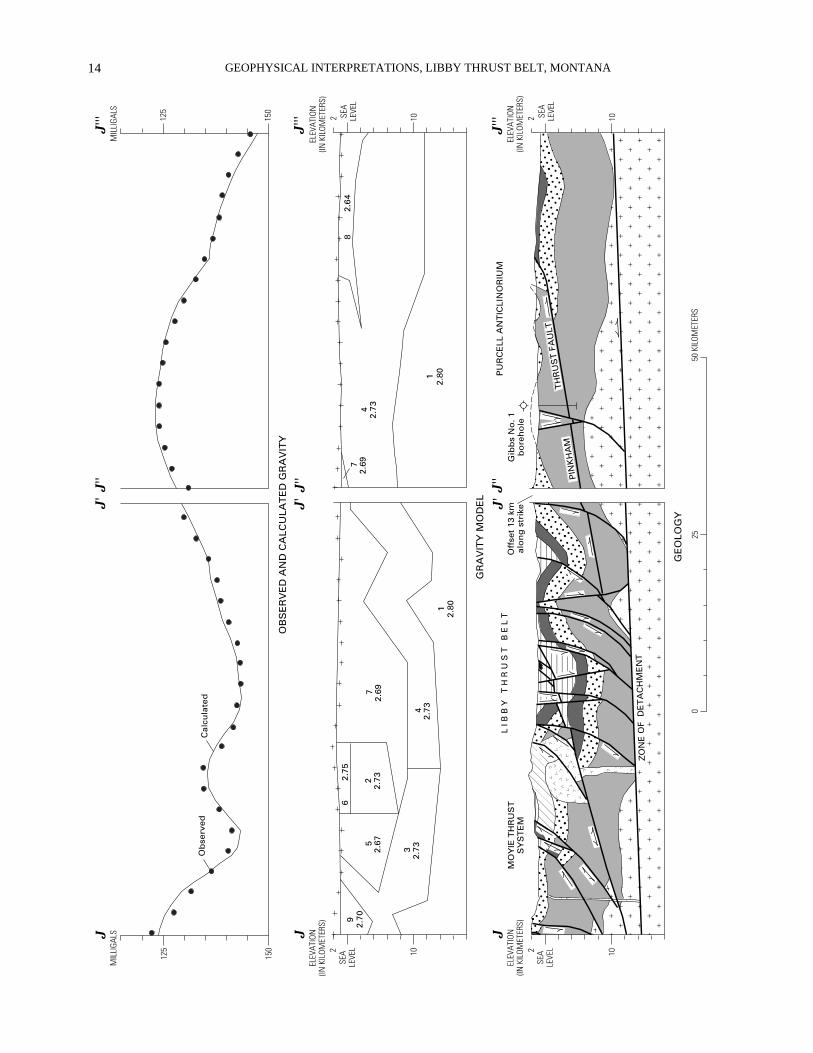
Cabinet Mountains Wilderness and in the main part of theLibby thrust belt, structural complexities and crossfaultingare present along the trend (pl. 1). The anomalous gravityand the structural features may reflect a zone of weakness inthe crust of unknown origin. The fourth gravity high is about16 km south-southeast at Trout Creek and correlates with theVermilion Creek stock of hornblende granodiorite composi-tion. Kleinkopf (1981) concluded from interpretations of thegravity high over the Dry Creek stock and from the distribu-tion of the magnetic anomalies that the Cabinet MountainsWilderness may be underlain by an extensive graniticbatholith that is relatively nonmagnetic. The gravity highsmay reflect large near-surface intrusions along the feature,and the small positive magnetic anomalies may indicatenear-surface sources associated with small granitic intru-sions or cupolas that may be apophyses of a possiblebatholithic mass at a depth of a few kilometers, as suggestedby the gravity model along geologic section J–J' (fig. 5) (seefollowing section). On the basis of surface mapping and indi-cations in the outcropping sedimentary rocks, Harrison andCressman (1993), in their structure sections, showed the DryCreek stock extending to the south.
GEOPHYSICAL INTERPRETATION OF DEEP-SEATED GEOLOGIC FEATURES
MODELING OF GRAVITY PROFILES
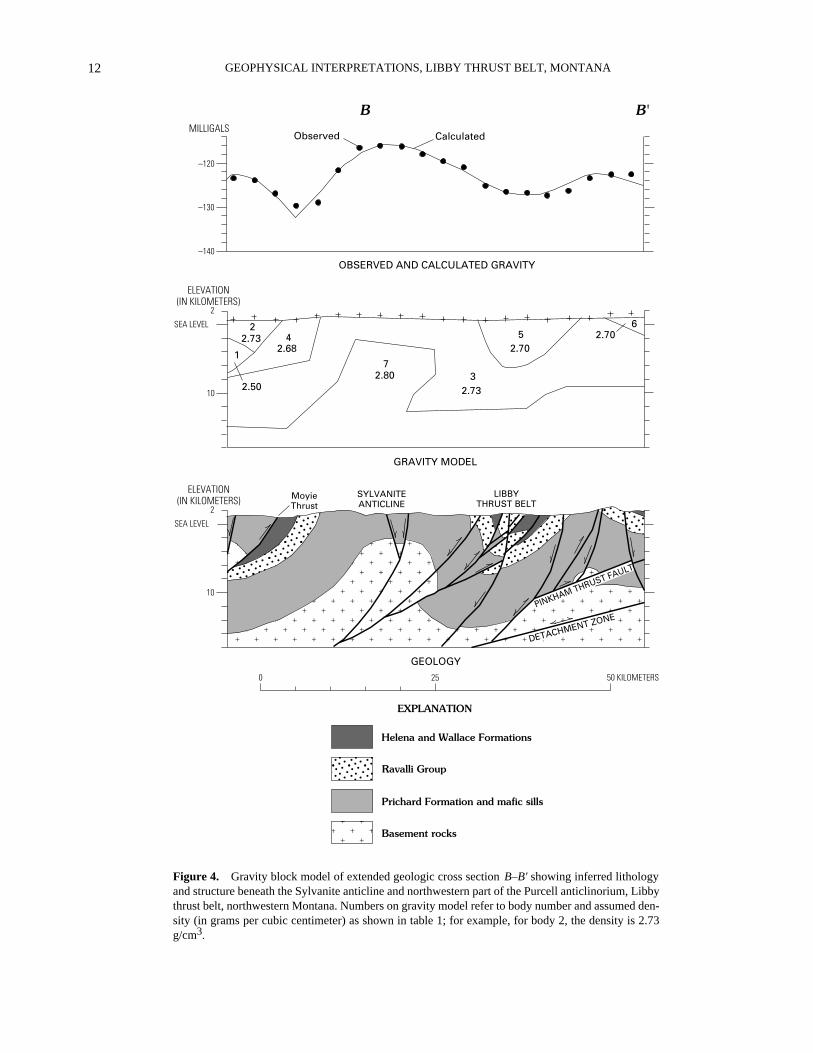
Modeling of Bouguer gravity anomaly data for theLibby thrust belt and adjacent areas supports the interpreta-tion that the crystalline basement is elevated beneath the Pur-cell anticlinorium and the Sylvanite anticline. The modelstudies update previous model studies of the Purcell anticli-norium by myself, described in Harrison and others (1980),by addition of new gravity control along the sections andnew subsurface lithologic information obtained from welllogs in the Atlantic Richfield–Marathon Oil Gibbs No. 1borehole, NE 1/4 sec. 2, T. 28 N., R. 27 W. (pl. 2). An impor-tant constraint on the validity of the modeling is selection ofreasonable densities for the major rock types, or combina-tions of rock types, depicted in the geologic cross sections.These rock types include crystalline basement, presumed tobe Proterozoic in age, Prichard Formation and sills, andpost-Prichard strata composed mainly of rocks of the RavalliGroup, Helena and Wallace Formations, and MissoulaGroup. I selected values for density based on laboratorymeasurements and on supporting evidence from well logstaken in the Gibbs No. 1 deep borehole (fig. 3).
Densities for a given rock unit within the study area areassumed, on the basis of the general regional consistency ofrock types, to be laterally uniform. In laboratory measure-ments of metamorphic rocks, Smithson (1971) found a den-sity range from 2.7 g/cm3 for granitic gneiss to 2.86 g/cm3

GEOPHYSICAL INTERPRETATIONS, LIBBY THRUST BELT, MONTANA
10
Figure 3.
Generalized lithologic and geophysical logs, Gibbs No.1 borehole, Flathead County, Montana. Neutron density log is in gramsper centimeter per second per second. Data courtesy of Atlantic Richfield and Marathon Oil Companies. Surface section at Little Wolf Creekis also shown. Modified from Harrison and Cressman (1993).

11
GEOPHYSICAL INTERPRETATION OF DEEP-SEATED GEOLOGIC FEATURES
for granulite facies. I used 2.8 g/cm3 as a reasonable estimatefor the density of the crystalline basement. Density valuesfor 13 samples of post-Prichard Belt rocks (measured inUSGS laboratories) range from 2.58 to 2.76 g/cm3 andaverage 2.67 g/cm3. Earlier laboratory measurements of Pre-cambrian mafic sill samples yielded an average density valueof 2.91 g/cm3 (Harrison and others, 1972). The Precambriansills in the borehole (fig. 3) are characterized by high density,low radioactivity, and rather high velocity (Harrison and oth-ers, 1985). The neutron-density log shows considerable vari-ation in density of the sills, presumably related to alteration.Density values range from about 2.76 g/cm3 to spikes on thelog exceeding 3.0 g/cm3. The information from these logs,together with data from the lithologic log, provides reliablethickness estimates for the sills, which total more than 1,000m of the drilled rock. I estimated that 7.6 km or more of Pri-chard Formation underlies the borehole site. The assumptionwas made that the density of the Prichard Formation, withoutsills, is in the range of from 2.65 to 2.70 g/cm3, consideringthe thick sequences of quartzite and argillite. Thus, combin-ing these values with an verage value of about 2.91 g/cm3 forthe Precambrian sills, I obtained an average density for thetotal column of Prichard Formation and sills of about 2.73g/cm3. The lithologic units and corresponding densitiesassigned to the bodies are listed in table 1.
Gravity models were calculated along the two lines ofsection, B–B' and J–J''' prepared by Harrison (Harrison andCressman, 1993), in an attempt to gain information aboutstructure and lithology along the zone of detachment and atcrystalline basement levels at depths of approximately 15km. The sections were simplified and extended laterally(figs. 4, 5) for purposes of the gravity modeling. Geologicdata in Idaho used to extend section B–B' are from a geologicmap of the Eastport area (Burmester, 1985). The expansionof section J–J' in Montana is from new mapping by Harrison(Harrison and others, 1992); the extension of section J''–J'''is offset 13 km southward along strike in order to cross thePurcell anticlinorium at the location of the Gibbs No. 1 bore-hole (fig. 2). Two-dimensional modeling of the gravity datawas done on a mainframe computer using the software SAKI(Webring, 1982). Control for the modeled sections was pro-vided by random-spaced gravity stations that are along orprojected into the lines of section. The resulting gravity con-trol along the modeled sections varies from 1 to more than 5km in spacing of stations.
The Purcell anticlinorium and the Sylvanite anticlineare appropriate for gravity model studies. Both structuresexhibit prominent positive gravity anomalies that correlatewith geologic structures at the surface. The gravity anomalyacross the Sylvanite anticline is well defined and is as muchas about 10 mGal in amplitude. The gravity expression asso-ciated with the Purcell anticlinorium has an amplitude of15–20 mGal, and the anticlinorium is more than 50 km wideand is remarkably continuous and linear for about 100 km tothe north into Canada. Several theories on source and mass
distribution have been suggested to account for the promi-nent gravity high associated with the Purcell anticlinorium.In a study of electrical conductivity and gravity data, I (inWynn and others, 1977) modeled the anomaly as a basementuplift interpreted as the result of movement of major faultblocks. In a later study, Harrison and others (1980) con-cluded that the source of the anomaly beneath the Purcellanticlinorium is not a vertical uplift but very likely is a stackof thrust slices of high-density crystalline basement rocksthat are elevated above the regional basement surface. Dur-ing the early 1980’s, a popular theory favored among variouspetroleum explorationists attributed the source of the Purcellanomaly to high-density lower Paleozoic carbonate rocksthat would provide attractive exploration targets. In aregional structural analysis, Fountain and McDonough(1984) postulated that the anomaly is caused by a high-den-sity body in the form of a basement ramp anticline beneaththe Purcell anticlinorium. Harris (1985) modeled the Purcellgravity anomaly and attributed the source of the anomaly tomafic sills in the lower part of the Prichard Formation abovea uniformly dipping crystalline basement surface. In thisreport, I refine, on the basis of further analysis and studies ofthe data, earlier interpretations in which the source of the
GEOPHYSICAL INTERPRETATIONS, LIBBY THRUST BELT, MONTANA
12
������������
�����
������������������������������
�����������������������������������
������
��������
��
����������������������������������������������������
��
��
����������
Observed CalculatedMILLIGALS
–120
–130
–140
B B'
ELEVATION(IN KILOMETERS)
10
2
SEA LEVEL
1
24
73
56
2.732.68
2.80
2.73
2.702.70
2.50
OBSERVED AND CALCULATED GRAVITY
GRAVITY MODEL
ELEVATION(IN KILOMETERS)
10
2
SEA LEVEL
GEOLOGY
SYLVANITEANTICLINE
LIBBYTHRUST BELT
0 25 50 KILOMETERS
Helena and Wallace Formations
Ravalli Group
Prichard Formation and mafic sills
Basement rocks
EXPLANATION
Moyie Thrust
PINKHAM THRUST FAULT
DETACHMENT ZONE
Figure 4.
Gravity block model of extended geologic cross section
B–B'
showing inferred lithologyand structure beneath the Sylvanite anticline and northwestern part of the Purcell anticlinorium, Libbythrust belt, northwestern Montana. Numbers on gravity model refer to body number and assumed den-sity (in grams per cubic centimeter) as shown in table 1; for example, for body 2, the density is 2.73g/cm
3.
13
GEOPHYSICAL INTERPRETATION OF DEEP-SEATED GEOLOGIC FEATURES
anomalies is thrust slices of dense crystalline basement rocksthat core the Purcell anticlinorium.
DEEP FOLDS AND FAULTS INTERPRETED FROM SEISMIC DATA
By Jack E. Harrison
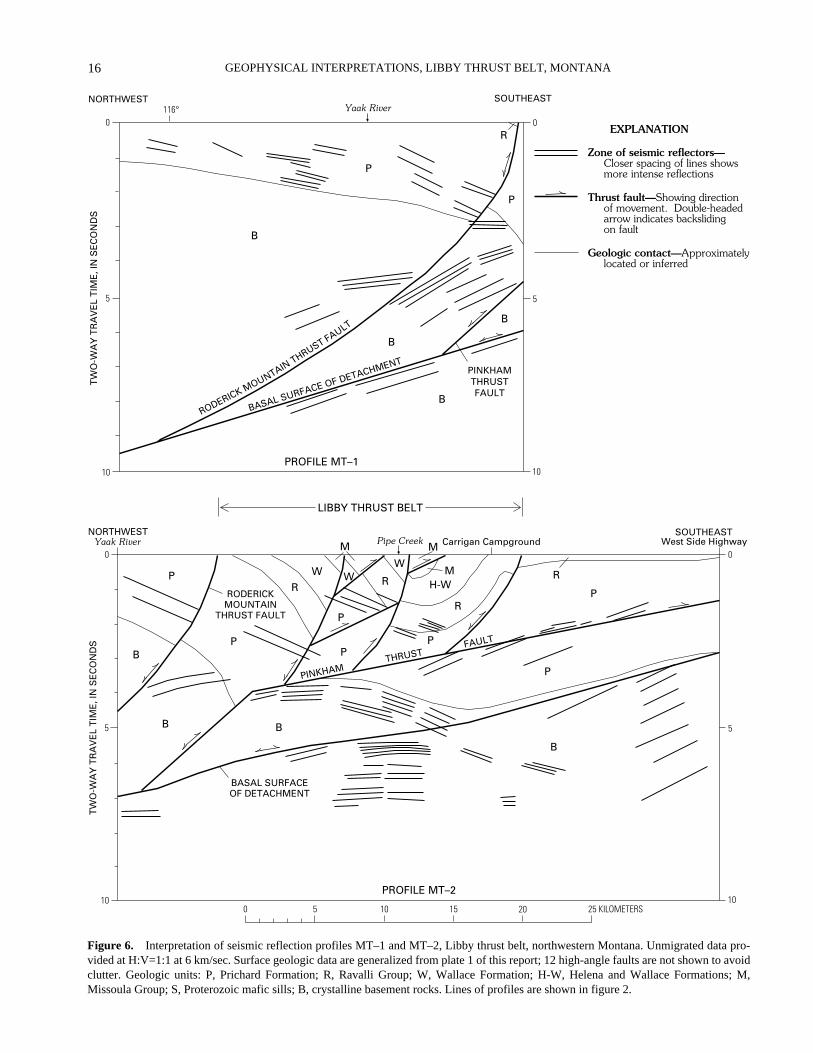
Seismic data support the interpretation of crystallinebasement beneath Prichard as shown in figure 6. The seismicdata identify the mafic sills, which are excellent seismicreflectors (fig. 3), and the sills clearly mimic surface struc-ture to depths of about 8 km below ground level at whichseismic data lose definition (Harrison and others, 1985).Seismic data were collected by others who discussed the datawith us but preferred that they not be acknowledged. Twodeep seismic lines of profile across the Sylvanite anticlineand the Libby thrust belt were prepared by COCORP (TheConsortium for Continental Reflection Profiling) in1984–85 (Potter and others, 1986; Yoos and others, 1991).In 1986, graphs of the unmigrated data were generouslymade available for our use and are shown here (fig. 6).Locations of the profiles MT–1 (Montana–1) and MT–2(Montana–2) are shown on plate 1 and in figure 2, and inter-pretation of the profiles (generously aided by my colleague,M.R. Reynolds) is shown in figure 6.
Most of the shallow reflectors (≤3 seconds) relatereasonably well to surface geology, even though the seismicdata are not migrated and therefore are not precisely in thecorrect geographic position. The mafic sills in the lower partof the Prichard Formation (fig. 3) are known seismic reflec-tors and are visible on both of the seismic profiles. ThePinkham thrust fault, as identified on profile MT–2, projectsfrom the surface to the logical position and dip angle shown,a position that agrees well with that obtained from other datafrom about 40 km farther to the south in the Libby thrust belt.Of less certain origin are the reflections recorded below theWallace Formation and the Missoula Group on profileMT–2 near Pipe Creek. These may be reflections from sillsin the Prichard Formation, or they may be unmigrated reflec-tions from the steep faults and bedding in the area.
Below 3-seconds two-way travel time, the source ofreflections is more speculative. The inferred basal surface ofdetachment is marked on profile MT–1 by a series of reflec-tions and extends readily in profile MT–2 to separate variousdifferent domains of reflections. The depth to the basal sur-face varies from about 9 to 18 km across the area, and thesurface dips about 15° in inferred crystalline basement rocks.These values do not differ drastically from the depth and dipof inferred basement rocks under the Purcell anticlinoriumas shown for the Rocky Mountains of southern BritishColumbia in cross sections by Price and Fermor (1985) and
by Okulitch (1984, fig. 6). The strong reflections at andbelow 4 seconds (fig. 6) are, therefore, attributed to layeredzones in the basement, perhaps mylonite, to the detachmentzone for the older tectonic folding (?), or to strongly layeredgneiss. No obvious reflection is present, at least along theprofiles, for the Belt-basement contact. The lack of a base-ment reflection is most obvious on profile MT–1, where anyreasonable thickness of the Prichard Formation requires thatsuch a contact be at or above 4 seconds. Because the lowestpart of the Prichard Formation in mid-Belt terrane is in thegarnet zone of regional metamorphism and the Middle Prot-erozoic basement where drilled in western Montana is a mix-ture of granite, granitic gneiss, and some mafic intrusiverocks, a contact between metamorphosed Belt terrane andgranite or granite gneiss would produce too little contrast tocause seismic reflections. A dissimilarity in basement rocktypes or structures is inferred from the contrast between thefew deep seismic reflections above the Roderick Mountainthrust fault on profile MT–1 and the multiple prominentreflections below that thrust fault on profiles MT–1 andMT–2. None of the reflections are necessarily at theBelt-basement contact. A consequence of these observationsis that the true thickness of the present Belt Supergroup, thethickest known sedimentary sequence of Middle Proterozoicrocks in the world, can only be determined by as yetundrilled deep boreholes.
INTERPRETATION OF MAGNETOTELLURIC SOUNDINGS
By W.D. Stanley
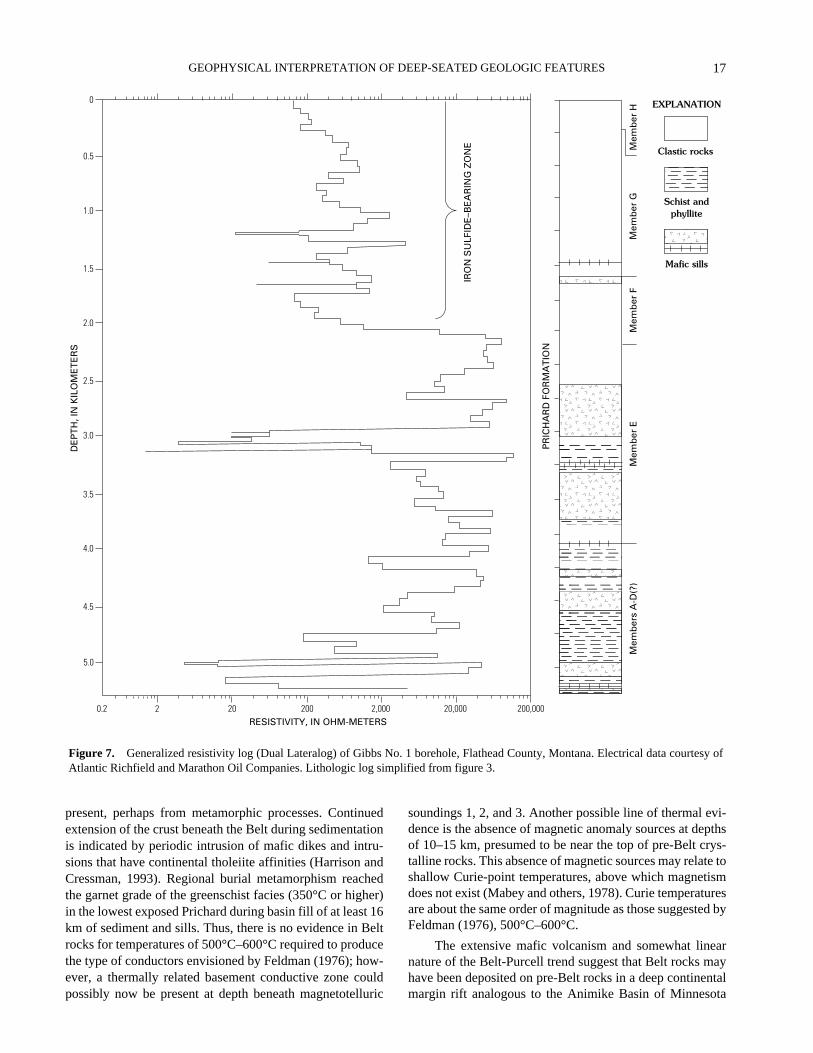
Extensive magnetotelluric surveys have been con-ducted across the Purcell anticlinorium and Libby thrust belt.Phoenix Geophysics supplied the data from a profile of fivesoundings (fig. 2) of a proprietary survey to me for inclusionin a study of regional structures. Another profile of the pro-prietary data, not shown in this report, is about 32 km southof the Phoenix profile and passes through the location of theGibbs No. 1 borehole, a convenient geological calibrationpoint. The magnetotelluric soundings from the survey are ofhigh quality and quite unusual in that a striking low-resistiv-ity zone was detected on all the soundings. Earlier audiom-agnetotelluric studies (Wynn and others, 1977; Long, 1983,1988) demonstrate that in the Prichard Formation a discon-tinuous zone, typically at depths of 0.9–2.5 km, is very con-ductive and has resistivities of a few ohm-meters or less. Thevertical distribution of mineralized zones is indicated by thelow resistivities in the resistivity log from the Gibbs No. 1borehole (fig. 7). In the borehole, moderate amounts of sul-fide minerals in members F, G, and H of the Prichard Forma-tion cause resistivities of less than 200 ohm-m, and greater
GEOPHYSICAL INTERPRETATIONS, LIBBY THRUST BELT, MONTANA
14
�����
�����
�����
�����
�����
�����
�����
�����
������
������
�������
�������
������
�������
��
������������
������������
��
���
����
����
����
���
���
���
���
���
���
�����������������
�����������������
�����������������
�����������������
�����������������
�������
������� ����
����
����
���
���
������ ����
�
�����
����
����
����
����
����
Ob
serv
edC
alcu
late
d
92.
705
2.67
32.
73
22.
73
62.
75
72.
69
42.
73
12.
80
42.
73
82.
64
12.
80
OB
SE
RV
ED
AN
D C
ALC
ULA
TE
D G
RA
VIT
Y
GR
AV
ITY
MO
DE
L
GE
OLO
GY
MIL
LIGA
LS
125
150
J'
J
ELEV
ATIO
N(IN
KIL
OMET
ERS)
2 10
ELEV
ATIO
N(IN
KIL
OMET
ERS)
J''
J'
J
J'
J
2 10SEA
LEVE
L
MIL
LIGA
LS
125
150
ELEV
ATIO
N(IN
KIL
OMET
ERS)
2 10
ELEV
ATIO
N(IN
KIL
OMET
ERS)
2
10
SEA
LEVE
L
L I B
B Y
T
H R
U S
T
B E
L T
PU
RC
ELL
AN
TIC
LIN
OR
IUM
Gib
bs
No
. 1b
ore
ho
leO
ffse
t 13
km
alo
ng
str
ike
ZO
NE
OF
DE
TA
CH
ME
NT
PIN
KH
AM
TH
RU
ST
FA
ULT
MO
YIE
TH
RU
ST
SY
ST
EM
025
50 K
ILOM
ETER
S
SEA
LEVE
L
J''
J''
72.
69
J'''
J'''
J'''
SEA
LEVE
L
15
GEOPHYSICAL INTERPRETATION OF DEEP-SEATED GEOLOGIC FEATURES
����������
�����������Cretaceous granite
Cambrian sedimentary rocks
Missoula Group
Missoula Group and Wallace Formation
Helena and Wallace Formations
EXPLANATION
��������
��
Ravalli Group
Prichard Formation
Basement rocks
Belt S
uperg
roup
Figure 5 (above and facing page).
Gravity block model ofextended geologic cross section
J–J'
showing informationabout inferred lithology and structure beneath the Purcell an-ticlinorium, Libby thrust belt, northwestern Montana. Num-bers on gravity model refer to body number and assumeddensity (in grams per cubic centimeter) as shown in table 1;for example, for body 1, the density is 2.80 g/cm
3
.
amounts of iron sulfide minerals at about 3 km (member E)and 5 km (members A–D?) produce resistivities of 2–20ohm-m. The low resistivities are attributed to pyrite or pyr-rhotite films and disseminated mineralized zones in theslightly carbonaceous argillitic unit. The low-resistivityzones in the Prichard Formation and other units of the BeltSupergroup represent easily mappable features for evalua-tion of mineralization in the Belt basin (Long, 1983).
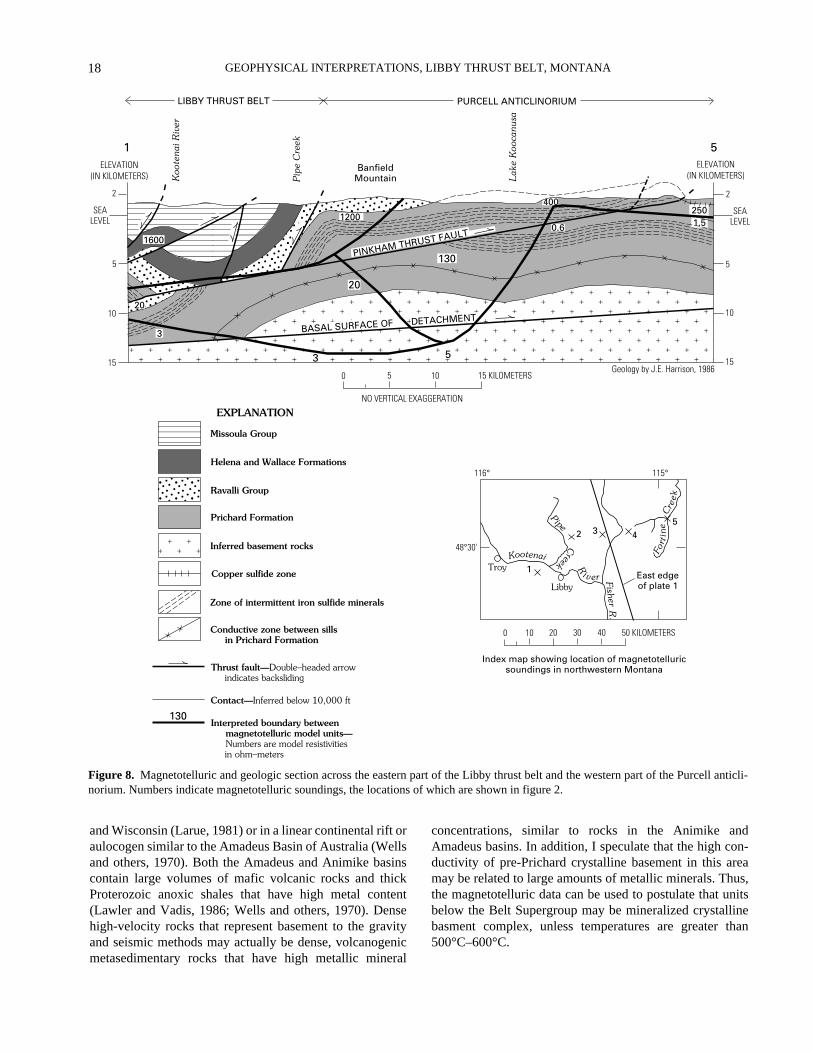
Interpretations of the five soundings provided byPhoenix Geophysics were used to construct the resistivitycross section shown in figure 8. The soundings areone-dimensional in character (isotropic) in that the resistivi-ties measured in the two coordinate directions of the fieldsetup are very similar. The data were interpreted using inter-active forward models of four and five layers, and the crosssection was constructed by connecting the layered modelsfrom each sounding location (fig. 8). Accuracy of the inter-faces obtained from the magnetotelluric data is not great,both because of the widely spaced sounding locations andbecause of the very large contrasts in resistivity betweenunmineralized and mineralized zones in the Belt Super-group. Layer interfaces should be resolved, however, towithin 10–15 percent of their true depth, particularly the topof the lowest resistivity layer that represents the deepestlayer in the models shown in the cross section.
Most of the magnetotelluric data can be discussed interms of two factors controlling resistivity in rocks of theBelt Supergroup—fluids and conductive mineralized rock.The 1,200–1,600-ohm-m layer beneath soundings 1 and 2
correlates with the Missoula Group, Helena and WallaceFormations, and Ravalli Group (fig. 8). These resistivitiesare typical for older carbonate and metasedimentary rocksthat contain fresh pore waters, and they are characteristic ofmost Belt rocks above the Prichard Formation (Long, 1983).The 130–400-ohm-m units at the surface at soundings 3 and4 are associated with the more mineralized conductivePrichard Formation, as are the conductive units (0.6–5ohm-m) at soundings 1–4. The moderately low resistivity(250 ohm-m) in the Ravalli Group for the magnetotelluricmodel at sounding 5 is probably related to low-grade stra-tabound copper sulfide minerals, which are commonlypresent in the Spokane Formation, whereas the very lowresistivities of 1.5 ohm-m for the model probably reflect thehighly continuous iron sulfide zones in the Prichard Forma-tion. The thicknesses of the low-resistivity units that formthe basal layer on the magnetotelluric models could not beuniquely determined from the magnetotelluric soundings,even though the data extended to frequencies of 0.0005 Hz;however, estimates based on the magnetotelluric phaseinformation suggest that conductive units must be thickerthan 7.7 km (with an error of about 0.1 km). The intermedi-ate layer of 20 ohm-m required at soundings 1 and 2 proba-bly represents a part of the Prichard Formation that containsmoderate amounts of iron sulfide minerals. The upperboundary of this low-resistivity layer approximatelymatches the interpreted location of the Pinkham thrust fault,which places highly resistive rocks of the Ravalli Group andHelena and Wallace Formations over the Prichard Formation(fig. 8). Magnetotelluric data should be effective in deter-mining the lithology and depth to basement beneath Beltrocks, given a more extensive data set that would allow moreaccurate interpretations.
The magnetotelluric data have limitations in structuralanalysis because resistivities are controlled mostly by thepercentages of metallic minerals and not by rock lithology.The magnetotelluric data require that conductive rocks,probably of the Prichard Formation, extend to depths of morethan 10.8 km (with an error of about 1.6 km) below magne-totelluric soundings 1, 2, and 3 and that a low-resistivity (3–5ohm-m) zone forms the bottom layer on the western part ofthe profile (fig. 8), corresponding approximately with theinterpreted basal surface of detachment that separates crys-talline basement units from the Prichard Formation.
The lithology of the basement in the study area cannotbe resolved using the magnetotelluric data. Outcrops andboreholes in the region indicate basement of possible gra-nitic gneiss, mafic intrusive rocks, and high-grade metasedi-mentary rocks. The Belt basin probably formed on stretchedcrust of Archean age that has a Middle Proterozoic (1,730Ma) metamorphic overprint. This type of crust is not gener-ally low in resistivity unless partial melting has occurred.Feldman (1976) pointed out that low resistivities can beproduced in granitic rocks at depths of 10–15 km andtemperatures of 500°C–600°C if 1–3 percent free water is
GEOPHYSICAL INTERPRETATIONS, LIBBY THRUST BELT, MONTANA
16
Pipe CreekYaak RiverNORTHWEST
West Side HighwayCarrigan CampgroundSOUTHEAST
10
5
00
5
10
P
B
B
P
R
W
M M
WW
R
P
PR
H-WR
P
P
B
B
M
PINKHAMTHRUST
FAULT
BASAL SURFACEOF DETACHMENT
RODERICKMOUNTAIN
THRUST FAULT
PROFILE MT–2
TW
O-W
AY
TR
AV
EL
TIM
E, I
N S
EC
ON
DS
LIBBY THRUST BELT
0 5 10 15 20 25 KILOMETERS
116° Yaak River
0
5
1010
5
0
NORTHWEST SOUTHEAST
B
P
R
P
B
B
B
RODERICK MOUNTAINTHRUST FAULT
BASAL SURFACE OF DETACHMENTPINKHAMTHRUSTFAULT
PROFILE MT–1
TW
O-W
AY
TR
AV
EL
TIM
E, I
N S
EC
ON
DS
EXPLANATION
Zone of seismic reflectors— Closer spacing of lines shows more intense reflections
Thrust fault—Showing direction of movement. Double-headed arrow indicates backsliding on fault
Geologic contact—Approximately located or inferred
P
Figure 6.
Interpretation of seismic reflection profiles MT–1 and MT–2, Libby thrust belt, northwestern Montana. Unmigrated data pro-vided at H:V=1:1 at 6 km/sec. Surface geologic data are generalized from plate 1 of this report; 12 high-angle faults are not shown to avoidclutter. Geologic units: P, Prichard Formation; R, Ravalli Group; W, Wallace Formation; H-W, Helena and Wallace Formations; M,Missoula Group; S, Proterozoic mafic sills; B, crystalline basement rocks. Lines of profiles are shown in figure 2.
17
GEOPHYSICAL INTERPRETATION OF DEEP-SEATED GEOLOGIC FEATURES
��������
����������������
��������
��������
������������������������
���������������������������������������
���
����
EXPLANATION
Clastic rocks
Schist andphyllite
Mafic sills
IRO
N S
ULF
IDE
–BE
AR
ING
ZO
NE
PR
ICH
AR
D F
OR
MA
TIO
N
Mem
ber
s A
-D(?
)M
emb
er E
Mem
ber
FM
emb
er H
Mem
ber
G
0
0.5
1.0
1.5
2.0
2.5
3.0
3.5
4.0
4.5
5.0
20.2 20 200 2,000 20,000 200,000RESISTIVITY, IN OHM-METERS
DE
PT
H, I
N K
ILO
ME
TE
RS
Figure 7.
Generalized resistivity log (Dual Lateralog) of Gibbs No. 1 borehole, Flathead County, Montana. Electrical data courtesy ofAtlantic Richfield and Marathon Oil Companies. Lithologic log simplified from figure 3.
present, perhaps from metamorphic processes. Continuedextension of the crust beneath the Belt during sedimentationis indicated by periodic intrusion of mafic dikes and intru-sions that have continental tholeiite affinities (Harrison andCressman, 1993). Regional burial metamorphism reachedthe garnet grade of the greenschist facies (350°C or higher)in the lowest exposed Prichard during basin fill of at least 16km of sediment and sills. Thus, there is no evidence in Beltrocks for temperatures of 500°C–600°C required to producethe type of conductors envisioned by Feldman (1976); how-ever, a thermally related basement conductive zone couldpossibly now be present at depth beneath magnetotelluric
soundings 1, 2, and 3. Another possible line of thermal evi-dence is the absence of magnetic anomaly sources at depthsof 10–15 km, presumed to be near the top of pre-Belt crys-talline rocks. This absence of magnetic sources may relate toshallow Curie-point temperatures, above which magnetismdoes not exist (Mabey and others, 1978). Curie temperaturesare about the same order of magnitude as those suggested byFeldman (1976), 500°C–600°C.
The extensive mafic volcanism and somewhat linearnature of the Belt-Purcell trend suggest that Belt rocks mayhave been deposited on pre-Belt rocks in a deep continentalmargin rift analogous to the Animike Basin of Minnesota
GEOPHYSICAL INTERPRETATIONS, LIBBY THRUST BELT, MONTANA
18
���������������������������������������������������
����
������������������������������
������������������������������������������������������������������������������������
������������
����
�
Troy
Libby
1
2 3 45
Kootenai
R
i v er FisherR
.
Fort
ine
Cre e
k
East edgeof plate 1
Pipe
Creek
116° 115°
48°30'
0 10 20 30 40 50 KILOMETERS
Index map showing location of magnetotelluricsoundings in northwestern Montana
0 5 10 15 KILOMETERS
Missoula Group
Helena and Wallace Formations
Ravalli Group
Prichard Formation
Inferred basement rocks
Copper sulfide zone
Zone of intermittent iron sulfide minerals
Conductive zone between sills in Prichard Formation
Thrust fault—Double–headed arrow indicates backsliding Contact—Inferred below 10,000 ft
Interpreted boundary between magnetotelluric model units— Numbers are model resistivities in ohm–meters
130
EXPLANATIONNO VERTICAL EXAGGERATION
2
5
10
15
ELEVATION(IN KILOMETERS)
2
5
10
15
ELEVATION(IN KILOMETERS)
SEALEVEL
SEALEVEL
Geology by J.E. Harrison, 1986
BASAL SURFACE OF DETACHMENT
PINKHAM THRUST FAULT
LIBBY THRUST BELT PURCELL ANTICLINORIUM
Lak
e K
ooca
nusa
Banfield MountainP
ipe
Cre
ek
Koo
tena
i Riv
er
1600
20
3
1200
20
130
53
400
0.6
2501.5
1 5
Figure 8.
Magnetotelluric and geologic section across the eastern part of the Libby thrust belt and the western part of the Purcell anticli-norium. Numbers indicate magnetotelluric soundings, the locations of which are shown in figure 2.
and Wisconsin (Larue, 1981) or in a linear continental rift oraulocogen similar to the Amadeus Basin of Australia (Wellsand others, 1970). Both the Amadeus and Animike basinscontain large volumes of mafic volcanic rocks and thickProterozoic anoxic shales that have high metal content(Lawler and Vadis, 1986; Wells and others, 1970). Densehigh-velocity rocks that represent basement to the gravityand seismic methods may actually be dense, volcanogenicmetasedimentary rocks that have high metallic mineral
concentrations, similar to rocks in the Animike andAmadeus basins. In addition, I speculate that the high con-ductivity of pre-Prichard crystalline basement in this areamay be related to large amounts of metallic minerals. Thus,the magnetotelluric data can be used to postulate that unitsbelow the Belt Supergroup may be mineralized crystallinebasment complex, unless temperatures are greater than500°C–600°C.
19
SUMMARY AND REFERENCES CITED
SUMMARY AND CONCLUSIONS
Regional geophysical studies conducted by the U.S.Geological Survey in the northern Rocky Mountains duringthe past 25 years provide new insights about geologic frame-work and mineral resources. Conclusions presented in thisreport are based on integrating interpretations of these grav-ity, magnetic, seismic, and magnetotelluric data.
The gravity anomaly data show a marked correlationwith major structures. The Purcell anticlinorium exhibitspositive anomalies of more than 20 mGal, and the Sylvaniteanticline exhibits positive anomalies of more than 10 mGal.Results of gravity modeling indicate that the Purcell anticli-norium and the Sylvanite anticline are very likely cored bystacks of thrust slices of dense crystalline basement rocksthat account for the large gravity highs across these twostructures.
The gravity anomaly data for the Cabinet MountainsWilderness show a string of positive gravity anomaliesabout 6–8 mGal amplitude above background. The highsextend south-southeast in a belt from near the KootenaiRiver to as far as the latitude of Trout Creek. The gravityanomaly data and the distribution of magnetic anomaliessuggest that the Cabinet Mountains Wilderness may beunderlain by a large, uplifted granitic batholith. The gravityhighs are interpreted to reflect intrusions along this feature,and the small positive magnetic anomalies are inferred toindicate near-surface sources that may be associated withsmall granitic intrusions or cupolas that are apophyses of thebatholithic mass at depth, as shown in the gravity model.
The principal magnetic anomaly sources are igneousintrusive rocks, major fault zones, and magnetite-bearingsedimentary rocks of the Ravalli Group. Although thesources mainly are present in outcrop, in some cases they arepartly or totally buried in the near-surface.
The most important magnetic anomalies in theprincipal study area are five distinct positive anomaliesassociated with Cretaceous or younger cupolas and stocksthat are exposed or are known from drillholes to be presentin the near-surface. These anomalies range in amplitudefrom 100 to more than 3,000 nT. Modeling of the magneticanomaly data was not done because of the absence oflong-wavelength magnetic anomalies having sources likelylocated in buried crystalline basement.
The lack of detectable anomalies is attributed to the rel-atively nonmagnetic character and deep burial of the base-ment rocks or to possible elevated Curie isotherms, whichare compatible with one explanation of low resistivitiesobtained from magnetotelluric measurements. The maficsills of dioritic to gabbroic composition show little or nomagnetic response in outcrop, probably because of a reduc-tion of magnetite content in the sills by chemical processes
related to interaction between hydrothermal fluids andcooling magmas of the intrusions.
Interpretation of seismic reflection data for the studyarea shows an inferred basal surface of detachment at depthsof 9–18 km. Strong reflections at and below 4 seconds areattributed to stratification in the basement such as layeredgneiss or mylonite along the detachment zone for the oldertectonic folding. No obvious reflection is present, at leastalong the profiles, for the Belt-basement contact. Just belowthe Pinkham thrust fault, strong reflections attributed tostratification in crystalline basement rocks image relief inthe basement on the western flank of the Purcell anticline.
Interpretation of magnetotelluric data shows a thickconductive basal layer that is incompatible with a crystallinebasement composed of granitic gneiss, mafic intrusive rock,and high-grade metasedimentary rocks. This type of crust isnot generally low in resistivity unless partial melting hasoccurred, perhaps at depths of 10–15 km and temperaturesof 500°C–600°C if 1–3 percent free water is present. A pos-sible explanation for a heat source at these depths is the lackof magnetic sources, which may indicate shallow Curie tem-peratures, as previously postulated. An alternative explana-tion is that pre-Prichard crystalline rocks are conductivesimply because they contain large amounts of metallic min-erals. This is certainly the case for the Prichard Formationbecause surface observations of variations in resistivityrange from 0.6 to more than 400 ohm-m and most likelyreflect the percentage of iron sulfide minerals and continuityof iron sulfide zones. Accuracy of the interfaces obtainedfrom the magnetotelluric data is not great, both because ofthe widely spaced sounding locations and because of thevery large contrasts in resistivity between unmineralized andmineralized zones in the Belt Supergroup.
REFERENCES CITED
Bankey, Viki, Kleinkopf, M.D., and Hoover, Donald, 1986, Geo-physical maps of the Mount Henry roadless area, LincolnCounty, Montana: U.S. Geological Survey MiscellaneousField Studies Map MF–1534–C, scale 1:50,000.
Bankey, V.L., Brickey, M.R., and Kleinkopf, M.D., 1982, Principalfacts for 1980 gravity stations in the Wallace 1°×2° quadran-gle: U.S. Geological Survey Open-File Report 82–132.
Bankey, V.L., Kleinkopf, M.D., Brickey, M.R., Mancinelli, J.A.,and Kulik, D.M., 1985, Gravity survey data of the Kalispell1°×2° quadrangle, Montana: U.S. Geological SurveyOpen-File Report 85–221.
Bishop, D.T., 1973, Petrology and geochemistry of the Purcell sillsin Boundary County, Idaho, in Belt Symposium, v. 2: IdahoBureau of Mines and Geology Special Publication, p. 15–66.
Boettcher, A.L., 1966, The Rainy Creek igneous complex nearLibby, Montana: University Park, Pennsylvania StateUniversity, Ph.D. thesis, 155 p.
GEOPHYSICAL INTERPRETATIONS, LIBBY THRUST BELT, MONTANA
20
Brickey, M.R., Bankey, V.L., and Kleinkopf, M.D., 1980, Principalfacts for gravity stations in part of the Wallace 1°×2° quadran-gle, Idaho and Montana: U.S. Geological Survey Open-FileReport 81–178.
Briggs, I.C., 1974, Machine contouring using minimum curvature:Geophysics, v. 39, p. 39–40.
Burmester, R.F., 1985, Preliminary geologic map of the Eastportarea, Idaho and Montana: U.S. Geological Survey Open-FileReport 85–517, scale 1:48,000.
Cordell, Lindrith, Keller, G.R., and Hildenbrand, T.G., 1982,Bouguer gravity map of the Rio Grande rift, Colorado, NewMexico, and Texas: U.S. Geological Survey GeophysicalInvestigations Series Map GP–949, scale 1:1,000,000.
Fabiano, E.B., and Peddie, N.W., 1980, Magnetic declination in theUnited States—Epoch 1980: U.S. Geological Survey Miscella-neous Investigation Series Map I–1283, scale 1:5,000,000.
Fabiano, E.B., Peddie, N.W., and Jones, W.J., 1976, Magnetic totalintensity in the United States—Epoch 1975.0: U.S. GeologicalSurvey Miscellaneous Investigations Map I–915, scale1:5,000,000, 2 sheets.
Feldman, I.S., 1976, On the nature of conductive layers in theEarth's crust and upper mantle, in Adam, A., ed., Geoelectricaland geothermal studies: Budapest, Akademiai Kaido, p.721–730.
Fountain, D.M., and McDonough, D., 1984, Crustal structure ofnorthwestern Montana and southern Alberta and BritishColumbia based on the interpretation of gravity data: MontanaGeological Society Field Conference and Symposium, North-western Montana and adjacent Canada, Guidebook, p.253–258.
Gibson, Russell, 1948, Geology and ore deposits of the Libby quad-rangle, Montana, with sections on Pleistocene glaciation byW.C. Alden and Physiography by J.T. Pardee: U.S. GeologicalSurvey Bulletin 956, 131 p., 2 pl., scales 1:125,000 and1:250,000.
Harris, D.W., 1985, Crustal structure of northwestern Montana:Missoula, University of Montana, M.S. thesis, 59 p.
Harrison, J.E., 1972, Precambrian Belt basin of northwesternUnited States—Its geometry, sedimentation, and copperoccurrences: Geological Society of America Bulletin, v. 83,no. 5, p. 1215–1240.
Harrison, J.E., and Cressman, E.R., 1993, Geology of the Libbythrust belt of northwestern Montana and its implications toregional tectonics: U.S. Geological Survey Professional Paper1524, scale 1:125,000.
Harrison, J.E., Cressman, E.R., and Kleinkopf, M.D., 1985,Regional structure, the Atlantic Richfield–Marathon Oil No. 1Gibbs borehole, and hydrocarbon resource potential west of theRocky Mountain trench in northwestern Montana: U.S. Geo-logical Survey Open-File Report 85–249, 5 p.
Harrison, J.E., Cressman, E.R., and Whipple, J.W., 1992, Geologicand structure maps of the Kalispell 1°×2° quadrangle, Montanaand Alberta and British Columbia: U.S. Geological SurveyMiscellaneous Investigations Series Map I–2267, scale1:250,000, 2 sheets.
Harrison, J.E., Griggs, A.B., and Wells, J.D., 1986, Geologic andstructure maps of the Wallace 1°×2° quadrangle, Montana andIdaho: U.S. Geological Survey Miscellaneous InvestigationsSeries Map I–1509–A, scale 1:250,000, 2 sheets.
Harrison, J.E., Kleinkopf, M.D., and Obradovich, J.D., 1972,Tectonic events at the intersection between the Hope fault andthe Purcell trench, northern Idaho: U.S. Geological SurveyProfessional Paper 719, 24 p.
Harrison, J.E., Kleinkopf, M.D., and Wells, J.D., 1980, Phanerozo-ic thrusting in Protozeroic belt rocks, northwestern UnitedStates: Geology, v. 8, p. 407–411.
Hobbs, S.W., Griggs, A.B., Wallace, R.E., and Campbell, A.B.,1965, Geology of the Coeur d’ Alene district, ShoshoneCounty, Idaho: U.S. Geological Survey Professional Paper478, 139 p.
International Association of Geodesy, 1967, Geodetic referencesystem, 1967: International Association of Geodesy SpecialPublication 3, 74 p.
King, E.R., Harrison, J.E., and Griggs, A.B., 1970, Geologicimplications of aeromagnetic data in the Pend Oreille area,Idaho-Montana: U.S. Geological Survey Professional Paper646–D, 17 p.
King, P.B., 1969, Tectonic map of North America: U.S. GeologicalSurvey, scale 1:5,000,000, 2 sheets.
Kleinkopf, M.D., 1977, Regional geophysical studies of the north-ern belt basin, Montana: Geological Society of America,Rocky Mountain Section, Abstracts with Programs, v. 9, no. 5,p. 738.
———1981, Geophysical surveys of the Cabinet Mountains Wil-derness, Lincoln and Sanders Counties, Montana, in Mineralresources of the Cabinet Mountains Wilderness, Lincoln andSanders Counties, Montana: U.S. Geological Survey Bulletin1501, 77 p, scale 1:62,500.
———1983, Gravity expression of the Rocky Mountain Trench, inGeologic and structural framework and minerals and energyresources of northwest Montana: Tobacco Root GeologicalSociety Field Conference, Kalispell, Montana, 1983,Abstracts, p. 13–14.
———1984, Gravity and magnetic anomalies of the Belt Basin,United States and Canada: Belt Symposium, 2nd, Abstractswith Programs; Montana Bureau of Mines and GeologySpecial Publication 90, p. 85–87.
Kleinkopf, M.D., and Bankey, V.L., 1982, Gravity studies ofregional structures in the northern Rocky Mountains: Geologi-cal Society of America Annual Meeting, 95th, New Orleans,Abstracts with Programs, v. 14, no. 7, p. 531.
Kleinkopf, M.D., and Harrison, J.E., 1982, The application ofaeromagnetic and gravity anomaly maps in mineral resourceassessments of the Wallace quadrangle, Northern RockyMountains [abs.]: Society of Exploration GeophysicistsAnnual Meeting, 52nd Dallas, Technical Program Abstractsand Biographies, v. 48, p. 454.
Kleinkopf, M.D., Harrison, J.E., and Bankey, V.L., 1982, Slidesshowing aeromagnetic and gravity anomaly maps and ametallic mineral resource favorability map of the Wallace1°×2° quadrangle, Montana and Idaho: U.S. Geological Sur-vey Open-File Report 82–709.
———1988, Aeromagnetic and gravity anomaly maps and ahydrothermal veins favorability map of the Wallace 1°×2°quadrangle, Montana and Idaho: U.S. Geological Survey Mis-cellaneous Field Studies Map MF–1354–E, 2 sheets,1:250,000.
Kleinkopf, M.D., Harrrison, J.E., and Zartman, R.E., 1972, Aero-magnetic and geologic map of part of northwestern Montana
21SUMMARY AND REFERENCES CITED
and northern Idaho: U.S. Geological Survey GeophysicalInvestigations Map GP–830, scale 1:250,000.
Kleinkopf, M.D., and Long, C.L., 1979, Geophysical studies in theWallace quadrangle, northern belt basin, Montana and Idaho[abs.]: Northwest Mining Association Annual Convention,85th, Spokane, Washington, Program, p. 15.
Kleinkopf, M.D., and Wilson, D.M., 1981, Aeromagnetic andgravity studies of the Scotchman Peak Wilderness Study Area,Lincoln and Sanders Counties, Montana, and Bonner County,Idaho, in Mineral resources of the Scotchman Peak WildernessStudy Area, Lincoln and Sanders Counties, Montana, and Bon-ner County, Idaho: U.S. Geological Survey Bulletin 1467, 26 p.
Larsen, E.S., and Pardee, J.T., 1929, The stock of alkaline rocksnear Libby, Montana: Journal of Geology, v. 37, no. 2, p.97–112.
Larue, D.K., 1981, The Early Proterozoic Pre-Iron FormationMenominee Group siliclastic sediments of the southern LakeSuperior region—Evidence for sedimentation in platform andbasinal settings: Journal of Sedimentary Petrology, v. 51, no. 2,p. 397–414.
Lawler, T.L., and Vadis, M., 1986, Mineral potential of iron-richvolcanogenic metasediments, Glen Township, east-centralMinnesota: Annual Institute on Lake Superior Geology, 32nd,p. 49.
Long, C.L., 1983, Maps showing results of audio-magnetotelluricstudies in the northwestern part of the Wallace 1°×2° quadran-gle, Montana and Idaho: U.S. Geological Survey Miscella-neous Field Studies Map MF–1354–B, scale 1:250,000.
———1988, Interpretations of two audio-magnetotelluric profilesacross the Sylvanite anticline, Idaho and Montana: U.S. Geo-logical Survey Open-File Report 88–658.
Mabey, D.R., Zietz, Isidore, Eaton, G.P., and Kleinkopf, M.D.,1978, Regional magnetic patterns in part of the Cordillera inthe western United States, in Cenozoic tectonic and regionalgeophysics of the western Cordillera: Geological Society ofAmerica Memoir 152, p. 993–106.
Marvin, R.F., Zartman, R.E., Obradovich, J.D., and Harrison, J.E.,1984, Geochronometric and lead isotope data on samples fromthe Wallace 1°×2° quadrangle, Montana and Idaho: U.S. Geo-logical Survey Miscellaneous Field Studies Map MF–1354–G,scale 1:250,000.
Morelli, Carlo, Gantar, C., Honkasla, Tauno, McKonnel, R.K.,Tanner, J.G., Szabo, Bela, Uotila, U.A., and Whalen, G.T.,1974, The international gravity standardization net 1972(I.G.S.N.): Paris, Bureau Central de l’Association Internation-ale de Geodesie Special Publications 4, 194 p.
Okulitch, A.V., 1984, The role of the Shuswap Metamorphic Com-plex in Cordilleran tectonism—A review: Canadian Journal ofEarth Sciences, v. 21, no. 10, p. 1171–1193.
Parasnis, D.S., 1968, A supplementary comment on R. Green’sNote, “The EAEG’S Choice of Units”: Geophysical Prospect-ing, v. 16, p. 392–393.
Peddie, N.W., Jones, W.J., and Fabiano, E.B., 1976, Magnetic incli-nation in the United States—Epoch 1975.0: U.S. GeologicalSurvey Miscellaneous Investigations Series Map I–912, scale1:5,000,000, 2 sheets.
Plouff, Donald, 1977, Preliminary documentation for a Fortranprogram to compute gravity terrain corrections based on topog-raphy digitized on a geographic grid: U.S. Geological SurveyOpen-File Report 77–535, 43 p.
Potter. C.J., Sanford, W.E., Yoos, T.R., Prussen, E.I., Keach, R.W.,Oliver, J.E., Kaufman, S., and Brown, L.D., 1986, CORCORPdeep seismic reflection traverse of the interior of the NorthAmerican Cordillera, Washington and Idaho—Implications fororogenic evolution: Tectonics, v. 5, p. 1007–1026.
Price, R.A., 1981, The Cordilleran foreland fold and thrust belt inthe southern Canadian Rocky Mountains, in McClay, K.R., andPrice, N.J., eds., Thrust and nappe tectonics: GeologicalSociety of London Special Publication 90, p. 47–48.
Price, R.A., and Fermor, P.R. 1985, Structure section of the Cordil-leran foreland thrust and fold belt west of Calgary, Alberta:Geological Society of Canada Special Paper 84–14.
Reynolds, M.W., and Kleinkopf, M.D., 1977, The Lewis and Clarkline, Montana-Idaho—A major intraplate tectonic boundary:Geological Society of America Abstracts with Programs, v. 9,no. 7, p. 1140–1141.
Smithson, S.B., 1971, Densities of metamorphic rocks: Geophys-ics, v. 36, no. 4, p. 690–694.
Sweeney, R.E., 1990, IGRFGRID—A program for creation of atotal magnetic field (international geomagnetic reference field)grid representing the Earth's main magnetic field: U.S. Geo-logical Survey Open-File Report 90–45A, 37 p.
U.S. Department of Defense, 1974, World relative gravity referencenetwork, pt. 2, North America: Defense Mapping AgencyAerospace Center Reference Publication 25, v. 2, with supple-ment updating gravity values to the International Gravity Stan-dardization Net (IGSN), 1,635 p.
U.S. Geological Survey, 1969a, Aeromagnetic map of the Libbyand Mt. Pend Oreille quadrangles, Lincoln and Sanders Coun-ties, Montana, and Bonner County, Idaho: U.S. GeologicalSurvey Geophysical Investigations Map GP–682, scale1:62,500.
———1969b, Aeromagnetic map of the Thompson Lakes quad-rangle, Lincoln, Sanders, and Flathead Counties, Montana:U.S. Geological Survey Geophysical Investigations MapGP–683, scale 1:62,500.
———1969c, Aeromagnetic map of the McGregor Lake–TallyLake area, Flathead and Lincoln Counties, Montana: U.S. Geo-logical Survey Geophyscial Investigations Map GP–684, scale1:62,500.
———1969d, Aeromagnetic map of the Trout Creek quadrangle,Sanders and Lincoln Counties, Montana, and Shoshone Coun-ty, Idaho: U.S. Geological Survey Geophysical InvestigationsMap GP–685, scale 1:62,500.
———1969e, Aeromagnetic map of the Thompson Falls quadran-gle, Lincoln and Sanders Counties, Montana: U.S. GeologicalSurvey Geophysical Investigations Map GP–686, scale1:62,500.
———1969f, Aeromagnetic map of the Hubbart Reservoir–HotSprings area, Sanders, Flathead, and Lakes Counties, Montana:U.S. Geological Survey Geophysical Investigations MapGP–687, scale 1:62,500.
———1969g, Aeromagnetic map of the Kingston, Kellogg, andpart of the Fernwood quadrangles, Shoshone, Benewah, andKootenai Counties, Idaho: U.S. Geological Survey Geophysi-cal Investigations Map GP–688, scale 1:62,500.
———1969h, Aeromagnetic map of the Avery quadrangle, Shos-hone County, Idaho, and Mineral and Sanders Counties, Mon-tana: U.S. Geological Survey Geophysical Investigations MapGP–689, scale 1:62,500.
GEOPHYSICAL INTERPRETATIONS, LIBBY THRUST BELT, MONTANA22
———1969i, Aeromagnetic map of the Haughan and St Regisquadrangles and parts of the Simmons Peak and Illinois Peakquadrangles, Shonsone County, Idaho, and Mineral andSanders Counties, Montana: U.S. Geological Survey Geo-physical Investigations Map GP–690, scale 1:62,500.
———1969j, Aeromagnetic map of the Plains, Perma, Superior,and Tarkio quadrangles, Sanders, Mineral, and Missoula,Counties, Montana: U.S. Geological Survey GeophysicalInvestigations Map GP–691, scale 1:62,500.
———1973, Aeromagnetic map of parts of the Okanogan andSandpoint 1°×2ϒ quadrangles, Washington-Idaho-Montana:U.S. Geological Survey Open-File Map 294, scale 1:250,000.
Webring, M.W., 1981, MINC—A gridding program based on min-imum curvature: U.S. Geological Survey Open-File Report81–1230, 12 p.
———1982, SAKI—A Fortran program for generalized linearinversion of gravity and magnetic profiles: U.S. GeologicalSurvey Open-File Report 82–122, 29 p.
Wells, A.T., Forman, D.J., Ranford, L.C., and Cook, P.I., 1970,Geology of the Amadeus Basin, central Australia: AustralianBureau of Mineral Resources, Geology and Geophysics Bul-letin 100, 222 p.
Wells, J.D., Lindsey, D.A., and Van Loenen, R.E., 1981, Geologyof the Cabinet Mountains Wilderness, Lincoln and SandersCounties, Montana: U.S. Geological Survey Bulletin 1501–A,p. 9–19.
Wynn, J.C., Kleinkopf, M.D., and Harrison, J.E., 1977, Anaudio-frequency magnetotelluric and gravity traverse acrossthe crest of the Purcell geanticline, northwestern Montana:Geology, v. 5, p. 309–312.
Yoos, T.R., Potter, C.J., Thigpen, J.L., and Brown, L.D., 1991, TheCordilleran fold and thrust belt in northwest Montana andnorthern Idaho from COCORP and industry seismic reflectiondata: American Association of Petroleum Geologists Bulletin,v. 75, no. 6, p. 1089–1106.
Published in the Central Region, Denver, ColoradoManuscript approved for publication January 11, 1994Edited by Judith StoeserGraphics by Dennis Welp, Nancy Shock, R. Randall Schumann
and Gayle DumonceauxPhotocomposition by Gayle DumonceauxOn-line version by Joan G. Nadeau