geophysical investigations to assess industrial waste...
TRANSCRIPT
UCIL GAP 401 28(VSS)
Page 1 of 33
GEOPHYSICAL INVESTIGATIONS TO ASSESS INDUSTRIAL WASTE DUMPED AT UCIL, BHOPAL
UCIL (Union Carbide India Ltd.) had been producing pesticides and insecticides
since the inception of its factory in 1969 in Bhopal (M.P.) India. After the MIC gas
leakage in December 1984, the production had stopped and subsequently the factory has
been closed. Some of the structures are lying in the premises, many buildings are
demolished. The industrial wastes are dumped at different places. In order to assess the
locations and dimensions of these dumps, geophysical investigations have been carried
out. Geophysical investigations are used to identify buried industrial waste that cannot be
easily identified by visual inspection. It is most economical and successful technique to
assess the buried dump before a more detailed investigations or remedial measures can be
adopted. The investigations have been financed by MP State Govt. namely BGRD
(Bhopal Gas Relief Directorate) and Ministry of Chemical and Fertilizer (Govt. of India).
Introduction:
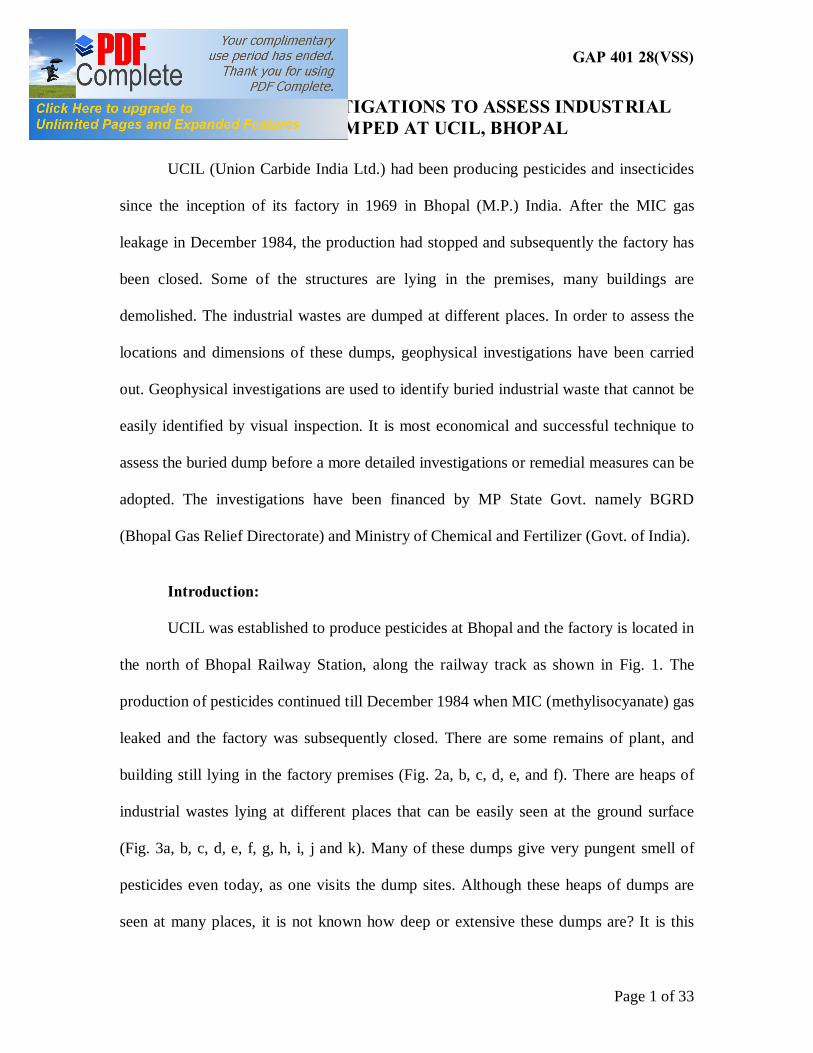
UCIL was established to produce pesticides at Bhopal and the factory is located in
the north of Bhopal Railway Station, along the railway track as shown in Fig. 1. The
production of pesticides continued till December 1984 when MIC (methylisocyanate) gas
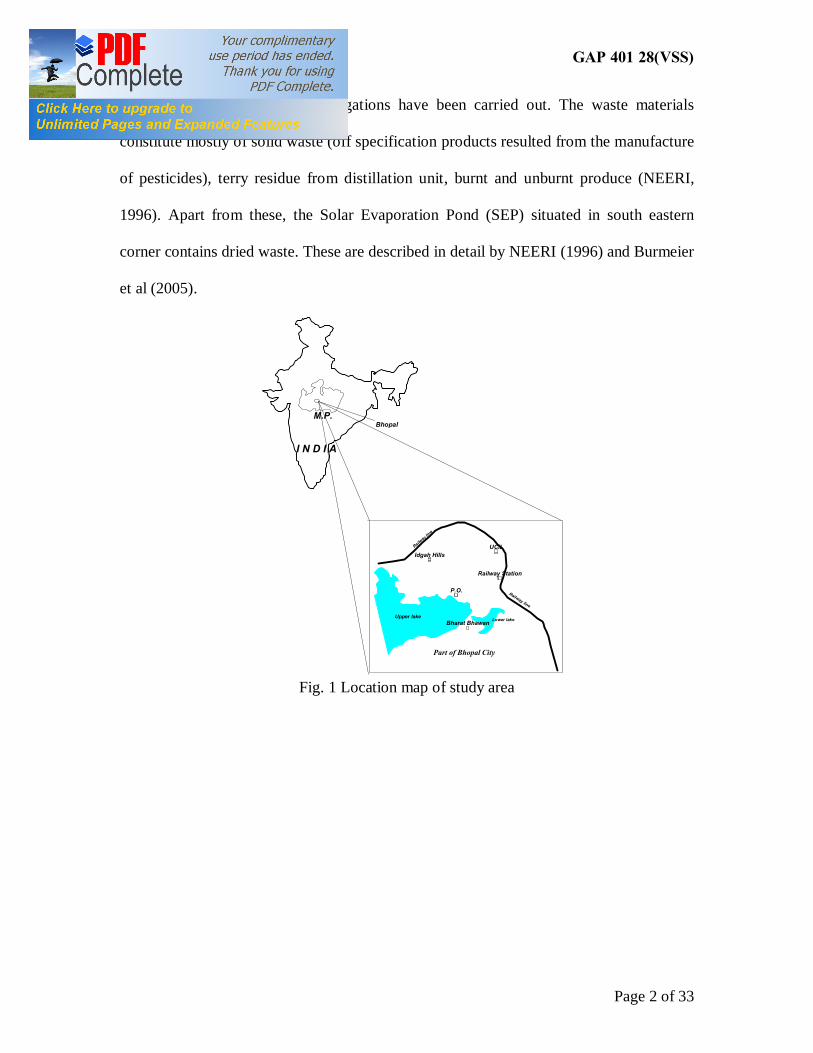
leaked and the factory was subsequently closed. There are some remains of plant, and
building still lying in the factory premises (Fig. 2a, b, c, d, e, and f). There are heaps of
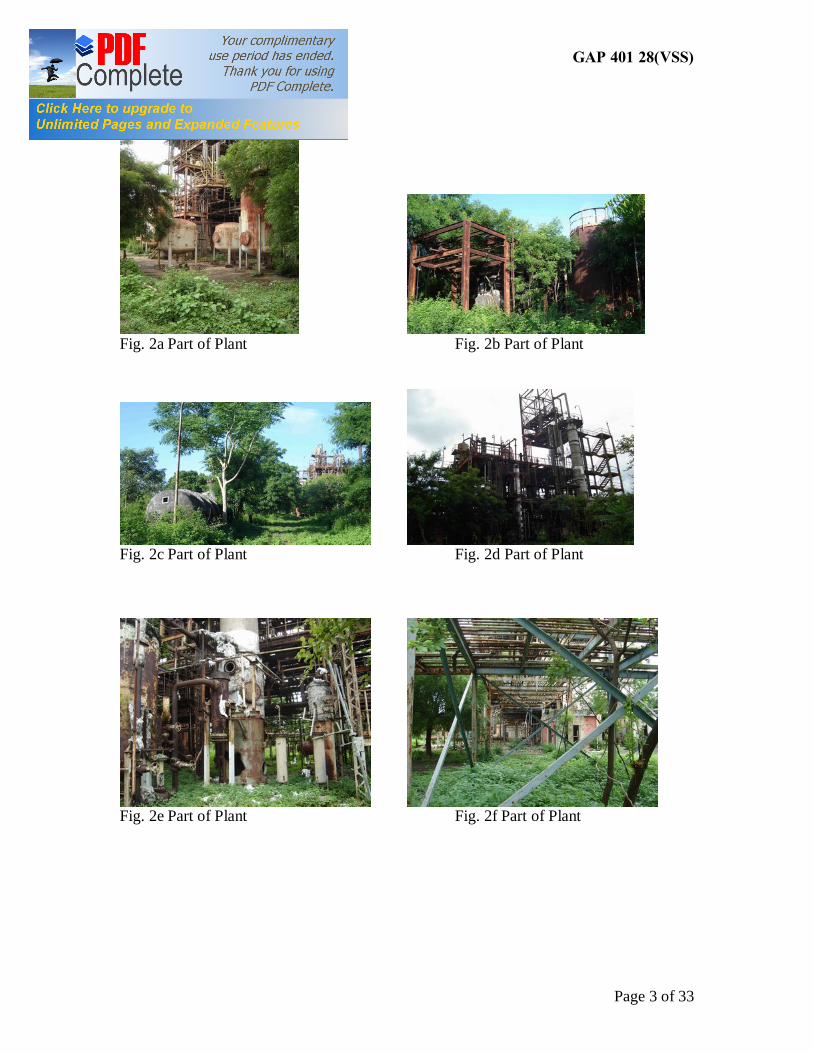
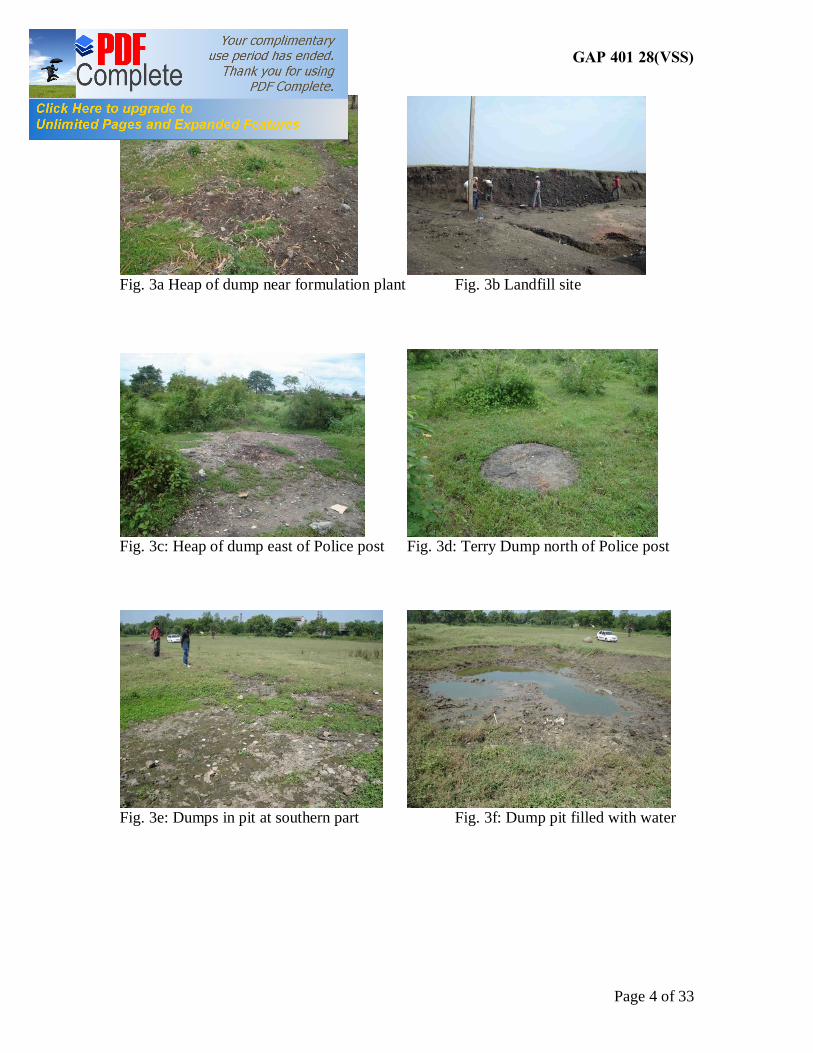
industrial wastes lying at different places that can be easily seen at the ground surface
(Fig. 3a, b, c, d, e, f, g, h, i, j and k). Many of these dumps give very pungent smell of
pesticides even today, as one visits the dump sites. Although these heaps of dumps are
seen at many places, it is not known how deep or extensive these dumps are? It is this
UCIL GAP 401 28(VSS)
Page 2 of 33
objective that geophysical investigations have been carried out. The waste materials
constitute mostly of solid waste (off specification products resulted from the manufacture
of pesticides), terry residue from distillation unit, burnt and unburnt produce (NEERI,
1996). Apart from these, the Solar Evaporation Pond (SEP) situated in south eastern
corner contains dried waste. These are described in detail by NEERI (1996) and Burmeier
et al (2005).
Railway Station
Bharat Bhawan
Idgah Hills
P.O.
UCIL
Upper lake Lower lake
Part of Bhopal City
Railway lin
e
Railway line
I N D I A
M.P.Bhopal
Fig. 1 Location map of study area
UCIL GAP 401 28(VSS)
Page 3 of 33
Fig. 2a Part of Plant Fig. 2b Part of Plant
Fig. 2c Part of Plant Fig. 2d Part of Plant
Fig. 2e Part of Plant Fig. 2f Part of Plant
UCIL GAP 401 28(VSS)
Page 4 of 33
Fig. 3a Heap of dump near formulation plant Fig. 3b Landfill site
Fig. 3c: Heap of dump east of Police post Fig. 3d: Terry Dump north of Police post
Fig. 3e: Dumps in pit at southern part Fig. 3f: Dump pit filled with water
UCIL GAP 401 28(VSS)
Page 5 of 33
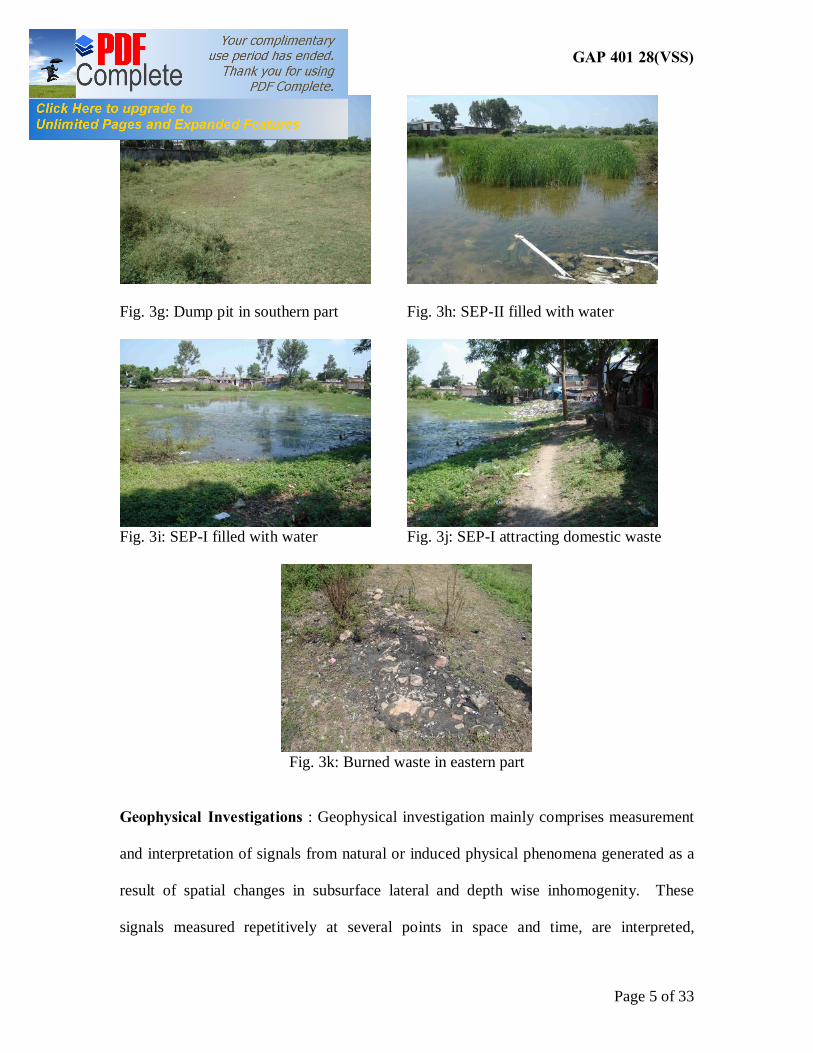
Fig. 3g: Dump pit in southern part Fig. 3h: SEP-II filled with water
Fig. 3i: SEP-I filled with water Fig. 3j: SEP-I attracting domestic waste
Fig. 3k: Burned waste in eastern part
Geophysical Investigations : Geophysical investigation mainly comprises measurement
and interpretation of signals from natural or induced physical phenomena generated as a
result of spatial changes in subsurface lateral and depth wise inhomogenity. These
signals measured repetitively at several points in space and time, are interpreted,
UCIL GAP 401 28(VSS)
Page 6 of 33
considering geological information, in terms of sub-surface structures/features.
Depending upon the scale of operations, geophysical survey can help to delineate
regional hydrogeologic features. A reliable interpretation of geophysical survey data
requires a good knowledge of sub-surface geology in the area. Geophysical investigations
are the best tools for indirectly mapping the sub-surface rock formations and structures.
Among all the surface geophysical techniques for shallow subsurface prospecting,
Electrical Resistivity Method is the most widely applied method. This is because of its
efficacy to delineate subsurface strata besides being simple and inexpensive to carry out
the field operations.
The rock matrix of most of the geological formation is basically highly resistive
and does not conduct electricity. There are, however, exceptions like clay, shale etc.,
which comprise conducting minerals. These formations have low electrical resistivities
when compared to other rock formations. The resistivity of a rock formation reduces
only when it contains moisture. The reduction in resistivity of a rock depends upon the
relative quantity and quality of water it contains. Thus by measuring or determining the
resistivities of earth layers at different depths, it is possible to infer the hydro-geological
character of a particular subsurface layer.
In order to delineate subsurface stratigraphy, geophysical investigations are
adopted. It is cost effective and easy to get subsurface lithological information. Earlier
during 1994, NGRI carried out geo-electrical profilings and soundings to delineate dump
site as well as subsurface strata in the premises of UCIL ( Jain et al, 1994). Conventional
four electrode resistivity meter was used. Schlumberger array and Wenner array were
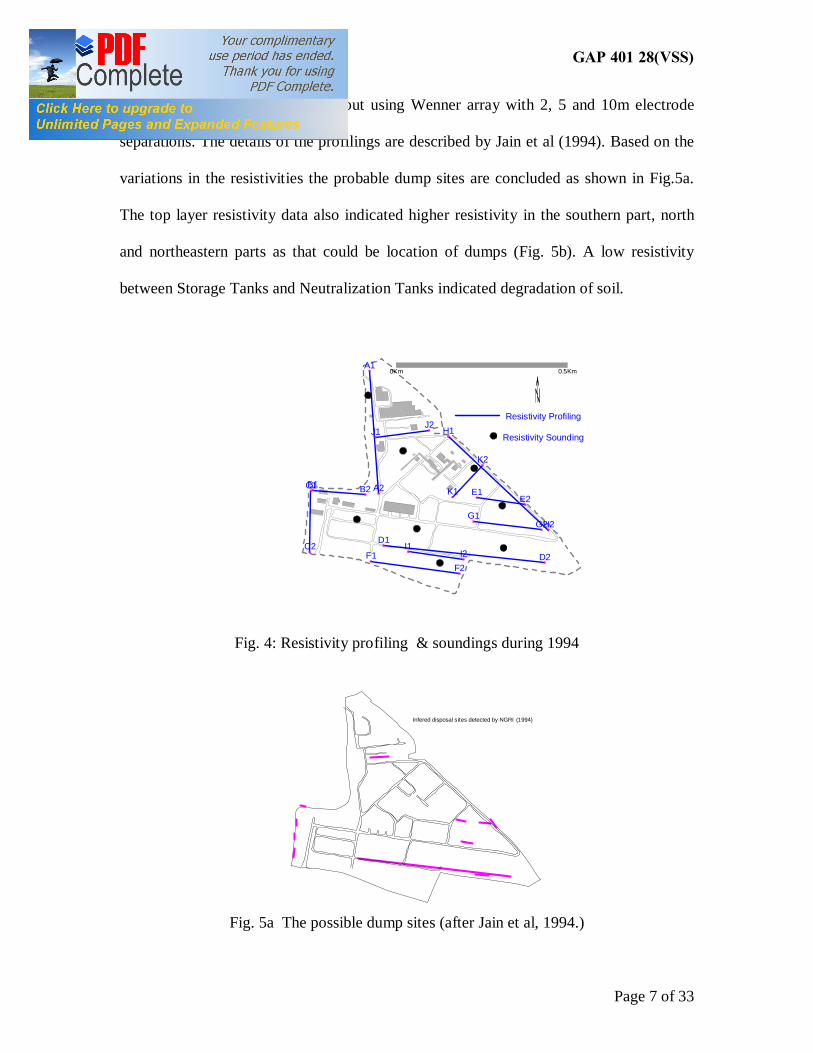
adopted to generate data. Fig. 4 shows the locations of soundings and profilings. The
UCIL GAP 401 28(VSS)
Page 7 of 33
resistivity profilings were carried out using Wenner array with 2, 5 and 10m electrode
separations. The details of the profilings are described by Jain et al (1994). Based on the
variations in the resistivities the probable dump sites are concluded as shown in Fig.5a.
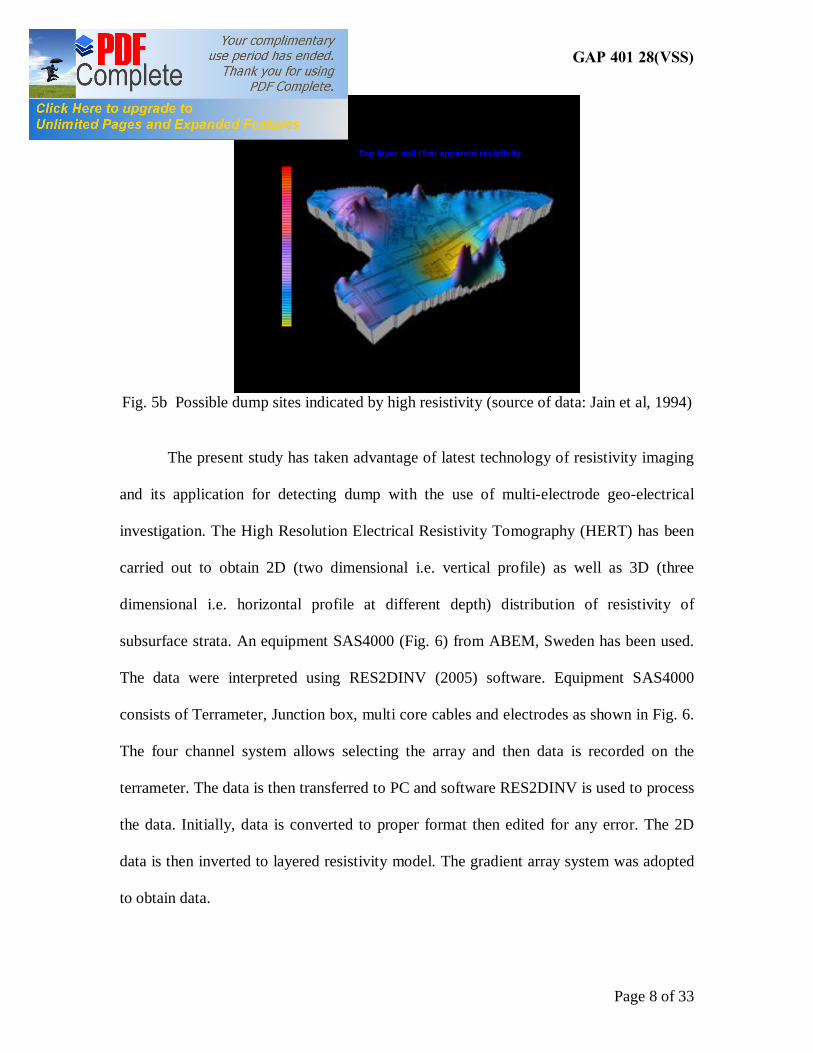
The top layer resistivity data also indicated higher resistivity in the southern part, north
and northeastern parts as that could be location of dumps (Fig. 5b). A low resistivity
between Storage Tanks and Neutralization Tanks indicated degradation of soil.
A1
A2B1 B2C1
C2D1
D2
E1E2
F1F2
G1G2
H1
H2
I1I2
J1J2
K1
K2
0Km 0.5Km
Resistivity Profiling
Resistivity Sounding
Fig. 4: Resistivity profiling & soundings during 1994
Infered disposal s ites detected by NGRI (1994)
Fig. 5a The possible dump sites (after Jain et al, 1994.)
UCIL GAP 401 28(VSS)
Page 8 of 33
0
4
8
12
16
20
24
28
32
36
40
44
48
52
56
Top layer soil (1m) apparent resistivity
App. Resistivity in ohm.m
Fig. 5b Possible dump sites indicated by high resistivity (source of data: Jain et al, 1994)
The present study has taken advantage of latest technology of resistivity imaging
and its application for detecting dump with the use of multi-electrode geo-electrical
investigation. The High Resolution Electrical Resistivity Tomography (HERT) has been
carried out to obtain 2D (two dimensional i.e. vertical profile) as well as 3D (three
dimensional i.e. horizontal profile at different depth) distribution of resistivity of
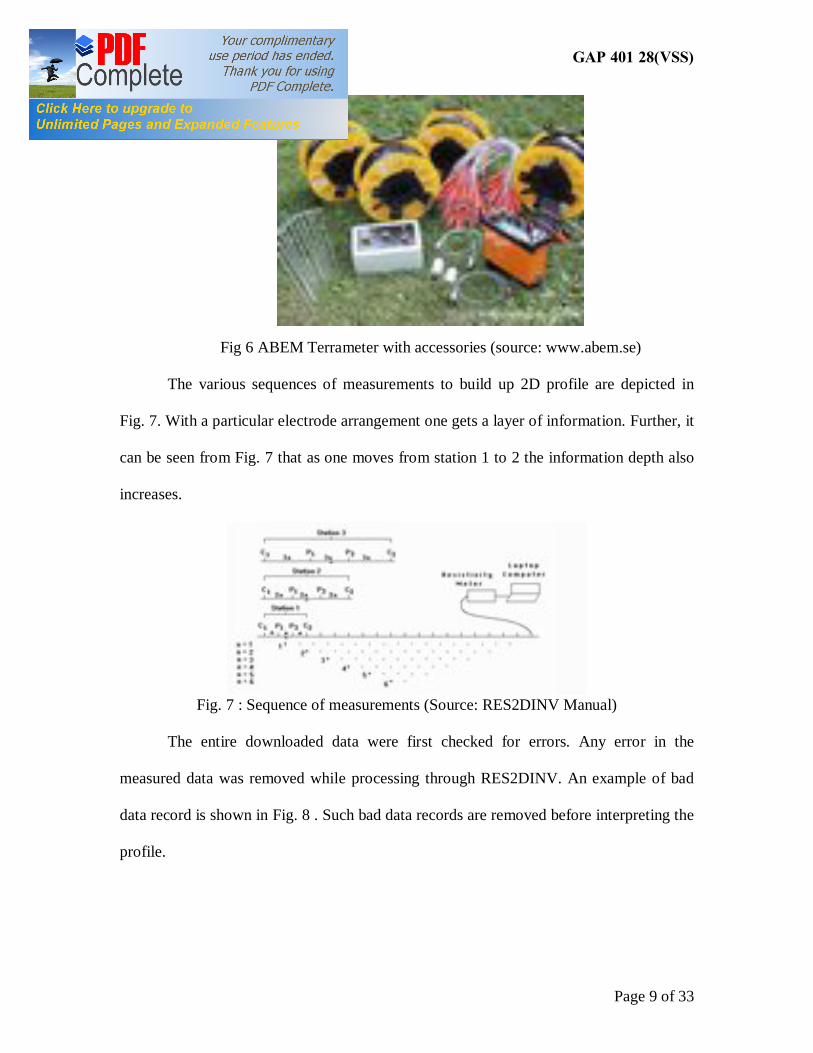
subsurface strata. An equipment SAS4000 (Fig. 6) from ABEM, Sweden has been used.
The data were interpreted using RES2DINV (2005) software. Equipment SAS4000
consists of Terrameter, Junction box, multi core cables and electrodes as shown in Fig. 6.
The four channel system allows selecting the array and then data is recorded on the
terrameter. The data is then transferred to PC and software RES2DINV is used to process
the data. Initially, data is converted to proper format then edited for any error. The 2D
data is then inverted to layered resistivity model. The gradient array system was adopted
to obtain data.
UCIL GAP 401 28(VSS)
Page 9 of 33
Fig 6 ABEM Terrameter with accessories (source: www.abem.se)
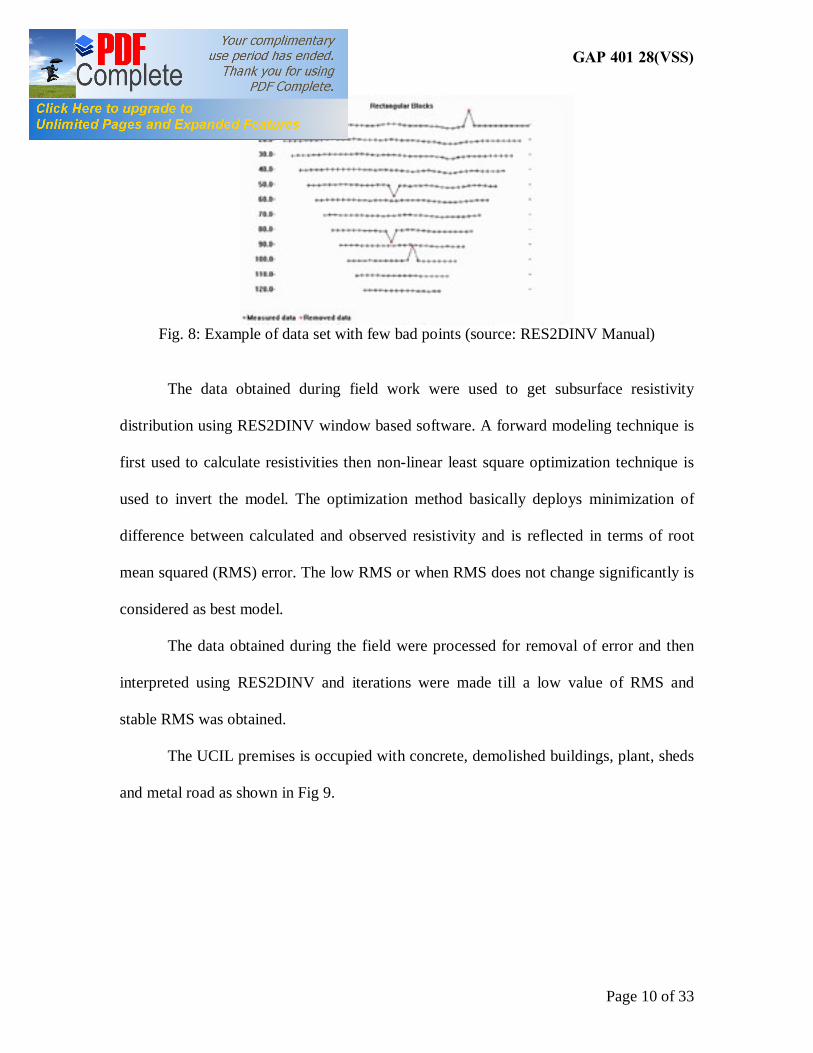
The various sequences of measurements to build up 2D profile are depicted in
Fig. 7. With a particular electrode arrangement one gets a layer of information. Further, it
can be seen from Fig. 7 that as one moves from station 1 to 2 the information depth also
increases.
Fig. 7 : Sequence of measurements (Source: RES2DINV Manual)
The entire downloaded data were first checked for errors. Any error in the
measured data was removed while processing through RES2DINV. An example of bad
data record is shown in Fig. 8 . Such bad data records are removed before interpreting the
profile.
UCIL GAP 401 28(VSS)
Page 10 of 33
Fig. 8: Example of data set with few bad points (source: RES2DINV Manual)
The data obtained during field work were used to get subsurface resistivity
distribution using RES2DINV window based software. A forward modeling technique is
first used to calculate resistivities then non-linear least square optimization technique is
used to invert the model. The optimization method basically deploys minimization of
difference between calculated and observed resistivity and is reflected in terms of root
mean squared (RMS) error. The low RMS or when RMS does not change significantly is
considered as best model.
The data obtained during the field were processed for removal of error and then
interpreted using RES2DINV and iterations were made till a low value of RMS and
stable RMS was obtained.
The UCIL premises is occupied with concrete, demolished buildings, plant, sheds
and metal road as shown in Fig 9.
UCIL GAP 401 28(VSS)
Page 11 of 33
Temik Plant
Formulation PlantCycle ShedSoapstone Shed
Sevin PlantMIC Sotrage
MIC PLantWater Treatment
Naphthol Plant
Laboratory
Neutralization Pits
Storage Tanks
Entrance
Disposal
Disposal
DisposalDisposal
Disposal
Disposal
0km 0.5km
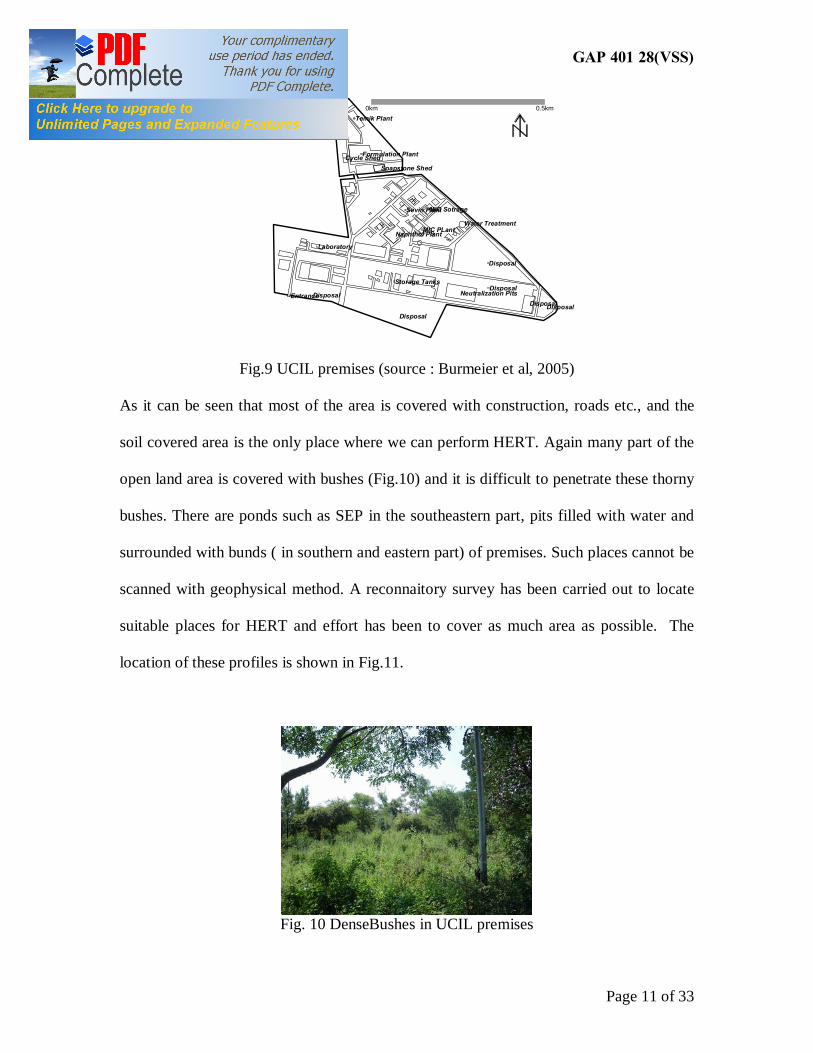
Fig.9 UCIL premises (source : Burmeier et al, 2005)
As it can be seen that most of the area is covered with construction, roads etc., and the
soil covered area is the only place where we can perform HERT. Again many part of the
open land area is covered with bushes (Fig.10) and it is difficult to penetrate these thorny
bushes. There are ponds such as SEP in the southeastern part, pits filled with water and
surrounded with bunds ( in southern and eastern part) of premises. Such places cannot be
scanned with geophysical method. A reconnaitory survey has been carried out to locate
suitable places for HERT and effort has been to cover as much area as possible. The
location of these profiles is shown in Fig.11.
Fig. 10 DenseBushes in UCIL premises
UCIL GAP 401 28(VSS)
Page 12 of 33
Geophysical Profiling
Water logged areaSite ISite II
Site III Site V
Site VI
Site VII
Site IV
Site VIII
Site IX
Fig. 11. Locations of Geophysical profiles
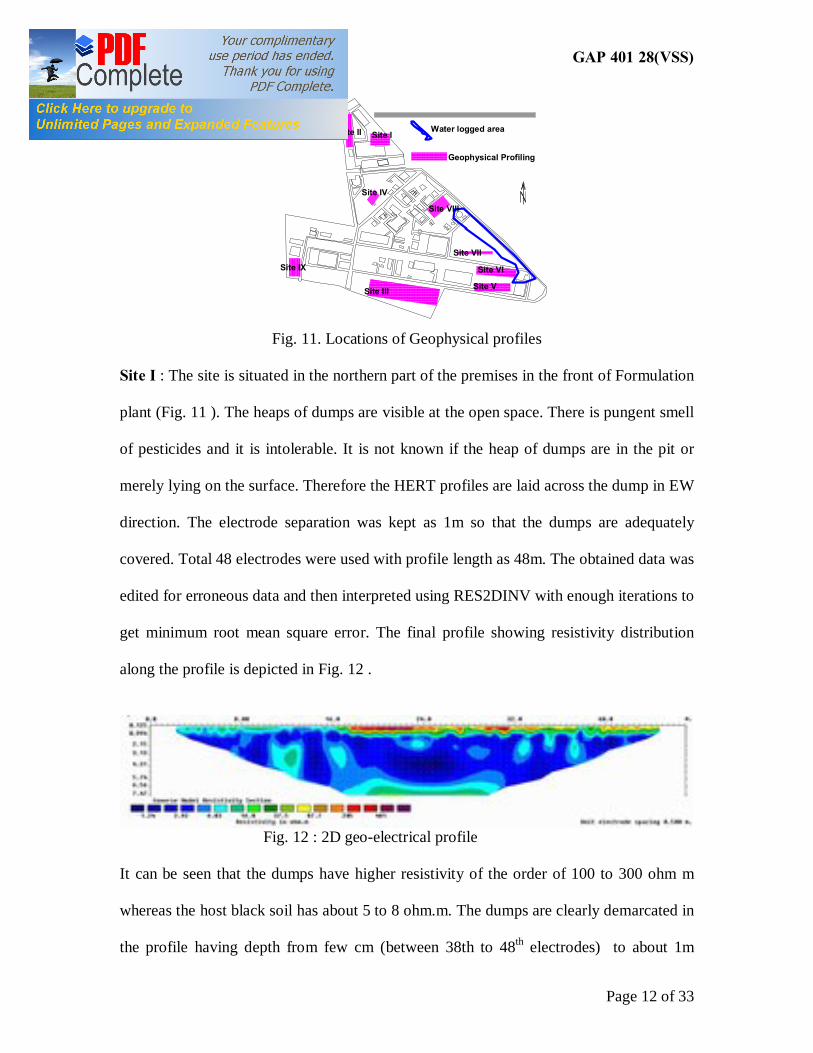
Site I : The site is situated in the northern part of the premises in the front of Formulation
plant (Fig. 11 ). The heaps of dumps are visible at the open space. There is pungent smell
of pesticides and it is intolerable. It is not known if the heap of dumps are in the pit or
merely lying on the surface. Therefore the HERT profiles are laid across the dump in EW
direction. The electrode separation was kept as 1m so that the dumps are adequately
covered. Total 48 electrodes were used with profile length as 48m. The obtained data was
edited for erroneous data and then interpreted using RES2DINV with enough iterations to
get minimum root mean square error. The final profile showing resistivity distribution
along the profile is depicted in Fig. 12 .
Fig. 12 : 2D geo-electrical profile
It can be seen that the dumps have higher resistivity of the order of 100 to 300 ohm m
whereas the host black soil has about 5 to 8 ohm.m. The dumps are clearly demarcated in
the profile having depth from few cm (between 38th to 48th electrodes) to about 1m
UCIL GAP 401 28(VSS)
Page 13 of 33
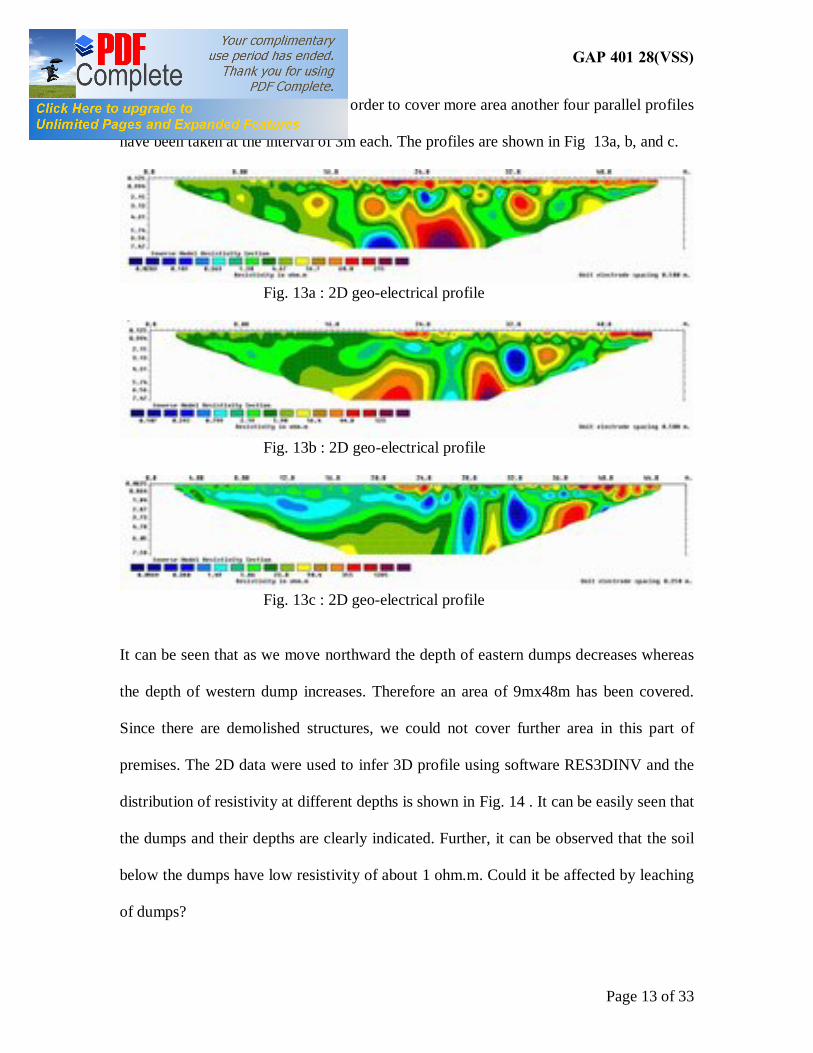
(between 17th to 27th electrodes). In order to cover more area another four parallel profiles
have been taken at the interval of 3m each. The profiles are shown in Fig 13a, b, and c.
Fig. 13a : 2D geo-electrical profile
Fig. 13b : 2D geo-electrical profile
Fig. 13c : 2D geo-electrical profile
It can be seen that as we move northward the depth of eastern dumps decreases whereas
the depth of western dump increases. Therefore an area of 9mx48m has been covered.
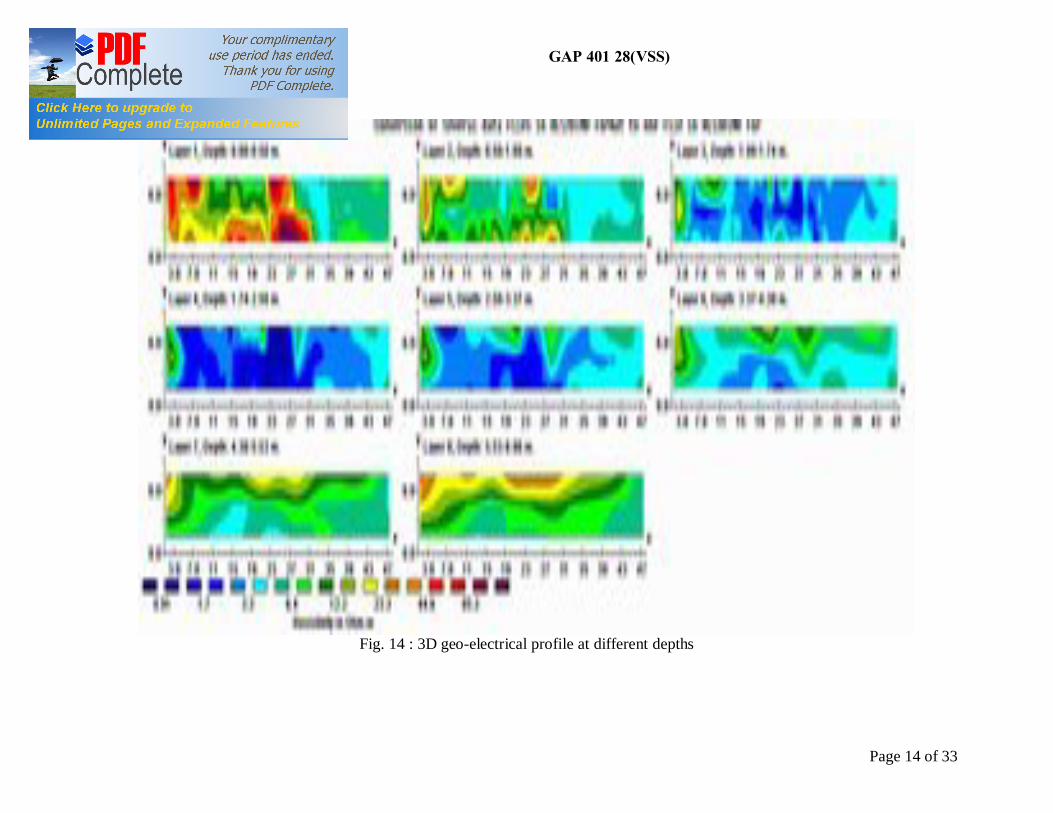
Since there are demolished structures, we could not cover further area in this part of
premises. The 2D data were used to infer 3D profile using software RES3DINV and the
distribution of resistivity at different depths is shown in Fig. 14 . It can be easily seen that
the dumps and their depths are clearly indicated. Further, it can be observed that the soil
below the dumps have low resistivity of about 1 ohm.m. Could it be affected by leaching
of dumps?
UCIL GAP 401 28(VSS)
Page 14 of 33
Fig. 14 : 3D geo-electrical profile at different depths
UCIL GAP 401 28(VSS)
Page 15 of 33
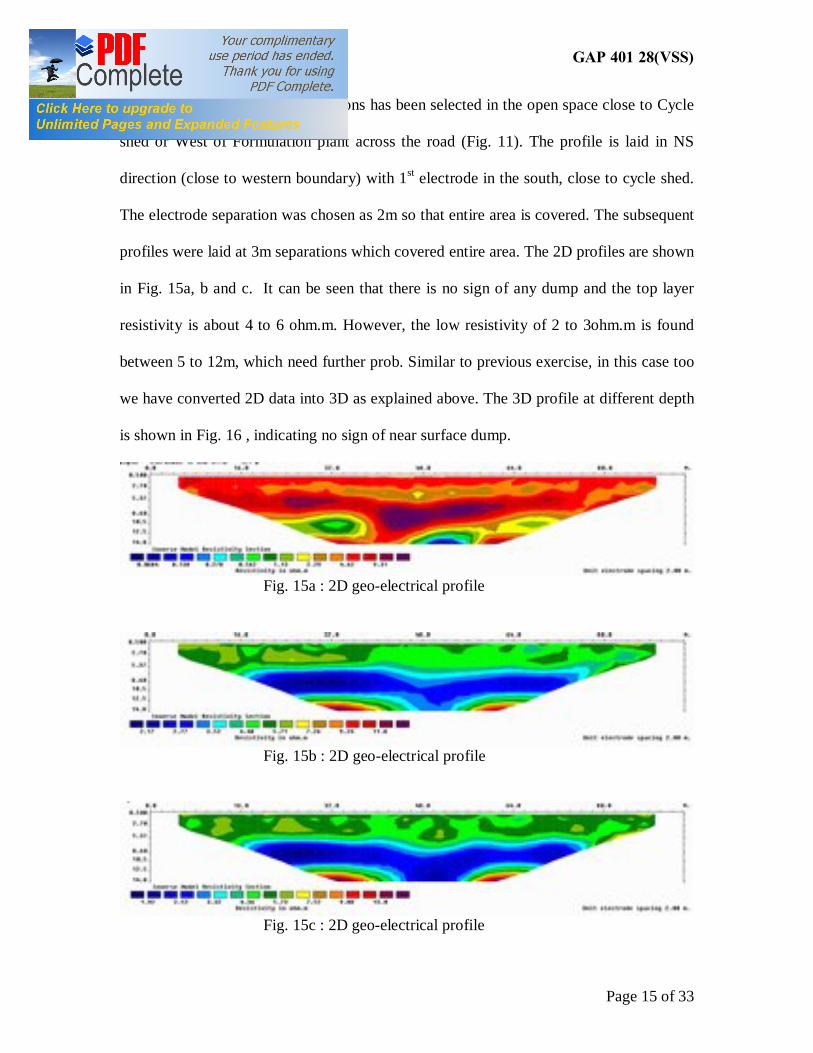
Site II : Another site of investigations has been selected in the open space close to Cycle
shed or West of Formulation plant across the road (Fig. 11). The profile is laid in NS
direction (close to western boundary) with 1st electrode in the south, close to cycle shed.
The electrode separation was chosen as 2m so that entire area is covered. The subsequent
profiles were laid at 3m separations which covered entire area. The 2D profiles are shown
in Fig. 15a, b and c. It can be seen that there is no sign of any dump and the top layer
resistivity is about 4 to 6 ohm.m. However, the low resistivity of 2 to 3ohm.m is found
between 5 to 12m, which need further prob. Similar to previous exercise, in this case too
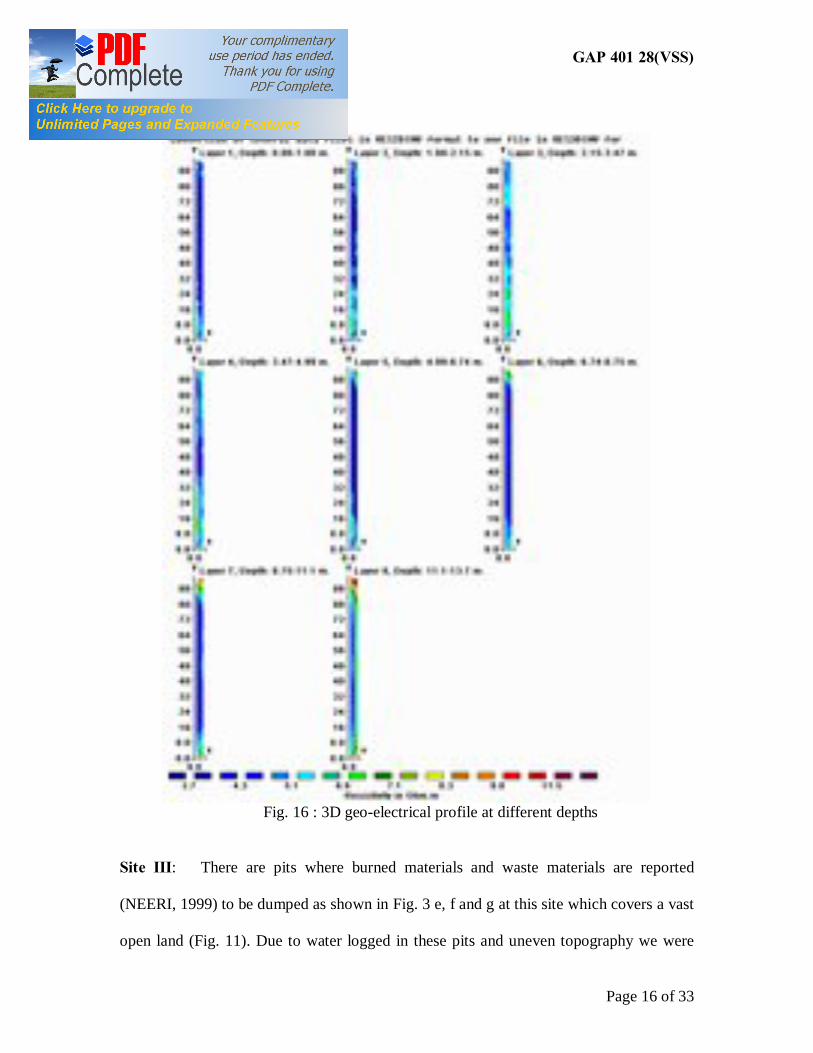
we have converted 2D data into 3D as explained above. The 3D profile at different depth
is shown in Fig. 16 , indicating no sign of near surface dump.
Fig. 15a : 2D geo-electrical profile
Fig. 15b : 2D geo-electrical profile
Fig. 15c : 2D geo-electrical profile
UCIL GAP 401 28(VSS)
Page 16 of 33
Fig. 16 : 3D geo-electrical profile at different depths
Site III: There are pits where burned materials and waste materials are reported
(NEERI, 1999) to be dumped as shown in Fig. 3 e, f and g at this site which covers a vast
open land (Fig. 11). Due to water logged in these pits and uneven topography we were
UCIL GAP 401 28(VSS)
Page 17 of 33
unable to take profile across it, however these are known dump sites. Although there is
no sign of any dump heap, we covered entire open area by selecting electrode separation
of 3m in EW direction with 1st electrode in the area that is opposite Police post. The site
is selected in the open area which is in the southern part of premises and south of road
opposite to Storage tank or near Neutralization pit (Fig. 11). The western part of the area
is occupied by metal road and demolished structures hence that part is not covered. The
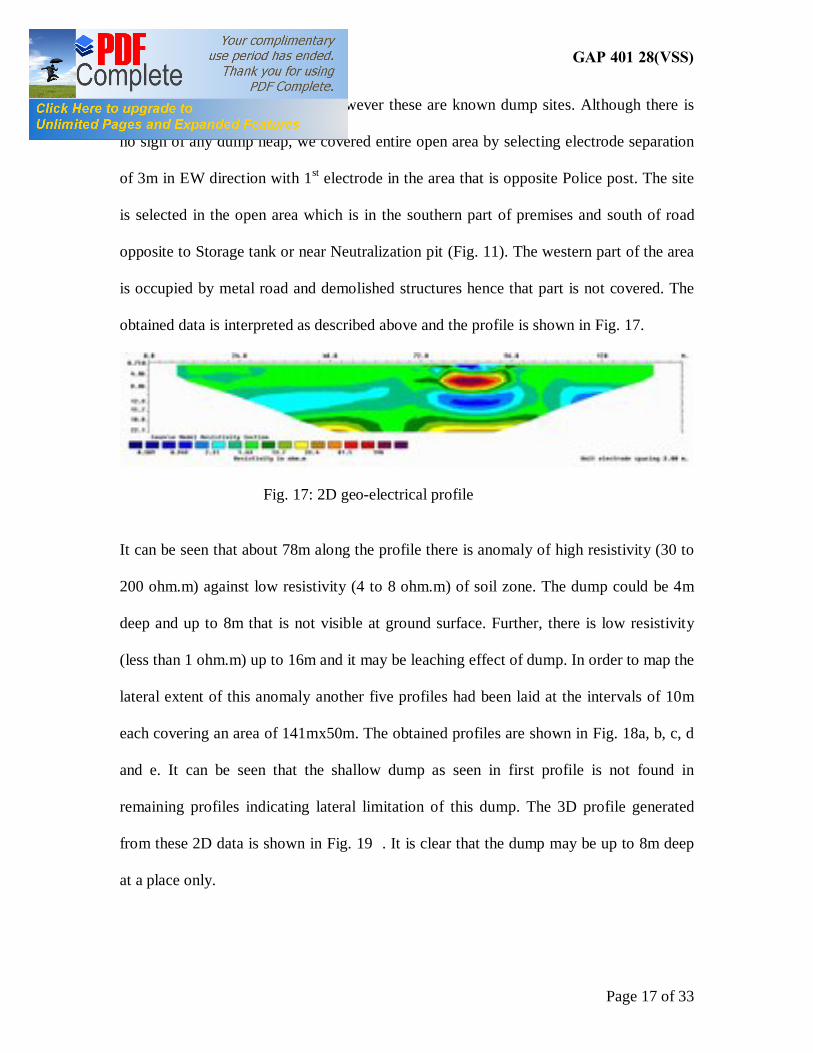
obtained data is interpreted as described above and the profile is shown in Fig. 17.
Fig. 17: 2D geo-electrical profile
It can be seen that about 78m along the profile there is anomaly of high resistivity (30 to
200 ohm.m) against low resistivity (4 to 8 ohm.m) of soil zone. The dump could be 4m
deep and up to 8m that is not visible at ground surface. Further, there is low resistivity
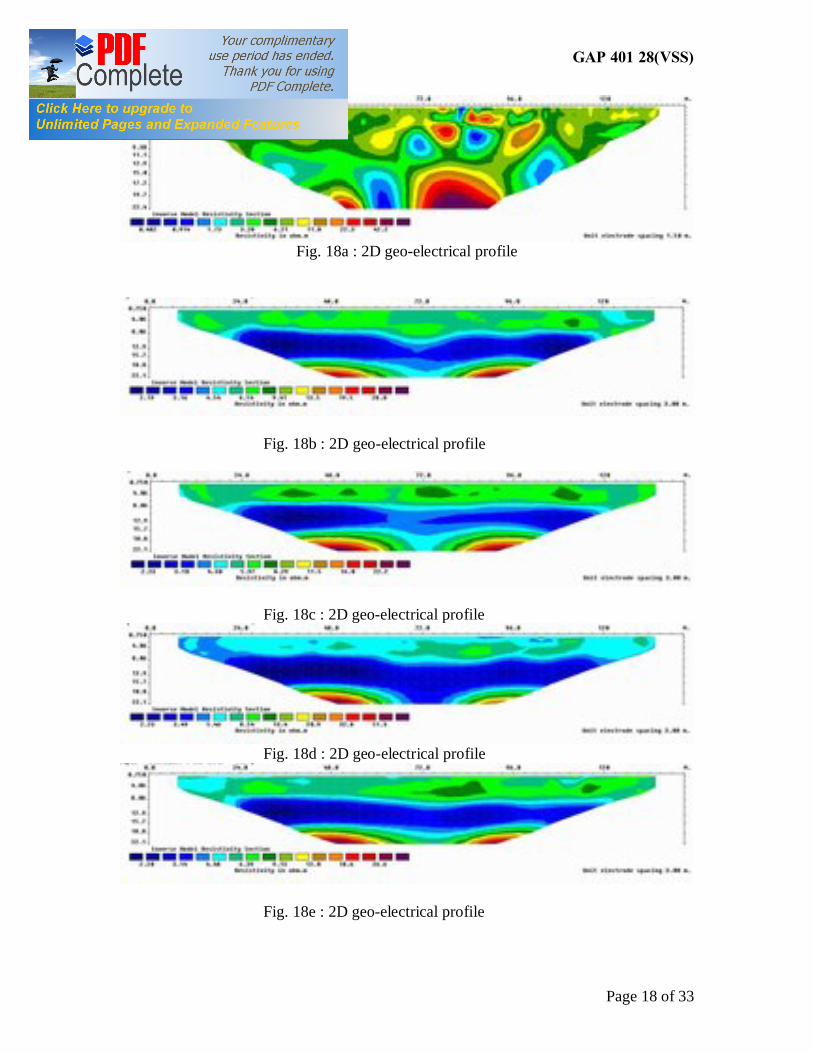
(less than 1 ohm.m) up to 16m and it may be leaching effect of dump. In order to map the
lateral extent of this anomaly another five profiles had been laid at the intervals of 10m
each covering an area of 141mx50m. The obtained profiles are shown in Fig. 18a, b, c, d
and e. It can be seen that the shallow dump as seen in first profile is not found in
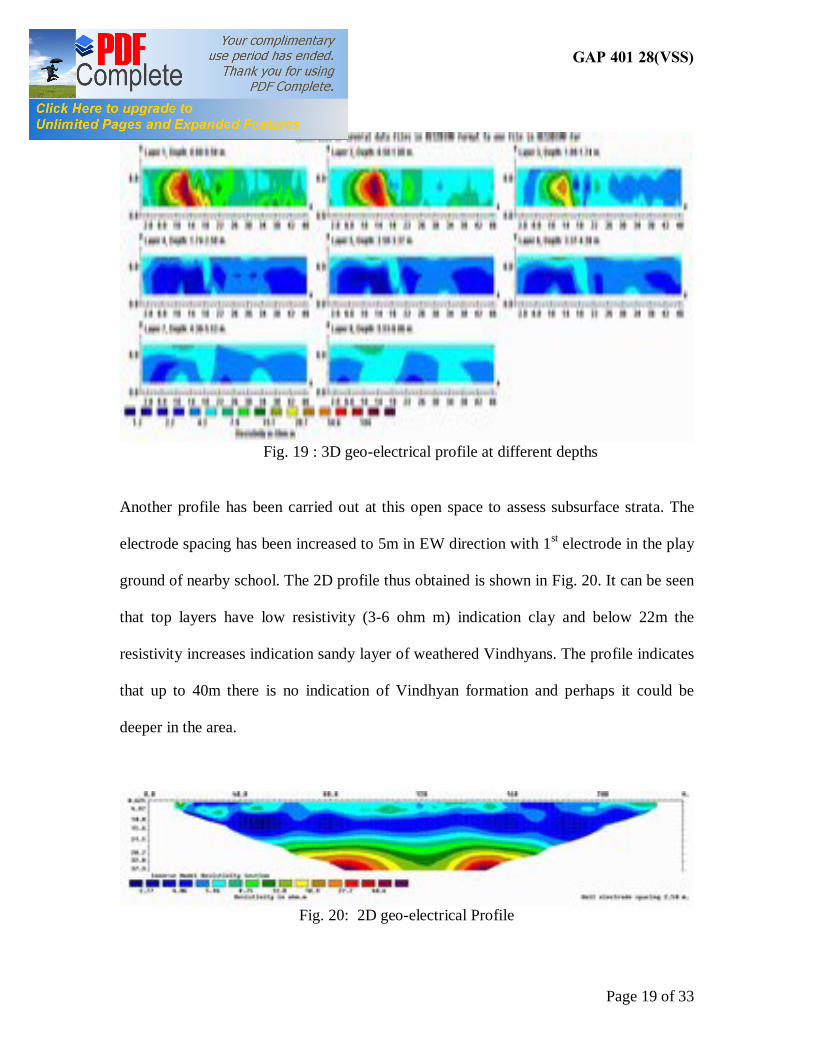
remaining profiles indicating lateral limitation of this dump. The 3D profile generated
from these 2D data is shown in Fig. 19 . It is clear that the dump may be up to 8m deep
at a place only.
UCIL GAP 401 28(VSS)
Page 18 of 33
Fig. 18a : 2D geo-electrical profile
Fig. 18b : 2D geo-electrical profile
Fig. 18c : 2D geo-electrical profile
Fig. 18d : 2D geo-electrical profile
Fig. 18e : 2D geo-electrical profile
UCIL GAP 401 28(VSS)
Page 19 of 33
Fig. 19 : 3D geo-electrical profile at different depths
Another profile has been carried out at this open space to assess subsurface strata. The
electrode spacing has been increased to 5m in EW direction with 1st electrode in the play
ground of nearby school. The 2D profile thus obtained is shown in Fig. 20. It can be seen
that top layers have low resistivity (3-6 ohm m) indication clay and below 22m the
resistivity increases indication sandy layer of weathered Vindhyans. The profile indicates
that up to 40m there is no indication of Vindhyan formation and perhaps it could be
deeper in the area.
Fig. 20: 2D geo-electrical Profile
UCIL GAP 401 28(VSS)
Page 20 of 33
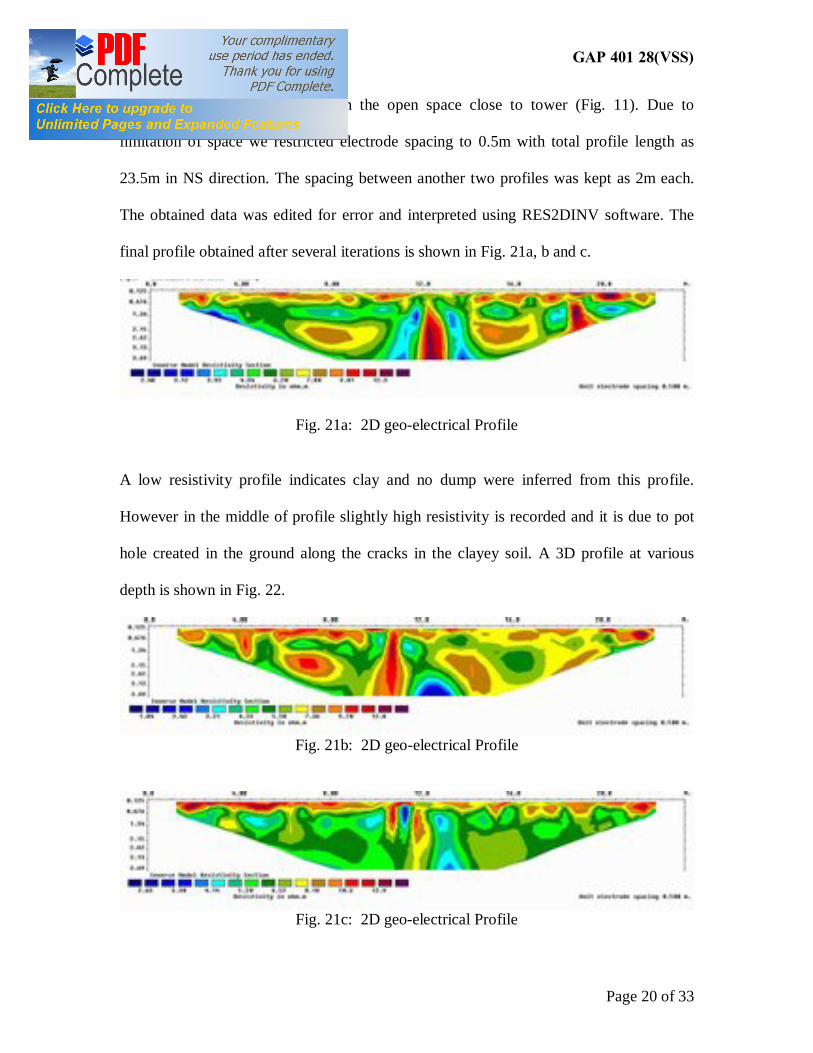
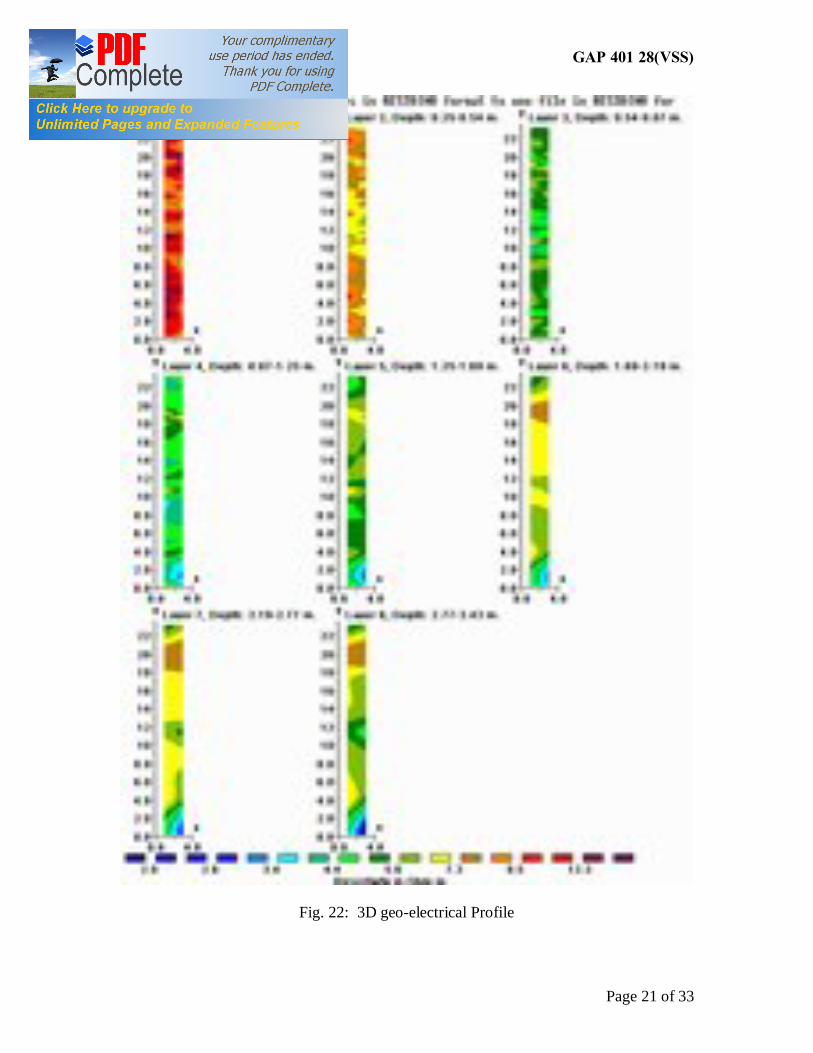
Site IV: The site was selected in the open space close to tower (Fig. 11). Due to
limitation of space we restricted electrode spacing to 0.5m with total profile length as
23.5m in NS direction. The spacing between another two profiles was kept as 2m each.
The obtained data was edited for error and interpreted using RES2DINV software. The
final profile obtained after several iterations is shown in Fig. 21a, b and c.
Fig. 21a: 2D geo-electrical Profile
A low resistivity profile indicates clay and no dump were inferred from this profile.
However in the middle of profile slightly high resistivity is recorded and it is due to pot
hole created in the ground along the cracks in the clayey soil. A 3D profile at various
depth is shown in Fig. 22.
Fig. 21b: 2D geo-electrical Profile
Fig. 21c: 2D geo-electrical Profile
UCIL GAP 401 28(VSS)
Page 21 of 33
Fig. 22: 3D geo-electrical Profile
UCIL GAP 401 28(VSS)
Page 22 of 33
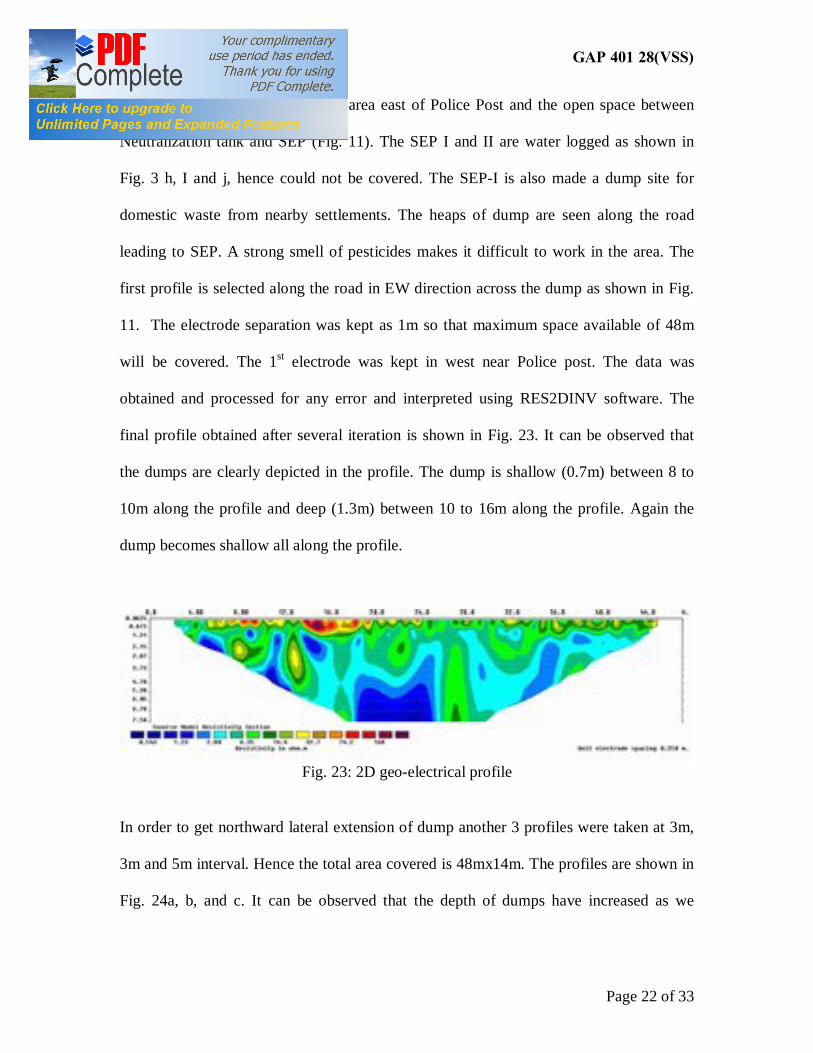
Site V: The site is selected in the area east of Police Post and the open space between
Neutralization tank and SEP (Fig. 11). The SEP I and II are water logged as shown in
Fig. 3 h, I and j, hence could not be covered. The SEP-I is also made a dump site for
domestic waste from nearby settlements. The heaps of dump are seen along the road
leading to SEP. A strong smell of pesticides makes it difficult to work in the area. The
first profile is selected along the road in EW direction across the dump as shown in Fig.
11. The electrode separation was kept as 1m so that maximum space available of 48m
will be covered. The 1st electrode was kept in west near Police post. The data was
obtained and processed for any error and interpreted using RES2DINV software. The
final profile obtained after several iteration is shown in Fig. 23. It can be observed that
the dumps are clearly depicted in the profile. The dump is shallow (0.7m) between 8 to
10m along the profile and deep (1.3m) between 10 to 16m along the profile. Again the
dump becomes shallow all along the profile.
Fig. 23: 2D geo-electrical profile
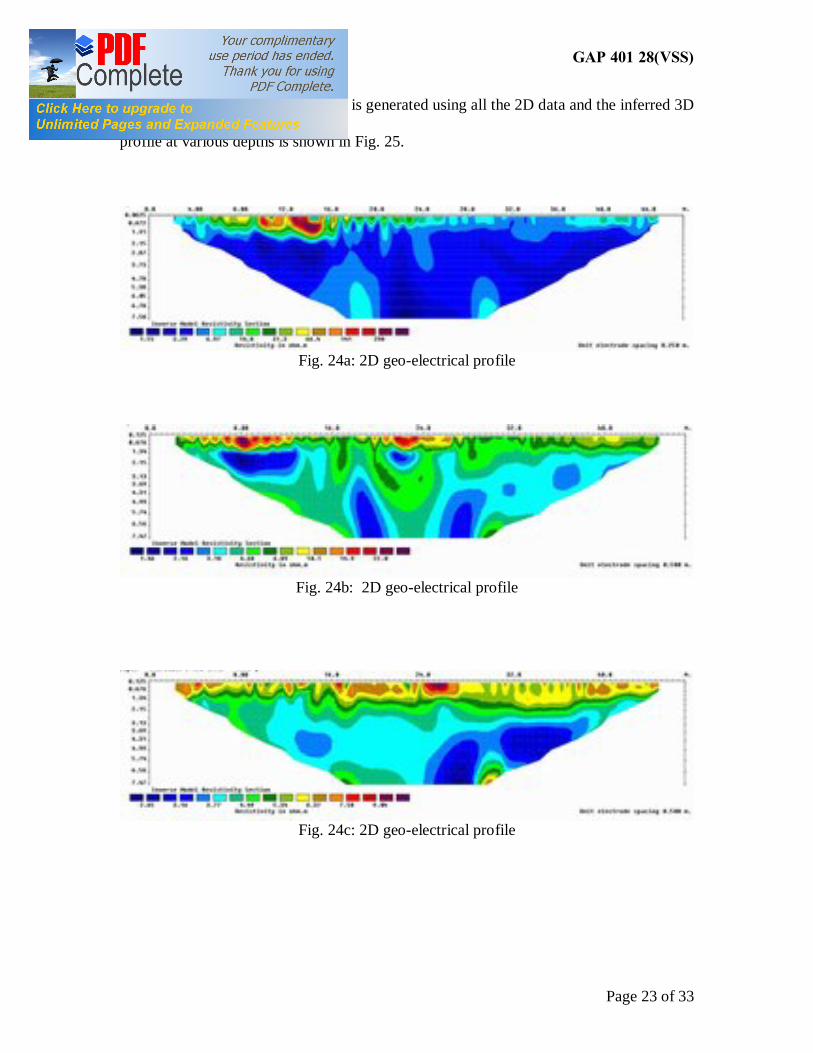
In order to get northward lateral extension of dump another 3 profiles were taken at 3m,
3m and 5m interval. Hence the total area covered is 48mx14m. The profiles are shown in
Fig. 24a, b, and c. It can be observed that the depth of dumps have increased as we
UCIL GAP 401 28(VSS)
Page 23 of 33
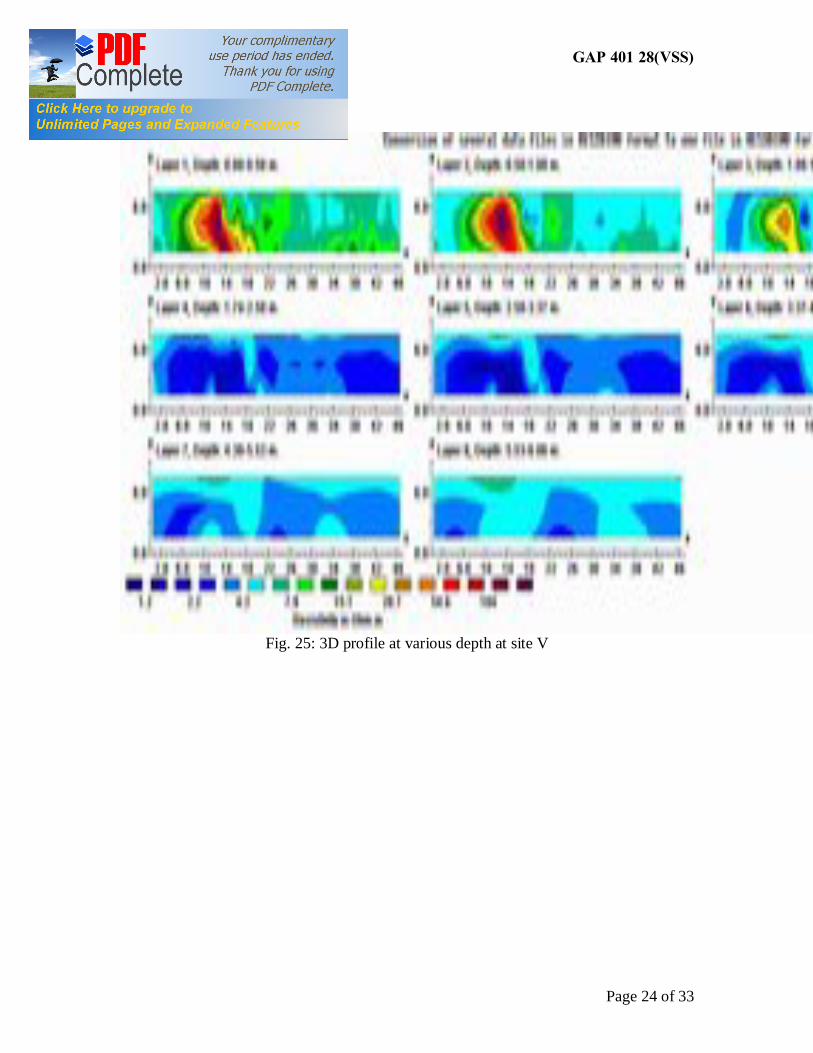
moved 3m northward. A 3D profile is generated using all the 2D data and the inferred 3D
profile at various depths is shown in Fig. 25.
Fig. 24a: 2D geo-electrical profile
Fig. 24b: 2D geo-electrical profile
Fig. 24c: 2D geo-electrical profile
UCIL GAP 401 28(VSS)
Page 24 of 33
Fig. 25: 3D profile at various depth at site V
UCIL GAP 401 28(VSS)
Page 25 of 33
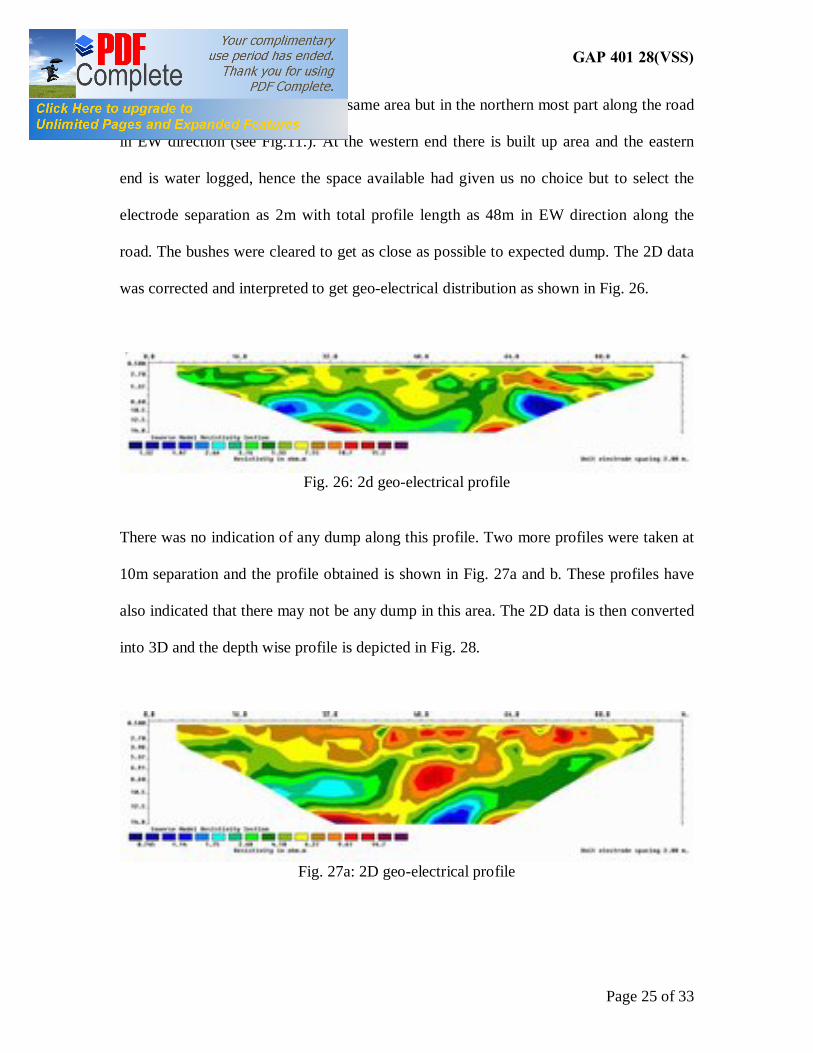
Site VI : The site is selected in the same area but in the northern most part along the road
in EW direction (see Fig.11.). At the western end there is built up area and the eastern
end is water logged, hence the space available had given us no choice but to select the
electrode separation as 2m with total profile length as 48m in EW direction along the
road. The bushes were cleared to get as close as possible to expected dump. The 2D data
was corrected and interpreted to get geo-electrical distribution as shown in Fig. 26.
Fig. 26: 2d geo-electrical profile
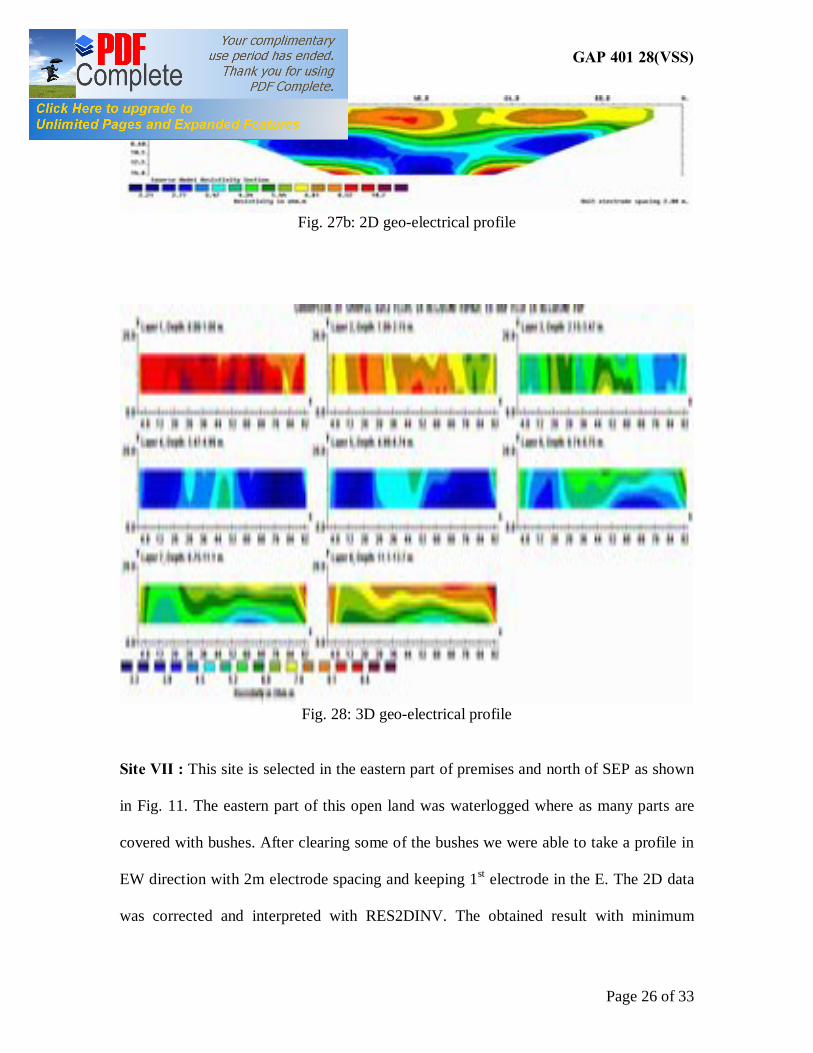
There was no indication of any dump along this profile. Two more profiles were taken at
10m separation and the profile obtained is shown in Fig. 27a and b. These profiles have
also indicated that there may not be any dump in this area. The 2D data is then converted
into 3D and the depth wise profile is depicted in Fig. 28.
Fig. 27a: 2D geo-electrical profile
UCIL GAP 401 28(VSS)
Page 26 of 33
Fig. 27b: 2D geo-electrical profile
Fig. 28: 3D geo-electrical profile
Site VII : This site is selected in the eastern part of premises and north of SEP as shown
in Fig. 11. The eastern part of this open land was waterlogged where as many parts are
covered with bushes. After clearing some of the bushes we were able to take a profile in
EW direction with 2m electrode spacing and keeping 1st electrode in the E. The 2D data
was corrected and interpreted with RES2DINV. The obtained result with minimum
UCIL GAP 401 28(VSS)
Page 27 of 33
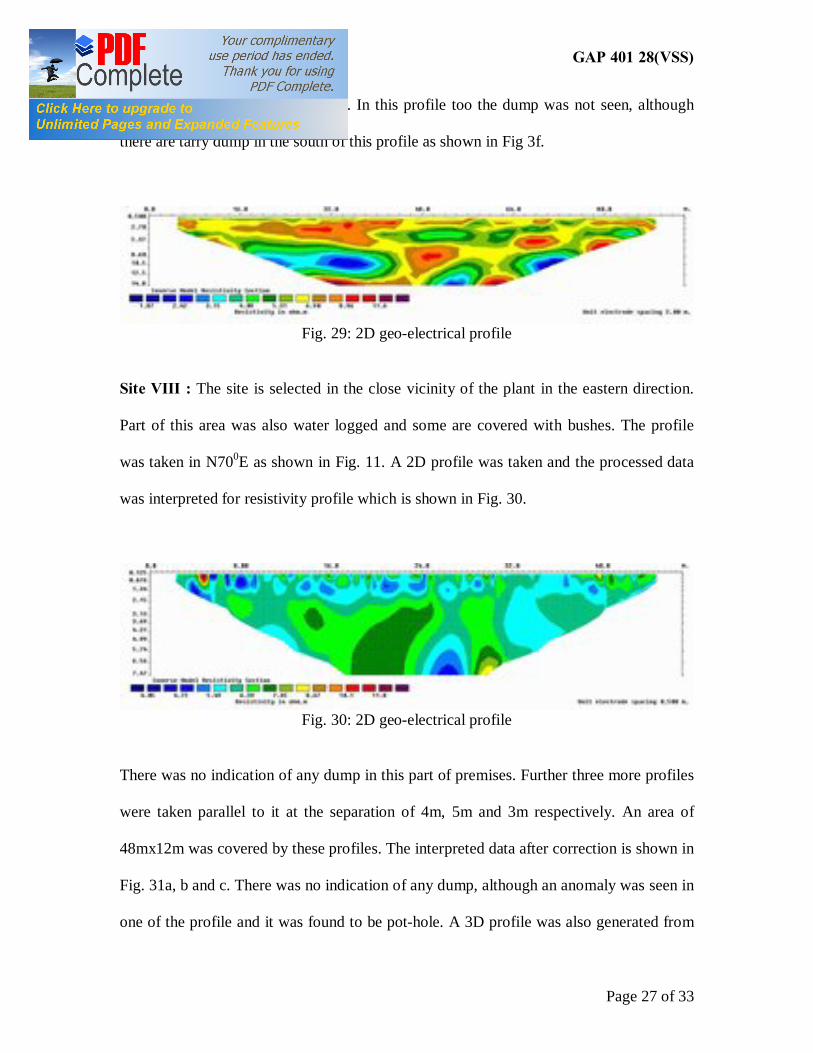
possible error is shown in Fig. 29. In this profile too the dump was not seen, although
there are tarry dump in the south of this profile as shown in Fig 3f.
Fig. 29: 2D geo-electrical profile
Site VIII : The site is selected in the close vicinity of the plant in the eastern direction.
Part of this area was also water logged and some are covered with bushes. The profile
was taken in N700E as shown in Fig. 11. A 2D profile was taken and the processed data
was interpreted for resistivity profile which is shown in Fig. 30.
Fig. 30: 2D geo-electrical profile
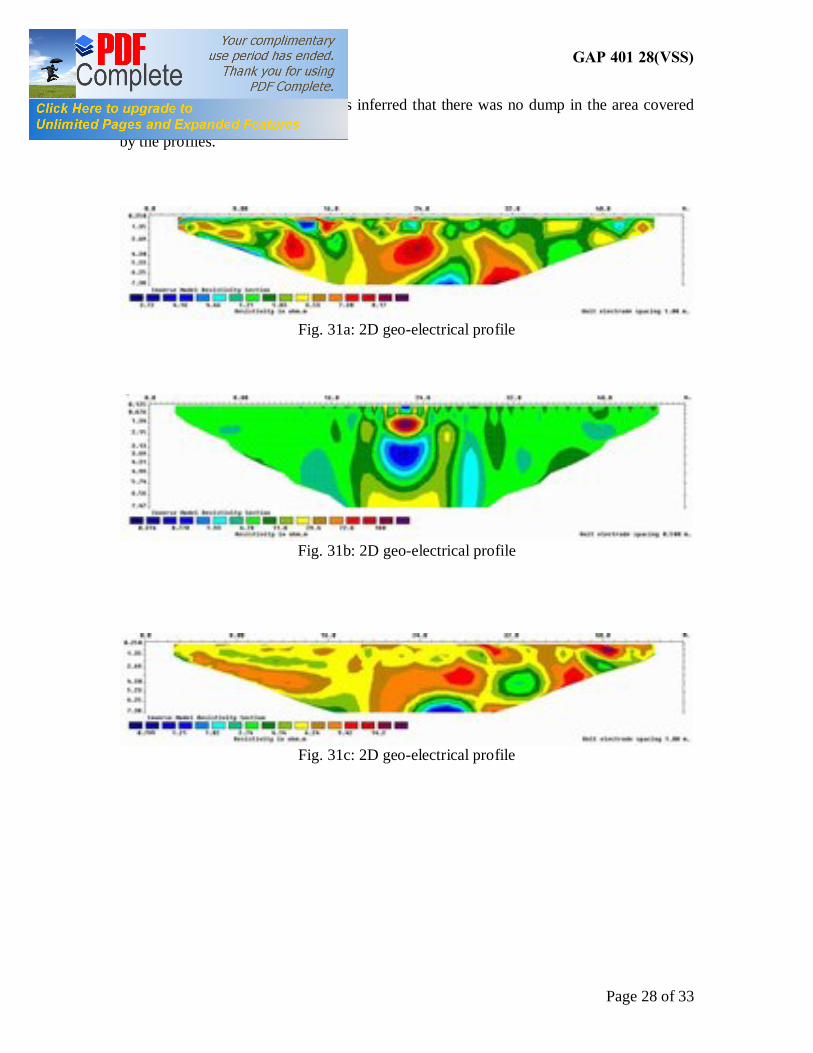
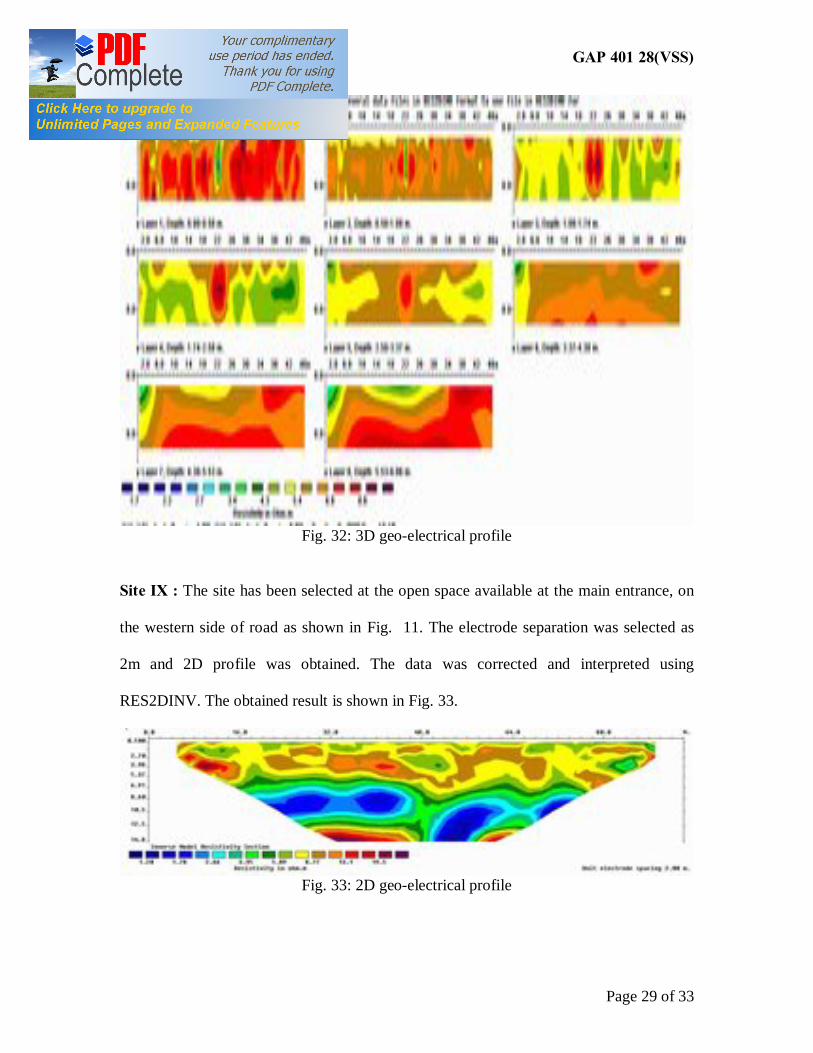
There was no indication of any dump in this part of premises. Further three more profiles
were taken parallel to it at the separation of 4m, 5m and 3m respectively. An area of
48mx12m was covered by these profiles. The interpreted data after correction is shown in
Fig. 31a, b and c. There was no indication of any dump, although an anomaly was seen in
one of the profile and it was found to be pot-hole. A 3D profile was also generated from
UCIL GAP 401 28(VSS)
Page 28 of 33
these data as shown in Fig. 32. It is inferred that there was no dump in the area covered
by the profiles.
Fig. 31a: 2D geo-electrical profile
Fig. 31b: 2D geo-electrical profile
Fig. 31c: 2D geo-electrical profile
UCIL GAP 401 28(VSS)
Page 29 of 33
Fig. 32: 3D geo-electrical profile
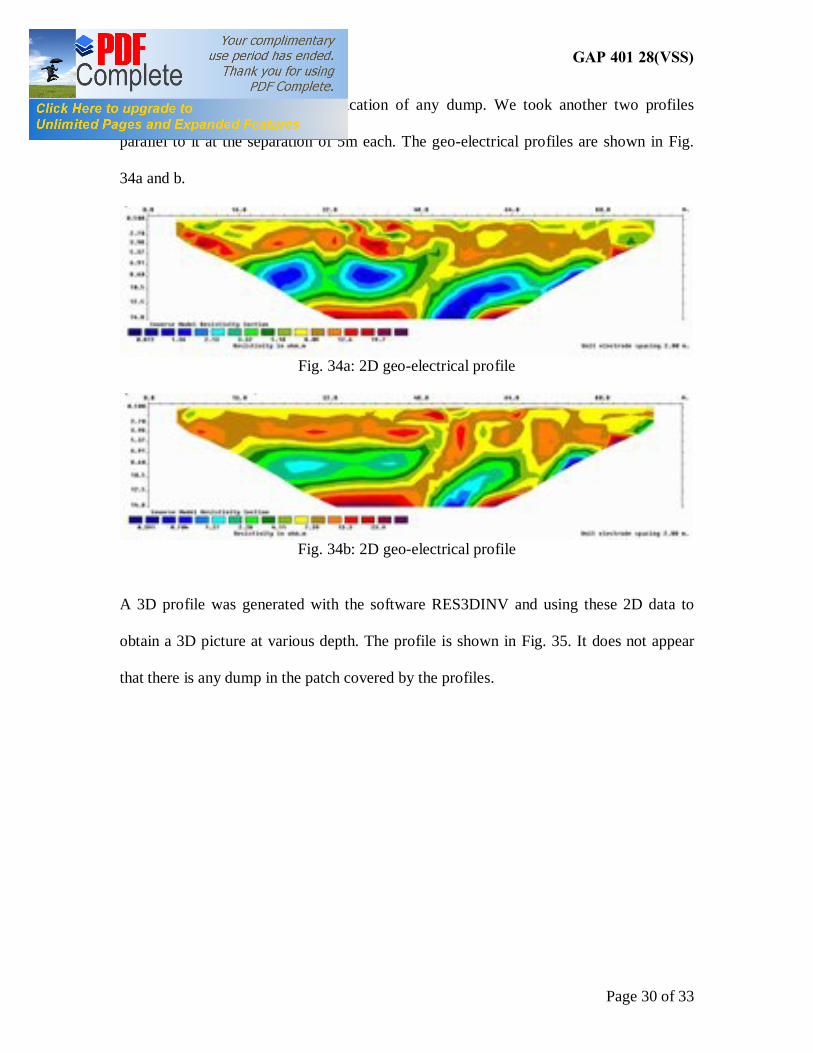
Site IX : The site has been selected at the open space available at the main entrance, on
the western side of road as shown in Fig. 11. The electrode separation was selected as
2m and 2D profile was obtained. The data was corrected and interpreted using
RES2DINV. The obtained result is shown in Fig. 33.
Fig. 33: 2D geo-electrical profile
UCIL GAP 401 28(VSS)
Page 30 of 33
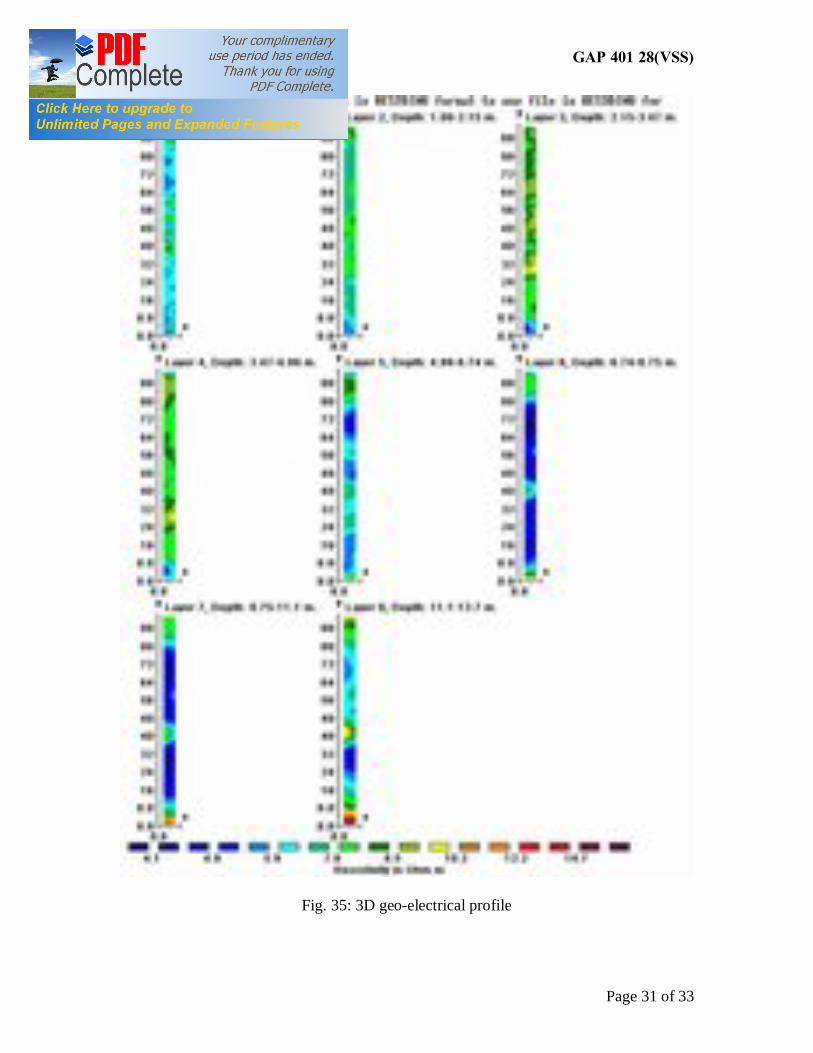
At this site too there was no indication of any dump. We took another two profiles
parallel to it at the separation of 5m each. The geo-electrical profiles are shown in Fig.
34a and b.
Fig. 34a: 2D geo-electrical profile
Fig. 34b: 2D geo-electrical profile
A 3D profile was generated with the software RES3DINV and using these 2D data to
obtain a 3D picture at various depth. The profile is shown in Fig. 35. It does not appear
that there is any dump in the patch covered by the profiles.
UCIL GAP 401 28(VSS)
Page 31 of 33
Fig. 35: 3D geo-electrical profile
UCIL GAP 401 28(VSS)
Page 32 of 33
Conclusions :
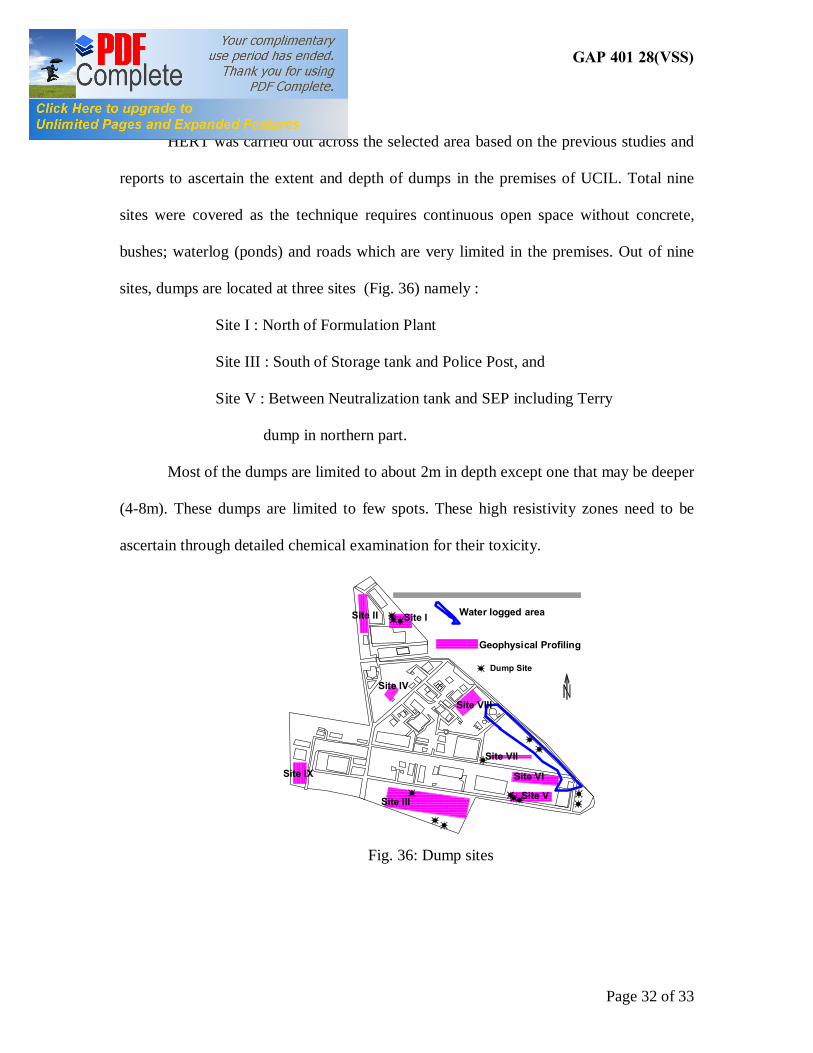
HERT was carried out across the selected area based on the previous studies and
reports to ascertain the extent and depth of dumps in the premises of UCIL. Total nine
sites were covered as the technique requires continuous open space without concrete,
bushes; waterlog (ponds) and roads which are very limited in the premises. Out of nine
sites, dumps are located at three sites (Fig. 36) namely :
Site I : North of Formulation Plant
Site III : South of Storage tank and Police Post, and
Site V : Between Neutralization tank and SEP including Terry
dump in northern part.
Most of the dumps are limited to about 2m in depth except one that may be deeper
(4-8m). These dumps are limited to few spots. These high resistivity zones need to be
ascertain through detailed chemical examination for their toxicity.
Geophysical Profiling
Water logged areaSite ISite II
Site III Site V
Site VI
Site VII
Site IV
Site VIII
Site IX
Dump Site
Fig. 36: Dump sites
UCIL GAP 401 28(VSS)
Page 33 of 33
Acknowledgement: BGRD has financed the investigation and officials from BGRD have
helped during the investigations. Director NGRI has encouraged carrying out
investigations. Authors are thankful to them.
References:
Burmeier H, J. Exner and F. Schenker, 2005, Technical Assessment of Remediation Technologies for the clean up of the former Union Carbide site in Bhopal, India, Green Peace International Report, pp.64 Dahlin T and Zhou B (2002) Gradient and Mid-point referred measurements for multichannel 2D resistivity imaging, Proc. 8th Meeting Envir. & Engg. Geophysics, Aveiro, Portugal, 8-12 Sept., pp 157-160. Jain, S. C, NSK Murthy, BA Prakash and CP Gupta, 1994, Geoelectrical investigations within premises of Union Carbide India Limited, Bhopal, NGRI Tech. Rept. No. NGRI-91-GW-166, pp. 38 NEERI, 1996, Assessment of Contaminated Areas due to past waste Disposal Practices at EIIL, Bhopal RES2DINV, 2005, RES2DINV ver. 3.55 for Windows 98/Me/2000/NT/XP, Rapid 2-D Resistivity & IP inversion using the least-squares method, GEOTOMO SOFTWARE, MALAYSIA RES3DINV, 2008, RES3DINV ver. 2.16 for Windows 98/Me/2000/NT/XP/Vista Rapid 3D Resistivity & IP inversion using the least-squares method (For 3-D surveys using the pole-pole, pole-dipole, dipole-dipole, rectangular, Wenner, Wenner- Schlumberger and non-conventional arrays) On land, underwater and borehole surveys Geoelectrical Imaging 2D & 3D, GEOTOMO SOFTWARE, MALAYSIA