geophysical monograph series...geophysical monograph series 175 a continental plate boundary:...
TRANSCRIPT


Geophysical Monograph Series

Geophysical Monograph Series
175 A Continental Plate Boundary: Tectonics at South Island, New Zealand David Okaya, Tim Stem, and Fred Davey (Eds.)
176 Exploring Venus as a Terrestrial Planet Larry W. Esposito, Ellen R. Stofan, and Thomas E. Cravens (Eds.)
177 Ocean Modeling in an Eddying Regime Matthew Hecht and Hiroyasu Hasumi (Eds.)
178 Magma to Microbe: Modeling Hydrothermal Processes at Oceanic Spreading Centers Robert P. Lowell, Jeffrey S. Seewald, Anna Metaxas, and Michael R. Perfit (Eds.)
179 Active Tectonics and Seismic Potential of Alaska Jeffrey T. Freymueller, Peter J. Haeussler, Robert L. Wesson, and Göran Ekström (Eds.)
180 Arctic Sea Ice Decline: Observations, Projections, Mechanisms, and Implications Eric T. DeWeaver, Cecilia M. Bitz, and L.-Bruno Tremblay (Eds.)
181 Midlatitude Ionospheric Dynamics and Disturbances Paul M. Kintner, Jr., Anthea J. Coster, Tim Fuller-Rowell, Anthony J. Mannucci, Michael Mendillo, and Roderick Heelis (Eds.)
182 The Stromboli Volcano: An Integrated Study of the 2002–2003 Eruption Sonia Calvari, Salvatore Inguaggiato, Giuseppe Puglisi, Maurizio Ripepe, and Mauro Rosi (Eds.)
183 Carbon Sequestration and Its Role in the Global Carbon Cycle Brian J. McPherson and Eric T. Sundquist (Eds.)
184 Carbon Cycling in Northern Peatlands Andrew J. Baird, Lisa R. Belyea, Xavier Comas, A. S. Reeve, and Lee D. Slater (Eds.)
185 Indian Ocean Biogeochemical Processes and Ecological Variability Jerry D. Wiggert, Raleigh R. Hood, S. Wajih A. Naqvi, Kenneth H. Brink, and Sharon L. Smith (Eds.)
186 Amazonia and Global Change Michael Keller, Mercedes Bustamante, John Gash, and Pedro Silva Dias (Eds.)
187 Surface Ocean–Lower Atmosphere Processes Corinne Le Quèrè and Eric S. Saltzman (Eds.)
188 Diversity of Hydrothermal Systems on Slow Spreading Ocean Ridges Peter A. Rona, Colin W. Devey, Jérôme Dyment, and Bramley J. Murton (Eds.)
189 Climate Dynamics: Why Does Climate Vary? De-Zheng Sun and Frank Bryan (Eds.)
190 The Stratosphere: Dynamics, Transport, and Chemistry L. M. Polvani, A. H. Sobel, and D. W. Waugh (Eds.)
191 Rainfall: State of the Science Firat Y. Testik and Mekonnen Gebremichael (Eds.)
192 Antarctic Subglacial Aquatic Environments Martin J. Siegert, Mahlon C. Kennicut II, and Robert A. Bindschadler
193 Abrupt Climate Change: Mechanisms, Patterns, and Impacts Harunur Rashid, Leonid Polyak, and Ellen Mosley-Thompson (Eds.)
194 Stream Restoration in Dynamic Fluvial Systems: Scientific Approaches, Analyses, and Tools Andrew Simon, Sean J. Bennett, and Janine M. Castro (Eds.)
195 Monitoring and Modeling the Deepwater Horizon Oil Spill: A Record-Breaking Enterprise Yonggang Liu, Amy MacFadyen, Zhen-Gang Ji, and Robert H. Weisberg (Eds.)
196 Extreme Events and Natural Hazards: The Complexity Perspective A. Surjalal Sharma, Armin Bunde, Vijay P. Dimri, and Daniel N. Baker (Eds.)
197 Auroral Phenomenology and Magnetospheric Processes: Earth and Other Planets Andreas Keiling, Eric Donovan, Fran Bagenal, and Tomas Karlsson (Eds.)
198 Climates, Landscapes, and Civilizations Liviu Giosan, Dorian Q. Fuller, Kathleen Nicoll, Rowan K. Flad, and Peter D. Clift (Eds.)
199 Dynamics of the Earth’s Radiation Belts and Inner Magnetosphere Danny Summers, Ian R. Mann, Daniel N. Baker, and Michael Schulz (Eds.)
200 Lagrangian Modeling of the Atmosphere John Lin (Ed.)201 Modeling the Ionosphere-Thermosphere Jospeh D. Huba,
Robert W. Schunk, and George V Khazanov (Eds.)202 The Mediterranean Sea: Temporal Variability and Spatial
Patterns Gian Luca Eusebi Borzelli, Miroslav Gacic, Piero Lionello, and Paola Malanotte-Rizzoli (Eds.)
203 Future Earth - Advancing Civic Understanding of the Anthropocene Diana Dalbotten, Gillian Roehrig, and Patrick Hamilton (Eds.)
204 The Galápagos: A Natural Laboratory for the Earth Sciences Karen S. Harpp, Eric Mittelstaedt, Noémi d’Ozouville, and David W. Graham (Eds.)
205 Modeling Atmospheric and Oceanic Flows: Insightsfrom Laboratory Experiments and Numerical Simulations Thomas von Larcher and Paul D. Williams (Eds.)
206 Remote Sensing of the Terrestrial Water Cycle Venkat Lakshmi (Eds.)
207 Magnetotails in the Solar System Andreas Keiling, Caitríona Jackman, and Peter Delamere (Eds.)
208 Hawaiian Volcanoes: From Source to Surface Rebecca Carey, Valerie Cayol, Michael Poland, and Dominique Weis (Eds.)
209 Sea Ice: Physics, Mechanics, and Remote Sensing Mohammed Shokr and Nirmal Sinha (Eds.)
210 Fluid Dynamics in Complex Fractured-Porous Systems Boris Faybishenko, Sally M. Benson, and John E. Gale (Eds.)
211 Subduction Dynamics: From Mantle Flow to Mega Disasters Gabriele Morra, David A. Yuen, Scott King, Sang Mook Lee, and Seth Stein (Eds.)
212 The Early Earth: Accretion and Differentiation James Badro and Michael Walter (Eds.)
213 Global Vegetation Dynamics: Concepts and Applications in the MC1 Model Dominique Bachelet and David Turner (Eds.)
214 Extreme Events: Observations, Modeling and Economics Mario Chavez, Michael Ghil, and Jaime Urrutia-Fucugauchi (Eds.)
215 Auroral Dynamics and Space Weather Yongliang Zhang and Larry Paxton (Eds.)
216 Low‐Frequency Waves in Space Plasmas Andreas Keiling, Dong‐Hun Lee, and Valery Nakariakov (Eds.)
217 Deep Earth: Physics and Chemistry of the Lower Mantle and Core Hidenori Terasaki and Rebecca A. Fischer (Eds.)
218 Integrated Imaging of the Earth: Theory and Applications Max Moorkamp, Peter G. Lelievre, Niklas Linde, and Amir Khan (Eds.)
219 Plate Boundaries and Natural Hazards Joao Duarte and Wouter Schellart (Eds.)
220 Ionospheric Space Weather: Longitude and Hemispheric Dependences and Lower Atmosphere Forcing Timothy Fuller-Rowell, Endawoke Yizengaw, Patricia H. Doherty, and Sunanda Basu (Eds.)
221 Terrestrial Water Cycle and Climate Change: Natural and Human-Induced Impacts Qiuhong Tang and Taikan Oki (Eds.)
222 Magnetosphere-Ionosphere Coupling in the Solar System Charles R. Chappell, Robert W. Schunk, Peter M. Banks, James L. Burch, and Richard M. Thorne (Eds.)
223 Natural Hazard Uncertainty Assessment: Modeling and Decision Support Karin Riley, Peter Webley, and Matthew Thompson (Eds.)
224 Hydrodynamics of Time-Periodic Groundwater Flow: Diffusion Waves in Porous Media Joe S. Depner and Todd C. Rasmussen (Eds.)
225 Active Global Seismology Ibrahim Cemen and Yucel Yilmaz (Eds.)

Geophysical Monograph 226
Climate ExtremesPatterns and Mechanisms
S.‐Y. Simon WangJin‐Ho Yoon
Christopher C. FunkRobert R. Gillies
Editors
This Work is a copublication of the American Geophysical Union and John Wiley and Sons, Inc.

This Work is a co‐publication between the American Geophysical Union and John Wiley & Sons, Inc.
This edition first published 2017 by John Wiley & Sons, Inc., 111 River Street, Hoboken, NJ 07030, USA and the American Geophysical Union, 2000 Florida Avenue, N.W., Washington, D.C. 20009
© 2017 the American Geophysical Union
All rights reserved. No part of this publication may be reproduced, stored in a retrieval system, or transmitted, in any form or by any means, electronic, mechanical, photocopying, recording, or otherwise, except as permitted by law. Advice on how to obtain permission to reuse material from this title is available at http://www.wiley.com/go/permissions.
Published under the aegis of the AGU Publications CommitteeBrooks Hanson, Director of PublicationsRobert van der Hilst, Chair, Publications CommitteeFor details about the American Geophysical Union visit us at www.agu.org.
Wiley Global Headquarters111 River Street, Hoboken, NJ 07030, USA
For details of our global editorial offices, customer services, and more information about Wiley products visit us at www.wiley.com.
Limit of Liability/Disclaimer of WarrantyWhile the publisher and authors have used their best efforts in preparing this work, they make no representations or warranties with respect to the accuracy or completeness of the contents of this work and specifically disclaim all warranties, including without limitation any implied warranties of merchantability or fitness for a particular purpose. No warranty may be created or extended by sales representatives, written sales materials, or promotional statements for this work. The fact that an organization, website, or product is referred to in this work as a citation and/or potential source of further information does not mean that the publisher and authors endorse the information or services the organization, website, or product may provide or recommendations it may make. This work is sold with the understanding that the publisher is not engaged in rendering professional services. The advice and strategies contained herein may not be suitable for your situation. You should consult with a specialist where appropriate. Neither the publisher nor authors shall be liable for any loss of profit or any other commercial damages, including but not limited to special, incidental, consequential, or other damages. Further, readers should be aware that websites listed in this work may have changed or disappeared between when this work was written and when it is read.
Library of Congress Cataloging‐in‐Publication data is available
ISBN: 9781119067849
Cover image: Earth Globe Image Credit: NASA JPLCover design by Wiley
Set in 10/12pt Times New Roman by SPi Global, Pondicherry, India
10 9 8 7 6 5 4 3 2 1

v
Contributors ���������������������������������������������������������������������������������������������������������������������������������������������������������vii
Preface ������������������������������������������������������������������������������������������������������������������������������������������������������������������xi
Acknowledgments �����������������������������������������������������������������������������������������������������������������������������������������������xiii
Part I: Forcings of Climate Extremes
1 The Changing El Niño–Southern Oscillation and Associated Climate ExtremesJin‐Yi Yu, Xin Wang, Song Yang, Houk Paek, and Mengyan Chen......................................................................3
2 Weather Extremes Linked to Interaction of the Arctic and MidlatitudesTimo Vihma ..................................................................................................................................................39
3 Impact of Aerosols on Regional Changes in Climate ExtremesJana Sillmann and Jinho Yoon ........................................................................................................................51
4 Weakened Flow, Persistent Circulation, and Prolonged Weather Extremes in Boreal SummerDim Coumou, Kai Kornhuber, Jascha Lehmann, and Vladimir Petoukhov .......................................................61
5 Land Processes as the Forcing of Extremes: A ReviewMin‐Hui Lo, Tzu‐Hsien Kuo, Hao‐Wei Wey, Chia‐Wei Lan, and Jen‐Ping Chen ................................................75
Part II: Processes of Climate Extremes
6 Timing of Anthropogenic Emergence in Climate ExtremesAndrew D. King, Markus G. Donat, Ed Hawkins, and David J. Karoly ............................................................95
7 Recent Increases in Extreme Temperature Occurrence over LandScott J. Weaver, Arun Kumar, and Mingyue Chen .........................................................................................105
8 Why Future Shifts in Tropical Precipitation Will Likely Be Small: The Location of the Tropical Rain Belt and the Hemispheric Contrast of Energy Input to the AtmosphereAaron Donohoe and Aiko Voigt ..................................................................................................................115
9 Weather‐Climate Interactions and MJO InfluencesPaul E. Roundy, Naoko Sakaeda, Kyle MacRitchie, and Lawrence Gloeckler ................................................139
10 Recent Climate Extremes Associated with the West Pacific Warming ModeChris Funk and Andrew Hoell .....................................................................................................................165
11 Connections Between Heat Waves and Circumglobal Teleconnection Patterns in the Northern Hemisphere SummerHaiyan Teng and Grant Branstator ..............................................................................................................177
Part III: Regional Climate Extremes
12 North American Drought and Links to Northern Eurasia: The Role of Stationary Rossby WavesHailan Wang, Siegfried D. Schubert, and Randal D. Koster ..........................................................................197
13 The California Drought: Trends and ImpactsShih‐Yu (Simon) Wang, Jinho Yoon, Robert R. Gillies, and Huang‐Hsiung Hsu .............................................223
CONTENTS

vi Contents
14 Observed Trends in US Tornado FrequencyAdam J. Clark ..............................................................................................................................................237
15 Mechanisms Explaining Recent Changes in Australian Climate ExtremesSophie C. Lewis, David J. Karoly, Andrew D. King, Sarah E. Perkins, and Markus G. Donat ...........................249
16 Unraveling East Africa’s Climate ParadoxBradfield Lyon and Nicolas Vigaud ..............................................................................................................265
17 A Physical Model for Extreme Drought over Southwest AsiaAndrew Hoell, Chris Funk, Mathew Barlow, and Forest Cannon ..................................................................283
Part IV: Prediction of Climate Extremes
18 Extratropical Precursors of the El Niño–Southern OscillationKathy V. Pegion and Christopher Selman .....................................................................................................301
19 North Atlantic Seasonal Hurricane Prediction: Underlying Science and an Evaluation of Statistical ModelsPhilip J. Klotzbach, Mark A. Saunders, Gerald D. Bell, and Eric S. Blake .......................................................315
20 Predicting Subseasonal Precipitation Variations Based on the Madden‐Julian OscillationCharles Jones ..............................................................................................................................................329
21 Prediction of Short‐Term Climate Extremes with a Multimodel EnsembleEmily J. Becker ............................................................................................................................................347
22 Toward Predicting US Tornadoes in the Late 21st CenturyAdam J. Clark ..............................................................................................................................................361
Index ������������������������������������������������������������������������������������������������������������������������������������������������������������������371

vii
Mathew BarlowUniversity of Massachusetts LowellEnvironmental Earth and Atmospheric SciencesLowell, Massachusetts, USA
Emily J. BeckerClimate Prediction Center/NOAA and INNOVIM LLCCollege Park, Maryland, USA
Gerald D. BellClimate Prediction CenterNOAA/NWS/NCEPCollege Park, Maryland, USA
Eric S. BlakeNational Hurricane CenterNational Oceanic and Atmospheric Administration Miami, Florida, USA
Grant BranstatorNational Center for Atmospheric ResearchBoulder, Colorado, USA
Forest CannonUniversity of California Santa BarbaraGeographySanta Barbara, California, USA
Jen‐Ping ChenDepartment of Atmospheric SciencesNational Taiwan UniversityTaipei, Taiwan
Mengyan ChenState Key Laboratory of Tropical OceanographySouth China Sea Institute of OceanologyChinese Academy of SciencesGuangzhou, Guangdong, China
Mingyue ChenNOAA/NWS/NCEP Climate Prediction CenterCollege Park, Maryland, USA
Adam J. ClarkNOAA/OAR National Severe Storms LaboratoryNorman, Oklahoma, USA
Dim CoumouInstitute for Environmental Studies (IVM)Department of Water and Climate RiskVU University Amsterdam, Amsterdam, The Netherlands; andPotsdam Institute for Climate Impact ResearchEarth System AnalysisPotsdam, Germany
Markus G. DonatARC Centre of Excellence for Climate System ScienceClimate Change Research CentreUniversity of New South WalesSydney, NSW, Australia
Aaron DonohoeKarlsruhe Institute of TechnologyInstitute of Meteorology and Climate Research Department Troposphere ResearchKarlsruhe,Germany; andLamont-Doherty Earth ObservatoryColumbia UniversityNew York, NY, USA
Chris FunkUS Geological Survey andUniversity of California Santa BarbaraGeographySanta Barbara, California, USA
Robert R. GilliesUtah Climate Center, Utah State UniversityLogan, Utah, USA; and Department of Plants,Soils, and Climate, Utah State UniversityLogan, Utah, USA
Lawrence GloecklerDepartment of Atmospheric and Environmental SciencesUniversity at AlbanyAlbany, New York, USA
Ed HawkinsNational Centre for Atmospheric ScienceDepartment of MeteorologyUniversity of ReadingReading, UK
CONTRIBUTORS

viii CONTRIBUTORS
Andrew HoellNOAA Earth System Research LaboratoryPhysical Sciences DivisionBoulder, Colorado, USA
Huang‐Hsiung HsuResearch Center for Environmental ChangesAcademia Sinica, Taipei, Taiwan
Charles JonesDepartment of Geography and Earth Research InstituteUniversity of California Santa BarbaraSanta Barbara, California, USA
David J. KarolyARC Centre of Excellence for Climate System ScienceSchool of Earth ScienceUniversity of MelbourneMelbourne, Australia
Andrew D. KingARC Centre of Excellence for Climate System ScienceSchool of Earth ScienceUniversity of MelbourneMelbourne, Australia
Philip J. KlotzbachDepartment of Atmospheric ScienceColorado State UniversityFort Collins, Colorado, USA
Kai KornhuberPotsdam Institute for Climate Impact ResearchEarth System AnalysisUniversity of PotsdamFaculty of SciencePotsdam, Germany
Randal D. KosterNASA Goddard Space Flight CenterGlobal Modeling and Assimilation OfficeGreenbelt, Maryland, USA
Arun KumarNOAA/NWS/NCEP Climate Prediction CenterCollege Park, Maryland, USA
Tzu‐Hsien KuoDepartment of Atmospheric SciencesNational Taiwan UniversityTaipei, Taiwan
Chia‐Wei LanDepartment of Atmospheric SciencesNational Taiwan UniversityTaipei, Taiwan
Jascha LehmannPotsdam Institute for Climate Impact ResearchEarth System AnalysisUniversity of PotsdamFaculty of SciencePotsdam, Germany
Sophie C. LewisARC Centre of Excellence for Climate System ScienceFenner School of Environment and SocietyThe Australian National UniversityActon, Australia
Min‐Hui LoDepartment of Atmospheric SciencesNational Taiwan UniversityTaipei, Taiwan
Bradfield LyonSchool of Earth and Climate Sciences and Climate Change InstituteUniversity of MaineOrono, Maine, USA
Kyle MacRitchieNASA Goddard Space Flight Center, GES‐DISCGreenbelt, Maryland, USA
Houk PaekDepartment of Earth System ScienceUniversity of CaliforniaIrvine, California, USA
Kathy V. PegionDepartment of Atmospheric, Oceanic, and Earth Sciences and Center for Ocean‐Land‐Atmosphere StudiesGeorge Mason UniversityFairfax, Virginia, USA
Sarah E. PerkinsARC Centre of Excellence for Climate System ScienceClimate Change Research CentreUniversity of New South WalesSydney, NSW, Australia

CONTRIBUTORS ix
Vladimir PetoukhovInstitute for Environmental Studies (IVM)Department of Water and Climate RiskVU University AmsterdamAmsterdam,The Netherlands; andPotsdam Institute for Climate Impact ResearchEarth System AnalysisPotsdam, Germany
Paul E. RoundyDepartment of Atmospheric and Environmental SciencesUniversity at AlbanyAlbany, New York, USA
Naoko SakaedaNOAA Earth System Research LaboratoryPhysical Sciences DivisionBoulder, Colorado, USA
Mark A. SaundersDepartment of Space and Climate PhysicsUniversity College LondonHolmbury St. MaryDorking, Surrey, UK
Siegfried D. SchubertNASA Goddard Space Flight CenterGlobal Modeling and Assimilation OfficeGreenbelt, Maryland, USA
Christopher SelmanDepartment of Atmospheric, Oceanic, and Earth Sciences and Center for Ocean‐Land‐Atmosphere StudiesGeorge Mason UniversityFairfax, Virginia, USA
Jana SillmannCenter for International Climate andEnvironmental Research, OsloCicero Senter for KlimaforskningOslo, Norway
Haiyan TengNational Center for Atmospheric ResearchBoulder, Colorado, USA
Nicolas VigaudInternational Research Institute for Climate and SocietyThe Earth Institute, Columbia UniversityPalisades, New York, USA
Timo VihmaFinnish Meteorological InstituteHelsinki, Finland
Aiko VoigtLamont Doherty Earth ObservatoryColumbia UniversityNew York, NY, USA
Hailan WangNASA Goddard Space Flight CenterGlobal Modeling and Assimilation OfficeGreenbelt, Maryland, USA
Shih‐Yu (Simon) WangUtah Climate Center, Utah State University Logan, Utah, USA; andDepartment of Plants, Soils, and ClimateUtah State UniversityLogan, Utah, USA
Xin WangState Key Laboratory of Tropical OceanographySouth China Sea Institute of OceanologyChinese Academy of SciencesGuangzhou, Guangdong, China
Scott J. WeaverEnvironmental Defense FundWashington, DC, USA
Hao‐Wei WeyDepartment of Atmospheric SciencesNational Taiwan UniversityTaipei, Taiwan
Song YangSchool of Atmospheric SciencesSun Yat‐sen UniversityGuangZhou, Guangdong, China;Guangdong Province Key Laboratory for Climate Change and Natural Disaster Studies
Jinho YoonSchool of Earth Sciences and Environmental EngineeringGwangju Institute of Science and TechnologyRepulic of Korea
Jin‐Yi YuDepartment of Earth System ScienceUniversity of CaliforniaIrvine, California, USA


xi
Increasing extreme weather and climate events have resulted in tremendous loss of life and property world-wide. As of the writing of this volume, 2016 was the warmest year for globally averaged temperatures since records began. Additionally, the list of record‐breaking extreme heat and heavy precipitations events is steadily growing. Driven by the global increase in extreme event impacts, and increasing awareness about their causes, the past decade has seen a significant surge of academic interest in analyses of weather and climate extremes. The rapidly emerging science of extreme event attribution to that of climate change is uncovering the physical bases as to how weather and climate fluctuations are intensifying in a warming climate; this new science will have potential to improve upon the prediction of extreme weather and climate events.
Examples of emerging theories include Arctic amplifi-cation, which targets the effect of accelerated Arctic warming on interfering the jet stream, tropical expansion, which describes the poleward shift of the thermally driven circulation from the equator, the increasing refer-ence to the Clausius‐Clapeyron relationship quantifying the moisture‐holding capacity in the warming air, and changing teleconnection processes originating from the tropical oceans. However, these mechanisms can contra-dict each other or be overgeneralized. Controversial theories (such as recent debates regarding Arctic amplifi-cation) can confuse the general public and other stake-holders who are not familiar with meteorology and climate dynamics. Likewise, overgeneralized concepts such as global warming being a sole cause for the entirety of observed climate extremes, do little to advance the prediction of extreme events. It is the editors’ belief that finding the varied pathways through which extreme events happen provides the modus operandi toward improved comprehension and prediction and will facilitate mitiga-tion of climate extremes.
This book is designed to highlight the different path-ways whereby climate mechanisms engender extreme events as well as harness that information to improve extreme event prediction. Since the beginning of the 21st century, a great deal of research effort has been under-taken toward uncovering the physical mechanisms related to the changing pattern of climate extremes. The goal of this book is to be inclusive of the diverse, even contradic-tory, theories by (1) integrating the different views and approaches in research of climate extremes and (2) tran-sitioning the s ystematically acquired scientific knowledge
to benefit the greater scientific community and society at large. Aimed to be a resource for researchers and gradu-ate students, this book includes four parts of the climate extremes research: forcings, processes, regionality, and prediction.
Forcings – The need for effective and scientifically defensible ways for the attribution analysis of climate extreme events was highlighted by the National Academies of Sciences’ 2016 (NAS) report. The first important step toward extreme events attribution is establishing a sound understanding of n atural variability that represents the different origins of climate forcing, which can modify a region’s climate p attern and extreme weather. Examples included in this book are the changing pattern of the El Niño–Southern Oscillation (ENSO), Arctic‐midlatitude interactions, role of anthropogenic aerosols, shifting dynamics of internal atmospheric waves, and land‐surface processes.
Processes – The NAS report also highlights the devel-opment of appropriate ways to tease apart the interplay between meteorological and human‐made factors in the face of extreme events. Doing so requires intimate knowl-edge of meteorological processes linking internal and external climate forcings to climate extremes. Presented in this book is a collection of six chapters on the various meteorological processes leading to certain climate extremes, including the timing in which human‐made effects on climate extremes emerge, recent changes in temperature extremes over land, forced shifts in tropical precipitation, influences from various modes of tropical intraseasonal variability, warming of the western Pacific Ocean, and the influence of atmospheric waves embed-ded in jet streams. The interplay between these processes and forcings is complex, but it is possible to identify path-ways in which climate extremes are modulated.
Regionality – The impact of climate extremes on humanity and ecosystems occurs at the regional level. It is therefore important to understand the extent to which individual event types are connected to their respective locations and the processes through which they evolve. Examples of regional studies included are drought occur-rences in Austria, East Africa, southwest Asia, North America (specifically California), and tornadoes in the United States. Each of these regional extreme event types has changed in a way that links to different oceanic, atmospheric, and surface‐hydrological processes as well as teleconnection sources. Of essence is the fact that external forcing(s) of anthropogenic origin affects
PREFACE
xii PREFACE
these different regional extreme events through different pathways.
Prediction – Recent extreme events, such as intense drought, heat waves, historic local storms, extensive flooding, and cold spells have become increasingly severe and costly. While a few of those events were anticipated days before they happened, most were not; this suggests a knowledge gap in predicting and mitigating for future occurrences of extreme events. In another 2016 NAS report that focuses on modeling, the importance in devel-oping the subseasonal to seasonal (S2S) prediction is highlighted and backed by a decade of research progress in identifying prolonged episodes of extreme drought
and severe weather outbreaks. Chapters collected in this book include forecast advancement toward ENSO precursors, hurricanes, subseasonal variations, tempera-ture and precipitation extremes, and US tornadoes. These chapters illuminate the progress toward developing actionable information to foresee the like lihood of a climate extreme, and so get ready for the event and its consequences.
S.‐Y. Simon WangJin‐Ho Yoon
Christopher C. FunkRobert R. Gillies

xiii
All chapters in this book were peer reviewed following AGU journal standards. Therefore, our sincere thanks go to the many anonymous reviewers and chapter coauthors who spent extra time in helping maintain the integrity of this book. Mary Grace Hammond of Wiley did a won-derful job in handling the many tedious processes and challenging communications in editing this book; she
will be missed. Rituparna Bose, the publishing editor, planted a seed in 2013 that grew up to be a comprehen-sive book project. Thanks also go to Scott Weaver who helped proofread the preface. Special thanks to Johan Lorck, a climate‐concerned citizen from Paris, France, for his encouragement and support even at difficult times in Paris.
ACKNOWLEDGMENTS


Forcings of Climate ExtremesPart I


3
Climate Extremes: Patterns and Mechanisms, Geophysical Monograph 226, First Edition. Edited by S.-Y. Simon Wang, Jin-Ho Yoon, Christopher C. Funk, and Robert R. Gillies. © 2017 American Geophysical Union. Published 2017 by John Wiley & Sons, Inc.
1.1. INTRODUCTION
El Niño–Southern Oscillation (ENSO) is a prominent climate phenomenon in the tropical Pacific that can disrupt global atmospheric and oceanic circulation patterns and exert profound impacts on global climate and socioeconomic activities. Since Bjerknes [1969] first recognized that ocean‐atmosphere coupling was a fundamental
characteristic of ENSO, a tremendous amount of effort has been expended by the research community to describe and understand the complex nature of this phenomenon and its underlying generation mechanisms. By the 1990s, the effort had led to the developments of successful theoretical frameworks that could explain the major features observed during ENSO events [Neelin et al., 1998] and useful forecast systems had been formulated to predict ENSO evolution with significant lead times of up to three seasons [Latif et al., 1998]. The typical ENSO impacts in various parts of the globe had also been extensively examined and documented. Through these efforts, it was also recognized that ENSO properties were not the same among events and could change from one decade to another. The diversity of ENSO characteristics attracted renewed interest at the beginning of the 21st century (see Capotondi et al. [2015], for a summary of these efforts), when it became obvious that the central location of the
The Changing El Niño–Southern Oscillation and Associated Climate Extremes
Jin‐Yi Yu1, Xin Wang2, Song Yang3,4, Houk Paek1, and Mengyan Chen2
1
ABSTRACT
The El Niño–Southern Oscillation (ENSO) is one of the most powerful climate phenomena that produce p rofound global impacts. Extensive research since the 1970s has resulted in a theoretical framework capable of explaining the observed properties and impacts of the ENSO and predictive models. However, during the most recent two decades there have been significant changes observed in the properties of ENSO that suggest r evisions are required in the existing theoretical framework developed primarily for the canonical ENSO. The observed changes include a shift in the location of maximum sea surface temperature variability, an increased importance in the underlying dynamics of coupled ocean‐atmosphere process in the subtropical Pacific, and different remote atmospheric teleconnection patterns that give rise to distinct climate extremes. The causes of these recent changes in ENSO are still a matter of debate but have been attributed to both global warming and natural climate variability involving interactions between the Pacific and Atlantic oceans. The possible future changes of ENSO properties have also been suggested using climate model projections.
1 Department of Earth System Science, University of California, Irvine, California, USA
2 State Key Laboratory of Tropical Oceanography, South China Sea Institute of Oceanology, Chinese Academy of Sciences, Guangzhou, Guangdong, China
3 School of Atmospheric Sciences, Sun Yat‐sen University, GuangZhou, Guangdong, China
4 Guangdong Province Key Laboratory for Climate Change and Natural Disaster Studies
4 FORCINGS OF CLIMATE EXTREMES
sea surface temperature (SST) anomalies associated with ENSO appeared to be moving from the tropical eastern Pacific near the South American coast to locations near the International Dateline in the tropical central Pacific. Most of the El Niño events that have occurred so far in the 21st century developed primarily in the central Pacific [Lee and McPhaden, 2010; Yu et al., 2012b; Yu et al., 2015a; Yeh et al., 2015]. The fact that El Niño can sometimes occur in the eastern Pacific, sometimes in the central Pacific, and sometimes simultaneously in both portions of the Pacific has suggested that there may exist more than one type of ENSO, whose generation mechanisms and associated climate extremes may be different. The changes in ENSO observed during the recent d ecades have motivated the research community to revisit the conventional views of ENSO properties, dynamics, and global impacts.
1.2. CHANGES IN ENSO PROPERTIES
1.2.1. Flavors of ENSO
Slow or interdecadal changes have been observed in ENSO properties, including its intensity, period, and propagation direction [Gu and Philander, 1995; Wang and Wang, 1996; Torrence and Webster, 1999; An and Wang, 2000; Fedorov and Philander, 2000; Wang and An, 2001; Timmermann, 2003; An and Jin, 2004; and many others]. The amplitude of ENSO‐associated SST anomalies, for example, was found to be stronger at the beginning and the end of the twentieth century, but weaker in between [Gu and Philander, 1995; Wang and Wang, 1996]. The propagation direction of ENSO SST anomalies has also alternated between eastward, westward, and standing during the past few decades [Wang and An, 2001; An and Jin, 2004]. Its recurrence frequency changed from about 2 to 3 yr before 1975 to a longer frequency of 4 to 6 yr afterward [An and Wang, 2000]. In recent decades, one of the most noticeable changes in ENSO properties has been the displacement of the central location of ENSO SST anomalies [Larkin and Harrison, 2005; Ashok et al., 2007; Kao and Yu, 2009; Kug et al., 2009]. ENSO is characterized by interannual SST variations in the equatorial eastern and central Pacific. In the canonical ENSO events portrayed by Rasmusson and Carpenter [1982], SST anomalies first occur near the South American coast and then spread westward along the equator. However, ENSO events characterized by SST anomalies primarily in the equatorial central Pacific, and which spread eastward [An and Wang, 2000] also occur. Trenberth and Stepaniak [2001] recognized that the different SST evolutions of ENSO events cannot be fully described with a single index such as the Niño‐3 (5°S–5°N, 90°–150°W) SST index. They defined a trans‐Niño index, which measures
the SST gradient along the equator by taking the difference between normalized Niño‐1 + 2 (10°S–0°, 80°–90°W) and Niño‐4 (5°S–5°N, 160°E–150°W) SST indices to help discriminate the different SST evolutions. Their study implies that different types of ENSO may be better identified by contrasting SST anomalies between the eastern and central Pacific. A similar conclusion was reached by Yu and Kao [2007] in their analysis of the persistence b arrier of Niño indices in the central‐to‐eastern Pacific (i.e., Niño‐1 + 2, Niño‐3, Niño‐3.4 (5°S–5°N, 120°–170°W), and Niño‐4 SST indices). They found different decadal changes between the indices in the equatorial central and eastern Pacific. They also found that the decadal changes in ocean heat content variations along the equatorial Pacific coincide with the decadal changes in the SST persistence barriers in the eastern Pacific, but not with those in the central Pacific. This finding led them to suggest that there are two types of ENSO: An Eastern‐Pacific (EP) type located primarily in the tropical eastern Pacific and whose generation mechanism involves equatorial thermocline variations, and a Central‐Pacific (CP) type located in the central tropical Pacific and whose generation is less sensitive to thermocline variations. A detailed comparison of these two types of ENSO was presented in Kao and Yu [2009], where they identified the spatial structure, temporal evolution, and underlying dynamics of these two types of events. While this “two types of ENSO” point of view is adopted in this chapter, it should be noted that debate remains (for example, see the discussion in Capotondi et al. [2015]) as to whether these two types are really dynamically distinct.
Examples of the EP and CP types of ENSO are shown in Figure 1.1, which displays the SST anomaly patterns during the peak phase of the 1977–1978 and 1997–1998 El Niño events. During the 1997–1998 El Niño (Fig. 1.1a), SST anomalies were mostly located in the eastern part of the tropical Pacific, extending from the South American coast around 80°W to 160°W, covering the Niño‐1 + 2 and Niño‐3 regions. During the 1977–1978 El Niño (Fig. 1.1b), SST anomalies were mostly concentrated in the equatorial central Pacific from 160°E to 120°W, covering the Niño‐3.4 and Niño‐4 regions. Some early studies had already noticed the existence of a group of ENSO events that developed in the central Pacific around the International Dateline [e.g., Weare et al., 1976; Fu et al., 1986; Hoerling and Kumar, 2002; Larkin and Harrison, 2005a]. Larkin and Harrison [2005a] suggested that this group of ENSO events can produce different impacts on the US climate from conventional ENSO events and referred to them as the Dateline El Niño. Ashok et al. [2007] also focused on this group of ENSO events and termed them El Niño Modoki. Furthermore, Wang and Wang [2013] classified El Niño Modoki into two subtypes: El Niño Modoki I and El Niño Modoki II because

ThE ChANGING EL NIñO–SOuThERN OSCILLATION ANd ASSOCIATEd CLIMATE EXTREMES 5
they show significantly different impacts on rainfall in southern China and typhoon landfall activity. These two subtypes of El Niño Modoki have distinct origins and patterns of SST anomalies during their developing phase. Kug et al. [2009] also named this ENSO‐type warm pool El Niño and the other type cold tongue El Niño.
1.2.2. Distinct Characteristics of the Eastern‐Pacific (EP) and Central‐Pacific (CP) Types of ENSO
Significant differences were found between the structure and evolution of the EP and CP types of ENSO [Kao and Yu, 2009; Kug et al., 2009]. The typical SST anomaly patterns associated with these two types of ENSO are shown in Figure 1.1c and d, which are obtained by applying a regression‐EOF (empirical orthogonal function) analysis [Kao and Yu,2009; Yu and Kim, 2010a] to tropical Pacific SST anomalies. In this method, SST anomalies regressed on the Niño‐1 + 2 SST index (representing the
EP ENSO influence) were first removed from the original monthly SST anomalies, and then an EOF analysis was applied to the residual SST anomalies to obtain the spatial pattern of the CP ENSO. Similarly, SST anomalies regressed on the Niño‐4 index (representing the CP ENSO influence) were first removed from the original SST anomalies, and then an EOF analysis was applied to identify the leading structure of the EP ENSO. The principal components (PCs) associated with these patterns are referred to, respectively, as the CP ENSO index and the EP ENSO index. The EOF patterns show that the EP ENSO‐related SST anomalies are mostly located in the eastern equatorial Pacific and connected to the coast of South America (Fig. 1.1c), while the CP ENSO has most of its SST anomalies confined in the central Pacific with extension into the northeastern subtropical Pacific (Fig. 1.1d). Although other studies also proposed different identification methodologies for separating the two types of ENSO, including weighted averaged SST
Nov 1997–Jan 1998 Nov 1977–Jan 1978
120°E30°S
15°S
0°
15°N
30°N
150°E 150°W 120°W 90°W180°
(a) (b)
(c) (d)Eastern–Pacific (EP) ENSO Central–Pacific (CP) ENSO
120°E30°S
15°S
0°
15°N
30°N
150°E 150°W 120°W 90°W180°
120°E30°S
15°S
0°
15°N
30°N
150°E 150°W 120°W 90°W180° 120°E30°S
15°S
0°
15°N
30°N
150°E 150°W 120°W 90°W180°
Figure 1.1 SST anomalies during the peak phase (November–January) of (a) the 1997–1998 El Niño event and (b) the 1977–1978 El Niño event. The leading EOF (empirical orthogonal function) patterns obtained from a regression‐EOF analysis [Kao and Yu, 2009] are shown in (c) for the Eastern‐Pacific type of ENSO and in (d) for the Central‐Pacific type of ENSO. The contour intervals are 0.5 °C for (a), 0.3 °C for (b), and 0.1 °C for (c) and (d). The Hadley Centre Sea Ice and Sea Surface Temperature dataset (HadISST) [Rayner et al., 2003] for the period 1948–2010 is used in these calculations.

6 FORCINGS OF CLIMATE EXTREMES
anomalies in the tropical western, central, and eastern Pacific [Ashok et al., 2007]; relative magnitudes of the Niño‐3 and Niño‐4 indices [Kug et al., 2009; Yeh et al., 2009]; a simple transformation of the Niño‐3 and Niño‐4 indices [Ren and Jin, 2011] or two PCs of tropical Pacific SST anomalies [Takahashi et al., 2011]; and mean upper ocean temperature anomalies in CP and EP regions [Yu et al., 2011], their corresponding SST anomaly patterns are similar to those shown in Figure 1.1c and d. The SST anomaly features revealed by the regression‐EOF analysis were observed in the 1977–1978 and 1997–1998 El Niño events as shown in Figure 1.1a and b. The meridional extension into the subtropics of the CP ENSO SST anomalies is an important feature, because it resembles the Pacific Meridional Mode (PMM) [Chiang and Vimont, 2004] that is the leading coupled variability mode of the subtropical Pacific. This connection indicates that the CP ENSO dynamic has a stronger tie to atmospheric and oceanic process outside the tropical Pacific than does the EP ENSO dynamic.
Below the ocean surface (Fig. 1.2), the EP ENSO is accompanied by significant subsurface temperature anomalies propagating across the Pacific basin, while the CP ENSO is associated only with subsurface ocean temperature anomalies that develop in situ in the central Pacific. The different subsurface evolution indicates that, in contrast to the EP ENSO, the underlying dynamics of the CP ENSO seem to be less dependent on thermocline variations [Kao and Yu, 2009; Kug et al., 2009], which is consistent with the suggestion of Yu and Kao [2007]. McPhaden [2008] already noticed that the variations in the equatorial Pacific Ocean heat content (i.e., the so‐called warm water volume; Meinen and McPhaden [2000]) tended to lead the ENSO SST anomalies by about two to three seasons in the 1980s and 1990s but by only one season after 2000. McPhaden [2012] attributed this decrease to the shift of ENSO from the EP type to the CP type in recent decades. The decreased lead time implies a reduced impact of thermocline feedback to SST anomalies for the CP ENSO and may explain the reduced predictability observed in recent decades [Barnston et al., 2012] as this type of ENSO occurred more frequently. The weakened relationship between ENSO SST anomalies and the underlying thermocline variation indicates that the CP ENSO dynamic differs from the traditional ENSO dynamic, such as the delayed oscillator theory [Suarez and Schopf, 1988; Battisti and Hirst, 1989] or the recharged oscillator theory [e.g., Wyrtki 1975; Zebiak 1989; Jin 1997] that emphasize the subsurface ocean dynamics in governing ENSO SST evolution.
In the atmosphere, wind stress and precipitation anomaly patterns associated with the two types of ENSO are also different. While the EP El Niño is associated with significant westerly anomalies over a large part of the
tropical Pacific, the westerly anomalies associated with the CP El Niño have a smaller spatial scale and are centered in the equatorial central‐to‐western Pacific [Kao and Yu, 2009; Kug et al., 2009]. This more westward location of the westerly anomalies in the CP El Niño is consistent with the location of its SST anomalies. Significant easterly anomalies also appear over the tropical eastern Pacific during the CP El Niño. Theses anomalies were suggested to prevent the development of positive SST anomalies in this region during CP El Niño events [Ashok et al., 2007; Kug et al., 2009]. These differences in wind stress anomalies are important to the interpretation of the underlying dynamics of these two types of ENSO. Moreover, positive anomalies of precipitation associated with the EP El Niño typically extend from the equatorial eastern‐to‐central Pacific where the largest SST anomalies are located. For the CP El Niño, the precipitation anomalies are characterized by a dipole pattern, with positive anomalies located mainly in the western Pacific and negative anomalies in the eastern Pacific [Kao and Yu, 2009; Kug et al., 2009]. The different precipitation patterns associated with these two types of ENSO imply that the locations of associated convective heating and the induced global teleconnections are different as well.
In addition to the central locations of their SST a nomalies, the two types of ENSO also differ in their evolution, amplitude, and recurrence frequency. The propagation of SST anomalies is weaker and less apparent in the CP type of ENSO than in the EP type of ENSO [Kao and Yu, 2009]. Also, there is no identifiable phase‐reversal signal in the composite analysis of the CP ENSO SST anomalies, implying that this type of ENSO does not behave like a cycle or oscillation as is often the case for the EP ENSO. Discussions of whether ENSO should be viewed as an event or a cycle [e.g., Kessler, 2002] might be aided by recognizing that there are two types of ENSO: one behaves more as an event and the other more as a cycle. Sun and Yu [2009] pointed out that the amplitude of the CP El Niño tends to be smaller than that of the EP El Niño, while the CP La Niña is often stronger than the EP La Niña. The reason for this difference in behavior between the El Niño and La Niña phases of these two types of ENSO has yet to be explained. Sun and Yu [2009], however, proposed an ENSO‐mean state interaction mechanism to suggest that the amplitude asymmetries between the El Niño and La Niña phases of these two types of ENSO enable ENSO to modify the tropical Pacific mean state, which can give rise to a 10–15 yr m odulation cycle in ENSO amplitude. Strong El Niño events can occur every 10–15 yr due to this cycle, which is consistent with the time interval between the last three strongest El Niño events: the 1972–1973, 1982–1983, and 1997–1998 El Niño events. For the recurrence frequency, it is well known that ENSO events tend to occur every 2

ThE ChANGING EL NIñO–SOuThERN OSCILLATION ANd ASSOCIATEd CLIMATE EXTREMES 7
120°E300
200
100
0
Dep
th (
m)
300
200
100
0
Dep
th (
m)
300
200
100
0
Dep
th (
m)
300
200
100
0
Dep
th (
m)
300
200
100
0
Dep
th (
m)
300
200
100
0
Dep
th (
m)
300
200
100
0EP CPLag (–6) Lag (–6)
Lag (–3)
0
0
0
0
2
2
22
2
2
0
0
00
0
0
0
0 0
00
0
00
02
2
4
0
0
0
2
24
2
2
4
42
2
2
2
24
4
2
2
20
4
4
6 2
2
2
0
00
0
4
4
2
2
2
2
2
2
2
2
2
2 2
2
2
22
2
24
4
4
4
4
2
2
2
2
Lag (–3)
Lag (0) Lag (0)
Lag (+3) Lag (+3)
Lag (+6) Lag (+6)
Lag (+9) Lag (+9)
Lag (+12) Lag (+12)
(a) (b)
Dep
th (
m)
150°E 150°W 120°W 90°W180° 120°E 150°E 150°W 120°W 90°W180°
Figure 1.2 Evolution of equatorial (5°S–5°N) subsurface ocean temperature anomalies associated with the (a) EP ENSO and (b) CP ENSO. Values shown are temperature anomalies regressed on the EP and CP ENSO i ndices from a lag of −6 mo to a lag of +12 mo. The contour interval is 0.2 °C. Ocean temperature assimilation from the German Estimating the Circulation and Climate of the Ocean (GECCO) [Kohl et al., 2006] for the period 1970–2001 is used.

8 FORCINGS OF CLIMATE EXTREMES
to 7 yr. Spectral analyses have suggested that there are two dominant bands of ENSO variability: a quasibiennial (~2 yr) band and a low‐frequency (3–7 yr) band [Rasmusson and Carpenter, 1982; Rasmusson et al., 1990; Barnett, 1991; Gu and Philander, 1995; Jiang et al., 1995; Wang and Wang, 1996]. The EP ENSO is dominated more by the low‐frequency band, while the CP ENSO is dominated by the quasibiennial band [Kao and Yu, 2009; Yu et al., 2010; Yu and Kim, 2010a]. As indicated above, El Niño events in the 21st century have been mostly of the CP type, and it is interesting to note that they occurred about every 2 yr in 2002, 2004, 2006, and 2009. In contrast, the El Niño events observed during the 1970s and 1980s tended to occur every 4 yr. If model projections are correct about the more frequent occurrence of the CP ENSO in the future warmer world [Yeh et al., 2009; Kim and Yu, 2012], we should expect El Niño events in the coming decades to become more frequent but weaker.
1.2.3. Possible Causes for the Change in ENSO Properties
The recent change in the ENSO type may be due to background state changes in the tropical Pacific that are either caused by anthropogenic warming [Yeh et al., 2009; Kim and Yu, 2012] or decadal/multidecadal natural variability [McPhaden et al., 2011; Yeh et al., 2011]. Random fluctuations have also been suggested as possibly giving rise to the change in ENSO type on decadal timescales even without a change in the background state of the tropical Pacific [Newman et al., 2011].
1.2.3.1. Anthropogenic Warming. Yeh et al. [2009] and Kim and Yu [2012] used multiple model datasets of phases 3 and 5 of the Coupled Model Intercomparison Project (CMIP3 and CMIP5) [Meehl et al., 2007; Taylor et al., 2012] to examine the influence of anthropogenic warming on the ENSO type. Yeh et al. [2009] analyzed CMIP3 model projections to show that anthropogenic warming can flatten the equatorial Pacific thermocline (due to a weakened Walker circulation) resulting in a shift of the thermocline feedback mechanism from eastern to central Pacific and increasing the occurrence of ENSO in the central Pacific. They suggested that the same mechanism may be at work in recent decades to increase the occurrence frequency of the CP ENSO. Kim and Yu [2012] compared the amplitude ratio of these two types of ENSO in CMIP5 models. They found that the intensity of the CP ENSO increases steadily from the preindustrial to the historical simulations and the future projections, but the intensity of the EP ENSO decreases. The CP‐to‐EP ENSO intensity ratio, as a result, is projected to increase.
This global warming view has been challenged on two fronts. First, Lee and McPhaden [2010] found that not
only has the occurrence of the CP El Niño increased in recent decades but its intensity has also significantly increased. However, the intensity of CP La Niña events has not changed during the same period. As a result, they argued, the warming trend observed in the central Pacific is a result of the increasing frequency and intensity of the CP El Niño, rather than the other way around. Second, McPhaden et al. [2011] found the Pacific background state during the most recent decade (2000–2010) has a steeper equatorial thermocline and stronger trade winds than during earlier decades (1980–1999), which are opposite from the background states changes expected by Yeh et al. [2009] should anthropogenic warming be the cause for the change in the ENSO type. This inconsistency implies that the change in ENSO type may be a manifestation of natural variability. McPhaden et al. [2011] also interpreted the Pacific background state during 2000–2010 to be a result, rather than a cause, of the shift of the ENSO from the EP type to the CP type. Their argument is that change in the central location of the ENSO SST anomalies can project onto the changes in the background states.
1.2.3.2. ENSO–Mean State Interaction. Earlier studies have suggested that ENSO can force changes in the tropical Pacific background state [e.g., Rodgers et al., 2004; Schopf and Burgman, 2006; Sun and Yu, 2009; Choi et al., 2009]. Due to nonlinearities in ENSO dynamics, it is known that asymmetries exist in the intensity, frequency, or spatial structures of the warm (El Niño) and cold (La Niña) phases of the cycle. For example, strong El Niño events tend to reach a larger intensity than strong La Niña events [Hannachi et al., 2003; An and Jin, 2004; Duan et al., 2008; Frauen and Dommenget, 2010; Su et al., 2010]. Also, strong El Niño events tend to be located more in the eastern Pacific while strong La Niña events tend to be located more in the central Pacific [Monahan, 2001; Hsieh, 2004; Rodgers et al., 2004; Schopf and Burgman, 2006; Sun and Yu, 2009]. Because of these asymmetries, the positive and negative anomalies associated with the El Niño and La Niña phases may produce a nonzero residual effect on the time‐mean state of the tropical Pacific. Sun and Zhang [2006] also conducted numerical experiments using a coupled model with and without ENSO to show that ENSO works as a basin‐scale mixer on the time‐mean thermal stratification in the upper equatorial Pacific. The mean state change associated with decadal ENSO variability is one of the leading modes of tropical Pacific decadal variability in many coupled atmosphere‐ocean models [Rodgers et al., 2004; Yeh and Kirtman, 2004; Yu and Kim, 2011b].
Sun and Yu [2009] suggested an ENSO–mean state interaction mechanism to explain how the ENSO type may shift between the EP and CP types on decadal timescales.

ThE ChANGING EL NIñO–SOuThERN OSCILLATION ANd ASSOCIATEd CLIMATE EXTREMES 9
A key element in their hypothesized mechanism is that strong El Niño events tend to be of the EP type, whereas strong La Niña events tend to be of the CP type. In contrast, weak El Niño events tend to be of the CP type, whereas weak La Niña events tend to be of the EP type. They verified this reversed spatial asymmetry characteristic using observed ENSO events during the 1880–2006 period in two reconstructed SST datasets. During strong ENSO periods or decades, strong El Niño events are located in the eastern tropical Pacific and strong La Niña events in the central tropical Pacific. This spatial asymmetry between El Niño and La Niña can gradually reduce the background east‐west SST gradient to weaken the ocean‐atmosphere coupling and to shift the background state toward one favoring a weak ENSO regime. Conversely, during the weak ENSO periods or decades, weak El Niño events are located in the eastern tropical Pacific and weak La Niña events in the central tropical Pacific, which can gradually increase the east‐west SST gradient, strengthen the ocean‐atmosphere coupling, and shift the background state toward one favoring a strong ENSO regime. The reversed spatial asymmetries between El Niño and La Niña enable ENSO to force the tropical Pacific mean state in opposite ways between the strong and weak ENSO regimes, acting as a restoring force to push the mean state back and forth between states that sustain strong and weak ENSO intensities. ENSO can also alternate between the EP and CP types on decadal timescales. Choi et al. [2012] have noted such an ENSO–mean state interaction mechanism and its associations with the ENSO types and Pacific background states in coupled model simulations.
1.2.3.3. The Pacific Decadal Oscillation. Decadal changes in ENSO properties can also be associated with forcing external to the tropical Pacific, such as that related to slow SST oscillations in the North Pacific, Atlantic, or Indian oceans [e.g., Gu and Philander, 1997; Behera and Yamagata, 2003; Verdon and Franks, 2006; Luo et al., 2005; Dong et al., 2006]. One of the most well‐known forcing of this kind is related to the Pacific Decadal Oscillation (PDO) [Zhang et al., 1997; Mantua et al., 1997], which is a leading mode of decadal SST variability in the North Pacific. Earlier studies considered the PDO a physical mode of climate variability that results from atmosphere‐ocean coupling within the North Pacific [e.g., Latif and Barnet, 1994; Alexander and Deser, 1995]. More recent views consider it not a single physical mode but a combination of several processes operating on various timescales (see a review by Newman et al. [2015]). It has been suggested that the PDO is capable of modulating the ENSO properties by influencing the tropical Pacific background states through ocean subduction, thermocline ventilation, or atmospheric teleconnections
[e.g., McCreary and Lu, 1994; Gu and Philander, 1995; Wang and Weisberg, 1998; Zhang et al., 1998; Barnett et al., 1999; Pierce et al., 2000; Chang et al., 2001; McPhaden and Zhang, 2002]. During the period of reliable instrumental records, the PDO shifted its phase twice: from a negative to a positive phase around 1976–1977 and back to a negative phase around 1999–2000. Along with the 1976–1977 phase shift, the background SSTs increased in the eastern and central tropical Pacific. This background state change was accompanied by noticeable changes in ENSO frequency and intensity [e.g., Trenberth and Hoar, 1996; Rajagopolan et al., 1997]. Specifically, ENSO amplitude increased after the shift [An and Wang, 2000], and the ENSO frequency increased from being dominated by a quasi‐2 yr band to a quasi‐4 yr band [Wang and Wang, 1996]. In addition, ENSO SST anomalies were found to propagate westward before the shift but eastward after the shift [Wang and An, 2001], and there were more frequent El Niño events and fewer La Niña events after the shift [Trenberth and Hoar, 1996]. However, there was no noticeable change in the ENSO type across the 1976–1977 climate shift.
The 1999–2000 phase shift of the PDO is closer to the time that the occurrence frequency of the CP ENSO began to increase, which was suggested to be sometime around the 1980s [Ashok et al., 2007], the 1990s [Yu et al., 2012a], or the beginning of the 21st century [Lee and McPhaden, 2010; McPhaden et al., 2011]. Associated with this PDO phase shift, a late‐1990s climate shift has also been suggested to occur in the Pacific Rim [e.g., Minobe, 2000; Peterson and Schwing, 2003]. Dramatic changes around 1999 were reported in the North Pacific sea level pressure (SLP), SST and sea level patterns [Minobe, 2000; Cummins et al., 2005], and in the northeastern Pacific ecosystems [Peterson and Schwing, 2003]. In the western North Pacific, tropical cyclone activity abruptly increased after 2000 [Tu et al., 2009; He et al., 2015]. Over the neighboring continents, precipitation patterns changed after the late 1990s over North and South America [Huang et al., 2005] and over China [Zhu et al., 2011; Xu et al., 2015]. Surface temperatures in the Tibetan Plateau suddenly increased during the late 1990s [Xu et al., 2009]. A La Niña‐like background pattern appeared in the tropical Pacific [e.g., McPhaden et al., 2011; Chung and Li, 2013; Hu et al., 2013; Xiang et al., 2013; Kumar and Hu, 2014], characterized by a steeper equatorial thermocline slope [McPhaden et al., 2011] and strengthened Walker circulation [Chung and Li, 2013; Dong and Lu, 2013]. The breakdown of the subsurface ocean variability–ENSO relationship [McPhaden, 2008, 2012; Horri et al., 2012] and a coherent weakening of tropical ocean‐atmosphere variability [Hu et al., 2013] after 2000 are likely associated with the decreases in ENSO forecast skill since 1999–2000 [Barnston et al., 2012; Xue et al.,

10 FORCINGS OF CLIMATE EXTREMES
2013]. Beyond the Pacific, changes in the SST and sea ice variability over the Bering and Chukchi seas [Minobe, 2002; Yeo et al., 2014] and in the southern ocean SST variability modes [Yeo and Kim, 2015] have also been found after the late 1990s.
1.2.3.4. The Atlantic Multidecadal Oscillation. In addition to the PDO‐related late‐1990s climate shift, there is evidence that the Pacific also experienced a basinwide climate shift in the early‐1990s that can also be responsible for the change in the type of ENSO. As shown in Figure 1.1, the EP ENSO has an SST anomaly pattern that spans the tropical eastern and central Pacific. During this type of ENSO, SST variations in the central Pacific (i.e., the Niño‐4 region) have an in‐phase association with the SST variations in the eastern Pacific (i.e., the Niño‐3 region). During the CP ENSO, the association between SST anomalies in the central Pacific and the eastern Pacific is weaker. Instead, the SST variations in the tropical central Pacific are more related to SST variations in the northeastern subtropical Pacific that are induced by an interannual atmospheric variability mode, the so‐called North Pacific Oscillation (NPO) [Walker and Bliss, 1932; Rogers, 1981; Linkin and Nigam, 2008]. The NPO is the second leading mode of the North Pacific SLP variability and is characterized by out‐of‐phase SLP fluctuations between the Aleutian low and the Pacific subtropical high. Based on these features, Yu et al. [2012a] used three oceanic and atmospheric indices and found that the SST variations in the tropical central Pacific (i.e., the Niño‐4 index) are strongly related to the SST variations in the tropical eastern Pacific (i.e., the Niño‐3 index) before the early 1990s but more closely related to the SLP variations associated with NPO (i.e., the NPO index) afterward. They concluded that the change in ENSO from the EP type to the CP type occurred in the early 1990s. This climate shift resulted in a change in ENSO location from the eastern Pacific to the central Pacific. Yu et al. [2015a] further revealed that the early‐1990s climate shift was related to the Atlantic Multidecadal Oscillation (AMO) [Schlesinger and Ramankutty, 1994; Kerr, 2000], which changed from a negative phase to a positive phase in the early 1990s as well. The AMO is characterized by slow changes in SST in the North Atlantic and is believed to have a period of 60–80 yr. Although there is still ongoing debate on the causes of the AMO, it is agreed that the slow variability mode influences climate not only within the Atlantic basin but also across the entire Northern Hemisphere, including the Pacific basin [e.g., Dong et al., 2006; Zhang and Delworth, 2007]. The physical processes that link the NPO and AMO to the CP ENSO are described in detail in section 1.3.
Evidence of the early‐1990s climate shift in the Pacific has also been found in other climate phenomena of the
low‐latitude Pacific. In the western Pacific, upper ocean currents and sea level structure also changed around this time, with the north equatorial current and the north equatorial countercurrent migrating southward [Qiu and Chen, 2012] and sea level rise accelerating to a rate not seen in the preceding several decades [Merrifield, 2011]. These oceanic state changes were accompanied by changes in trade wind patterns [Qiu and Chen, 2012]. Sui et al. [2007] found that the interannual variability of the western Pacific subtropical high was dominated by frequencies of 3–5 yr before the early 1990s but 2–3 yr afterward. The relationships between the Asian monsoon and the other monsoon systems in the Northern Hemisphere (e.g., the North American and North African monsoons) changed in such a way that the interannual rainfall variability produced by these the monsoon systems decreased dramatically after 1993 [Lee et al., 2014]. The relationships between the East Asian winter monsoon and ENSO also undergo low‐frequency oscillation [Zhou et al., 2007]. Moreover, the typical drought pattern in China was replaced by a new pattern after the early 1990s [Qian et al., 2014]. These recent studies together indicate that the Pacific climate shift in the early 1990s affected the ENSO location, the monsoons, the subtropical high, and the subtropical ocean gyre.
1.2.3.5. Random Forcing. Other mechanisms have also been put forth to explain the increased occurrence of the CP ENSO during the past few decades. Newman et al. [2011] used a linear inverse modeling technique to suggest that natural random variations in the atmosphere can project onto two particular initial SST anomaly patterns, each of which can eventually develop into either the EP or CP type of ENSO through thermocline and zonal advection feedbacks, respectively. They argued that such natural random variations can result in a slow alternation in the type of ENSO without the need for changes in the background state.
1.3. CHANGES IN ENSO DYNAMICS
1.3.1. The Different Generation Mechanisms for the Two Types of ENSO
The fundamental dynamics of ENSO have been traditionally believed to reside mostly within the tropical Pacific [Neelin et al., 1998; Philander 1999; Wang et al., 2015; and the references therein]. The prevailing ENSO theories emphasize the delayed response of subsurface ocean to atmospheric forcing for the oscillation of ENSO. In this view, the delayed oceanic response results from the propagation and reflection of oceanic waves along the equator in the delayed oscillator theory [Suarez and Schopf 1988; Battisti and Hirst 1989], the adjustment of

ThE ChANGING EL NIñO–SOuThERN OSCILLATION ANd ASSOCIATEd CLIMATE EXTREMES 11
the nonequilibrium between zonal‐mean thermocline depth and wind forcing in the recharged oscillator theory [e.g., Wyrtki 1975; Zebiak 1989; Jin 1997], or the lagged response of western Pacific wind stress to ENSO SST anomalies in the western Pacific oscillator theory [Weisberg and Wang 1997; Wang et al., 1999]. Variations in ENSO properties (such as its low‐frequency and quasibiennial periodicity) can be produced by these delayed atmosphere‐ocean coupling processes and their interactions with the annual cycle or by the nonlinear chaotic characteristics of these ENSO dynamics [Jin et al., 1994; Jin 1996, 1997; Tziperman et al., 1994, 1995; Chang et al., 1995, 1996; Mantua and Battisti 1995; An and Jin, 2001]. From this point of view, the various types of ENSO do not necessarily represent distinct ENSO dynamics. However, recent studies of the EP and CP types of ENSO have begun to suggest that these two types of ENSO are likely to have different underlying dynamics [e.g., Kao and Yu, 2009; Yu et al., 2011; Yu and Kim, 2011a; S.‐T. Kim et al., 2012; Yu et al., 2012a; Lin et al., 2014]. In this framework, the EP ENSO is produced by the traditional ENSO dynamics, while the generation of the CP ENSO relies more on forcing from the subtropical Pacific and its interaction with ocean mixed‐layer dynamics in the equatorial central Pacific.
As shown in Figure 1.2, the composite CP ENSO is associated with in situ subsurface ocean temperature anomalies that do not show the basinwide propagation characteristics typical of the delayed oscillator theory [Suarez and Schopf 1988; Battisti and Hirst 1989]. Yu and Kim [2010b] further examined the thermocline variations associated with nine major CP El Niño events since 1960. Three of the CP El Niño events (i.e., 1968–1969, 1990–1991, and 1991–1992) they examined undergo a prolonged decaying phase (Fig. 1.3a) that decays slowly and is followed by a warm event in the eastern Pacific. Figure 1.3d shows that the mean thermocline depth (represented by the 20 °C isotherm) for this group of events (i.e., Group 1) is deeper than normal in the equatorial Pacific (i.e., recharged state), which later gives rise to an EP El Niño to prolong the decay of these three CP El Niño events. The other three CP El Niño events (1963–1964, 1977–1978, and 1987–1988) occurred in the p resence of shallow‐than‐normal thermoclines (i.e., discharged state; Group 2 of Fig. 1.3d). This group of CP El Niño events is followed by a La Niña event in the eastern Pacific, resulting in an abrupt termination of the CP El Niño (Fig. 1.3b). The last three events (1994–1995, 2002–2003, and 2004–2005) occurred with near‐normal thermocline depths (i.e., neutral state; Group 3 of Fig. 1.3d). This group of events undergoes a symmetric‐decaying pattern, whose SST anomalies grow and decay symmetrically with respect to a peak phase (Fig. 1.3c). Therefore, CP El Niño events can occur when the equatorial
Pacific thermocline is above, below, or near the normal depth, as also suggested by a recent modeling study [Fedorov et al., 2014]. This finding further confirms that the generation of CP ENSO does not depend on thermocline dynamics. However, these different thermocline structures do affect whether a warming, cooling, or neutral event may occur in the eastern Pacific as the CP event decays. Depending on the thermocline structure, the eastern Pacific warming, or cooling may interact with the SST evolution of the CP event and give rise to the three distinct evolution patterns of CP El Niño. Although the thermocline variations are not crucial to the generation and the dynamics of the CP type of El Niño, the state of the thermocline at the peak phase of a CP ENSO event can potentially be used to predict when and how the CP ENSO event will terminate. It is the interplay between the dynamics of the CP and EP types of ENSO that makes the thermocline information useful for the prediction of both types of SST variations.
1.3.2. The Central‐Pacific ENSO: Extratropical Atmospheric Forcing Mechanism
As mentioned, for the CP El Niño the equatorial westerly anomalies appear to the west of the positive SST anomalies in the central Pacific and the equatorial easterly anomalies to the east. Ashok et al. [2007] argued that the thermocline variations induced by this wind anomaly pattern are responsible for the generation of the CP ENSO. The equatorial westerly anomalies induce downwelling Kelvin waves propagating eastward and the equatorial easterly anomalies induce downwelling Rossby waves propagating westward and, together, they deepen the thermocline in the central Pacific to produce the CP El Niño. Kug et al. [2009] emphasized the fact that the equatorial easterly anomalies can suppress warming in the eastern Pacific during a CP El Niño event by enhancing upwelling and surface evaporation. However, they also argued that the mean depth of thermocline in the central Pacific is relatively deep and the wind‐induced thermocline variations may not be efficient in producing the CP SST anomalies. Instead, they suggested that ocean advection is responsible for the development of the central Pacific warming. Yu et al. [2010] also concluded that the SST anomalies of the CP ENSO undergo rapid intensification through ocean advection processes. However, they showed that the initial establishment of the CP SST anomalies is related to forcing from the extratropical atmosphere and subsequent atmosphere‐ocean coupling in the subtropics.
Yu et al. [2010] performed an analysis of the near‐s urface ocean temperature budget to identify the physical processes involved in the development of the CP ENSO. They showed that the SST anomalies associated

12 FORCINGS OF CLIMATE EXTREMES
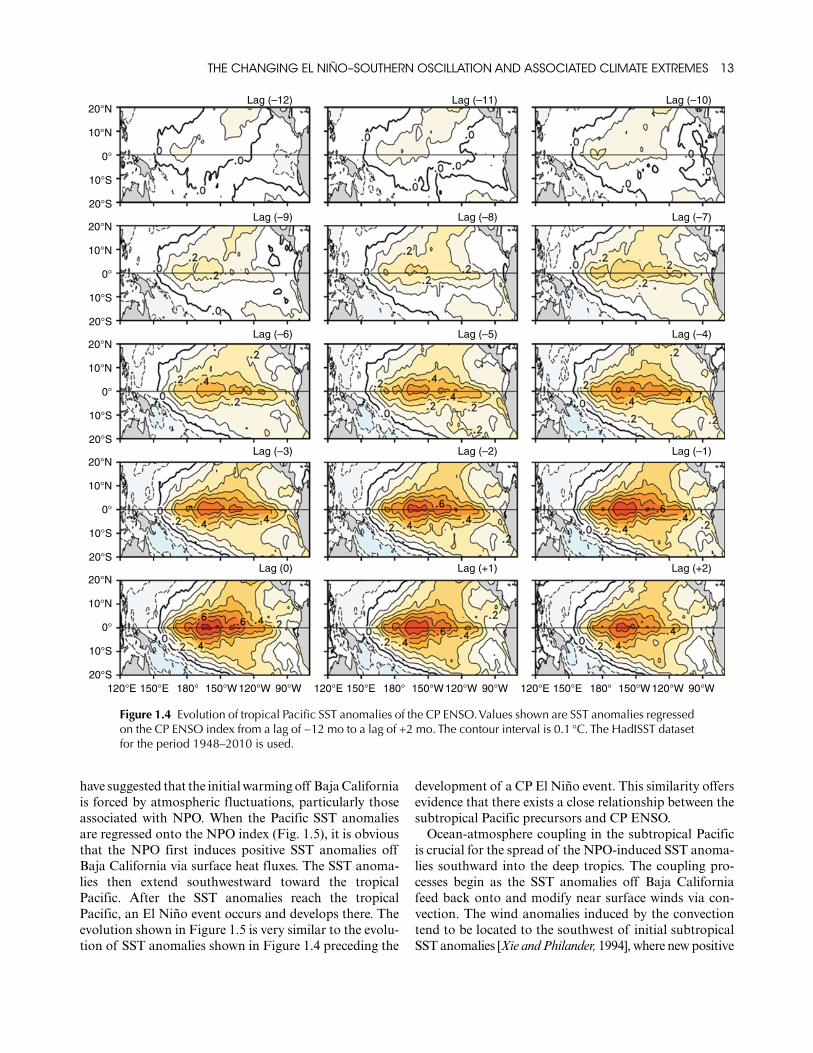
with the CP ENSO undergo rapid intensification in the equatorial central Pacific through local atmosphere‐ocean interactions, which involve only mixed layer ocean dynamics and are similar to those described for the slow‐SST mode of ENSO [Neelin 1991; Neelin and Jin 1993]. This mode requires surface wind anomalies to induce anomalous air‐sea fluxes and ocean advection processes to intensify the initial SST perturbation. Yu et al. [2010] suggested that the initial SST anomalies in the central equatorial Pacific were, however, established by forcing from the extratropical atmosphere. This s uggestion is supported by regressions of the Pacific SST anomalies onto the CP ENSO index. As shown in Figure 1.4, the regressed positive SST anomalies appear first in the northeastern subtropical Pacific and later
spread toward the central equatorial Pacific to initiate ENSO event in the central Pacific.
The possibility of subtropical precursors in triggering ENSO events has long been recognized. However, recent studies on CP ENSO dynamics have begun to emphasize that these subtropical processes are not just precursors of ENSO but an essential element in the generation of CP ENSO events. As revealed by Figure 1.4, the CP ENSO is preceded by SST anomalies in the northeastern Pacific, which are characterized by a band of SST anomalies extending typically from Baja California toward the equatorial central Pacific. As the subtropical SST anomalies approach the equatorial Pacific, El Niño events develop and begin to grow. Several recent studies [e.g., Vimont et al., 2003; Anderson, 2004; Yu and Kim, 2011a]
°C
(a)
(c) (d)
(b)Group1: Prolonged–decay
Group3: Symmetric–decay D20C anomalies
Group2: Abrupt–decay
J
120°E 180° 180°
0.0
0.5
1.0
0.5
0.0
–0.5
120°W
120°E 180°
0.5
0.0
0.5
0.5
0.0
120°W
120°W
–2.5
–1.5
–0.5
0.5
1.5
120°E
AS
Yea
r (0
)Y
ear
(+1)
ON
DJ
FM
AM
JJ
AS
Yea
r (0
)Y
ear
(+1)
Year (0) Year (+1)
ON
DJ
FM
AM
J
J A S O
Group1
Group3Group2
N D J F M A M J
10
5
0
–5D20
C (
m)
–10
–15
JA
S
Yea
r (0
)Y
ear
(+1)
ON
DJ
0.5
0.0
FM
AM
J
Figure 1.3 Evolution of composite equatorial Pacific (5°S–5°N) SST anomalies for (a) the group of CP El Niño events that has a prolonged decay (i.e., 1968–1969, 1990–1991, and 1991–1992), (b) the group that has an abrupt decay (i.e., 1963–1964, 1977–1978, and 1987–1988), and (c) the group that has a symmetric decay (i.e., 1994–1995, 2002–2003, and 2004–2005). The evolution is shown from July of the El Niño year (0) to June of the following year (+1) and is calculated from the Extended Reconstruction of Historical Sea Surface Temperature dataset (ERSST) [Smith et al., 2008]. Panel (d) shows the evolution of the depth anomalies of the zonal‐mean 20 °C isotherm (D20C) at the equator (5°S–5°N) for the three groups of events. The zonal mean is averaged between 120°E and 80°W and is calculated using the Simple Ocean Data Assimilation Reanalysis data (SODA) [Carton et al., 2000]. Adapted from Yu and Kim [2010b].
ThE ChANGING EL NIñO–SOuThERN OSCILLATION ANd ASSOCIATEd CLIMATE EXTREMES 13
have suggested that the initial warming off Baja California is forced by atmospheric fluctuations, particularly those associated with NPO. When the Pacific SST anomalies are regressed onto the NPO index (Fig. 1.5), it is obvious that the NPO first induces positive SST anomalies off Baja California via surface heat fluxes. The SST anomalies then extend southwestward toward the tropical Pacific. After the SST anomalies reach the tropical Pacific, an El Niño event occurs and develops there. The evolution shown in Figure 1.5 is very similar to the evolution of SST anomalies shown in Figure 1.4 preceding the
development of a CP El Niño event. This similarity offers evidence that there exists a close relationship between the subtropical Pacific precursors and CP ENSO.
Ocean‐atmosphere coupling in the subtropical Pacific is crucial for the spread of the NPO‐induced SST anomalies southward into the deep tropics. The coupling processes begin as the SST anomalies off Baja California feed back onto and modify near surface winds via convection. The wind anomalies induced by the convection tend to be located to the southwest of initial subtropical SST anomalies [Xie and Philander, 1994], where new positive
20°N
Lag (–9)
Lag (–6)
Lag (–3)
Lag (0)
Lag (–8)
Lag (–5)
Lag (–2)
Lag (+1)
Lag (–7)
Lag (–4)
Lag (–1)
Lag (+2)
10°N
0°
10°S
20°S
20°N
10°N
0°
10°S
20°S
20°N
10°N
0°
10°S
20°S
20°N
10°N
0°
10°S
20°S
20°N
10°N
0°
10°S
20°S120°E 150°E 180° 150°W120°W 90°W 120°E 150°E 180° 150°W120°W 90°W 120°E 150°E 180° 150°W120°W 90°W
Lag (–12) Lag (–11) Lag (–10)
Figure 1.4 Evolution of tropical Pacific SST anomalies of the CP ENSO. Values shown are SST anomalies regressed on the CP ENSO index from a lag of −12 mo to a lag of +2 mo. The contour interval is 0.1 °C. The HadISST dataset for the period 1948–2010 is used.

14 FORCINGS OF CLIMATE EXTREMES
SST anomalies can be formed through a reduction in evaporation. The atmosphere then continues to respond to the new SST anomalies by producing wind anomalies farther southwestward. Through this wind‐evaporation‐SST (WES) feedback [Xie and Philander, 1994], the SST anomalies initially induced by the NPO off Baja California can extend southwestward into the deep tropics. This series of subtropical Pacific coupling processes is referred to as the seasonal footprinting mechanism [Vimont et al., 2001, 2003, and 2009]. This mechanism also offers a way to explain how the subtropical SST anomalies can be sustained from boreal winter, when extratropical atmospheric variability (e.g., the NPO) is largest, to the following spring or summer to excite CP ENSO events.
As mentioned, the SST anomaly pattern of the subtropical precursor to ENSO (in particular, the CP ENSO) strongly resembles the PMM that is the leading coupled variability mode of the subtropical Pacific. A strong association between the spring PMM index and the following winter’s ENSO index was demonstrated in Chang et al. [2007], who found that a majority of El Niño events
over the past four decades were preceded by SST and surface wind anomalies similar to those associated with the PMM. Recently, the winter SST anomalies in the western North Pacific have been suggested as a subtropical ENSO precursor, which precede ENSO development in the f ollowing year [S.‐Y. Wang et al., 2012, 2013]. There are several ways to link these ENSO precursor‐associated anomalies to the generation of ENSO events in the equatorial Pacific. One explanation emphasizes how the surface wind anomalies associated with the subtropical precursor can directly or indirectly (through the reflection of off‐equatorial Rossby wave in the western Pacific) excite downwelling Kelvin waves along the equatorial thermocline that propagate eastward to trigger El Niño events in the eastern Pacific [e.g., Alexander et al., 2010; S.‐Y.Wang et al., 2012, 2013]. This view appears more related to the onset of EP ENSO events. However, when the subtropical precursor reaches the equatorial Pacific, it can also force a CP ENSO event by interacting with the local ocean mixed layer. Figure 1.6 illustrates this view of how the underlying dynamics of the two types of ENSO
120°E 150°E 180° 150°W120°W 90°W
120°E 150°E 180° 150°W120°W 90°W 120°E 150°E 180° 150°W120°W 90°W
60°N
45°N
30°N
30°S
15°N
15°S
0°
60°N
45°N
30°N
30°S
15°N
15°S
0°
60°N
45°N
30°N
30°S
15°N
15°S
0°
Lag (0) Lag (+2) Lag (+4)
Lag (+6)
Lag (+12)
Lag (+8) Lag (+10)
Figure 1.5 SST anomalies regressed on the NPO index from a lag of 0 mo to a lag of +12 mo. The contour interval is 0.05 °C and only the coefficients exceeding the 99% confidence level are shown. Positive lags denote that the NPO leads the SST anomalies. The National Centers for Environmental Prediction/National Center for Atmospheric Research (NCEP/NCAR) reanalysis [Kalnay et al., 1996] and HadISST datasets for the period of 1948–2010 are used.