geordan murray - housing industry australia - what are the opportunities in building and...
TRANSCRIPT

What are the opportunities in
building and construction?Geordan Murray, HIA Economist
PVC Australia ConferenceMelbourne, May 2016

Global economic conditions
• World economic recovery has stumbled a bit – particularly emerging markets
• The collapse in oil prices has hurt some – but benefitted most
• US interest rates increased late last year and may move again soon
• China risks still weigh most heavily on Australia
• Several geopolitical risks
– ‘Brexit’ vote in June
– Syrian refugee migration to Europe
– President Trump?
• The shadow of debt still looms large globally

Australia’s economy
• GDP grew surprisingly quickly during the final quarter of 2015
– Growth drivers: Household consumption, residential building
– Growth detractor: Engineering construction
• Inflationary pressures are very muted
• The door is open for a further rate cut
• The weaker Australian dollar is making the economy’s traded sectors more
competitive – mining output, but also tourism, education and high skill services
• Residential building is propping growth up…
• …but non-residential construction is still relatively weak

More new homes than ever before
25,000
30,000
35,000
40,000
45,000
50,000
55,000
60,000
Dec
-95
Dec
-96
Dec
-97
Dec
-98
Dec
-99
Dec
-00
Dec
-01
Dec
-02
Dec
-03
Dec
-04
Dec
-05
Dec
-06
Dec
-07
Dec
-08
Dec
-09
Dec
-10
Dec
-11
Dec
-12
Dec
-13
Dec
-14
Dec
-15
Num
ber
Total Dwelling Starts – AustraliaSource: ABS 8752
Seasonally Adjusted Trend

The mix of dwelling types has changed
-
20,000
40,000
60,000
80,000
100,000
120,000
140,000
Dec
-198
6
Dec
-198
7
Dec
-198
8
Dec
-198
9
Dec
-199
0
Dec
-199
1
Dec
-199
2
Dec
-199
3
Dec
-199
4
Dec
-199
5
Dec
-199
6
Dec
-199
7
Dec
-199
8
Dec
-199
9
Dec
-200
0
Dec
-200
1
Dec
-200
2
Dec
-200
3
Dec
-200
4
Dec
-200
5
Dec
-200
6
Dec
-200
7
Dec
-200
8
Dec
-200
9
Dec
-201
0
Dec
-201
1
Dec
-201
2
Dec
-201
3
Dec
-201
4
Dec
-201
5
Mov
ing
Ann
ual T
otal
Dwelling Commencements and Long Term Trends Source: HIA Economics, ABS
Other dwellings (MAT) Detached dwellings (MAT) Other dwellings (long term trend) Detached dwellings (long term trend)
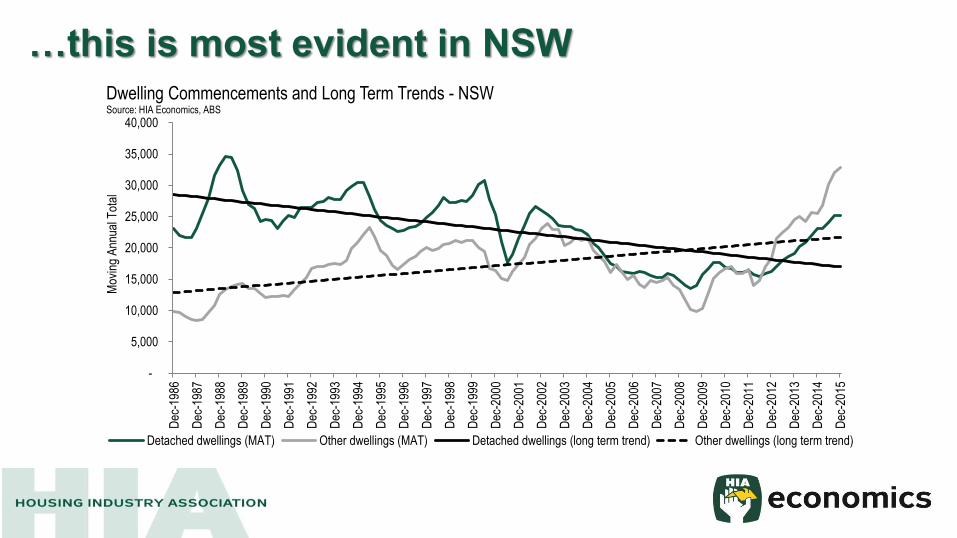
…this is most evident in NSW
-
5,000
10,000
15,000
20,000
25,000
30,000
35,000
40,000
Dec
-198
6
Dec
-198
7
Dec
-198
8
Dec
-198
9
Dec
-199
0
Dec
-199
1
Dec
-199
2
Dec
-199
3
Dec
-199
4
Dec
-199
5
Dec
-199
6
Dec
-199
7
Dec
-199
8
Dec
-199
9
Dec
-200
0
Dec
-200
1
Dec
-200
2
Dec
-200
3
Dec
-200
4
Dec
-200
5
Dec
-200
6
Dec
-200
7
Dec
-200
8
Dec
-200
9
Dec
-201
0
Dec
-201
1
Dec
-201
2
Dec
-201
3
Dec
-201
4
Dec
-201
5
Mov
ing
Ann
ual T
otal
Dwelling Commencements and Long Term Trends - NSWSource: HIA Economics, ABS
Detached dwellings (MAT) Other dwellings (MAT) Detached dwellings (long term trend) Other dwellings (long term trend)

There is a loaded pipeline of multi-unit activity
-
20,000
40,000
60,000
80,000
100,000
120,000
-
5,000
10,000
15,000
20,000
25,000
Mar
-05
Mar
-06
Mar
-07
Mar
-08
Mar
-09
Mar
-10
Mar
-11
Mar
-12
Mar
-13
Mar
-14
Mar
-15
Mar
-16
Snapshot of the Building Activity Pipeline - Flats, units and apartmentsSource: HIA Economics, ABS 8752.0, ABS 8731.0
Under construction (RHS) Approved (1 month lag) Commenced Completed

…and there are more waiting in the wings
-
5,000
10,000
15,000
20,000
25,000
Dec
-01
Dec
-02
Dec
-03
Dec
-04
Dec
-05
Dec
-06
Dec
-07
Dec
-08
Dec
-09
Dec
-10
Dec
-11
Dec
-12
Dec
-13
Dec
-14
Dec
-15
Dwellings Approved but Not Yet CommencedSource: HIA Economics, ABS
Houses Semi-detached, row or terrace houses, townhouses Flats units or apartments

Key risks for residential building:
Key risks for residential building:
– Interest rates
– Labour market
– Foreign investment
– Population growth
– Settlement risk
– Tax ‘reform’
– External shock

What are the possibilities?
187.1 181.3
220.0
174.8
160.8
145.0
114.0
100
120
140
160
180
200
220
240
1994 Peak 2013/14 Level 2015 Record Peak Moderate Cycle Average Cycle Shock Cycle Major Shock
Cyclical Peaks Potential Cyclical Troughs
Dw
ellin
g st
arts
('0
00)
The New Home Building CycleSource: HIA Economics; ABS 8752.0

Outlook for residential building
93.0
115.
8
100.
5
89.6 93
.4
104.
9 113.
9
111.
8
104.
0
97.2
39.6
56.8 61
.9
55.4
69.5 76
.3
100.
4
104.
3
84.9
67.0
0
20
40
60
80
100
120
140
2008/09 (a) 2009/10 (a) 2010/11 (a) 2011/12 (a) 2012/13 (a) 2013/14 (a) 2014/15 (a) 2015/16 2016/17 2017/18
Dw
ellin
g st
arts
('0
00)
Dwelling Commencements Forecast by Dwelling TypeSource: HIA Economics
Detached Houses Multi-unit dwellings
Forecast

Residential building forecasts
Basic forecasts are freely available from the HIA website
– By state
– Detached house, other dwellings, and renovations
– Number of dwellings and value of work
– Five year forecast horizon
Detailed forecasts are available via subscription
– Sub-state regional markets
– Disaggregated across six different dwelling types
– Longer term projections
– Customised forecasts by request
Please contact [email protected] or visit www.hia.com.au

Australian Construction Insights
Australian Construction Insights (ACI) - powered by HIA Economics, is the most reliable place to obtain market research and forecasts, in-depth analysis, and expert presentations regarding the Building and Construction Industry.
ACI is backed by a wealth of experience through our expert team of economists. ACI produces comprehensive and unique insights into the construction industry which can be tailored to your organisation’s needs.
• Specialists in all components of Australia’s construction industry
• Forecasting
• Market Research
• In Depth Analysis
Please contact [email protected] or visit www.aciresearch.com.au

Non-residential building work is easing
0
5,000
10,000
15,000
20,000
25,000
30,000
Jun-
2006
Sep
-200
6
Dec
-200
6
Mar
-200
7
Jun-
2007
Sep
-200
7
Dec
-200
7
Mar
-200
8
Jun-
2008
Sep
-200
8
Dec
-200
8
Mar
-200
9
Jun-
2009
Sep
-200
9
Dec
-200
9
Mar
-201
0
Jun-
2010
Sep
-201
0
Dec
-201
0
Mar
-201
1
Jun-
2011
Sep
-201
1
Dec
-201
1
Mar
-201
2
Jun-
2012
Sep
-201
2
Dec
-201
2
Mar
-201
3
Jun-
2013
Sep
-201
3
Dec
-201
3
Mar
-201
4
Jun-
2014
Sep
-201
4
Dec
-201
4
Mar
-201
5
Jun-
2015
Sep
-201
5
Dec
-201
5
Mar
-201
6
$ m
illio
ns
Work yet to be done Work approved Work done Work commenced
TOTAL NON-RESIDENTIAL BUILDING WORK
Sou
rce:
AC
I, A
BS
873
1.0,
875
2.0

…but not across all sectors
Strengthening:– Factories and other secondary production buildings
– Agricultural and aquacultural buildings
– Entertainment and recreation buildings
– Short term accommodation buildings
– Aged care buildings
Neutral:– Offices
– Retail and wholesale trade buildings
– Health buildings
– Education buildings
– Warehouses
Weakening:– Transport buildings

Engineering work post mining boom
0
20,000
40,000
60,000
80,000
100,000
120,000
140,000
160,000
180,000
Dec
200
5
Mar
200
6
Jun
2006
Sep
200
6
Dec
200
6
Mar
200
7
Jun
2007
Sep
200
7
Dec
200
7
Mar
200
8
Jun
2008
Sep
200
8
Dec
200
8
Mar
200
9
Jun
2009
Sep
200
9
Dec
200
9
Mar
201
0
Jun
2010
Sep
201
0
Dec
201
0
Mar
201
1
Jun
2011
Sep
201
1
Dec
201
1
Mar
201
2
Jun
2012
Sep
201
2
Dec
201
2
Mar
201
3
Jun
2013
Sep
201
3
Dec
201
3
Mar
201
4
Jun
2014
Sep
201
4
Dec
201
4
Mar
201
5
Jun
2015
Sep
201
5
Dec
201
5
Value of work yet to be done Value of work done Value of work commenced
LABOUR MARKET CONDITIONS - AUS
Sou
rce:
AC
I, A
BS
876
2
TOTAL ENGINEERING CONSTRUCTION $
mill
ions

…but it isn’t all negative
Strengthening:
– Roads, highways and subdivisions
Neutral:
– Water storage and supply, sewerage and drainage
– Telecommunications
Weakening:
– Heavy industry
– Bridges, railways and harbours
– Electricity generation, transmission etc. and pipelines
– Recreation and other

Outlook for non-res and engineering
-
20,000
40,000
60,000
80,000
100,000
120,000
140,000
160,000
180,000
2005/0
6 (
a)
2006/0
7 (
a)
2007/0
8 (
a)
2008/0
9 (
a)
2009/1
0 (
a)
2010/1
1 (
a)
2011/1
2 (
a)
2012/1
3 (
a)
2013/1
4 (
a)
2014/1
5 (
a)
2015/1
6
2016/1
7
2017/1
8
va
lue o
f w
ork
don
e (
$m
illio
n)
Engineering construction Non-residential building Total
AUSTRALIAN CONSTRUCTION ACTIVITY OUTLOOK
Source: ACI
Forecast

Summing up
• Household consumption has driven growth
…partly attributable to the wealth effect of rising home prices;
• The peak of the residential building cycle is here;
• We are well into the post-peak contraction in mining investment;
• Non-mining engineering construction demand should be bolstered by public
infrastructure investment;
• Non-mining business investment remains at an ebb;
• In time we’ll see business investment return and this will reignite the latent
sectors of non-residential building construction.

THANK YOU FOR YOUR TIME
Geordan Murray, HIA Economist
economics.hia.com.au