george liu senior thesis
TRANSCRIPT
Improving deterministic lateral displacement toward
nanofractionation of exosomes
George Siyuan Liu
May ,
This paper represents my own work in accordance with University regulations.
Abstract
Over the past two decades, extracellular vesicles have emerged as intercellular messengers
in a broad range of eukaryotic biological processes. These vesicles, the smallest of which
are exosomes - nm in diameter, carry proteins and genetic information with putative
functional roles in tumorigenesis, virology, neurophysiology, and immunology. Significantly,
exosomes appear to function in tumor-stroma interactions influencing cancer metastasis, and
can cross the blood-brain barrier for potential new methods to deliver drugs to the brain.
However, research and therapeutic applications of exosomes are hampered by lack of efficient
and scalable tools for isolating exosomes. The deterministic lateral displacement array, a mi-
crofluidic technology capable of sorting particles based on size, promises a new method for
isolating exosomes with high efficiency and robust yield. A revised design of the deterministic
lateral displacement array, the cascade array, was developed to expand the dynamic range of
the separation process with reduced clogging. Nanometer-scale DLD cascade arrays were then
fabricated and tested to separate nanoparticles. Preliminary results from tests of the cascade
device leave open the possibility that it may be able to fractionate micro- and nanoparticles
such as exosomes, and have laid the groundwork for future investigations into the cascade
array performance.

Acknowledgments
I would like to thank my advisor, Professor Robert Hamilton Austin, for his mentorship during
this year. I would also like to thank Yu Chen, Joseph D’Silva, Amy Wu, Julia Bos, K. C. Lin, and
the rest of the Austin and Sturm groups, with special thanks to Yu for guidance and assistance
with fabricating and testing devices and Joe for help with anodic bonding.
Work was performed at the Princeton University PRISM Micro/Nano Fabrication Labora-
tory, Princeton Microfluidics Facility, and Cornell University NanoScale Science & Technology
Facility. I am grateful to Saurabh Vyawahare for advice on microfluidics, Bert Harrop for help
with dicing wafers, Michael Souza for assistance with cutting glass, and William Dix for fab-
ricating holders for chips in the Princeton facilities. My appreciation also extends to Garry
Bordonaro and John Treichler (photolithography), Meredith Metzler (etching), Amrita Baner-
jee (SEM), and the rest of the CNF staff who helped me make nanoscale bump array chips in
one week at Cornell University.
The Office of the Dean of the College supported this research with a generous award from
the Class of ’ Fund.
This thesis is dedicated to my parents, Da-Ting Liu and Ming Ji, and to my sister, Cici Liu.

Contents
Introduction
Cascade Design
Experimental Methods
Microscale DLD Experiments
Nanoscale DLD Experiments
Conclusion

Chapter
Introduction
. Motive to study exosomes
Cancer is the second leading cause of death in the United States, with over one million new
patient cases and over half a million deaths each year []. The spread of cancer cells from the
primary tumor to other parts of the body, known as metastasis, accounts for at least % of
cancer deaths in the United States []. Although early detection of metastasis is crucial for
cancer treatment, it is nearly impossible in some cases with current clinical methods. More-
over, the exact biology and physics that drives cancer cell metastasis is not fully understood,
limiting the development of drugs and therapies for preventing metastasis.
Recent studies on the role of tumor-stroma interactions via cell-derived extracellular vesi-
cles known as exosomes, has shed light on a novel aspect of the tumor microenvironment’s
contribution to cellular pathways promoting metastasis []. Elucidating the function of ex-
osomes in intercellular communication may therefore reveal previously overlooked facets of
metastasis as well as other exosome-involved physiological processes.
Exosomes are approximately - nm vesicles released from most if not all eukaryotic
cells []. They appear to derive from multivesicular bodies in cells and release via fusion
with the cell membrane. Exosomes contain functionalized membrane receptors [], RNA
and miRNA [], and DNA [] [], allowing the delivery of oncogenes and regulatory small
RNAs to affect genetic expression in target cells. The putative function of exosomes in gene
Deterministic lateral nanofractionation Chapter . Introduction |
regulation through the delivery of regulatory miRNAs is still an area of active research with
numerous open questions []. Further studies with standardized purification methods are re-
quired to replicate results across laboratories and validate several of the claims about exosome
functional roles.
A major obstacle in the study of exosomes is the lack of a standardized, efficient purifica-
tion protocol. The current gold standard is centrifugation followed perhaps by sucrose density
gradient separation []. This method is long and labor intensive, however, requiring hours
of centrifugation and often weeks of cell culturing to obtain sufficient quantity of media and
exosomes. Moreover, the large and expensive equipment needed for these steps precludes
the ready application of these methods for isolating exosomes in clinical settings for poten-
tial new exosome-based diagnostics or therapies. Biotechnology companies have developed
various reagents to purify exosomes with reduced or no centrifugation; however these meth-
ods utilize antibodies, biasing selection based on the presence of specific antigens that may be
missing on some kinds of vesicles.
Microfluidics overcomes these issues in two ways. First, hydrodynamic sorting with flow
rates on the order of µL/s could allow rapid, unbiased sorting of particles based on their
size. Deterministic lateral displacement (DLD) accomplishes this as described below. Second,
the high efficiency of DLD separation could potentially reduce the required initial sample
volume for extracting sufficient quantities of exosomes. Microfluidic devices are also small
and relatively inexpensive, making them easy to be prepackaged, shipped, and utilized in
areas of need across the world. Indeed, the potential applications of microfluidics to rapid
on-site diagnostics has led to the founding of several startups such as Diagnostics For All.
There have been numerous attempts so far to isolate exosomes using microfluidic meth-
ods. Most of these microfluidic “exo-chips” use antibodies attached to the device surface or
to beads inside the chip to target antigens that are enriched in most exosome membranes
[][][][]. An issue with this method is that exosomes generally exhibit different anti-
gens depending on their cell of origin, requiring such devices to be specifically tailored to
the exosome population of interest. As the antigen markers are often present in other cells
or biological particles in the fluid as well, there is also the complication of accidentally iso-
lating non-exosome contaminants. Furthermore, such immunoaffinity-based methods often
require an additional step to elute the exosomes after they are bound to the device before

Deterministic lateral nanofractionation Chapter . Introduction |
subsequent isolation and characterization. An alternative microfluidic platform has been de-
veloped to capture exosomes using flow through columns of porous silicon nanowires, which
preferentially trap objects within the size range of exosomes []. However in order to release
the exosomes for further analysis, the system requires a rinse of PBS to dissolve the ciliated
pillars, precluding reuse of the device.
Deterministic lateral displacement offers an attractive method to overcome the limitations
of previous microfluidic attempts to isolate nanovesicles based on size. The technology has
previously been applied to sort DNA [], circulating tumor cells [][], viruses [], and
blood cells [] with numerous potential clinical applications. Because size is a defining charac-
teristic of not only exosomes but also other classes of vesicles and vesicle-like bodies released
from cells with hypothesized functions in intercellular communication, deterministic lateral
displacement also promises a way to fractionate different types of vesicles and vesicle-like ob-
jects in order to elucidate their differences. All of these factors suggest the potential for deter-
ministic lateral displacement to isolate and study exosomes and other biological nanoparticles
in the future.
. Deterministic Lateral Displacement
Deterministic lateral displacement (DLD), also known as the bump array, uses laminar flow in
a microfluidic channel to separate particles of different sizes. The technology was developed
in and has gone through a number of improvements, but the basic principle of operation
has remained the same: pillars push large objects in the fluid flow to the wall, allowing their
collection in a separate outlet from smaller particles. The geometry of the pillar array and the
nature of fluid mechanics at the micrometer length scales typical of flow in the microfluidic
device determine the size threshold for separation.
The bump array consists of an asymmetric array of posts resembling an obstacle lattice
tilted with respect to the flow direction (Figure .). The example diagram shows an array of
posts with post-to-post distance λ and horizontal offset ελ between rows, where ε is the row
shift fraction (Figure .A). Here the row shift fraction is ε = 1/3. As long as 1/ε is an integer,
the post lattice repeats after 1/ε rows. The periodicity and symmetry of the array creates 1/ε
distinct lanes in the gaps between posts (Figure .B). The lane positions permute in the gaps

Deterministic lateral nanofractionation Chapter . Introduction |
of subsequent rows such that the lanes return to their original configuration after 1/ε rows .
The formation of lanes can be understood as follows. To maintain the vertical flow direction
downwards, the flux of fluid Φ through any gap between two horizontally adjacent posts must
rejoin in the corresponding gap 1/ε rows downstream (Figure .B). By symmetry, the flux of
fluid to the left at each bifurcation around a post is the same at every row. Since there are 1/ε
intervening bifurcations between the two corresponding gaps, the fluid flux to the left at each
bifurcation must be εΦ , resulting in 1/ε distinct lanes of fluid flux.
Figure .: Basic concept of the bump array. (A) The geometry consists of staggered rows of
posts horizontally spaced with a center-to-center period λ and gap size d between posts. Each
row of posts is shifted from the previous row by a fraction ε of the post period (here ε = 1/3).
The red arrow indicates the downward average direction of fluid flow. (B) Streamlines form
1/ε lanes which permute at each row of obstacles. Particles following the streamlines return
to their original lane after 1/ε permutations. (C) Particles of radii larger than the width of
the first lane are bumped into the second lane at each row of obstacles. Figure adapted from
Huang et al., [].
For laminar flow typical in microfluidic devices (described in section .), a particle’s center
of mass tends to follow the streamline occupied by the particle in the fluid flow. The particle
is displaced from its streamline however at points of contact with posts. Consider the flow
of particles in the first lane of a gap (Figure .C). Particles with radii larger than the width
of the first lane cannot fit and are pushed by the post into the second lane. Since the second

Deterministic lateral nanofractionation Chapter . Introduction |
lane becomes the first lane in the next row, the particle displacement continues at all rows
downstream, effectively locking the particle into a “bump mode” trajectory that runs at an
angle arctan(ε) ≈ ε from the average fluid flow direction (generally ε � 1). The width of the
first lane therefore determines the critical diameter above which particle separation occurs.
Particles below the critical diameter follow a “zig-zag mode” trajectory with net displacement
downards, and particles above the critical diameter follow a “bump mode” trajectory that lies
at an angle ε from the smaller objects’ trajectory.
It turns out that the critical diameter Dc can be determined analytically []. Since the
widths of the lanes sum to the gap size and the number of lanes is related to the row shift
fraction ε, the critical diameter (and width of the first lane) is a function of only the gap size
G, row-shift fraction ε, and post shape []. For circular posts, the critical diameter is given
approximately by []
Dc ≈ 1.4Gε0.48. (.)
Tables for common gap sizes and row shift fractions for circular and triangular posts, and their
corresponding critical diameters, are available in the literature [].
Previously, deterministic lateral displacement has been applied to sort erythrocytes, leuko-
cytes, and platelets in blood plasma using arrays with a smallest gap size of µm []. Next
we consider separating objects smaller than µm by moving the bump array gap size into the
nanoscale.
. Moving towards nanoscale
Deterministic lateral displacement (DLD) offers the potential for continuous isolation of parti-
cles even at the nanoscale. However diffusion is expected to play a more significant role in the
nanoscale deterministic lateral displacement (nano-DLD) array compared to in the microscale
deterministic lateral displacement (micro-DLD) array. One worry is that particle trajectories
will no longer be deterministic because of the effects of stochastic diffusion across flow lanes.
The smaller particles of interest in nano-DLD sorting will tend to have higher diffusion effects
because () their diffusion coefficients are higher (Eq. .) and () they have a shorter distance
to travel to cross flow lanes.
We can quantitatively describe the effects of diffusion in the nano-DLD using physics. The

Deterministic lateral nanofractionation Chapter . Introduction |
influence of diffusion on the deterministic nature of DLD separation is related to the Péclet
number Pe, which is the ratio of the diffusion time to the advection time for a particle to travel
a distance l,
Pe =tdiffusion
tadvection=l2/2Dl/U
=lU2D
, (.)
where D is the particle’s diffusion coefficient and U is the flow velocity. At higher Pe one ex-
pects diffusion to exhibit less influence on the deterministic separation process. Although the
Péclet number starts quite high for microfluidic DLD systems, it drops rapidly as we approach
the nanoscale because the Péclet number scales as the distance squared. To see this, we need to
know the relationship between the diffusion coefficient of a spherical particle and its radius.
We are generally interested in the time for a particle to travel a distance l proportional to its
radius a. The diffusion coefficient for a sphere is given by the Einstein equation [][]
D =τγ, (.)
where τ is the absolute temperature in units of energy, equal to kBT where kB ≈ 1.4×10⁻²³ J/K
is Boltzmann’s constant and T is the conventional temperature in units of Kelvin, and γ is the
drag coefficient of the particle. The drag on a sphere is given by Stokes’s law
FD = γU = 6πµaU, (.)
where FD is the drag force on the sphere, µ is the fluid viscosity, and the drag coefficient γ is
γ = 6πµa. (.)
Combining this fact with the Einstein equation yields the Einstein-Stokes equation
Dsphere =kBT
6πµa. (.)
From the Einstein-Stokes equation (Eq. .), we see that D ∝ a−1. Since we are interested in
the time for a particle to travel roughly its diameter l ∝ a, we see that the Péclet number (Eq.
.) scales as the square of the particle radius times the flow velocity,
Pe ∝ a2U. (.)
This quantitative scaling argument suggests that the Péclet number associated with sorting
exosomes (Dp = 100 nm) will be about 10−4 that of sorting red and white blood cells (Dp ∼

Deterministic lateral nanofractionation Chapter . Introduction |
10 µm) for the same flow velocity. The role of diffusion therefore quickly takes on an important
role as we approach the nanoscale.
Let us put in actual numbers to calculate the Péclet number (Eq. .). For τ ≈ 4.2× 10⁻²¹ J
at room temperature and γ ≈ 1 × 10⁻⁹ Pa s m for a particle radius of a = 50 nm and dynamic
viscosity of water of µHO = 10−3 Pa s, we find that D ≈ 4.2 × 10⁻¹² m2/s. The average flow
velocity is about 1 mm/s for a flow rate of 1 µL/hr through the nanoscale bump array, which
has a cross sectional area of about 3× 10⁻⁴ mm2 for a height of 0.5 µm (Figure .) and width
of mm. Therefore the Péclet number for a nm particle to travel the length of its diameter
under these conditions in the nano-DLD is approximately
Pe =aU
Dsphere=
(10−7 m)(10−3 m/s)4.2× 10−12 m2/s
≈ 20. (.)
This is in agreement with estimates from recent experiments on sorting nm beads in nano-
DLD arrays at flows speeds of µm/s where Pe ∼ 0.58 [], using the scaling relationship
derived above for the Péclet number.
Collaboration with IBM has yielded some of the first experimental insights into the effects
of diffusion on lateral separation in nano-DLD devices. Nanoscale bump arrays were used
to separate - nm beads with gap sizes of to nm []. Results suggest particles
near the critical diameter may exhibit a continuum of deflection angles dependent on particle
radius . This non-binary separation behavior of nano-DLD arrays is temporarily associated
with the increasing influence of diffusion in the nano-bump arrays where the Péclet number
is on the order of unity. Diffusion may therefore deflect particles at angles proportional to
their particle size, allowing one gap size to differentially separate a polydisperse mixture of
nanoparticles.
To take advantage of the possible “prism” effect of diffusion in the nano-DLD to isolate
exosomes and other nanoparticles from an inhomogenous sample such as blood, it is important
to be able to collect and remove larger particles as they are displaced toward the wall of the
device. The IBM experiments demonstrate the feasibility of applying DLD to sort particles
at the nanoscale. In order to build on their work, this thesis explores the cascade DLD design
which uses outlet ports along the the length of the device to sequentially remove large particlesTheoretical analyses have also suggested the possibility of diffusion giving rise to a continuum as opposed to
binary separation of particles in the nanoscale regime of DLD [] []. This possibility appears to be consistent with
recent experiments at IBM [].
Deterministic lateral nanofractionation Chapter . Introduction |
from the active region of the DLD. The cascade design promises a method to collect particles
as they are separated, allowing differential purification following separation and eliminating
clogging downstream in the DLD. The cascade design offers the promise of making the nano-
DLD useful in the clinical setting to isolate and characterize exosomes for onsite diagnostics.
The following chapters develop the design of the cascade array to reduce clogging in the
DLD array. After discussing the physics and design principles of the cascade array, we look at
preliminary experiments with micro-DLD and nano-DLD cascade chips to test the separation
efficiency of the cascade array for fractionating particles and nanoparticles on the size scale of
exosomes.
Chapter
Cascade Design
Deterministic lateral displacement has been successfully applied to sort a broad range of ob-
jects from nanometer scale DNA [] to micrometer scale circulating tumor cells [] [].
However most of these prototypes illustrate the ability of DLD to sort one type of object with
a single threshold diameter. Often there is a need to differentially sort particles with different
sizes especially for processing heterogeneous fluids such as blood. Occasional there have been
efforts to separate a range of particle sizes in one DLD device using multiple threshold diam-
eters []. However the dynamic range, the ratio of the largest to smallest critical diameter, in
the DLD has been limited to about even with rather complicated designs such as the open
cascade design described below []. Increasing the dynamic range of DLD is a priority for ef-
ficiently separating and characterizing a broad range of particles, and a necessary step toward
isolating nanometer sized exosomes from human blood and urine in one DLD chip.
Increasing the dynamic range of DLD also indirectly addresses the issue of clogging, a ma-
jor challenge in applying DLD to potential commercial applications. The smallest gap size in
the DLD sets the maximum particle diameter that can flow through the bump array without
clogging. Unfortunately, if one particle clogs a gap, the disruption in laminar flow tends to
alter the local flow direction and perturb lateral separation. Expanding the function of indi-
vidual DLD devices to process and handle fluid samples containing a broad range of particle
sizes would increase the reliability and lifetime of DLD when many different kinds of fluid
samples are required for analysis.

Deterministic lateral nanofractionation Chapter . Cascade Design |
This chapter presents the case for using the cascade DLD design to expand the dynamic
range of DLD separation without clogging. The details of the cascade design and its advan-
tages over alternative approaches is discussed. Following a physical introduction to fluidic
resistance calculations for flow in a variety of channel geometries, the cascade design prin-
ciples and parameters are introduced, with the aim of maintaining vertical flow in the DLD
while removing fluid at intermediate output ports. Finally the specific cascade designs used
for fabricating micro- and nano-DLD devices for experiments are described.
. Choosing the cascade design over alternatives
A number of alternative DLD designs have been proposed and used to increase the dynamic
range of DLD separation. Three of the most straightforward modifications are the multiple
array, the chirped array, and the cascade array (Figure .). Because the critical diameter is
a function of the gap size and row shift fraction, these three approaches can be understood
within the paradigm of adjusting these two parameters while ensuring the maximum particle
diameter in any given array is less than the gap size. In this section, I argue that the cascade
design stands out among the three alternatives under consideration here for its flexibility and
scalability for potentially sorting nanoscale and microscale particles in one device.
The multiple array design adjusts the gap size and row shift fraction to create multiple
critical diameters in sequential sections along the length of the DLD (Figure .A). This design
however fails to address the problem of clogging. Large particles are simply pushed to the
wall, and are still size-limited by the smallest gap size in the entire array. Moreover large
particles accidentally introduced into the DLD will clog the device and terminate the current
run, requiring the DLD chip to be disassembled and the procedure restarted. The dynamic
range of the multiple array is limited to an order of magnitude of unity, or about when it was
introduced upon the discovery of DLD for sorting .-. µm beads []. All of these factors
make the multiple array a low dynamic range and inefficient tool for fractionating complex
fluids.
The chirped design (Figure .B) directly addresses the issue of clogging in the multiple
array by fixing the gap size and adjusting the critical diameter by only varying the row shift
fraction. The minimum gap size is constant throughout the device, so any particle that enters
Deterministic lateral nanofractionation Chapter . Cascade Design |
the chirped DLD should in principle be able to exit without clogging. The dynamic range of
the chirped array is limited to about - []. Because all particles flow through the full length
the device, the diameter range is still constrained to be no larger than the smallest gap size in
the entire chirped design.
The cascade design overcomes the limitations of the multiple and chirped arrays by intro-
ducing exit ports along the sidewall of the DLD device. These side ports allow large particles
to exit after they are displaced but before the next array starts (Figure .C). The gap size and
row shift fraction are adjusted to create a decreasing critical diameter gradient along the flow.
Large particles are displaced first and removed from the active region. Subsequently smaller
particles are displaced to the wall and removed, and so on. By adjusting the lengths of the
exit channels, the pressure distribution in the main array can be calibrated to maintain verti-
cal flow. The calculations for determining the fluidic resistances of exit channels and bump
arrays for matching impedances is the subject of section .. In principle the cascade design
can achieve infinite dynamic range, but in practice the dynamic range is limited by the length
of the device required to sequentially push objects to the sidewall. Because of the advantages
of the cascade design for expanding dynamic range of separation while avoiding clogging, the
cascade design was chosen for further testing among the alternatives proposed here.
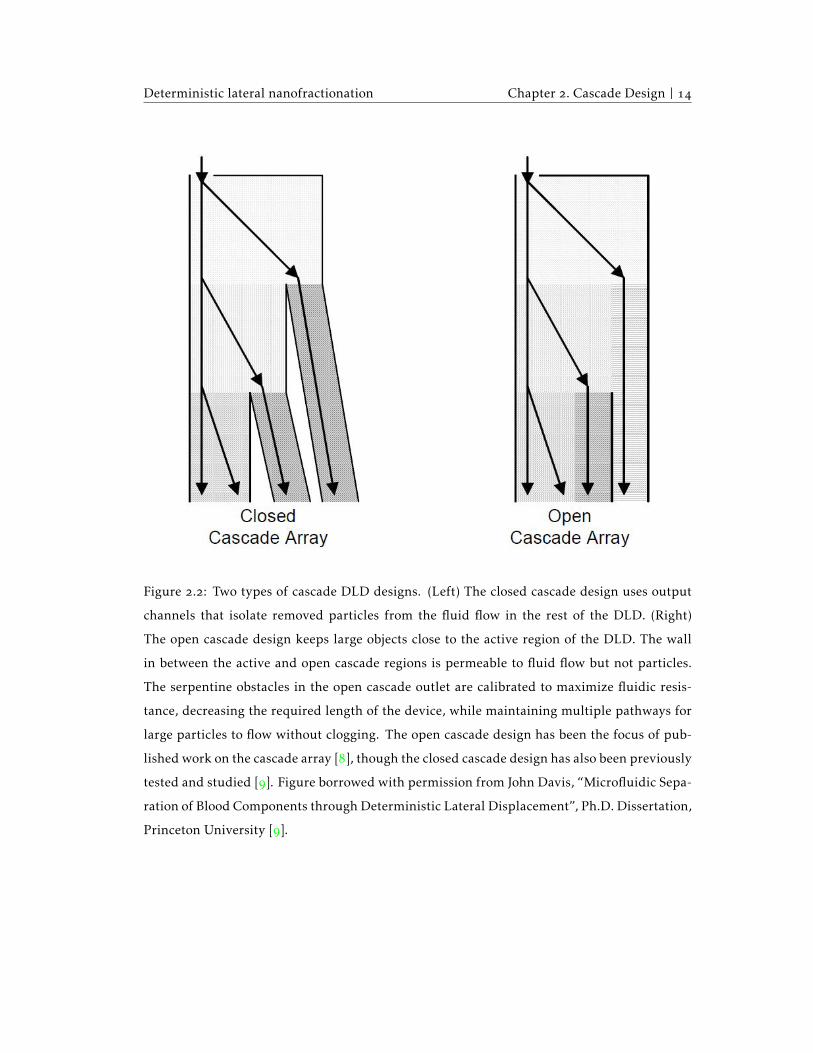
There are two types of cascade designs. The closed cascade has isolated output channels
running from the side which remove large particles from each region of the DLD (Figure .,
left). The open cascade holds large particles to the right of the active region in a serpentine
channel separated by a wall that allows fluid exchange between the active and serpentine
regions (Figure ., right). The main advantage of the open design is that it reduces the number
of side exits and reduces the perturbations on flow in the main channel. However it does not
fractionate large particles; it merely sequesters them from the active region. Moreover the
serpentine design requires complex calculations to balance fluidic resistance with the main
array because the width and length of the serpentine channel must be adjusted together. The
complicated and unintuitive design of the open cascade array may have discouraged its study
after its initial report []. This chapter seeks to develop the concept of the closed cascade
design which was chosen for experiments in micro- and nano-DLD devices as described in
chapters and .
Deterministic lateral nanofractionation Chapter . Cascade Design |
Previous work on the cascade design
Initial work on the cascade array focused on the open design [][]. At first the open cascade
appeared to be superior to the closed design because of a clogging issue in the closed design [].
The problem with the initial closed design was that the side outputs were each splintered into
narrow, parallel channels of width on the order of the diameter of cells being separated [].
The purpose of this outlet design may have been to support the PDMS seal from collapsing into
the channel. However a single cell could clog in the narrow splintered channel and disrupt
flow in the main region of the closed DLD device []. To improve the closed cascade using
ideas from the open design, John Davis suggests,
In the future, a combination of the two designs might work best. A larger region
than the closed design should be open to allow for the collection of cells. Then
a closed, but serpentine region to follow will have the advantages of both types.
From the open design, it will not clog easily because the serpentine region will
have multiple wider paths and from the [closed] design, since it is closed off from
the post array, it will not continue to [affect] the streamlines as much in that region.
[]
To avoid the issue of clogging in the closed cascade, closed designs in this work use rect-
angular side channels that are not splintered. This closed design is likely to succeed as we
move to the nanoscale here for two reasons. First, the stability of the channel ceiling depends
on the width of the channel, so that even as the aspect ratio of channels is maintained in the
nanoscale the seal should have enough support in exit channels without extra walls that could
increase clogging. Second, the nano-DLD chips in this work are sealed by anodic bonding to
borosilicate glass which is stronger than PDMS and less prone to collapsing. These features
of the nano-DLD devices herein allow for wider side channels than in the closed cascade de-
vices tested previously. The wider side channels should reduce the issue of clogging during
fractionation in the closed cascade design.

Deterministic lateral nanofractionation Chapter . Cascade Design |
Figure .: Cascade design principle for separating a polydisperse mixture of particles. (A)
Multiple bump arrays in series sort particles of different sizes by adjusting the gap size and
row shift fraction. The decreasing gap size required to displace smaller particles reduces the
maximum size of particles that can flow through the device to the outputs at the end, which
may result in clogging if the multiple array is not designed carefully. (B) The chirped array
fixes the gap size and changes only the row shift fraction. The advantage is that all arrays can
handle the same maximum particle size, reducing the likelihood of accidentally clogging the
chirped array during fractionation. The disadvantage is that the fixed gap size restricts the
dynamic range to about - []. (C) The cascade array build on the concept of the multiple
array to sort a large dynamic range (theoretically unlimited) using intermediate output chan-
nels to remove large particles from the active region as they are sorted. The gap size can be
adjusted so long as the remaining particles in the active region do not have radii exceeding
half the gap size. Figure borrowed with permission from John Davis, “Microfluidic Separa-
tion of Blood Components through Deterministic Lateral Displacement”, Ph.D. Dissertation,
Princeton University [].
Deterministic lateral nanofractionation Chapter . Cascade Design |
Figure .: Two types of cascade DLD designs. (Left) The closed cascade design uses output
channels that isolate removed particles from the fluid flow in the rest of the DLD. (Right)
The open cascade design keeps large objects close to the active region of the DLD. The wall
in between the active and open cascade regions is permeable to fluid flow but not particles.
The serpentine obstacles in the open cascade outlet are calibrated to maximize fluidic resis-
tance, decreasing the required length of the device, while maintaining multiple pathways for
large particles to flow without clogging. The open cascade design has been the focus of pub-
lished work on the cascade array [], though the closed cascade design has also been previously
tested and studied []. Figure borrowed with permission from John Davis, “Microfluidic Sepa-
ration of Blood Components through Deterministic Lateral Displacement”, Ph.D. Dissertation,
Princeton University [].

Deterministic lateral nanofractionation Chapter . Cascade Design |
. Laminar flow
Why do particles trace the streamlines of fluid flow in the deterministic lateral displacement
device? More generally, why are the particle trajectories deterministic, even able to be pre-
dicted using computational software? The key physical feature of flow in the bump array is
the small scale of the characteristic length over which flow speeds change, i.e. the gap size.
The small length scales associated with flow in deterministic lateral displacement results in
laminar flow, or low Reynolds number flow, which is marked by the absence of turbulence.
In this laminar regime, particles tend to follow streamlines in the fluid flow and move in a
predictable, deterministic manner.
.. Low Reynolds number flow
The governing equations of fluid flow are the Navier-Stokes equations, a form of Newton’s
second law applied to the continuum mechanics problem of fluid motion [] []. For a
Newtonian fluid with constant viscosity µ and density ρ, i.e. incompressible flow, the Navier-
Stokes equations are
ρ
(�u�t
+ u ·∇u)
= −∇P +µ∇2u, (.)
with the continuity equation for mass conversation of incompressible flow
∇ ·u = 0. (.)
Often times we consider only steady flow where the flow velocity does not change over time at
a given location in the laboratory frame of reference. For steady flow, �u�t = 0 on the left hand
side of Eq. .
The Navier-Stokes equation in the form written in Eq. . can account for external forces
such as gravity by changing the pressure P to the "dynamic" pressure Pd = P − ρg · r, where
r is the position vector. Effects due to gravity and other body forces are generally absent in
microfluidic flow configurations considered here in the absence of strong electric fields.
We can gain some insight into the scaling of the Navier-Stokes equations at small length
scales by non-dimensionalization. At the length scales of flow through the deterministic lateral
The second term on the left hand side of Eq. . contains the tensor ∇u. The entire term is equivalent to (u ·∇)u
without the tensor notation.

Deterministic lateral nanofractionation Chapter . Cascade Design |
displacement device, the characteristic pressure (and shear stress) is µU/l where U is a typical
flow speed and l is the typical length over which the veloctiy changes from its maximum to its
minimum value. Denoting dimensionless variables with a tilde (˜), and using the characteristic
pressure Pc = µU/l and time tc = l/U , we find that
u = u/U, (.)
∇ = l∇, (.)
P = P /Pc, (.)
t = t/tc, (.)
and that the non-dimensionalized form of the Navier-Stokes equation reduces to
Re
(�u�t
+ u · ∇u)
= −∇P + ∇2u, (.)
where the Reynolds number Re is the one dimensionless parameter characterizing the equa-
tion. The Reynolds number is equal to
Re =ρUl
µ. (.)
A typical flow speed U is mm/s and the typical length scale l in the deterministical lateral
displacement device is proportional to the post spacing, which for the nanometer-scale array
is about µm ( µm for the microscale array). These typical dimensions, combined with
µH2O = 10−3 kg/(m · s) and ρH2O = 103 kg/m3 yield Re = 10−3. In these cases where Re� 1, the
left hand side of the Navier-Stokes equation (Eq. .) can usually be neglected, yielding the
low Reynolds number approximation of the Navier-Stokes equation,
0 = −∇P +µ∇2u, (.)
which is written in dimensional form.
. Fluidic resistance
The cascade design requires the pressure drop along the path to each output to be the same to
maintain vertical flow. As shown in Figure ., particles removed from the first bump array

Deterministic lateral nanofractionation Chapter . Cascade Design |
require flow with enough resistance in the side channel for the pressure drop to be equal to
the drop across the rest of the arrays. Analytical results for the fluidic resistance of the bump
array and output channels are therefore necessary for correctly designing cascade arrays with
proper pressure drops along all paths.
.. Poiseuille flow in a cylindrical pipe
Consider parallel flow through a pipe of radius a with a pressure drop ∆P over a length L
(Figure .). We solve the Navier-Stokes equations (Eq. .) in cylindrical coordinates to find
the velocity profile u = u(r)z, where z is the direction of fluid flow along the pipe axis. Note
that this velocity distribution automatically satisfies the continuity equation (Eq. .), and
u · ∇u = u(r) �u(r)�z z = 0 such that the left hand side of the Navier-Stokes equation (Eq. .)
would vanish for parallel steady flow even without the low Reynolds number approximation,
0 = −∇P +µ∇2u. (.)
Figure .: Poiseuille flow through a cylindrical pipe of radius a, with pressure drop ∆P over
length L. Flow is directed along the positive z-axis as indicated by the blue arrows.
Equation . is an exact form of the Navier-Stokes equation for rectilinear flow with a
parallel flow profile that varies only perpendicular to the direction of flow. A feature of the
rectilinear Navier-Stokes equation is that the x-component
0 =�P
�x, (.)

Deterministic lateral nanofractionation Chapter . Cascade Design |
and y-component
0 =�P
�y, (.)
force pressure to vary only along the flow direction, here P = P (z). As a result, the z-component
of u in Eq. . can be solved using integration with respect to z. Using no-slip boundary
conditions u(a) = 0 and symmetry at the center �u�r
∣∣∣r=a
= 0, and equating −dPdz = ∆PL , we find
that
u(r) =∆P4µL
(a2 − r2), (.)
where we have used the cylindrical form of the Laplace operator, ∇2 = 1r��r (r ��r )) + 1
r2�2
�θ2 + �2
�z2 .
Integrating the velocity profile to find the flow rate Q (units of volume per second),
Q =∫ 2π
0
∫ a
0u(r)rdrdθ =
πa4∆P8µL
, (.)
we find, applying the relation ∆P =QR where R is the fluidic resistance of Poiseuille flow in a
pipe, that the fluidic resistance in pipe flow is
R =8µLπa4 . (.)
.. Parallel flow in a rectangular channel
Consider steady, parallel flow through a squat rectangular channel of width w and height h
(h� w) (Figure .). Let flow be directed along the direction of z such that u = u(x,y)z. As for
Poiseuille flow, u ·∇u = 0 on the left hand side of the Navier-Stokes equation (Eq. .) because
flow is parallel and symmetric along z. The governing equation therefore reduces to Eq. .
again. In particular, since pressure changes only in the z-direction, dPdz = −∆P
L , where ∆P is
the pressure drop across a channel length L. Altogether the governing equation (Eq. .)
becomes,
µ
(�2u
�x2 +�2u
�y2
)= −∆P
L, (.)
with four no-slip boundary conditions at the walls,
u
(± w
2, y
)= 0, (.)
Deterministic lateral nanofractionation Chapter . Cascade Design |
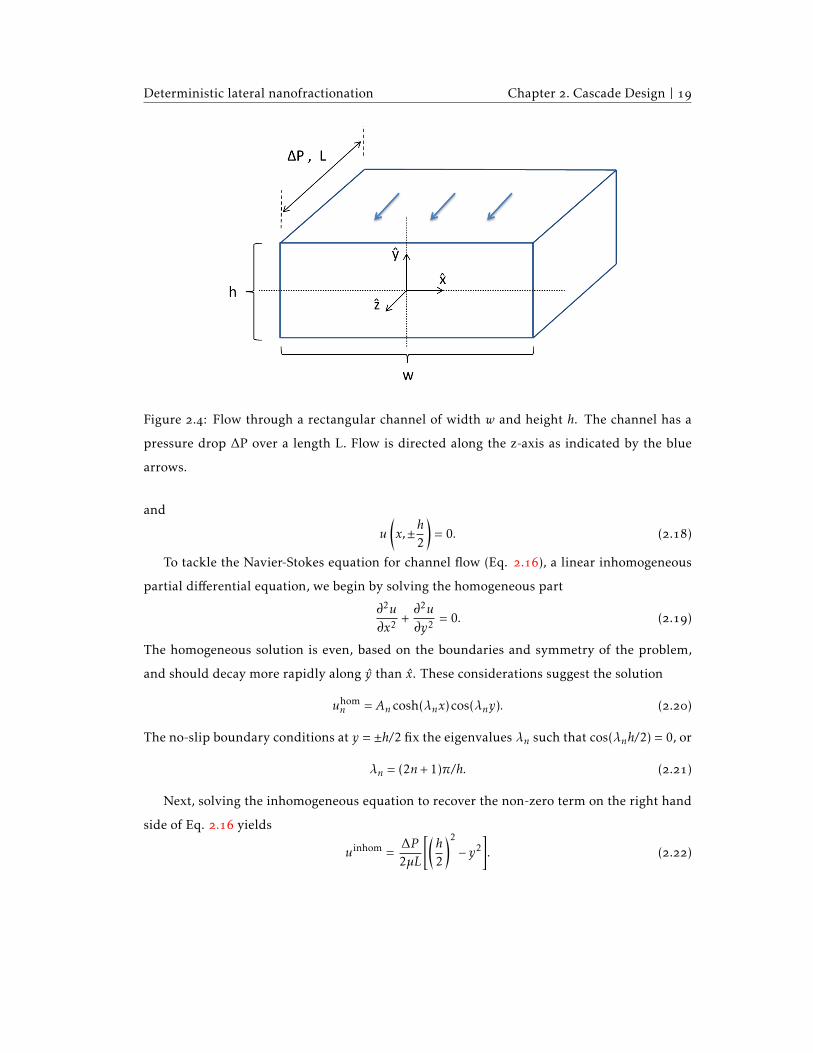
Figure .: Flow through a rectangular channel of width w and height h. The channel has a
pressure drop ∆P over a length L. Flow is directed along the z-axis as indicated by the blue
arrows.
and
u
(x,±h
2
)= 0. (.)
To tackle the Navier-Stokes equation for channel flow (Eq. .), a linear inhomogeneous
partial differential equation, we begin by solving the homogeneous part
�2u
�x2 +�2u
�y2 = 0. (.)
The homogeneous solution is even, based on the boundaries and symmetry of the problem,
and should decay more rapidly along y than x. These considerations suggest the solution
uhomn = An cosh(λnx)cos(λny). (.)
The no-slip boundary conditions at y = ±h/2 fix the eigenvalues λn such that cos(λnh/2) = 0, or
λn = (2n+ 1)π/h. (.)
Next, solving the inhomogeneous equation to recover the non-zero term on the right hand
side of Eq. . yields
uinhom =∆P2µL
[(h2
)2
− y2]. (.)
Deterministic lateral nanofractionation Chapter . Cascade Design |
Therefore, using Fourier series and the boundary conditions at x = ±w/2 to determine the
coefficients An, the complete solution for the velocity profile is
u(x,y) =∆P2µL
[(h2
)2
− y2 −∞∑n=0
An cosh(λnx)cos(λny)], (.)
where
An =8(−1)n
λ3nhcosh(λnw/2)
, (.)
and λn = (2n+ 1)π/h as before.
To derive the fluidic resistance of the channel flow, we find the volumetric flow rate is
Q =∫ w/2
−w/2
∫ h/2
−h/2u(x,y)dydx =
wh3∆P12µL
[1− 6
wh4
∞∑n=0
32
λ5n
tanh(λnw/2)]. (.)
From the pressure-flow rate relationship ∆P =QR, the fluidic resistance of the channel can be
written as
R =12µL
wh3[1− h
w
∑· · ·
] , (.)
where λn ∝ h−1 was used to derive the h/w structure of the second term in the denominator.
For squat channels where h� w, the fluidic resistance of the channel becomes approximately
R ≈12µLwh3 , (h� w). (.)
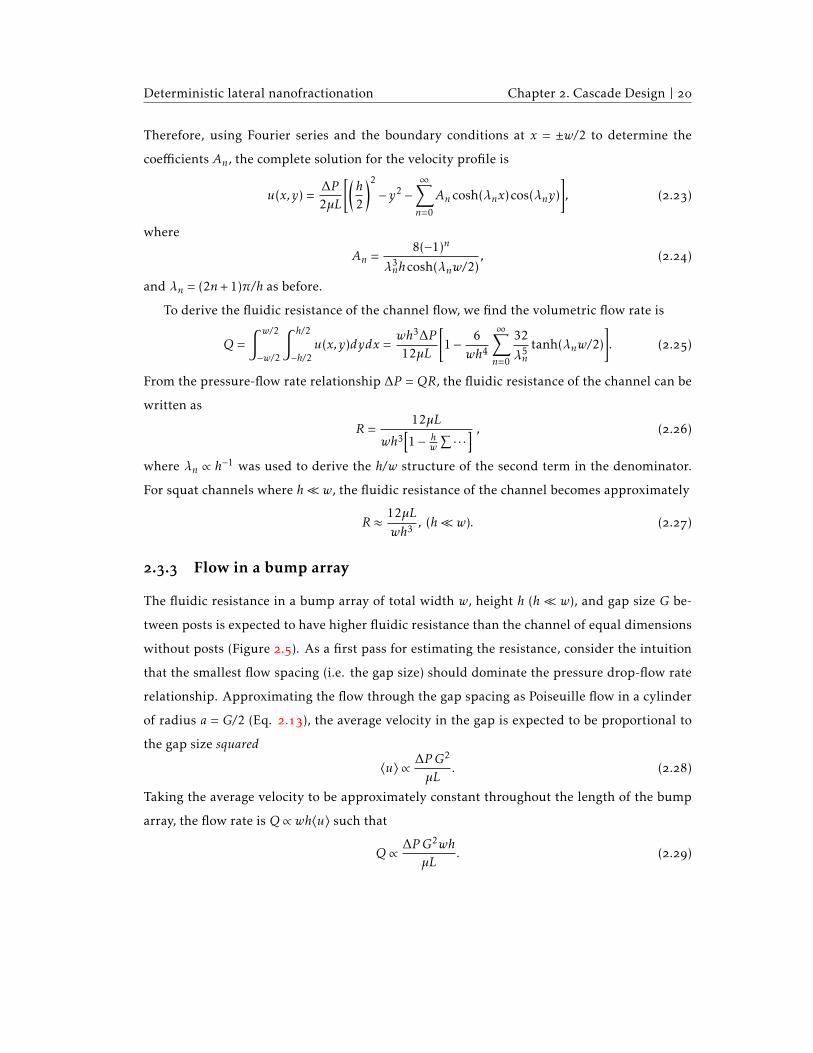
.. Flow in a bump array
The fluidic resistance in a bump array of total width w, height h (h� w), and gap size G be-
tween posts is expected to have higher fluidic resistance than the channel of equal dimensions
without posts (Figure .). As a first pass for estimating the resistance, consider the intuition
that the smallest flow spacing (i.e. the gap size) should dominate the pressure drop-flow rate
relationship. Approximating the flow through the gap spacing as Poiseuille flow in a cylinder
of radius a = G/2 (Eq. .), the average velocity in the gap is expected to be proportional to
the gap size squared
〈u〉 ∝ ∆P G2
µL. (.)
Taking the average velocity to be approximately constant throughout the length of the bump
array, the flow rate is Q ∝ wh〈u〉 such that
Q ∝ ∆P G2whµL
. (.)

Deterministic lateral nanofractionation Chapter . Cascade Design |
Figure .: Flow through a bump array of width w, etch depth h (not drawn), gap size G, and
post-to-post spacing λ. The array has a pressure drop ∆P over a length L. Blue arrow indicates
the downward direction of the average fluid velocity.
It follows, by the pressure-resistance relationship R = ∆P /Q, that the resistance in the bump
array scales as
R ∝µL
G2wh. (.)
Without detailed calculations, we have arrived at a quantitative scaling relationship for the
fluidic resistance of the bump array with respect to the gap size and other geometrical param-
eters.
As a second pass for analyzing the flow through the bump array, we use Darcy’s law which
approximates flow in complex geometries, such as the bump array, as flow through porous
media with a pressure-flow rate relationship given by []
µ〈u〉k
=∆PL, (.)
where 〈u〉 is the average speed and k is the hydraulic permeability, with dimensions of length
squared. Generally the hydraulic permeability is proportional to the square of the smallest
flow dimension, or the gap size G in the case of the bump array. Therefore, from Darcy’s law,
Deterministic lateral nanofractionation Chapter . Cascade Design |
we predict that∆PL∝µ〈u〉G2 . (.)
In terms of the flow rate Q ∝ 〈u〉wh through the bump array, the pressure drop per unit length
in the bump array is∆PL∝
µQ
G2wh. (.)
Consequently the fluidic resistance R = ∆P /Q of the bump array is
R ∝µL
G2wh, (.)
which matches our estimate from the first pass (Eq. .) using the Poiseuille flow approxi-
mation in the gap.
The coefficient of the hydraulic resistance, i.e. the factor needed on the left hand side
to turn Eq. . into an equality, requires detailed analysis to be determined. Previously the
coefficient was determined using numerical simulations to be around . for angles around 0.1
radians and post diameters equal to the gap size []. This suggests the following approximate
equation for the fluidic resistance in the bump array
R ≈4.6µLG2wh
. (.)
It is important to note that the fluidic resistance of the array scales with the square of the
inverse of the gap size G, not with the cube as a blind extension of the equation of fluidic
resistance for rectangular channels might suggest
. Impedance matching in side channels and post arrays
The alternative side outputs in the cascade DLD were designed to minimize the perturbation
on flow in the main array. The basic principle for balancing fluidic resistance in this manner
A recent (and only) review on the deterministic lateral displacement technology gets this wrong []. In the review
the authors mistakenly apply the rectangular channel resistance, Eq. . (Eq. in the review article), to determine
the resistance in the bump array: “If we consider a device with a gap between pillars of µm and then compare this
to a device with a gap size of µm - the reduction of the gap size by half, whilst all other parameters remain constant,
results in an x increase in the resistance according to eqn ().” However understanding based on both Darcy’s law
and the Poiseuille flow approximation in gaps show that the resistance should increase -fold, not -fold, because of
the resistance’s squared, not cubed, dependence on the inverse of the bump array gap size.
Deterministic lateral nanofractionation Chapter . Cascade Design |
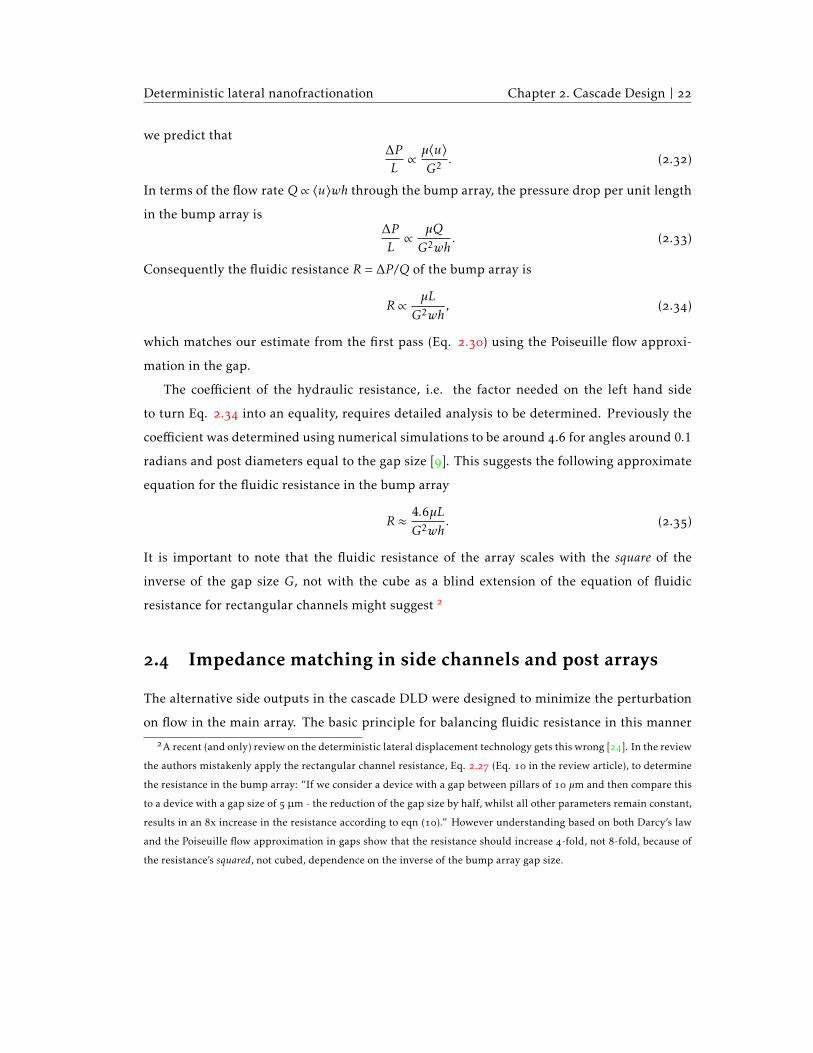
Figure .: Cascade design volumetric flow rate diagram. The diagram illustrates the geomet-
ric parameters of widths WR in the arrays and widths C in the channels for determining the
relationship between input flow rate Q1 at the top and first side output flow rate Qside1 . Fig-
ure adapted with permission from John Davis, “Microfluidic Separation of Blood Components
through Deterministic Lateral Displacement”, Ph.D. Dissertation, Princeton University [].
was to ensure that flow remained vertical near the side output entrances. For this to be the
case, the volumetric flow rate into the first side channel Qside1 must be equal to the fraction of
flow in the first array Q1 directly above the side output entrance, or
Qside1 =Q1
WC1
WR1, (.)

Deterministic lateral nanofractionation Chapter . Cascade Design |
where Q1 is the input volumetric flow rate, WC1 is the width of the first side channel and
WR1 is the width of the first array as shown in (Figure .). Using this relationship, we can
determine the desired average flow velocity in the side output channel for a given initial input
flow rateQ1 which we know already from the setting on the input syringe pumps. The average
gap flow velocity v0 in the main bump array is given from the flow rate,
Q1 = v0whGλ, (.)
where w is the width in the array (equal to WC1 above), h is the etch depth, G is the gap size,
and λ is the post-to-post spacing as shown in Figure .. Note that wGλ is the fraction of the
total array width open to flow in the gaps. For rectangular side output channels, the flow
velocity in the channel v1 is given by
Qside1 = v1WC1h, (.)
where the etch depth h is assumed to be same in the side channels as it in the main arrays. From
these two relationships (Eqs. . and .) we find that the flow velocities in the channel and
array are related by
v1 = v0Gλ, (.)
where it should be remembered that v0 is the gap flow velocity in the array.
A second constraint on the flow rates is that the pressure drop from the input to output
holes should be the same across all paths. In the cascade array, the pressure difference across
a side output channel must be equal to the pressure drop across all subsequent arrays. In the
diagram shown in Figure ., for example, the pressure drop after the first array should be the
same across the alternative side output path (∆P side1 ) as it is across arrays and (∆P2 +∆P3).
This constraint fixes the geometry of the side channels for the desired channel flow velocity to
maintain vertical flow (Eq. .).
For N arrays and N- side output channels in the cascade, the pressure drop constraint
gives that in general for the nth side output channel
∆P siden =
N∑k=n+1
∆Pk , (.)
where ∆P siden is the pressure drop across the nth side channel and ∆Pk is the pressure drop
across the kth bump array.

Deterministic lateral nanofractionation Chapter . Cascade Design |
The pressure drops for the rectangular side channel geometry and bump array geometries
can be calculated using the resistance equations for flow in a bump array (Eq. .) and for
flow in a rectangular channel (Eq. .) derived in the previous section and the pressure-flow
rate relationship ∆P =QR. The pressure drop across an array is
∆Parray =QRarray =(v0hw
Gλ
)(4.6µLG2wh
)=
4.6µLv0
Gλ, (.)
where v0 is the average gap flow velocity, w is the total width of the array, h is the etch depth,
G is the gap size, λ is the post-to-post spacing, µ is the fluid viscosity, and L is the total array
length. The pressure drop across a channel where the flow velocity is given in terms of the
channel flow velocity v and the channel etch depth h, which is assumed to be much smaller
than the channel width WC, is
∆Pchannel =QRchannel =(vhWC
)(12µLC
WCh3
)=
12µLCv0
h2Gλ, (.)
where LC is the total length of the channel and Eq. . was used to replace the channel
flow velocity v with the gap flow velocity in the array v0. For the nano-DLD in this work,
WC = 52.6µm and h ≤ 1µm so h�WC is a decent assumption for the side channel designs of
interest.
To simplify the fluidic resistance calculations, the cascade array was designed such that the
gap size equaled the post diameter, or λ = 2G. Using this fixed relationship, we can simplify
Eq. . to
∆Parray =2.3µLv0
G2 , (.)
where we have substituted v0 for the known input gap flow velocity in the array, and have
assumed that the total array width and available width in the gaps (where G/λ is constant) are
the same in all arrays so that the flow velocity is constant throughout the cascade device.
As a second simplification, the gap sizes in the cascade arrays were designed to be one-
half the gap size of the previous array, as summarized in Table . of the design parameters
of the nano-DLD. The decreasing gap sizes are intended to bump large particles before small
particles and reduce the critical diameter by % at each subsequent array (Eq. . for fixed
ε). Therefore a specific equation for the gap size in the kth array for this fixed gap size scaling
is
Gk = 21−kG1. (.)

Deterministic lateral nanofractionation Chapter . Cascade Design |
Under these two simplifications, only the gap size G (and post spacing λ = 2G) varies in
the different arrays of the cascade design. Therefore the fixed scaling of gap sizes given by Eq.
. results in a known scaling of the pressure drop at each subsequent array in terms of the
pressure drop in the first array of the cascade since ∆Parray ∝ G−2
∆Pk = 4k−1∆P1. (.)
This relationship allows Eq. . to simplify to
∆P siden = ∆P1
N−1∑k=n
4k , (.)
under the assumptions of fixed gap size scaling (Eq. .) and fixed gap size to post diameter
ratio λ = 2G.
Now substituting Eq. . for the pressure in the side output on the left hand side of Eq.
. and Eq. . on the right hand side for ∆P1, and using the relationship between flow
velocities in the channel v1 and array v0 (Eq. .), yields
Lsiden ≈ 0.38L
(hG1
)2 N−1∑k=n
4k , (.)
an equation for the total length Lsiden of the nth side channel required to balance fluidic resis-
tance in the cascade array, in terms of the total length L per cascade array (designed to be the
same for all arrays), etch depth h (approximately the same in arrays as it is in side channels),
and gap size G1 of the first array (Figure .).
A more general form of Eq. . for variable gap size Gk and post spacing λk at each kth
array (so the ratio G/λ is no longer constant) is
Lsiden ≈ 0.77Lh2
N∑k=n+1
(Gkλk)−1. (.)
The width of all side channels used in this project was . µm, or twice the largest gap
size in the micro-DLD. This gap size was chosen to reduce the chance of clogging in the side
channels, an issue in past experiments on the closed cascade array []. In the case of the
nanoscale bump array, the intended depth of etching (i.e. height of channels) was µm, for
an aspect ratio of about : (height:width) in the side channels. However, the fabricated chip
ended up having an etch depth of only about 0.5µm (Table .). Not only does variability in

Deterministic lateral nanofractionation Chapter . Cascade Design |
the etch depth limit the size of the largest particle that can be run and separated in the cascade
DLD, but also it affects the ideal length of the side output channels (Eq. .) for maintaining
fluidic resistance balance. It is therefore important to ensure that the wafer is etched to the
depth used in the design calculations of the cascade array.
The side output channels usually end up having to be longer than the width of the chip. For
example, the nano-DLD designs herein had bump array lengths of mm and a desired etch
depth of about 1.1µm equal to the initial gap size G1. From Eq. ., the side channel lengths
of the nano-DLD to balance fluidic resistance were therefore Lside1 = 76mm and Lside
2 = 61mm.
To fit, the channels had to be designed in a twisting pattern down the right half of the chip
as shown in the CAD design (Figure .). Because of the snake-like shape of the side channel
outputs, they are sometimes referred to as “serpentine” output channels.
One assumption in the derivation of Eq. . was that the average gap flow velocity re-
mained relatively constant through the cascade arrays. One issue is that fluid leaves the arrays
at each side output entrance, reducing the volumetric flux of fluid left in subsequent arrays. To
compensate for this loss of fluid volume, the total widths of subsequent arrays were decreased
slightly to maintain the same fluid velocity at reduced volumetric flow rates (Eq. .). The
column of fluid flow that would normally enter the array was instead redirected to the side
output channel, reducing the total width of the next cascade array. In addition to the wall
adjustment, the side channel width was kept small compared to the total width of the arrays.
In the nano-DLD designs used for experiments (design parameters summarized in Table .),
the channel widths were kept to about / of the array width (about mm), which would be
expected to change the assumed volumetric flux at the end of the cascade arrays by about %
if walls were not adjusted. This channel width was made large enough to reduce the possi-
bility of clogging while minimizing potential unanticipated perturbations of fluid flow in the
cascade arrays.
In summary, Eq. . was derived from first principles of fluid mechanics to estimate
the lengths of side channels required for maintaining average vertical flow in the cascade DLD
device. Designs of pressure-balanced cascade DLD devices were created using this knowledge.
As described in the following chapters, these designs were then used to fabricate microscale
and nanoscale deterministic lateral displacement arrays to test the predicted function of the
cascade DLD for fractionating particles of multiple size ranges.

Deterministic lateral nanofractionation Chapter . Cascade Design |
Figure .: Diagram of the pressure distribution in the cascade DLD design. Large particles
(blue) are displaced to the right wall and removed via side output channels to output , fol-
lowed by medium (red) particles to output and small (green) particles to output . Smallest
objects (pink) flow all the way through to output . Fluid flows from the inputs at the top to
the outlets at the bottom. Figure adapted with permission from David Inglis, “Microfluidic
Devices for Cell Separation”, Ph.D. Dissertation, Princeton University [].
Chapter
Experimental Methods
Deterministic lateral displacement devices were made using standard microfabrication and
nanofabrication techniques that have rapidly matured in the semiconductor industry over the
last fifty years. DLD devices for this project were made from silicon wafers and sealed with
either PDMS (micro-DLD) or anodically bonded to glass (nano-DLD). This chapter overviews
the process used to make cascade DLD devices in silicon and set them up for visualization in
flow experiments.
. Fabricating DLD Devices
Microscale deterministic lateral displacement chips were fabricated at the PRISM Micro/Nano
Fabrication Laboratory (MNFL) at Princeton University. Nanoscale DLD devices with features
on the order of a tenth of a micron were fabricated at the Cornell Nanoscale Science and
Technology Facility (CNF) at Cornell University.
.. Device and mask design
Designs of devices were made in a single layer using L-Edit software (Tanner Research, Mon-
rovia, CA). The micro-DLD chip was designed in one piece and turned into a single-etched
mask on the Heidelberg DWL in the MNFL. The nano-DLD design however is more com-
plicated because it has to be exposed on the ASML C DUV Stepper at the CNF for higher

Deterministic lateral nanofractionation Chapter . Experimental Methods |
resolution exposure of fine features down to a third of a micron. The ASML Stepper achieves
high resolution by magnifying the mask pattern by x. Therefore, the window of view on the
mask is small and fits only approximately a nm x nm field of view of design features at
the size on the chip. The nano-DLD design has to be converted manually into pattern units
that fit within the ASML mask window of view (Figure .). The center coordinates of each
unit is recorded on both the mask and final configuration designs, and inputted manually
as a text file into the ASML C DUV Stepper job file for aligning the units in the correct
configuration on the wafer during exposure.
In the design CAD file, the posts and walls were filled in while the channels were left
blank. Before writing the micro-DLD mask, the GDS design file was inverted so that the
etched portions of the mask corresponded to the desired etched regions on the silicon wafer,
and positive photoresist was selected. For the nano-DLD ASML mask, the GDS was not flipped
and features that were desired to be unetched on the wafers (e.g. walls, posts) were etched in
the mask, with negative photoresist used to expose wafers.
.. Microfabrication
The microscale DLD with a minimum feature size of . µm was fabricated at the PRISM
MNFL at Princeton University using standard photolithography and Bosch etching. Following
chip etching, chips were cleaved to the features of interest. The equipment used in these
processes as well as for mask making are listed in Table ..
Table .: Equipment used to fabricate the microscale cascade array. Work was conducted in
the PRISM Micro/Nano Fabrication Laboratory at Princeton University.
Equipment Procedure
Heidelberg DWL Laser write mask
Karl Suss MA Mask aligner and exposure
SAMCO RIEiPB Reactive ion etching
ADT Dicing Saw Cleaving

Deterministic lateral nanofractionation Chapter . Experimental Methods |
.. Nanofabrication
Figure .: Image of nano-DLD chip anodically bonded to glass. The diffraction of light yields
different colors in the three arrays because of the different gap spacings of . µm, . µm,
and . µm from top to bottom (Table .). Two input holes are at the top and four outlet
holes are at the bottom; the cascade outlets sit to the right of the main channel. Diagram of
the cascade DLD design is shown in Figure ..
The nano-DLD contains a smallest gap size of about a third of a micron (Table .). These
small features exceed the resolution of the Karl Suss MA for exposing mask patterns onto
silicon wafers. The nano-DLD devices were fabricated at the CNF at Cornell University where
the feature sizes were pushing the limits of the ASML C DUV Stepper resolution for ex-
posing wafers. The equipment used in the photolithography and Bosch etching for fabricating
nano-DLD devices are listed in Table ..
The etch parameters used to fabricate the nano-DLD involved a minute etch on the
wafers. This yielded an etch depth of about . µm and took off most of the photoresist on
the chip (Figure .). Ideally the etch depth would be around the maximum gap size, which
for the nano-DLD was about . µm (Table .). In the future the etching time for the wafer
Deterministic lateral nanofractionation Chapter . Experimental Methods |
Table .: Equipment used to fabricate the nanoscale cascade array. Work was conducted in
the Cornell Nanoscale Science and Technology Facility at Cornell University.
Equipment Procedure
Heidelberg Mask Writer DWL Write mask
Hamatech-Steag Mask Processors Develop mask
Gamma Automatic Coat-Develop Tool Coat wafers
ASML C DUV Stepper Alignment and exposure
Hamatech-Steag Wafer Processors Develop wafers
Oxford Etcher Etching
Zeiss Supra SEM Imaging
ADT Dicing Saw (PRISM) Cleaving
could be extended to about . to minutes.
After fabrication, each chip pattern was individually cleaved from the wafer yielding high
length:width ratio rectangular nano-DLD chips (Figure .). The nano-DLD chip was then
prepared for cutting holes and anodic bonding to glass.
. Chip Preparation
Once the DLD chip is made, holes of about . mm diameter are drilled into the input and
output holes. Holes were cut using a laser cutter, which is more precise and reliable than the
sand-blaster. Once the holes are cut, the chip is sealed, loaded onto an acrylic holder, and
wetted in preparation for running experiments.
.. Sealing: Anodic bonding (nano-DLD only)
Anodic bonding uses a cathode and anode to drive a chemical reaction that permanently fuses
borosilicate glass to the glass wafer. The process was conducted on a custom platform in the
Princeton Microfluidics Facility (Figure .). Prior to bonding, the chip is rinsed of remaining
photoresist in acetone and then isopropanol and washed in piranha solution, a mixture of
sulfuric acid and hydrogen peroxide, and hydrofluoric acid. The borosilicate glass slide is also
Deterministic lateral nanofractionation Chapter . Experimental Methods |
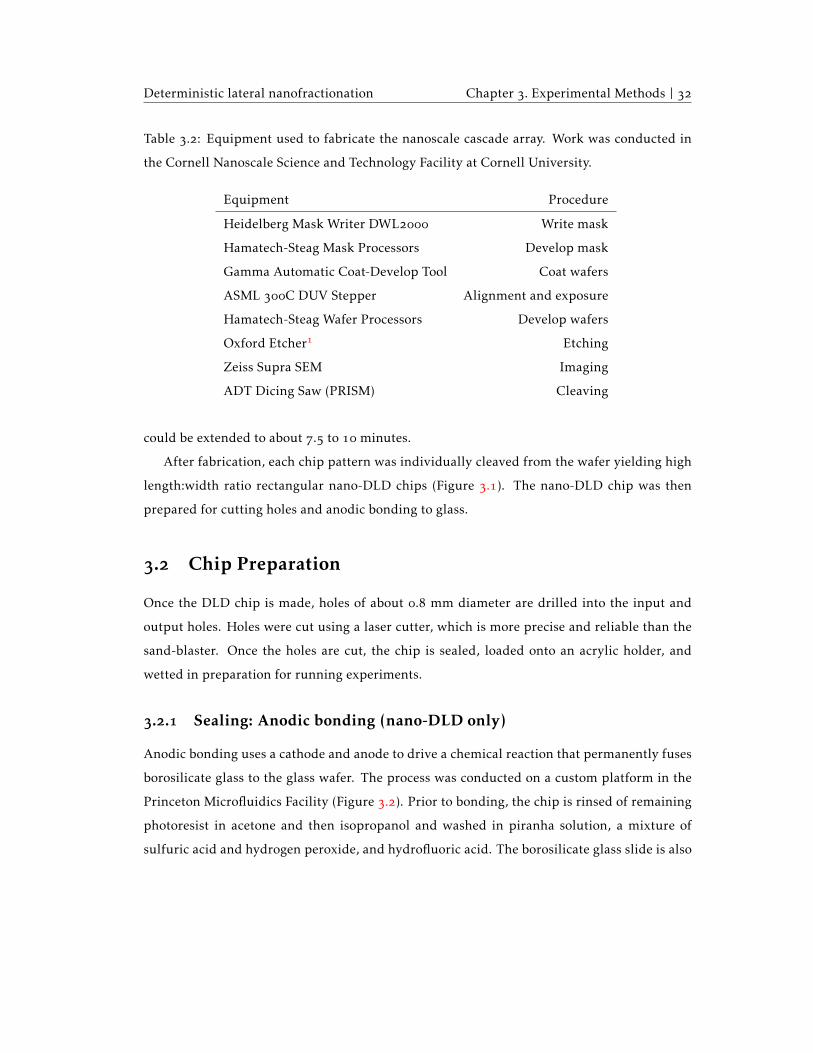
Figure .: Anodic bonding setup. The cathode (charged by red alligator clip) is composed of
a strip of graphite and charged prong that presses down on the graphite, creating pressure on
the glass onto the silicon. The anode (black alligator clip, not pictured) contains the opposite
charge and is connected to metal red attached to the metal base plate, creating a voltage dif-
ference across the silicon chip and borosilicate glass. The chip and metal base rest on a heater
that is set to about °C for vaporizing chips until they are dry and increasing the mobility of
sodium ions in the borosilicate glass. The chip can be seen to have already anodically bonded
to the glass near the area under compression of the cathode prong, and the seal is spreading
towards the top and bottom of the chip.
washed in piranha solution.
After cleaning, the chip is placed on a hot plate to dry the chip. Once the chip is dry and
the temperature has reached over °C, the current is switched on to setup a voltage dif-
ference across the front of the chip surface and glass slide (Figure .). Borosilicate glass was
used because it has a lower coefficient of thermal expansion than “ordinary” soft glass (e.g.
window glass), closer to that of silicon, and contains sodium ions that can become mobile dur-
ing heating in the anodic bonding process. The migration of the positive sodium ions becomes
Deterministic lateral nanofractionation Chapter . Experimental Methods |
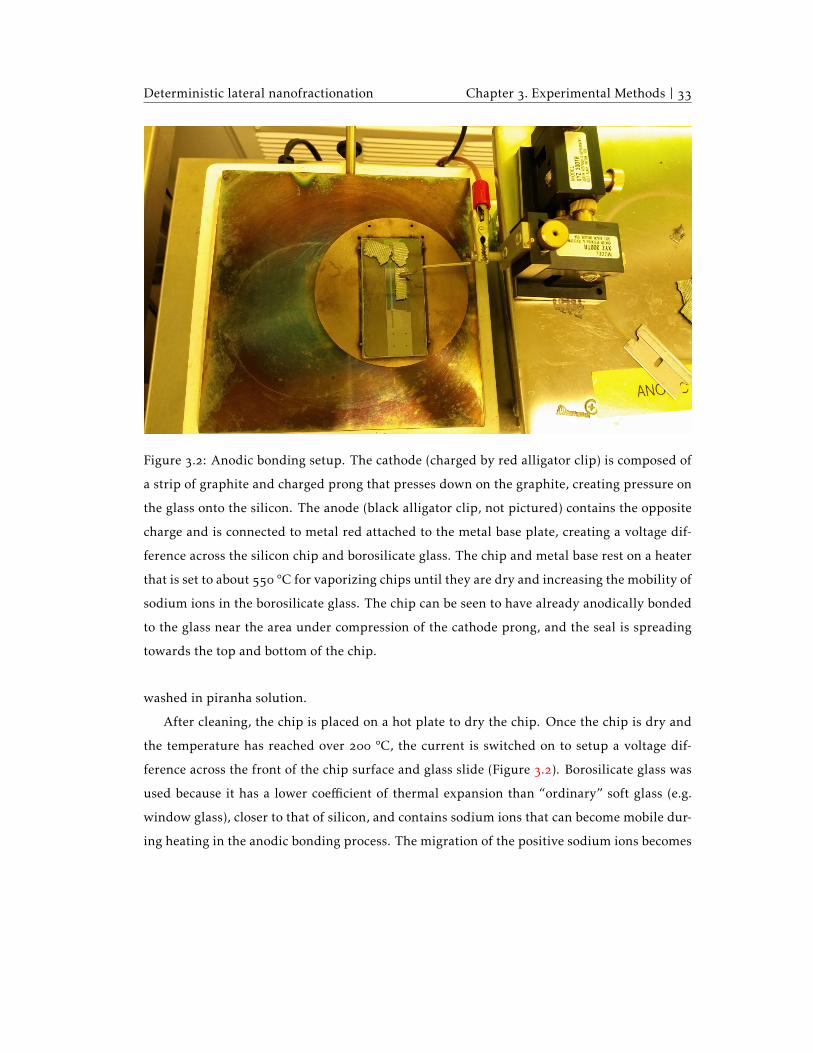
Figure .: Nano-DLD chip on light table. It is possible to see light through the holes in the
chip if they are properly aligned with the holes in the jig underneath. On the right is the jig
for the micro-DLD.
important for completing the electric circuit set up across the silicon wafer and borosilicate
glass, eventually leading to their permanent anodic bonding.
.. Loading device on holder
Polycarbonate DLD chip holders were custom fabricated in the Department of Physics Ma-
chine Shop at Princeton University. The “jigs” contain input and output holes matching those
on the chip and metal tubes in the back for connecting to syringe pumps. O-rings are fitted
in the polycarbonate holder’s holes in between the holder and slightly greased to create a seal
with the backside of the chip.
The chip should then be aligned with the holder so that their holes align. This is often
easiest done on a light table, where bright light emitted upwards clearly reveals if the holes
align (Figure .).
For the nano-DLD, since the chip is already anodic bonded to glass, the chip is attached to
Deterministic lateral nanofractionation Chapter . Experimental Methods |
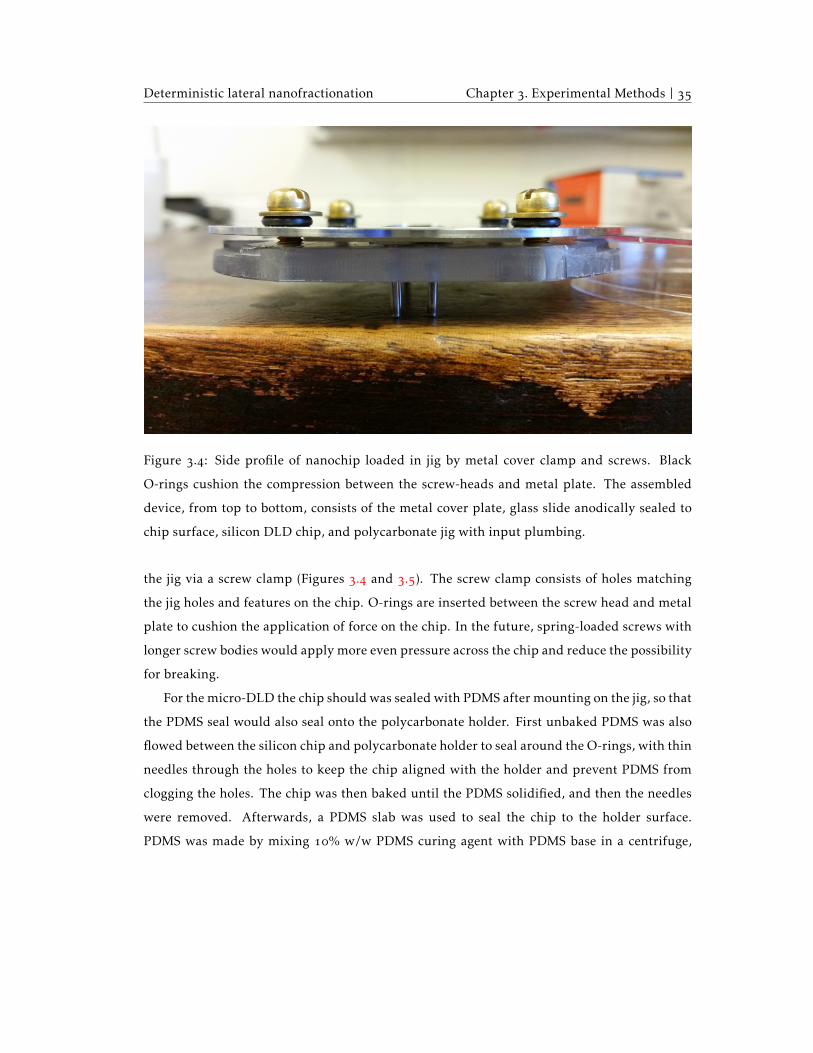
Figure .: Side profile of nanochip loaded in jig by metal cover clamp and screws. Black
O-rings cushion the compression between the screw-heads and metal plate. The assembled
device, from top to bottom, consists of the metal cover plate, glass slide anodically sealed to
chip surface, silicon DLD chip, and polycarbonate jig with input plumbing.
the jig via a screw clamp (Figures . and .). The screw clamp consists of holes matching
the jig holes and features on the chip. O-rings are inserted between the screw head and metal
plate to cushion the application of force on the chip. In the future, spring-loaded screws with
longer screw bodies would apply more even pressure across the chip and reduce the possibility
for breaking.
For the micro-DLD the chip should was sealed with PDMS after mounting on the jig, so that
the PDMS seal would also seal onto the polycarbonate holder. First unbaked PDMS was also
flowed between the silicon chip and polycarbonate holder to seal around the O-rings, with thin
needles through the holes to keep the chip aligned with the holder and prevent PDMS from
clogging the holes. The chip was then baked until the PDMS solidified, and then the needles
were removed. Afterwards, a PDMS slab was used to seal the chip to the holder surface.
PDMS was made by mixing % w/w PDMS curing agent with PDMS base in a centrifuge,

Deterministic lateral nanofractionation Chapter . Experimental Methods |
Figure .: Top view of the nanochip shown in Figure .. The chip is screwed onto the jig
under a metal cover plate.
followed by degassing in a vacuum to remove air bubbles and an overnight bake. The PDMS
slab was made on silicon wafers silanized in tricholorsilane to facilitate PDMS removal from
the hydrophobic silanized silicon surface. After it cured, the PDMS slab was cut to the shape
of the chip surface and placed on. Scotch tape was used to clean the surface of the silicon chip
of debris before PDMS sealing.
.. Wetting
The purpose of the wetting procedure is to replace the air initially in the microfluidic device
with a fluid, usually a wetting buffer with much smaller interfacial tension with the running
buffer. Without wetting, the running buffer forms a meniscus in the microfluidic channels,
has high surface tension with the air, and faces very high pressures which effectively stops the
fluid flow.
To estimate the pressure difference that would be needed to run a dry chip, we derive the
Young-Laplace equation for the Laplace pressure difference ∆P across a spherical gas bubble.
Deterministic lateral nanofractionation Chapter . Experimental Methods |
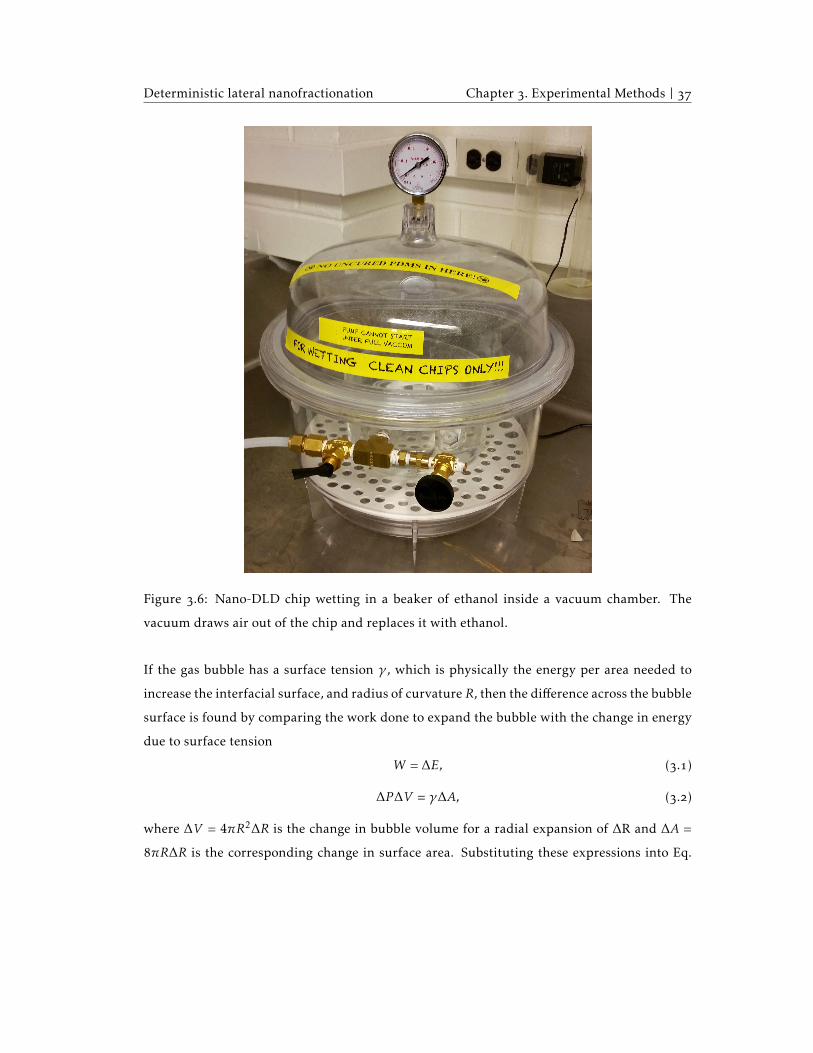
Figure .: Nano-DLD chip wetting in a beaker of ethanol inside a vacuum chamber. The
vacuum draws air out of the chip and replaces it with ethanol.
If the gas bubble has a surface tension γ , which is physically the energy per area needed to
increase the interfacial surface, and radius of curvature R, then the difference across the bubble
surface is found by comparing the work done to expand the bubble with the change in energy
due to surface tension
W = ∆E, (.)
∆P∆V = γ∆A, (.)
where ∆V = 4πR2∆R is the change in bubble volume for a radial expansion of ∆R and ∆A =
8πR∆R is the corresponding change in surface area. Substituting these expressions into Eq.
Deterministic lateral nanofractionation Chapter . Experimental Methods |
., we find the Young-Laplace equation
∆P =2γR. (.)
The typical nanoscale bump array has a pressure drop of around Pa for a gap size of
. µm and flow velocity of mm/s from the bump array pressure drop-flow rate relationship
(Eq. .). The surface tension between water and air is about mN/m. The typical pressure
drop that would be needed to push water through the array if it were dry would be on the
order of 108 Pa or equivalently thousands of PSI (pounds per square inch).
To wet the chip, we submerge the device in wetting buffer (typically ethanol or a solution
of % m/v F- PEG in deionized water) and place the submerged chip in a vacuum that can
reach gauge pressures of around -. MPa (Figure .). The vacuum draws air bubbles out of
the chip and replaces the air inside with wetting buffer. After wetting, the chip is removed
from the vacuum chamber and kept submerged until the input tubing is connected and flow is
running through the chip. This is to prevent drying of the chip from evaporation which would
necessitate re-wetting and may leave a residue on the chip surface.
For bead experiments it is necessary to use a wetting buffer of PEG solution to neutralize
the silicon dioxide surface of the microfluidic channels. If ethanol is used to wet the chip
initially, it is important to run PEG wetting buffer through the chip (often overnight at slow
flow rates) to replace the ethanol before running bead solutions.
. Experimental procedures
After the chips are sealed, mounted, and wetted, they are ready to run actual fluid samples.
The next steps are to mount the chip apparatus onto a visualization platform and connect
syringe pumps loaded with the samples of interest into the chip.
.. Visualization platform
An inverted microscope (Nikon Eclipse TE-U) with Nikon Plan x/. and Nikon Plan
Fluor x/. ELWD objectives was used to image the chip with a Nikon mercury lamp for
brightfield imaging and nm excitation laser for imaging green fluorescent beads. A custom
stage was made to fit the metal cover plate of the chip, with the chip and cover plate facing

Deterministic lateral nanofractionation Chapter . Experimental Methods |
Figure .: Nano-DLD chip running on microscope. The metal cover plate fits inside the stage
for imaging on the inverted microscope.
down into the lens (Figure .). QImaging CCD (Retiga ) and EMCCD (Rolera-MGi Plus)
cameras were used to capture images of the chip.
Prior to mounting on the microscope, the wetted chip was connected to syringe pumps
while submerged in the wetting buffer. This was done to prevent air bubbles from forming in
the chip during the syringe pump connection stage.
.. Running procedure
New Era NE- programmable single syringe pump (New Era Pump Systems Inc., Farm-
ingdale NY) were used to run samples and buffer in the micro-DLD and nano-DLD. Syringe
pumps were mounted on vertical beams to remove air bubbles from the syringe (Figure .).
The flow rate is limited by the minimum pushing rate of the syringe pump for a given sy-
ringe size. The NE- syringe pumps have a pumping rate floor of about . µL/hr
(http://syringepump.com/NE-.php). Because of the extremely low flow rate required
for the nano-DLD sample flow, about . µL/hr for a mm/s flow velocity, the Nexus

Deterministic lateral nanofractionation Chapter . Experimental Methods |
Figure .: Microscope and syringe pump setup for imaging micro- and nano-DLD perfor-
mance.
(Chemyx Inc., Stafford TX) syringe pump was used to pump fluid into the sample input hole
of the nano-DLD. In the micro- and nano-DLD chips, the channel volume of the buffer input
(higher input hole) is six times that of the sample input (lower input hole) so the buffer flow
rate was set to be six times the sample flow rate.
The syringe diameters are needed for setting the NE- syringe pump flow rates. The
relevant data are summarized in Table ..
Table .: Syringe data for BD plastic mL, mL, and mL syringes. These data are for setting
the syringe pump flow rates.
Volume Diameter (mm) Area (mm2)
mL . .
mL . .
mL . .
mL . .

Deterministic lateral nanofractionation Chapter . Experimental Methods |
Beads solutions were made by mixing two drops of beads in mL of % w/v F- (PEG)
deionized water solution used to reduce charge effects. For testing the micro-DLD, . µm
green fluorescent beads were used (Bangs Laboratories Inc, lot# ; Fishers, IN). For testing
the nano-DLD, . µm (Duke Scientific, lot# ) and . µm (Duke Scientific, lot#
) green fluorescent beads were used.
For testing the nano-DLD chips, which sometimes do not seal all of the input or output
holes, other methods of pumping and withdrawing flow through the chip are being tested.

Chapter
Microscale DLD Experiments
The first step for developing nano-DLD cascades was to verify that the cascade design would
separate particles at the microscale. Micro-DLD cascade arrays were fabricated in the PRISM
MNFL and Princeton Microfluidics Facility at Princeton University. The devices were then
tested for functionality before moving the design to the nanoscale. Initial micro-DLD ex-
periments revealed a flaw in the original cascade design, necessitating a modification of the
length of the side channels that was completed before the fabrication of nano-DLD cascades.
These results did not definitely confirm the functionality of the cascade design for fraction-
ating particles. However, the preliminary experiments verified that the optics platform and
running procedures for beads seemed to work properly, helping setup the experimental and
chip preparation procedures for future micro-DLD and nano-DLD experiments.
. Fabricated design of micro-DLD
The micro-DLD cascade design consists of three sections with two alternative outputs after
the first and second arrays (Figure .). The critical sizes of the arrays decrease from 10µm
to 5µm to 2.5µm, in order from top to bottom (Table .). The decreasing critical diameter
gradient was chosen to fractionate particles from big to small in the size range between and
µm. Four output holes are located at the bottom of the device to collect the four streams of
particles resulting from the three-tiered cascade design. The top-left output collects particles

Deterministic lateral nanofractionation Chapter . Microscale DLD Experiments |
Figure .: Diagram of cascade DLD design with three critical sizes. Bottom-right output
collects bumping objects in array ; top-right output collects bumping particles in array ;
bottom-left output collects bumping objects in array ; and top-left output collects the rest of
particles that do not bump in any of the arrays. Scale bar in lower-right corner is mm.
below . µm; the bottom-left ouput collects particles between . and µm; the top-right
output collects particles between and µm; and the bottom-right output collects particles
above µm (Figure .). Input holes are located at the top of the device. The large buffer
reservoir flows around the sample input to ensure that the sample is injected in a narrow
stream on the left side of the entrance to the first array. Long channels were inserted between
the input holes and first array entrance to ensure parallel flow in the entrance.
Deterministic lateral nanofractionation Chapter . Microscale DLD Experiments |
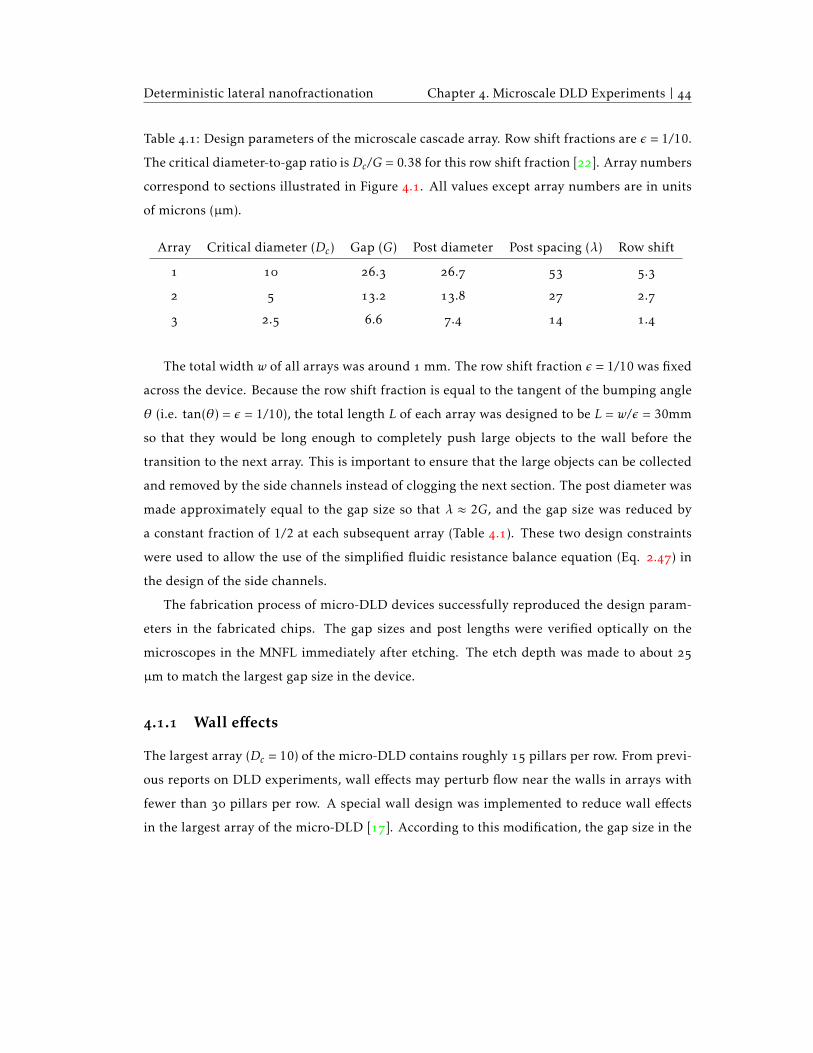
Table .: Design parameters of the microscale cascade array. Row shift fractions are ε = 1/10.
The critical diameter-to-gap ratio isDc/G = 0.38 for this row shift fraction []. Array numbers
correspond to sections illustrated in Figure .. All values except array numbers are in units
of microns (µm).
Array Critical diameter (Dc) Gap (G) Post diameter Post spacing (λ) Row shift
. . .
. . .
. . . .
The total width w of all arrays was around mm. The row shift fraction ε = 1/10 was fixed
across the device. Because the row shift fraction is equal to the tangent of the bumping angle
θ (i.e. tan(θ) = ε = 1/10), the total length L of each array was designed to be L = w/ε = 30mm
so that they would be long enough to completely push large objects to the wall before the
transition to the next array. This is important to ensure that the large objects can be collected
and removed by the side channels instead of clogging the next section. The post diameter was
made approximately equal to the gap size so that λ ≈ 2G, and the gap size was reduced by
a constant fraction of 1/2 at each subsequent array (Table .). These two design constraints
were used to allow the use of the simplified fluidic resistance balance equation (Eq. .) in
the design of the side channels.
The fabrication process of micro-DLD devices successfully reproduced the design param-
eters in the fabricated chips. The gap sizes and post lengths were verified optically on the
microscopes in the MNFL immediately after etching. The etch depth was made to about
µm to match the largest gap size in the device.
.. Wall effects
The largest array (Dc = 10) of the micro-DLD contains roughly pillars per row. From previ-
ous reports on DLD experiments, wall effects may perturb flow near the walls in arrays with
fewer than pillars per row. A special wall design was implemented to reduce wall effects
in the largest array of the micro-DLD []. According to this modification, the gap size in the

Deterministic lateral nanofractionation Chapter . Microscale DLD Experiments |
Figure .: Image of the first array of the microscale DLD. The critical size is Dc = 10µm,
gap size is G = . µm, and row shift fraction is ε = 1/10. The trajectory (red) of the dust
particle is visble as a zig-zag mode pattern near the wall on serpentine side. The dust particle
is marked by the circle labeled “”. Circles mark the manually tracked locations of the debris.
The initial position of the particle at frame one is at the right end of the red line. Inputs are
to the right of the location of the device; flow is from right to left. Tracking was performed
manually using the MTrackJ plug-in in ImageJ analysis software. Image was taken with low
magnification in the Princeton Microfluidics Facility.
first and last columns were adjustied with the relationships
g leftn = G
√nε, (.)

Deterministic lateral nanofractionation Chapter . Microscale DLD Experiments |
and
grightn = G
√2−nε, (.)
where gn is the gap size of the nth row in the left or right-most column, n ranges from to 1/ε,
ε is the row shift fraction, and G is the gap size. These adjustments allow the correct amount
of fluid flow over and around the first and last column of posts near the walls to maintain
uniform flow and predicted particle separation near the wall surface.
The flow correction near the wall with the modified wall design was confirmed experimen-
tally. The trajectory of small debris was observed in the micro-DLD at flow rates of about
µL/hr and manually tracked using the MTrackJ plug-in [] for ImageJ []. Dust particles
were seen to move in normal zig-zag motion near the walls with a periodicity of ten posts
equal 1/ε, the periodicity of the array (Figure .). Debris was observed to be stuck in the lane
immediately adjacent to the bottom wall of the first array. However they do not seem to have
significantly perturbed the expected zig-zag trajectory of small particles flowing near the wall
(red). Overall, the normal zig-zag motion shown near the wall appears to support the finding
that the wall correction previously reported [] is able to correct the fluid flow distribution
near the walls of DLD devices.
. Results
The micro-DLD was prepared and imaged according to the methods described in Chapter .
The chip was wetted initially with ethanol in the vacuum chamber, and then imaged while run-
ning % PEG wetting buffer to replace the ethanol. Images during the run with PEG showed
small debris particles zig-zagging through the micro-DLD (Figures . and .). It was also
noticed that the side channels of the micro-DLD exhibited considerable fluidic resistance that
prevented the entrance of some particles into the first side channel (Figure .). Moreover,
this unexpectedly high fluidic resistance considerably slowed the flow of particles through the
second side output (Figure .).
A review of the serpentine design revealed a miscalculation of the fluidic resistances of the
rectangular serpentine channels. Equation .was used with w3h in the denominator instead
of wh3, where h < w (h = 25µm and w = 52.6µm). This resulted in the design of side channels
with eight times the fluidic resistance they should have had. This error was recognized and Eq.

Deterministic lateral nanofractionation Chapter . Microscale DLD Experiments |
Figure .: Image of dust particle moving into and out of the first cascade output entrance in
the micro-DLD. The transition region here is between the first array (Dc = 10µm, G = . µm)
and second array (Dc = 5µm, G = . µm). The trajectory (red) of the dust particle is visble
as a zig-zag mode pattern next to the wall. In the current frame, the dust particle has just left
the field of view to the left of the label “”. Flow is from right to left. Tracking was performed
manually using the MTrackJ plug-in in ImageJ analysis software. Image was taken with low
magnification on the microscope in the Princeton Microfluidics Facility.
. was applied correctly to design the resistance of side channels for the nano-DLD cascade
device in later work.
The observed trajectories of small debris particles zig-zagging through the micro-DLD sug-
gested the correct functioning of the DLD post arrays. To further test whether or not the micro-
DLD devices could bump large particles with the expected critical diameter threshold, 3.69µm

Deterministic lateral nanofractionation Chapter . Microscale DLD Experiments |
Figure .: Image of dust particle moving through the second serpentine output in the micro-
DLD. The red line marks the path of the particle over ten seconds. The top-right is the entrance
into the serpentine channel. The label “” marks the location of the particle after traveling for
five seconds from its initial location at the top-right end of the red line. Flow is from right to
left. The width of the serpentine channel is µm; the depth is about µm. Tracking was
performed manually using the MTrackJ plug-in in ImageJ analysis software. Image was taken
with high magnification on the microscope in the Princeton Microfluidics Facility.
beads were run through the micro-DLD sample input. However at this point the PDMS seal on
the micro-DLD device had lifted from the buffer input, resulting in leaking and reverse flow
of sample fluid into the buffer reservoir. The chip was disassembled and cleaned in sulfuric
acid overnight for reuse.
In the second round of experiments, the micro-DLD was wetted with ethanol but without
Deterministic lateral nanofractionation Chapter . Microscale DLD Experiments |
PEG buffer. The 3.69µm beads very clearly became stuck in the channels and arrays of the
micro-DLD device. These results appear to demonstrate that without PEG wetting the sili-
con surface of the DLD device contains enough charge to disrupt bead flow. PEG wetting is
therefore necessary to neutralize the surface of DLD devices prior to running beads.
A second goal of micro-DLD experiments, in addition to testing the function of the cas-
cade DLD design, is to develop alternative sealing methods for reliably experimenting with
nano-DLD devices. Nano-DLD devices (described in Chapter ) are fabricated off-campus at
the Cornell Nanoscale Science and Technology Facility at Cornell University. These devices
are therefore expensive to make, and difficult to refabricate if accidentally damaged during
the sealing process. Currently the nano-DLD devices are sealed with screw clamps onto a
polycarbonate jig as described in Chapter . However, tightening the thin nano-DLD chips
with screws has relatively high risk for breaking the chips during the preparation procedures
compared to PDMS sealing used in testing micro-DLD devices.
The PDMS seal faces a number of issues that are being prototyped on the micro-DLD device
however. One issue is that the PDMS seal appears to not reliably support even slow flow rates.
A buffer flow rate of µL/hr appeared to lift off the PDMS seal on the buffer input to the
micro-DLD device and result in leaking. Experiments on the micro-DLD continue in parallel
with the nano-DLD chips to test alternative methods for sealing DLD devices with PDMS,
which may allow more efficient and reliable methods for performing future experiments on
micro- and nano-DLD devices.

Chapter
Nanoscale DLD Experiments
The second step for developing nano-DLD fractionating devices was to fabricate and test the
cascade design at the nanoscale. Following preliminary experiments on the microscale DLD
(Chapter ), the cascade design was revised to separate particles in the size range between .
and . µm (Table .). Nanofabrication work was performed at the Cornell Nanoscale Science
and Technology Facility (CNF) at Cornell University. The two main areas of progress here were
() nano-DLD cascade devices were successfully fabricated using a difficult mask layout and
exposure process, demonstrating the feasibility of fabricating nanoscale DLD devices with
features as fine as . µm using deep ultraviolet photolithography, and () . µm and .
µm beads were successfully run and imaged inside the nano-DLD, confirming that the chip
preparation and imaging techniques seem to work for the most part.
There is still much room for future work, however. Fabrication of nanoscale cascade DLD
devices is pushing the limit of the exposure and etching equipment capabilities used at the
CNF. The work herein provides preliminary data for fine-tuning these processes to more ac-
curately fabricate future nano-DLD devices. More of an issue is the challenge of sealing the
nano-DLD chips, which have to be anodically bonded with glass first. The issues with nano-
DLD sealing and fabrication are further explored in the following discussion of experiments
performed so far on the nanoscale DLD cascade device.

Deterministic lateral nanofractionation Chapter . Nanoscale DLD Experiments |
Figure .: Image of ASML C DUV Stepper mask CAD for exposing the nano-DLD cascade
device. The eight basic units, in order from top to bottom on the actual device, are: (a) inputs,
(b) channels, (c) array , (d) serpentine channel , (e) array , (f) serpentine channel , (g) array
, and (h) outputs. The four units marked by (i) are extra blocks of the smallest posts used in
arrays and , with larger post diameters P than in the original design in case underexposure
of the posts on the negative photoresist is an issue. (i) Top left: posts for array , P = 0.85µm;
top right: posts for array , P = 0.75µm; bottom left: posts for array , P = 0.57µm; bottom
right: posts for array , P = 0.45µm. Field of view available on mask for features comprises
of the overlapping regions of the mm x mm square (j) and mm x mm rectangle
(k) outlined in blue and black, respectively. The layout also requires at least . mm space
between pattern units. Coordinates of pattern centers on mask and desired center locations
on wafer were loaded into the ASML Stepper job file to stitch together the desired nano-DLD
structure (Figure .). Crosshair marks center of the mask. The etched patterns on the mask
are scaled by x from the CAD. Scale bar in bottom-right corner is mm.

Deterministic lateral nanofractionation Chapter . Nanoscale DLD Experiments |
Table .: Design parameters for the nanoscale cascade array. Row shift fractions are ε =
1/10; critical diameter-to-gap ratios are Dc/G = 0.38. Array numbers correspond to sections
illustrated in Figure .. All values except array numbers are in units of microns (µm).
Array Critical diameter (Dc) Gap (G) Post diameter Post spacing (λ) Row shift
. . . . .
. . . . .
. . . . .
Table .: Fabricated parameters for the nanoscale cascade array. Discrepancies from the de-
sign owe to deviations in the wafer exposure and etching processes, which most significantly
affected array containing the finest features. Measurements of array (Dc = 0.4 µm) are from
the SEM image in Figure .. Measurements of arrays (Dc = 0.2 µm) and (Dc = 0.15 µm)
are from the SEM image in Figure .. The post width of array was also confirmed using
the cross-sectional SEM micrograph (Figure .). Row shift fractions are ε = 1/10; critical
diameter-to-gap ratios are Dc/G = 0.38. Array numbers correspond to sections illustrated in
Figure .. All values except array numbers are in units of microns (µm).
Array Critical diameter (Dc) Gap (G) Post diameter Post spacing (λ) Row shift
. . . . .
. . . . .
. . . . .
. Fabricated design of nano-DLD
The design for the nano-DLD was very similar to that for the micro-DLD. The nano-DLD
design parameters are summarized in Table .. The major differences are that there was no
wall correction in the first array, because there were hundreds of posts per row so wall effects
were not a significant concern in the nano-DLD, and that the lengths of the side channels
had to be readjusted to accommodate the higher fluidic resistance of each cascade array at the
nanoscale (Rarray ∝ G−2 from Eq. ., where G is smaller by an order of magnitude in the
nano-DLD compared to in the micro-DLD).
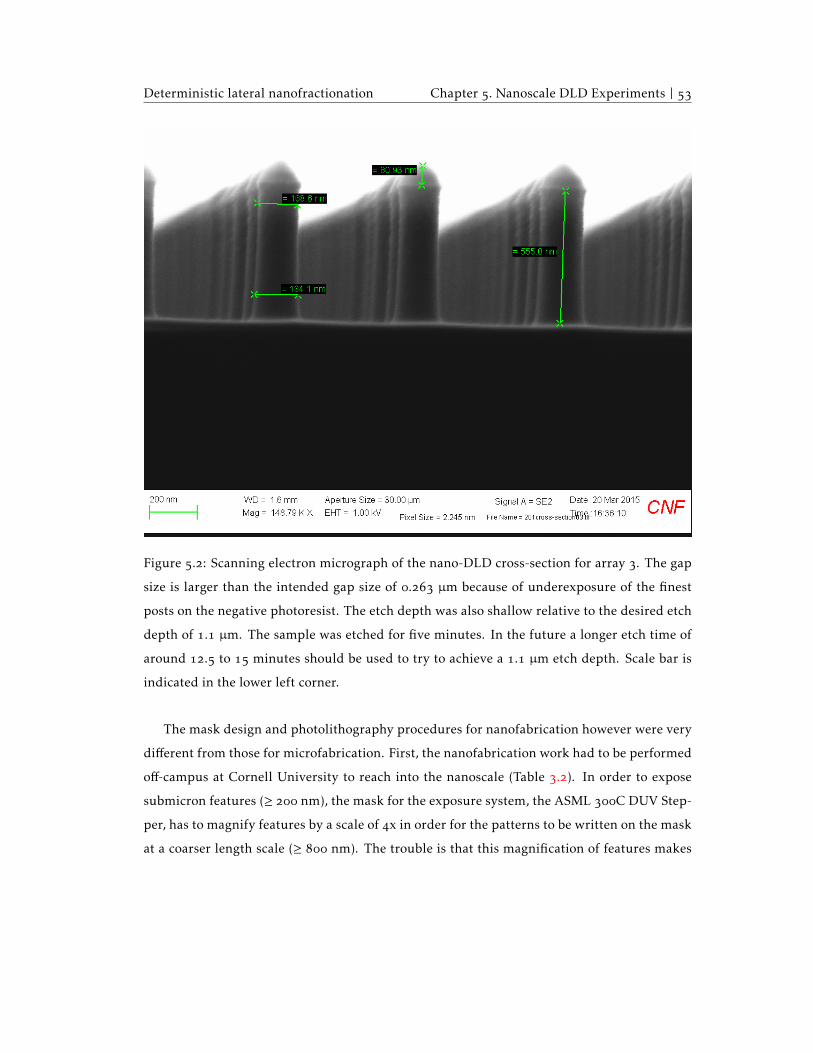
Deterministic lateral nanofractionation Chapter . Nanoscale DLD Experiments |
Figure .: Scanning electron micrograph of the nano-DLD cross-section for array . The gap
size is larger than the intended gap size of . µm because of underexposure of the finest
posts on the negative photoresist. The etch depth was also shallow relative to the desired etch
depth of . µm. The sample was etched for five minutes. In the future a longer etch time of
around . to minutes should be used to try to achieve a . µm etch depth. Scale bar is
indicated in the lower left corner.
The mask design and photolithography procedures for nanofabrication however were very
different from those for microfabrication. First, the nanofabrication work had to be performed
off-campus at Cornell University to reach into the nanoscale (Table .). In order to expose
submicron features (≥ nm), the mask for the exposure system, the ASML C DUV Step-
per, has to magnify features by a scale of x in order for the patterns to be written on the mask
at a coarser length scale (≥ nm). The trouble is that this magnification of features makes

Deterministic lateral nanofractionation Chapter . Nanoscale DLD Experiments |
Figure .: Zoomed-out scanning electron micrograph of the second transition region of the
nano-DLD. Array is on the left and array is on the right. The darkened region in the center
marks the carbonized region imaged in Figure .. The SEM image was taken at the Cornell
University Nanoscale Science and Technology Facility.
the patterns larger on the mask, reducing the field of view available for patterns on the mask.
The solution involved reducing the cascade design (Figure .) into eight units that fit in the
roughly mm x mm square field of view on the ASML Stepper mask (Figure .). The
ASML Stepper is able to take any of those patterns and rapidly expose it over and over again
at multiple precisely defined locations on the wafer. This process was used to stitch together
the entire cascade design from the eight pattern units.
In addition to challenges in photolithography, the nano-DLD posed problems in etching.
The parameters for precisely etching a certain submicron depth of the bump array using the

Deterministic lateral nanofractionation Chapter . Nanoscale DLD Experiments |
Figure .: Close-up scanning electron micrograph of the nano-DLD cascade’s second transi-
tion region between arrays and . Array (Dc = 0.2 µm) is on the left side. Large particles
are bumped in array to the top where the second serpentine output is located. Array
(Dc = 0.15 µm) is on the right. Image was taken at the Cornell University Nanoscale Science
and Technology Facility.
Bosch etching process is not well characterized. The etching parameters used herein involved
steps of: minute Release plus minutes Photonics etch for chamber conditioning, fol-
lowed by a minute etch on samples. After doing the etch on the wafers, a minute Release
etch followed by a loop Trench was run to recondition the chamber for other users. These
etch settings yielded an etch depth of about half a micron (Figure .). In the future, as per
the CNF etching staff’s advice, a longer etch time on the samples of . to minutes should
be tried to increase the etch depth. A limiting factor is the amount of photoresist left on the
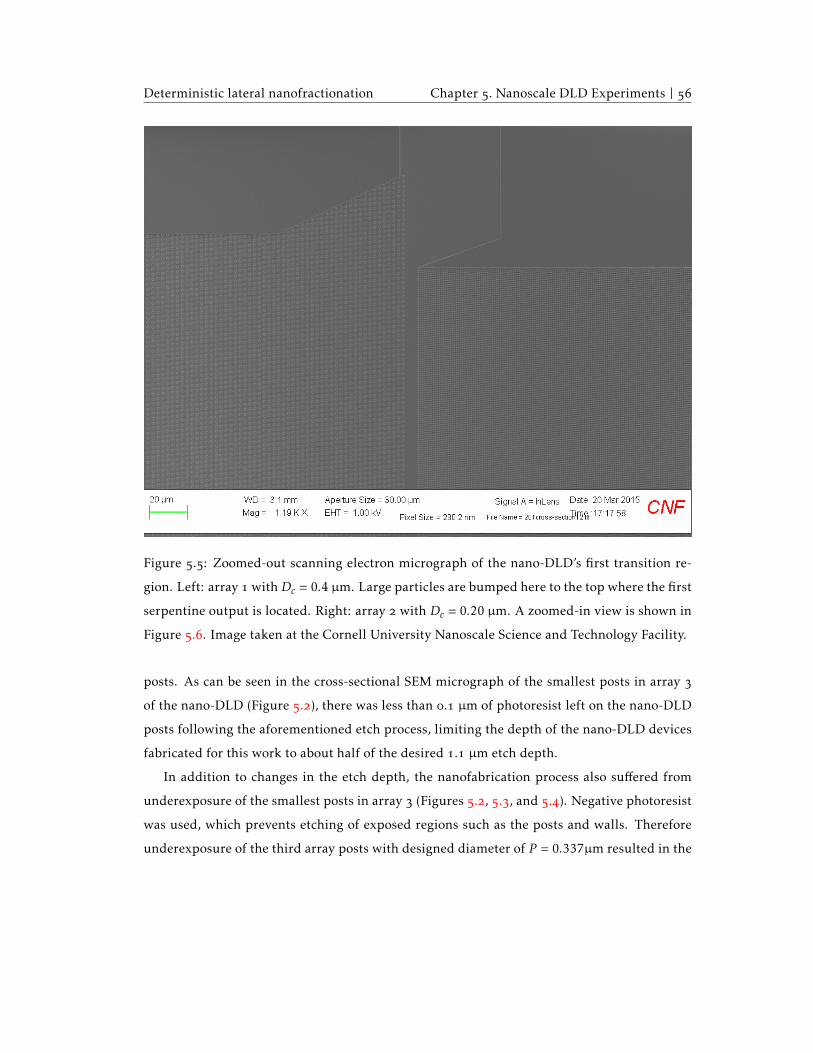
Deterministic lateral nanofractionation Chapter . Nanoscale DLD Experiments |
Figure .: Zoomed-out scanning electron micrograph of the nano-DLD’s first transition re-
gion. Left: array withDc = 0.4 µm. Large particles are bumped here to the top where the first
serpentine output is located. Right: array with Dc = 0.20 µm. A zoomed-in view is shown in
Figure .. Image taken at the Cornell University Nanoscale Science and Technology Facility.
posts. As can be seen in the cross-sectional SEM micrograph of the smallest posts in array
of the nano-DLD (Figure .), there was less than . µm of photoresist left on the nano-DLD
posts following the aforementioned etch process, limiting the depth of the nano-DLD devices
fabricated for this work to about half of the desired . µm etch depth.
In addition to changes in the etch depth, the nanofabrication process also suffered from
underexposure of the smallest posts in array (Figures ., ., and .). Negative photoresist
was used, which prevents etching of exposed regions such as the posts and walls. Therefore
underexposure of the third array posts with designed diameter of P = 0.337µm resulted in the

Deterministic lateral nanofractionation Chapter . Nanoscale DLD Experiments |
Figure .: Close-up scanning electron micrograph of the nano-DLD cascade’s first transition
region between arrays and . Left: array with Dc = 0.4 µm. Large particles are bumped
here to the top where the first serpentine output is located. Right: array with Dc = 0.20 µm.
Image taken at the Cornell University Nanoscale Science and Technology Facility.
posts having a smaller diameter of P = 0.19µm (Tables . and .; Figure .). The posts in
the second array of diameter P = 0.57µm however had the same fabricated diameter as was
designed, indicating that they were large enough to not suffer from underexposure. Larger
post patterns for array with diameters of P = 0.45µm and P = 0.57µm were included in
the ASML Stepper mask in anticipation of the underexposure issue (bottom-left and bottom-
right boxes, respectively, of Figure . (i)). These larger posts could be used to expose on
top of the original third array exposures to accommodate the underexposure issue in future
nanofabrication work of nano-DLD devices on the ASML Stepper.

Deterministic lateral nanofractionation Chapter . Nanoscale DLD Experiments |
Overall, the fabrication process for nano-DLD devices is more technically challenging than
the procedure for making microscale ones. However, there are clear workarounds to many of
these challenges. The details here will hopefully help determine the best design, photolithog-
raphy, and etch parameters for accurately fabricating nanoscale DLD devices in the future.
. Results
As we move the cascade DLD to the nanoscale, two questions emerge. First, will diffusion
change the performance of deterministic lateral displacement at the nanoscale? If it does, as
recent experiments suggest [], will the closed cascade design be able to expand the dynamic
range of deterministic lateral separation in this lower Péclet number regime?
To gain insight into these questions, beads of size . µm were flown into the nano-DLD
cascade device (Figure .). An EMCCD camera, with improved sensitivity compared to the
CCD camera for detecting emitted fluorescence from small beads, was used for imaging. Prior
to the experiment, the nano-DLD devices were diced, sealed by anodic bonding to borosilicate
glass, loaded onto a polycarbonate holder, and wetted with % PEG in DI water in the vacuum
chamber for half an hour as described in Chapter .
It was difficult to draw conclusions from the experimental data due to two issues. First, the
nano-DLD chip did not completely seal to the glass during anodic bonding. The bottom half
of the chip, from the third array to the output channels, did not bond to the glass. This lack of
sealing is visible in the images of the nano-DLD shown in Figures ., ., and ..
The second issue was leaking behind the nano-DLD chip around the input holes on the
polycarbonate holder. This leaking dramatically reduced the apparent flow rate in the nano-
DLD. For example, when . µm were flown into the chip at a total flow rate of . µL/hr
(. µL/hr in the buffer input with the NE- syringe pump and . µL/hr in the sample
input with the Nexus syringe pump), a flow velocity of mm/s was predicted in the
device and beads were expected to appear as blurs on the EMCCD camera for exposure times
of ms. Instead, the beads moved slow enough to be tracked for minutes in a single frame
of view. In the fluorescent image of beads moving through the nano-DLD shown in Figure .,
for example, beads (blue) through (teal) appear to move slower than µm/s.
The trajectories of seven beads entering the first side channel of the nano-DLD are shown

Deterministic lateral nanofractionation Chapter . Nanoscale DLD Experiments |
in Figure .. This fluorescent image was acquired at the end of a -frame time series;
the trajectories of these beads over this duration were manually annotated and shown in color.
Beads (red) and (yellow) move with the direction of fluid flow from the top to the bottom of
the image, and enter the serpentine channel entrance. Beads (blue) through (teal) appear
to move through the serpentine channel as intended in the cascade design. However this
motion appears more diffusive and less directed than the motion of beads and in the first
array. From these results, we gather that it is at least possible that beads would enter the
serpentine channels in a properly running nano-DLD cascade. Note however that the beads
should have bumped in the second array and entered the second serpentine channel, not the
first shown here. Other . µm beads were also observed to enter the second serpentine array
downstream (data not shown).
It is also interesting to note that while bead (yellow) initially enters the cascade entrance,
it then turns to the left as if to enter the second array (Figure .). Bead also appears to have
its movement arrested near a stuck bead which appears as a white particle between the tracks
of beads and near the serpentine channel entrance. It was observed that numerous beads
became stuck to the device throughout the course of imaging.
Figure . shows a fluorescent image and tracks of seven nm beads flowing through the
first array of the nano-DLD upstream of the region shown in .. The nm bead solutions
were used to replace the nm bead inputs used in the previous experiment. Because the
same nano-DLD was used but not cleaned in between runs, numerous nm beads are visible
on the left side of the image; most of these beads are stuck. The trajectories of the seven tracked
nm beads reveal a decrease in the bead and possibly fluid flow velocity away from the wall
on the right marked by the white line. Beads (red), (yellow), and (green) exhibit long
trajectories over the course of s, while beads (blue), (orange), and (beige) migrate less
than half as much, and bead seven (pink) moves hardly at all.
The dual issues of sealing the chip to the holder around the input holes and sealing the
entire chip to glass during anodic bonding have frustrated initial attempts to evaluate the
fractionation ability of the nano-DLD cascade device. Nevertheless, preliminary experiments
with nm and nm beads running through the nano-DLD leave open the possibility
that the nano-DLD device may function as expected. These results importantly demonstrate
that the experimental setup used herein will be able to detect beads flowing inside the nano-

Deterministic lateral nanofractionation Chapter . Nanoscale DLD Experiments |
DLD in future experiments that may yield clearer insights into the fractionation ability of the
nanoscale cascade DLD device.
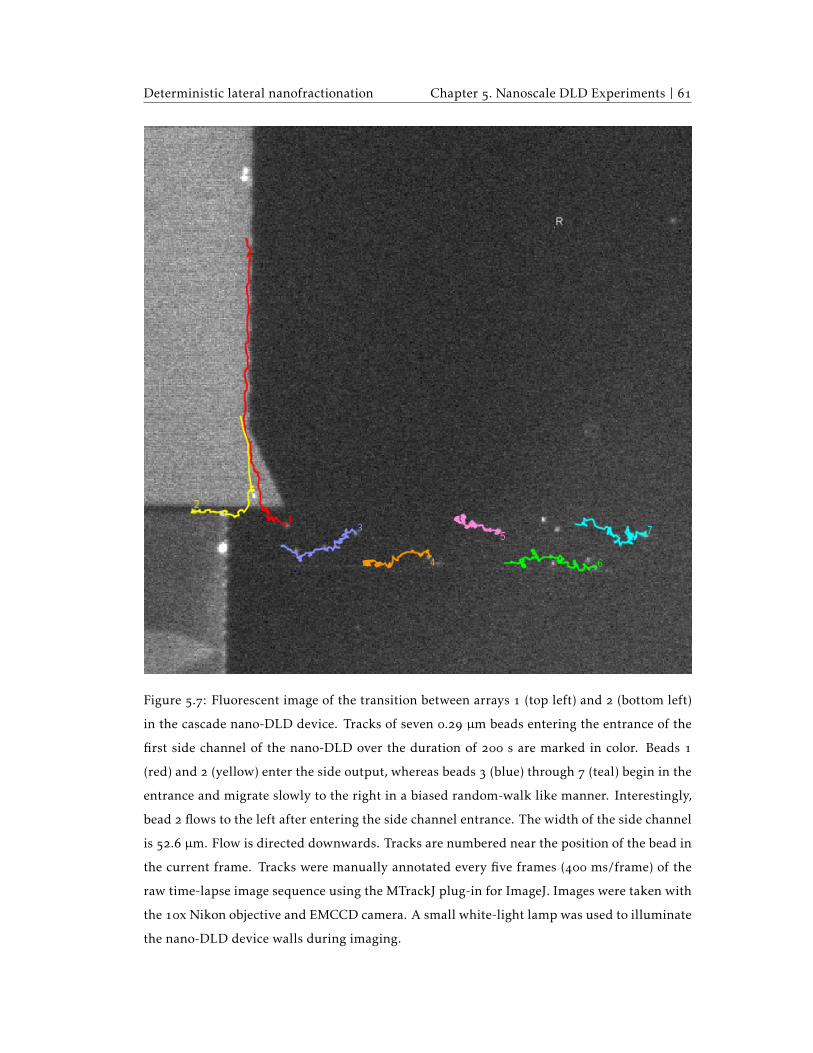
Deterministic lateral nanofractionation Chapter . Nanoscale DLD Experiments |
Figure .: Fluorescent image of the transition between arrays (top left) and (bottom left)
in the cascade nano-DLD device. Tracks of seven . µm beads entering the entrance of the
first side channel of the nano-DLD over the duration of s are marked in color. Beads
(red) and (yellow) enter the side output, whereas beads (blue) through (teal) begin in the
entrance and migrate slowly to the right in a biased random-walk like manner. Interestingly,
bead flows to the left after entering the side channel entrance. The width of the side channel
is . µm. Flow is directed downwards. Tracks are numbered near the position of the bead in
the current frame. Tracks were manually annotated every five frames ( ms/frame) of the
raw time-lapse image sequence using the MTrackJ plug-in for ImageJ. Images were taken with
the x Nikon objective and EMCCD camera. A small white-light lamp was used to illuminate
the nano-DLD device walls during imaging.
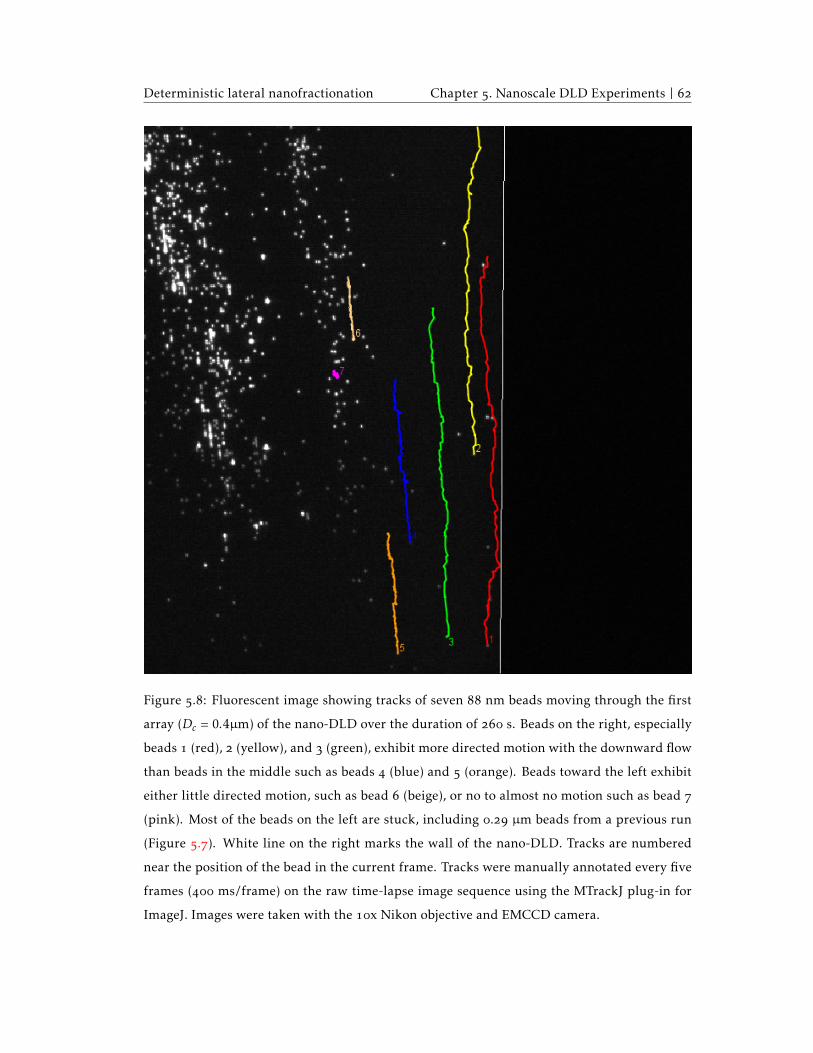
Deterministic lateral nanofractionation Chapter . Nanoscale DLD Experiments |
Figure .: Fluorescent image showing tracks of seven nm beads moving through the first
array (Dc = 0.4µm) of the nano-DLD over the duration of s. Beads on the right, especially
beads (red), (yellow), and (green), exhibit more directed motion with the downward flow
than beads in the middle such as beads (blue) and (orange). Beads toward the left exhibit
either little directed motion, such as bead (beige), or no to almost no motion such as bead
(pink). Most of the beads on the left are stuck, including . µm beads from a previous run
(Figure .). White line on the right marks the wall of the nano-DLD. Tracks are numbered
near the position of the bead in the current frame. Tracks were manually annotated every five
frames ( ms/frame) on the raw time-lapse image sequence using the MTrackJ plug-in for
ImageJ. Images were taken with the x Nikon objective and EMCCD camera.

Chapter
Conclusion
This work set out to determine if the cascade array could increase the dynamic range of DLD
and allow fractionation of micro- and nanoparticles. The cascade array was designed, fabri-
cated, and tested. Although preliminary experiments have not yielded a definite conclusion
about the cascade array’s fractionation ability, they have yielded the groundwork for future
experiments that may eventually answer the questions proposed here.
First, the parameters for correctly exposing and etching nano-DLD devices with desired
post diameters below nm and etch depths around µm were developed. The creation of
an ASML Stepper mask for exposing nano-DLD chips was also made for the first time, and will
provide a template for future nano-DLD designs. The sealing of the nano-DLD was clarified
as one of the most significant challenges for experiments. These findings will hopefully con-
tribute to the implementation of successful future investigations into the nanoscale cascade
array.
Second, some information was gleaned about the cascade DLD performance despite exper-
imental difficulties. Particles were observed to flow into the side output channels in both the
microscale and nanoscale cascade arrays, providing a first hint that the cascade device may be
able to function as predicted.
Finally, this project has introduced me to the possibilities of applying physics and microflu-
idics to medicine. It is my hope that the skills, relationships, and interests cultivated here will
live on to shape and inspire my work as a future physician.

Bibliography
[] Leonora Balaj, Ryan Lessard, Lixin Dai, Yoon-Jae Cho, Scott L Pomeroy, Xandra O Breake-
field, and Johan Skog. Tumour microvesicles contain retrotransposon elements and am-
plified oncogene sequences. Nature communications, :, January .
[] Cdc. Mortality Multiple Cause Micro-data Files. National Vital Statistics Report,
(), .
[] S. Cerbelli. Separation of polydisperse particle mixtures by deterministic lateral dis-
placement. The impact of particle diffusivity on separation efficiency. Asia-Pacific Journal
of Chemical Engineering, :–, .
[] Stefano Cerbelli, Massimiliano Giona, and Fabio Garofalo. Quantifying dispersion of
finite-sized particles in deterministic lateral displacement microflow separators through
BrennerâĂŹs macrotransport paradigm. Microfluidics and Nanofluidics, ():–,
.
[] Chihchen Chen, Johan Skog, Chia-Hsien Hsu, Ryan T Lessard, Leonora Balaj, Thomas
Wurdinger, Bob S Carter, Xandra O Breakefield, Mehmet Toner, and Daniel Irimia. Mi-
crofluidic isolation and transcriptome analysis of serum microvesicles. Lab on a chip,
():–, February .
[] John R Chevillet, Qing Kang, Ingrid K Ruf, Hilary A Briggs, Lucia N Vojtech, Sean M
Hughes, Heather H Cheng, Jason D Arroyo, Emily K Meredith, Emily N Gallichotte, Era L
Pogosova-Agadjanyan, Colm Morrissey, Derek L Stirewalt, Florian Hladik, Evan Y Yu,
Celestia S Higano, and Muneesh Tewari. Quantitative and stoichiometric analysis of the

Deterministic lateral nanofractionation BIBLIOGRAPHY |
microRNA content of exosomes. Proceedings of the National Academy of Sciences of the
United States of America, ():–, September .
[] Henry Darcy. Les fontaines publiques de la ville de Dijon. .
[] John a Davis, David W Inglis, Keith J Morton, David a Lawrence, Lotien R Huang,
Stephen Y Chou, James C Sturm, and Robert H Austin. Deterministic hydrodynamics:
taking blood apart. Proceedings of the National Academy of Sciences of the United States of
America, ():–, .
[] John Alan Davis. Microfluidic Separation of Blood Components through Deterministic Lateral
Displacement. PhD thesis, Princeton University, .
[] Jaideep S. Dudani, Daniel R. Gossett, Henry T. K. Tse, Robert J. Lamm, Rajan P. Kulkarni,
and Dino Di Carlo. Rapid inertial solution exchange for enrichment and flow cytometric
detection of microvesicles. Biomicrofluidics, ():, .
[] A Einstein. Über die von der molekularkinetischen Theorie der Wärme geforderte Bewe-
gung von in ruhenden Flüssigkeiten suspendierten Teilchen. Annalen der physik, .
[] Albert Einstein. Investigations on the Theory of the Brownian Movement. .
[] R P Feynman, R B Leighton, and M L Sands. The Feynman Lectures on Physics, Vol. .
Number v. in The Feynman Lectures on Physics. Addison-Wesley, .
[] Stefan H Holm, Jason P Beech, Michael P Barrett, and Jonas O Tegenfeldt. Separation
of parasites from human blood using deterministic lateral displacement. Lab on a chip,
():–, .
[] Lotien Richard Huang, Edward C Cox, Robert H Austin, and James C Sturm. Continuous
particle separation through deterministic lateral displacement. Science (New York, N.Y.),
():–, May .
[] David Inglis. Microfluidic Devices for Cell Separation. PhD thesis, Princeton University,
.
[] David W. Inglis. Efficient microfluidic particle separation arrays. Applied Physics Letters,
():–, .
Deterministic lateral nanofractionation BIBLIOGRAPHY |
[] David W Inglis, John a Davis, Robert H Austin, and James C Sturm. Critical particle size
for fractionation by deterministic lateral displacement. Lab on a chip, ():–, May
.
[] Shailender Singh Kanwar, Christopher James Dunlay, Diane M Simeone, and Sunitha
Nagrath. Microfluidic device (ExoChip) for on-chip isolation, quantification and charac-
terization of circulating exosomes. Lab on a chip, April .
[] Nezihi Murat Karabacak, Philipp S Spuhler, Fabio Fachin, Eugene J Lim, Vincent Pai,
Emre Ozkumur, Joseph M Martel, Nikola Kojic, Kyle Smith, Pin-i Chen, Jennifer Yang,
Henry Hwang, Bailey Morgan, Julie Trautwein, Thomas a Barber, Shannon L Stott, Shya-
mala Maheswaran, Ravi Kapur, Daniel a Haber, and Mehmet Toner. Microfluidic, marker-
free isolation of circulating tumor cells from blood samples. Nature protocols, ():–
, .
[] George S Liu. Sorting Exosomes with the Bump Array. Spring junior paper, Princeton
University, .
[] Kevin Loutherback, Kevin S. Chou, Jonathan Newman, Jason Puchalla, Robert H. Austin,
and James C. Sturm. Improved performance of deterministic lateral displacement arrays
with triangular posts. Microfluidics and Nanofluidics, ():–, May .
[] Kevin Loutherback, Joseph D Silva, Liyu Liu, Amy Wu, Robert H Austin, and James C
Sturm. Deterministic separation of cancer cells from blood at mL / min Deterministic
separation of cancer cells from blood at mL / min. :–, .
[] J. McGrath, M. Jimenez, and H. Bridle. Deterministic lateral displacement for particle
separation: a review. Lab Chip, ():–, .
[] Erik Meijering, Oleh Dzyubachyk, and Ihor Smal. Methods for Cell and Particle Tracking.
(February), .
[] Emre Ozkumur, Ajay M Shah, Jordan C Ciciliano, Benjamin L Emmink, David T
Miyamoto, Elena Brachtel, Min Yu, Pin-i Chen, Bailey Morgan, Julie Trautwein, Anya
Kimura, Sudarshana Sengupta, Shannon L Stott, Nezihi Murat Karabacak, Thomas a Bar-
ber, John R Walsh, Kyle Smith, Philipp S Spuhler, James P Sullivan, Richard J Lee, David T

Deterministic lateral nanofractionation BIBLIOGRAPHY |
Ting, Xi Luo, Alice T Shaw, Aditya Bardia, Lecia V Sequist, David N Louis, Shyamala
Maheswaran, Ravi Kapur, Daniel a Haber, and Mehmet Toner. Inertial focusing for tu-
mor antigen-dependent and -independent sorting of rare circulating tumor cells. Science
translational medicine, ():ra, .
[] Daniela F Quail and Johanna a Joyce. Microenvironmental regulation of tumor progres-
sion and metastasis. Nature medicine, ():–, .
[] G Raposo, HW Nijman, W Stoorvogel, R Leijendekker, C Harding, C Melief, and H Geuze.
B lymphocytes secrete antigen-presenting vesicles. The Journal of Experimental Medicine,
(March), .
[] Graça Raposo and Willem Stoorvogel. Extracellular vesicles: exosomes, microvesicles,
and friends. The Journal of cell biology, ():–, February .
[] WS Rasband. ImageJ. U. S. National Institutes of Health, Bethesda, Maryland, USA, page
//imagej.nih.gov/ij/, .
[] Nilay Sethi and Yibin Kang. Unravelling the complexity of metastasis âĂŤ molecular
understanding and targeted therapies. Nature Reviews Cancer, ():–, .
[] Huilin Shao, Jaehoon Chung, Leonora Balaj, Alain Charest, Darell D Bigner, Bob S Carter,
Fred H Hochberg, Xandra O Breakefield, Ralph Weissleder, and Hakho Lee. Protein
typing of circulating microvesicles allows real-time monitoring of glioblastoma therapy.
Nature medicine, ():–, December .
[] Basant Kumar Thakur, Haiying Zhang, Annette Becker, Irina Matei, Yujie Huang, Bruno
Costa-Silva, Yan Zheng, Ayuko Hoshino, Helene Brazier, Jenny Xiang, Caitlin Williams,
Ruth Rodriguez-Barrueco, Jose M Silva, Weijia Zhang, Stephen Hearn, Olivier Ele-
mento, Navid Paknejad, Katia Manova-Todorova, Karl Welte, Jacqueline Bromberg, Héc-
tor Peinado, and David Lyden. Double-stranded DNA in exosomes: a novel biomarker in
cancer detection. Cell research, pages –, April .
[] C Théry, Aled Clayton, S Amigorena, and Graca Raposo. Isolation and characterization
of exosomes from cell culture supernatants and biological fluids. Current Protocols in Cell
Biology, pages –, .
Deterministic lateral nanofractionation BIBLIOGRAPHY |
[] Hadi Valadi, Karin Ekström, Apostolos Bossios, Margareta Sjöstrand, James J Lee, and
Jan O Lötvall. Exosome-mediated transfer of mRNAs and microRNAs is a novel mecha-
nism of genetic exchange between cells. Nature cell biology, ():–, June .
[] Zongxing Wang, Hung-jen Wu, Daniel Fine, Jeffrey Schmulen, Ye Hu, Biana Godin, John
X J Zhang, and Xuewu Liu. Ciliated micropillars for the microfluidic-based isolation of
nanoscale lipid vesicles. Lab on a chip, ():–, August .
[] Benjamin H. Wunsch, Joshua T. Smith, Chao Wang, Stacey M. Gifford, Markus Brink,
Robert Bruce, Robert H. Austin, Gustavo Solovitzky, and Yann Astier. Sorting of
Nanoscale Biological Particles on Silicon. .