georgia: lg monitoring and project impact evaluation washington dc, 23 march, 2015 david labadze –...
TRANSCRIPT

1
Georgia: LG Monitoring andProject Impact
Evaluation
Washington DC, 23 March, 2015
David Labadze – LG Monitoring Expert
David Egiashvili – LGAF Country Coordinator
Denys Nizalov – Land Monitoring Coordinator, Kyiv School of Economics
Kateryna Chmelova – Data Analyst
2
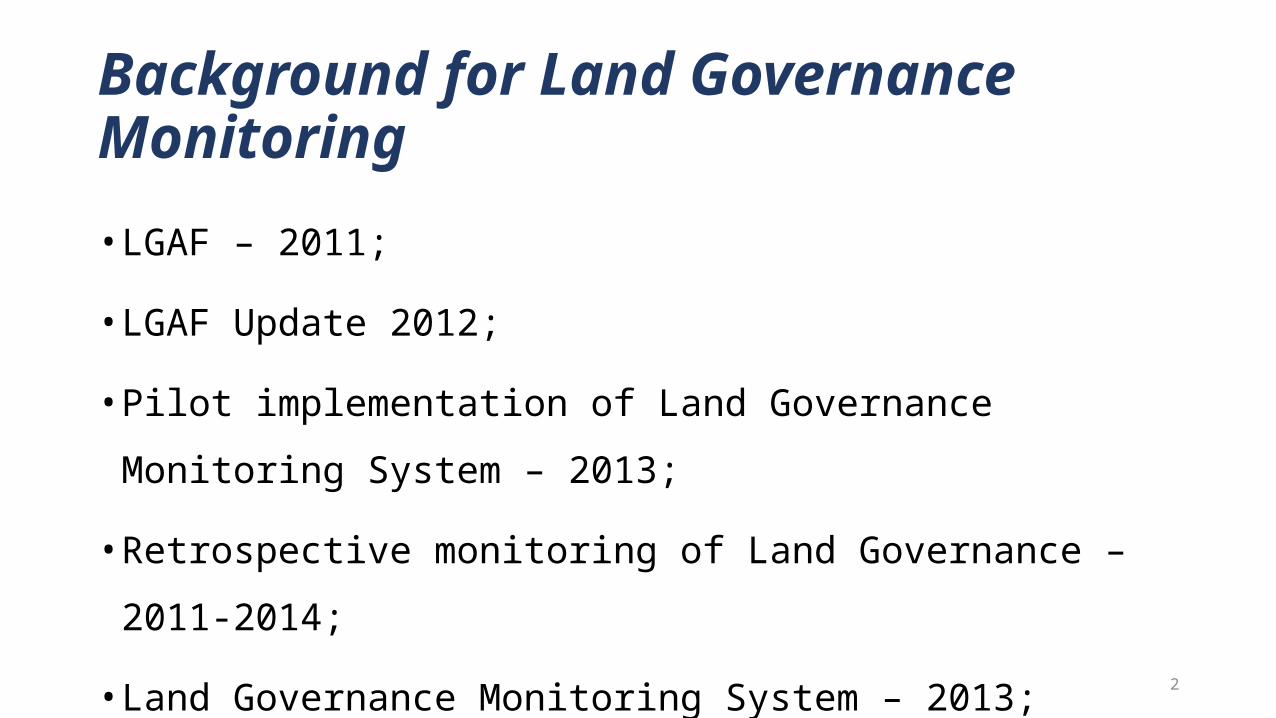
Background for Land Governance Monitoring
• LGAF – 2011;
• LGAF Update 2012;
• Pilot implementation of Land Governance Monitoring System – 2013;
• Retrospective monitoring of Land Governance – 2011-2014;
• Land Governance Monitoring System – 2013;

3
Monitoring Indicators
A. Number (and prices where possible) of registered transactions of different types – (2011-2014);
B. Receipts of land tax revenue – (2011-2014);C. Share of communal, private, and state land mapped – (2013);D. Cases of expropriation and privatization – (2013);E. Number of land-related conflicts in the courts – (2011-2014);F. Share of agricultural/residential land registered and mapped in
women’s/men’s name or in joint ownership – (2011-2014);
Note: Pilot Implementation (2013); Retrospective update (2011-2014)

4
Data Sources
Note: Pilot Implementation (2013); Retrospective update (2011-2014)
National Agency of Public RegistryLand Inventory (2006)Land Cadaster (31.12.2014)Registry of Real Estate and Immovable Property (2011- 2014)
Court (from District Level) (2011-2014);Neighbor disputesImmovable property ownershipLease, agricultural land leaseMortgageInheritance-related disputes, etc.
Revenue Service (2011- 2014) Land and real estate tax revenues by municipalities
Road Department (Ministry of Infrastructure and Regional Development) (2013);

5
Group A. Number and prices of registered transactions

6
* 2012 is adjusted for number of transactions of ownership registration of agricultural land connected with the reform of 2012 (472,446 transactions )
Indicator A.Number of Land and Real Estate Transactions
Data: Registry of Real Estate and Immovable Property (2011- 2014)
2011 2012 2013 2014
total 000 pop
% of all trans total 000
pop% of all
trans total 000 pop
% of all trans total 000
pop% of all
trans
Linear Objects 3,271 0.73 0.68 3,455 0.77 0.65 5,039 1.12 1.07 4,548 1.01 0.88
Real Estate 212,279 47.50 43.88 249,243 55.42 47.03 220,161 49.10 46.82 242,719 54.05 47.16
Agricultural Land 158,014 35.36 32.66 176,598 39.26 33.33 152,316 33.97 32.39 170,681 38.01 33.17
Non-agricultural Land 110,234 24.67 22.79 100,621 22.37 18.99 92,719 20.68 19.72 96,690 21.53 18.79
Total 483,798 108.25 100.00 529,917 117.82 100.00 470,235 104.87 100.00 514,638 114.61 100.00

7
2013 2014
Region Housing (%)
Agr (%)
non-agr (%)
Housing (%)
Agr (%)
non-agr (%)
Tbilisi 64.46 5.69 40.5 65.11 4.91 40.96Ajara A.R. 14.03 6.34 9.98 13.99 5.76 9.89Guria 0.35 4.44 1.71 0.31 4.88 1.83Imereti 7.79 12.98 13.87 7.73 14.72 13.49Kakheti 1.01 20.41 4.76 0.91 19.37 5.15Mtskheta-Mtianeti 0.66 8.48 2.77 0.71 8.7 3.32Racha-Lechkhumi and Kvemo Svaneti 0.05 1.02 0.64 0.05 1.14 0.59
Samegrelo-Zemo Svaneti 2.01 6.48 7.17 2.09 7.57 7.5Samtskhe-Javakheti 1.38 5.74 4.76 1.27 4.77 4.37Kvemo Kartli 6.48 19.5 8.01 6.16 18.79 6.88Shida Kartli 1.8 8.91 5.84 1.66 9.39 6.03Georgia 100 100 100.00 100 100 100
Regional distribution of transactions
Data: Registry of Real Estate and Immovable Property (2011- 2014)
Indicator A.

8
Indicator A.
Data: Registry of Real Estate and Immovable Property (2011-2014)
1 2 3 4 1 2 3 4 1 2 3 4 1 2 3 42011 2012 2013 2014
900
9,000
90,000
900,000
Dynamics of sales, mortgage and primary registration transactions by quarters, 2011-2014
Primary registrationsSalesMortgagesAll transactionsReform registrations

9
Agricultural
Average and
Median Sale Price
Data: Registry of Real Estate and Immovable Property (2011- 2014)
1 2 3 4 1 2 3 4 1 2 3 4 1 2 3 42011 2012 2013 2014
0
20000
40000
60000
80000
100000
120000
0
500
1000
1500
2000
2500
3000
3500
4000
4500
5000
Average Prices Median Prices
Aver
age
Pric
es, U
SD/s
q.m
Med
ian
Pric
es, U
SD/s
q.m
Indicator A.

10
Non-Agricultur
al Average
and Median
Sale Price
Data: Registry of Real Estate and Immovable Property (2011- 2014)
1 2 3 4 1 2 3 4 1 2 3 4 1 2 3 42011 2012 2013 2014
0
100000
200000
300000
400000
500000
600000
700000
Average Prices Median Prices
USD
/ s
q.m
Indicator A.

11
2011 2012 2013 2014Non-agricultural
land 3.338 1.680 8.537 12.58
Agricultural land 0.046 0.033 0.035 0.076
Housing 338.4 397.9 441.1 468.5
Median Price per Sq. M, real USD
*Corrected for outliers
Indicator A.
Data: Registry of Real Estate and Immovable Property (2011- 2014)

12
Agricultural Land
Sale Median
Prices and Total
Revenue. 2014
Indicator A.
Data: Registry of Real Estate and Immovable Property (2011- 2014)
Median prices (USD per HA)
Total Revenue (per 1000 of population)

13
Non-Agricultur
al Land Sale
Median Prices and
Total Revenue.
2014
Indicator A.
Data: Registry of Real Estate and Immovable Property (2011- 2014)
Median prices (USD per HA)
Total Revenue (per 1000 of population)

14
*Total area includes land sold to organizations
resident80%
non-resident0.2%
undefined20%
Total area sold (HA): 28,823
Area (HA) sold by Citizenship of owners, Agricultural land
resident82%
non-resident1%
undefined17%
Total area sold (HA): 51,471
2013 2014
Indicator A.
Data: Registry of Real Estate and Immovable Property (2011- 2014)

15
resident34%
non-resident6%
undefined60%
Total area sold (HA): 1166
Area (HA) sold by Citizenship of owners, Non-Agricultural land
*Total area includes land sold to organizations
resident39%
non-resident14%
undefined47%
2013
Total area sold (HA): 1,263.43
2013 2014
Indicator A.
Data: Registry of Real Estate and Immovable Property (2011- 2014)

16
Average Price by Citizenship of owners, 2011-2014
Agricultural land
Non-Agricultural
landHousing
USD/ha USD/ha USD/sqm
Native 77,016 834,777 497
Foreign 151,355 1,083,349 755
* Difference in means is statistically significant
Indicator A.
Data: Registry of Real Estate and Immovable Property (2011- Sept 2014)

17
Group B. Receipts of land tax revenue

18
Taxes, 2014 Indicator B.
Data: Revenue Service (2014)
Agricultural Land Non-Agricultural Land
Regions Tax payers
Declared # of parcels
Declared area (HA)
Taxes collected (1000 GEL)
Tax payers
Declared # of parcels
Declared area (HA)
Taxes collected (1000 GEL)
Ajara A.R. 10273 13136 10.91 221.5 2710 3654 1288.55 2827.5Apkhazeti A.R. 20 25 7.54 0 17 21 7.08 0.3Guria 5363 7285 8.23 440.6 1444 1724 603.89 1243.7Imereti 5702 7308 41.09 712.9 5925 7299 3022.41 3123.2Kakheti 18232 25092 142.54 10565.8 3004 3575 1289.78 1368.4Kvemo Kartli 21744 25575 35.31 6222.4 3887 4822 5035.65 7391.7Mtskheta 11881 14249 33.01 426.4 1303 1777 4219.86 2322.9Racha-Lechkhumi 521 801 13.38 33.1 256 335 105.78 53.5
Samegrelo-Zemo Svaneti 4466 5611 86.4 1661.2 3531 4459 3617.76 4688.9
Samtskhe-Javakheti 4363 6203 97.08 1187 2163 3034 1641.59 2169.3
Shida Kartli 9408 13698 65.98 1683.6 2164 2612 738.56 1019.8Tbilisi 8383 10450 20.89 247 20874 27623 4791.59 11671.6Total 100356 129433 562.37 23401.5 47278 60935 26362.51 37880.9

19
Taxes (in 10000 GEL) and Area (in HA), 2011-2014 Indicator B.
Data: Revenue Service (2011-2014)
2011 2012 2013 20141000000
10000000
100000000
1000000000
non-agricultural area taxes for non-agricultural landagricultural area taxes for agricultural land

20
Group C. Share of communal, private, and state land mapped

21
Land area by categoryCategory Area (Ha) %
Residential 33,200 1%Industry 92,000 2%Agriculture 1,600,000 39%Pasture 899,000 22%Wood and forestry 890,000 21%Public 12,000 0%Infrastructure 58,600 1%Water 70,300 2%Other 422,000 10%No visible use 64,600 2%Total (Georgia) 4,141,700 100%
Indicator C.
* For inventoried territories Data: land inventory, 2004-2006

22
Group D. Cases of expropriation and privatization

23
Cases of Expropriation, 2013
Name Number Rate(GEL per Sq.M)
Area(Ha)
Ajara A.R. 243 15.61 32.17Imereti 254 3.14 16.25Shida Kartli 178 3.59 11.69Total (Georgia) 675 5.41 60.11
Indicator D.
Data: Road Department (Ministry of Infrastructure and Regional Development) (2013)

24
2011 2012 2013 2014Non-
agricultural land
#of parcels 874 1,052 743 525
area (HA) 137.35 677.73 139.26 407.06
Agricultural land
#of parcels 2,117 6,268 720 251
area (HA) 26,978.57 13,054.74 2,012.33 927.81
Real Estate #of transactions 484 1,876 794 209
Data: Registry of Real Estate and Immovable Property (2011-2014)
Cases of Privatization, 2011-2014Indicator D.

25
Group E. Number of land-related conflicts in the courts

26
Dispute Cases in District (City) Courts Indicator E.
Data: Court (2014)
Regions Cases started % of total
per 000 of
popul.Accept
edReject
edUnconsidere
dTermin
atedArchieve
dAppeal
edCases closed
Closed/Started cases
Tbilisi 2386 51.65 2.03 344 25 62 24 1505 146 497 0.21Ajara A.R. 515 11.15 1.30 248 27 46 34 254 66 428 0.83Guria 32 0.69 0.23 0 0 0 0 14 3 0 0.00Imereti 461 9.98 0.66 215 24 27 16 223 41 337 0.73Kakheti 208 4.50 0.51 87 10 12 4 21 16 156 0.75Mtskheta-Mtianeti 35 0.76 0.32 19 3 1 2 0 8 27 0.77Racha-Lechkhumi and Kvemo Svaneti 8 0.17 0.17 5 1 0 0 0 1 4 0.50
Samegrelo-Zemo Svaneti 189 4.09 0.40 72 20 5 6 14 22 115 0.61Samtskhe-Javakheti 202 4.37 0.95 98 14 8 10 17 34 164 0.81Kvemo Kartli 355 7.68 0.69 51 13 5 8 160 46 102 0.29Shida Kartli 226 4.89 0.72 62 9 13 4 17 35 83 0.37Apkhazeti A.R. 3 0.06 n\a 2 0 0 0 3 0 3 1.00Total (Georgia) 4620 100.00 1.03 1203 146 179 108 2228 418 1916 0.41

27
Dynamics of Dispute Cases in Courts Indicator E.
Data: Court (2011-2014)
2011 2012 2013 20140
1000
2000
3000
4000
5000
6000
7000
Cases started Cases closed Accepted Rejected

28
Group F. Share of agricultural/residential land registered and mapped in women’s and men’s name and in joint propertyIn progress:
• NAPR has linked the Registry of Real Estate and Immovable Property and CRA DB’s and imported the gender information.
Indicator F.

29
Agricultural Land Parcels by Owners
2011 2012 2013 20140
20000
40000
60000
80000
100000
120000
140000
160000
180000
200000
female male organizations
Indicator F.

30
Residential Land Parcels by Owners
2011 2012 2013 20140
5000
10000
15000
20000
25000
female male org
Indicator F.

32
Stakeholders Workshops
TbilisiWorld Bank Regional Office

33
A. Number (and prices where possible) of registered transactions of different types;
B. Receipts of land tax revenue;C. Share of communal, private, and state land mapped;D. Cases of expropriation and privatization;E. Number of land-related conflicts in the courts;F. Share of agricultural/residential land registered and mapped in
women’s/men’s name or in joint ownership;
Monitoring Indicators for Sakrebulo Level

34
Project Impact Evaluation
• Retrospective monitoring of pilot sakrebulos;• Retrospective monitoring of neighbor sakrebulos (raions);• Quarterly monitoring sakrebulos during and after project
implementation;
• Comparative analysis for project impact evaluation;

35
Next Steps
• Better engagement of Stakeholders and providers of information;• Involving decision makers;• Start Project Impact Evaluation;• Development of analytical and dissemination of results;• Short and long term development of monitoring system;

36
Thank you for your attention
David Labadze
LGAF Data Expert – [email protected]
David Egiashvili
LGAF Country Coordinator - [email protected]
Denys Nizalov
Land Monitoring Coordinator, Kyiv School of Economics – [email protected]
Kateryna Chmelova
Data Analyst - [email protected]