georgia world congress center georgia dome … gwcca annual report.pdfiv — set for completion in...
TRANSCRIPT
Georgia World Congress Center Authority 2001 Annual Report
Geor
gia
Wor
ld C
ongr
ess
Cent
er
G
eorg
ia D
ome
Cen
tenn
ial O
lym
pic
Park
Mission: The State of Georgia established theGeorgia World Congress Center Authority todevelop and operate the Georgia WorldCongress Center, the Georgia Dome,Centennial Olympic Park and related facilities.These facilities exist for the primary purpose ofpromoting and facilitating events and activitiesthat generate economic benefits to the citizensof the State of Georgia and the City of Atlantaas well as enhance the overall quality of life forevery Georgian.
Vision: Our vision is to constantly earn our reputation as one of the world’s finest convention, sports and entertainment venues.Every day we exemplify our steadfast commitment to excellence in our expertise, efficiency and quality of service. Our vision is tolead our industry through innovation; to operate successfully in an ethical manner; tosatisfy our customers’ expectations with motivated service-oriented employees; to provide a safe, clean environment; and to fosterboth the personal and professional growth ofour people.
Values: To achieve our vision, we make our customers the focus of all we do. We take pridein providing friendly and courteous service toour guests and customers. We strive constantlyto improve productivity and to promote thebest interests of the Georgia World CongressCenter, the Georgia Dome and CentennialOlympic Park.
Mission Statement
Contents
Director’s Report 03
GWCC Revenue & Expense 06
GWCC Bookings & Attendance 08
GWCC Economic Impact 09
GWCC Direct Benefit to Georgia 10
Phase IV Expansion 11
Georgia Dome Revenue & Expense 14
Georgia Dome Event Attendance 16
Georgia Dome Economic Impact 17
Centennial Olympic Park Revenue & Expense 20
Authority Balance Sheet 23
Authority Board of Governors 24
1976 - 2001
Twenty-five years
in the making
Begun in 1974,
construction on the
original facility took
18 months.
FiscalYear 2001 marks the Georgia WorldCongress Center’s silver anniversary. Thismilestone affords a time for reflection as
we move into a new era with three facilities thathave become the gathering place for millions ofconventioneers, sports fans and tourists duringthe last 25 years.
Since the Georgia World Congress Centeropened its doors in 1976, more than 31 millionvisitors have attended events at the facility creating an economic impact of more than $24 billion and generating nearly $1.32 billionin tax revenue. While these are amazing num-bers, they only tell part of the story.
The GWCC has proved to be the economicengine that drives Atlanta’s hospitality industry –filling up hotels and restaurants year-round.Couple that with our solid operating performance and a dedicated staff and the entirepicture emerges – thousands of jobs and billionsof dollars pumped into Georgia’s economy.
We also are fortunate to have the visionaryleadership and support of the Georgia GeneralAssembly. They continue to recognize andappreciate the value the convention and hospi-tality industry offers all residents of our state.During the last 25 years, this recognition hasresulted in authorization and funding for
expansions to the facility that were completedin 1985, 1992 and our latest addition – PhaseIV — set for completion in summer of 2002. Inaddition to the growth of the Georgia WorldCongress Center, we also welcomed the addi-tions of the Georgia Dome in 1992 andCentennial Olympic Park in 1996 to our campus of facilities.
Again this year – as has been the case fornearly 20 years – the Georgia World CongressCenter Authority was able to sustain operationswithout appropriations from the State. Boththe GWCC and Georgia Dome reported oper-ating profits in Fiscal Year 2001, and we gener-ated an economic impact of $2.3 billion,including $153 million in new tax revenues.
During the past 25 years, we have experienced tremendous growth within ourfacilities and industry, and we have had theprivilege to host some of the world’s most prestigious events. Our future holds greatpromise as well. Future bookings in our facilities remain strong, and our Phase IVexpansion positions us to meet market demandand future growth.
The following report offers financialdetails, as well as highlights accomplishments atthe Georgia World Congress Center, GeorgiaDome and Centennial Olympic Park. We hopeyou find this report informative, and we lookforward to continuing to generate economicbenefits for our state in the coming years.
Daniel A. GravelineExecutive DirectorGeorgia World Congress Center Authority
02 03
Director’s Report
Fiscal Year 2001, ending June 30, was another remarkable year for the GeorgiaWorld Congress Center. We posted our
second-best profit in history, and the facilitywas the most profitable publicly owned convention center in North America.
We generated operating revenues of$39,983,740, a net gain of $10,515,921, andmore than $138 million in new tax revenues.
Construction of Phase IV continued at ahealthy pace and remains on schedule for completion in summer of 2002. To date, morethan 248 events have been booked in theexpansion through 2015.
Our experienced, professional staff sets theindustry standard for convention centersaround the world. By providing a clean, efficient building along with superior customerservice, our customers have recognized thevalue of holding events at the Georgia WorldCongress Center, and our facility and reputationhave become the envy of our competition.
Again this year, the Georgia WorldCongress Center Authority continued itsrecord of strong community involvement.Highlights included contributing more than22,000 pounds of food to Atlanta’s Table andearning a Governor’s Honors Award for thehighest percentage increase for employee participation in the State CharitableContributions Program. 04 05
Georgia World Congress Center
We posted our
second-best profit in
history, and the facility
was the most profitable
publicly owned
convention center
in North America
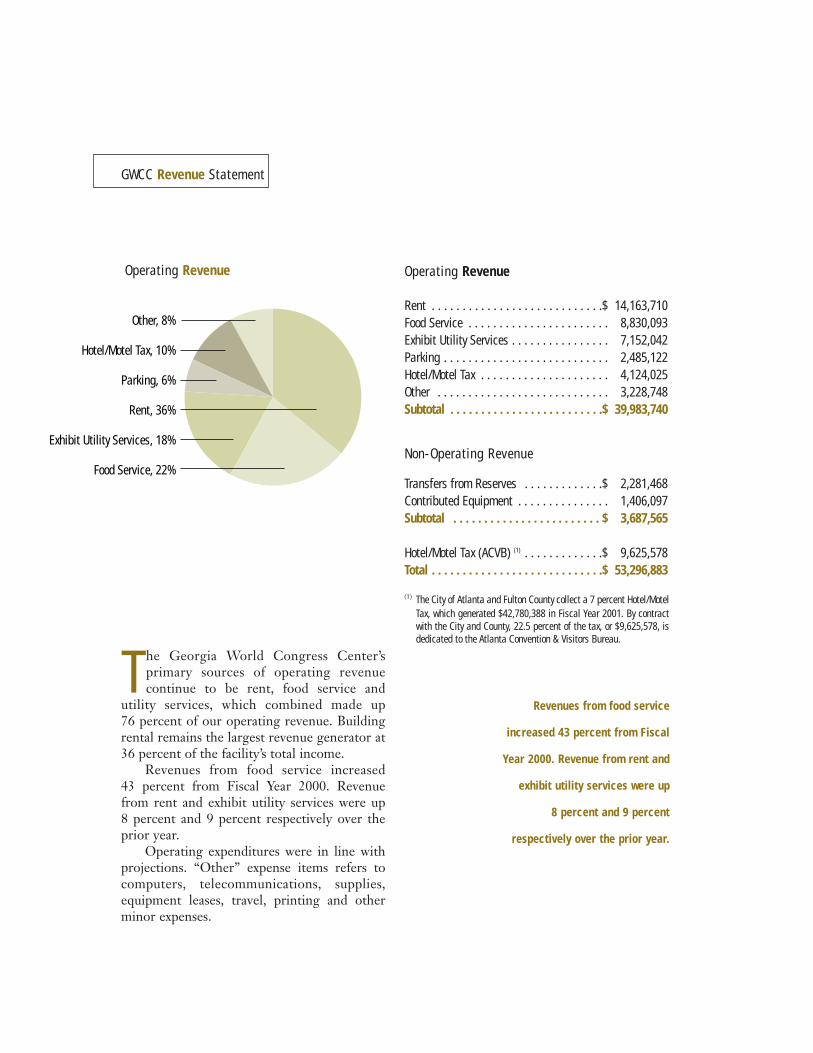
The Georgia World Congress Center’s primary sources of operating revenue continue to be rent, food service and
utility services, which combined made up 76 percent of our operating revenue. Buildingrental remains the largest revenue generator at36 percent of the facility’s total income.
Revenues from food service increased 43 percent from Fiscal Year 2000. Revenuefrom rent and exhibit utility services were up 8 percent and 9 percent respectively over theprior year.
Operating expenditures were in line withprojections. “Other” expense items refers tocomputers, telecommunications, supplies,equipment leases, travel, printing and otherminor expenses.
GWCC Revenue Statement
Other, 8%
Hotel/Motel Tax, 10%
Parking, 6%
Rent, 36%
Exhibit Utility Services, 18%
Food Service, 22%
Operating Revenue
Rent . . . . . . . . . . . . . . . . . . . . . . . . . . . .$ 14,163,710Food Service . . . . . . . . . . . . . . . . . . . . . . . 8,830,093Exhibit Utility Services . . . . . . . . . . . . . . . . 7,152,042Parking . . . . . . . . . . . . . . . . . . . . . . . . . . . 2,485,122Hotel/Motel Tax . . . . . . . . . . . . . . . . . . . . . 4,124,025Other . . . . . . . . . . . . . . . . . . . . . . . . . . . . 3,228,748Subtotal . . . . . . . . . . . . . . . . . . . . . . . . .$ 39,983,740
Non-Operating Revenue
Transfers from Reserves . . . . . . . . . . . . .$ 2,281,468Contributed Equipment . . . . . . . . . . . . . . . 1,406,097Subtotal . . . . . . . . . . . . . . . . . . . . . . . . $ 3,687,565
Hotel/Motel Tax (ACVB) (1) . . . . . . . . . . . . .$ 9,625,578Total . . . . . . . . . . . . . . . . . . . . . . . . . . . .$ 53,296,883
(1) The City of Atlanta and Fulton County collect a 7 percent Hotel/MotelTax, which generated $42,780,388 in Fiscal Year 2001. By contractwith the City and County, 22.5 percent of the tax, or $9,625,578, isdedicated to the Atlanta Convention & Visitors Bureau.
Revenues from food service
increased 43 percent from Fiscal
Year 2000. Revenue from rent and
exhibit utility services were up
8 percent and 9 percent
respectively over the prior year.
Operating Revenue
06 07
GWCC Expense Statement
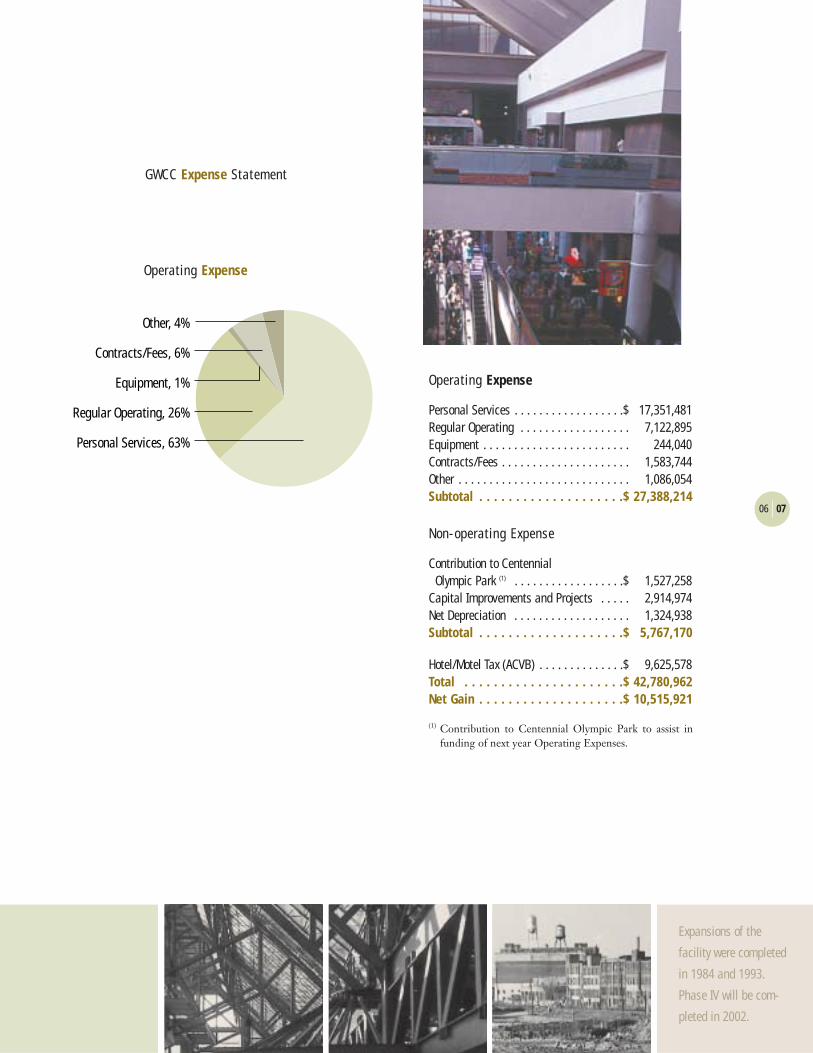
Operating Expense
Personal Services . . . . . . . . . . . . . . . . . .$ 17,351,481Regular Operating . . . . . . . . . . . . . . . . . . 7,122,895Equipment . . . . . . . . . . . . . . . . . . . . . . . . 244,040Contracts/Fees . . . . . . . . . . . . . . . . . . . . . 1,583,744Other . . . . . . . . . . . . . . . . . . . . . . . . . . . . 1,086,054Subtotal . . . . . . . . . . . . . . . . . . . .$ 27,388,214
Non-operating Expense
Contribution to Centennial Olympic Park (1) . . . . . . . . . . . . . . . . . .$ 1,527,258
Capital Improvements and Projects . . . . . 2,914,974Net Depreciation . . . . . . . . . . . . . . . . . . . 1,324,938Subtotal . . . . . . . . . . . . . . . . . . . .$ 5,767,170
Hotel/Motel Tax (ACVB) . . . . . . . . . . . . . .$ 9,625,578Total . . . . . . . . . . . . . . . . . . . . . .$ 42,780,962Net Gain . . . . . . . . . . . . . . . . . . . .$ 10,515,921
(1) Contribution to Centennial Olympic Park to assist infunding of next year Operating Expenses.
Other, 4%
Contracts/Fees, 6%
Equipment, 1%
Regular Operating, 26%
Personal Services, 63%
Expansions of the
facility were completed
in 1984 and 1993.
Phase IV will be com-
pleted in 2002.
Operating Expense
GWCC Attendance
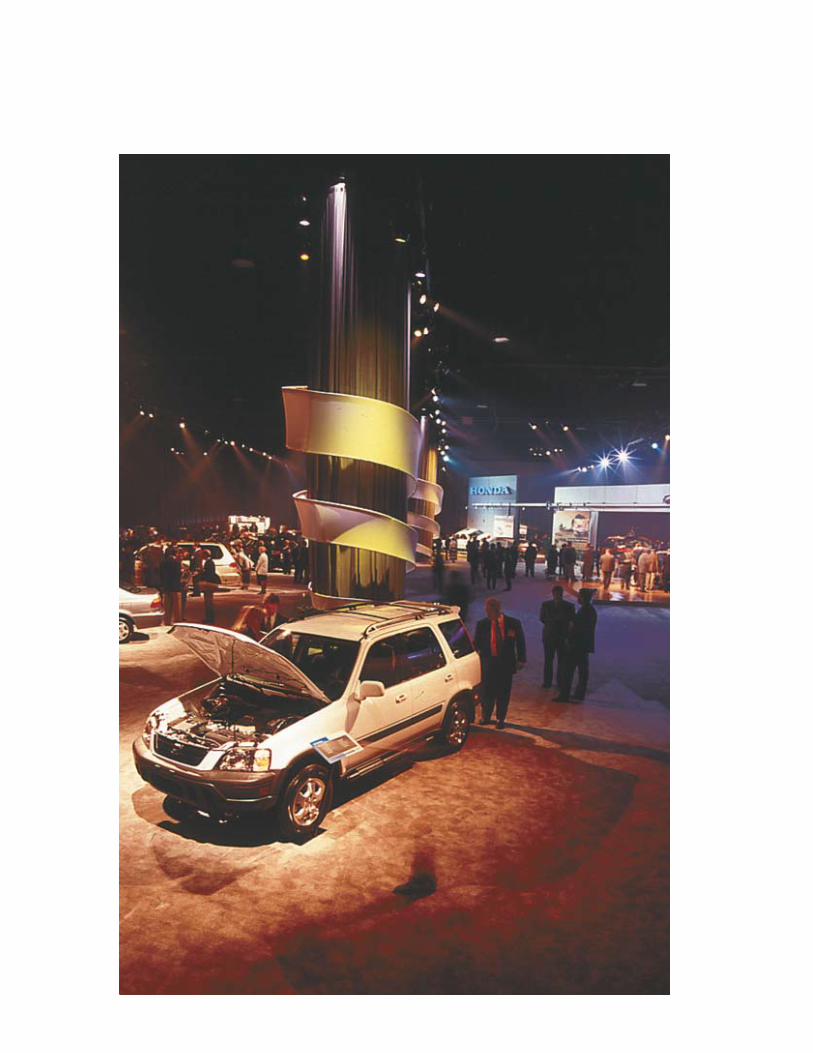
With more than 45 major trade shows, conventions and consumer shows plus numerous corporate events, the World
Congress Center drew more than 1.3 millionguests in Fiscal Year 2001. Of those guests, weestimate 718,697 came from out-of-state.Based upon an average stay of 3.4 days for out-of-state visitors, the Georgia WorldCongress Center’s 2001 Total DailyAttendance came to 3,048,638.
Among the trade shows and conventionswith the highest attendance were: SUPERCOMM, International WoodworkingFair, Primerica Life Insurance Co., Networld +Interop and the Bronner Brothers InternationalBeauty Show. The highest-attended publicshows included the Festival of Trees (which celebrated its tenth year at the Georgia WorldCongress Center), Major League Baseball’s AllStar Fanfest and The Atlanta Journal/Constitution’s International Auto Show.
724,677 . . . . . . . .45 Major Trade Shows & Conventions330,170 . . . . . . . . . . . . . . .13 Public/Consumer Shows274,912 . .172 Meetings, Corporate Events and Others*1,329,759 . . . . . . . . . . . . . . . . . . . .Total Attendance**
* Includes fashion shows, licensing exams, graduations,sports events, concerts and other performing arts productions.
** Includes events that also used Georgia Dome space.
Total Out-of-State Attendance . . . . . . . . . . . . .718,697
Total Daily Attendance . . . . . . . . . . . . . . . . . .3,048,638
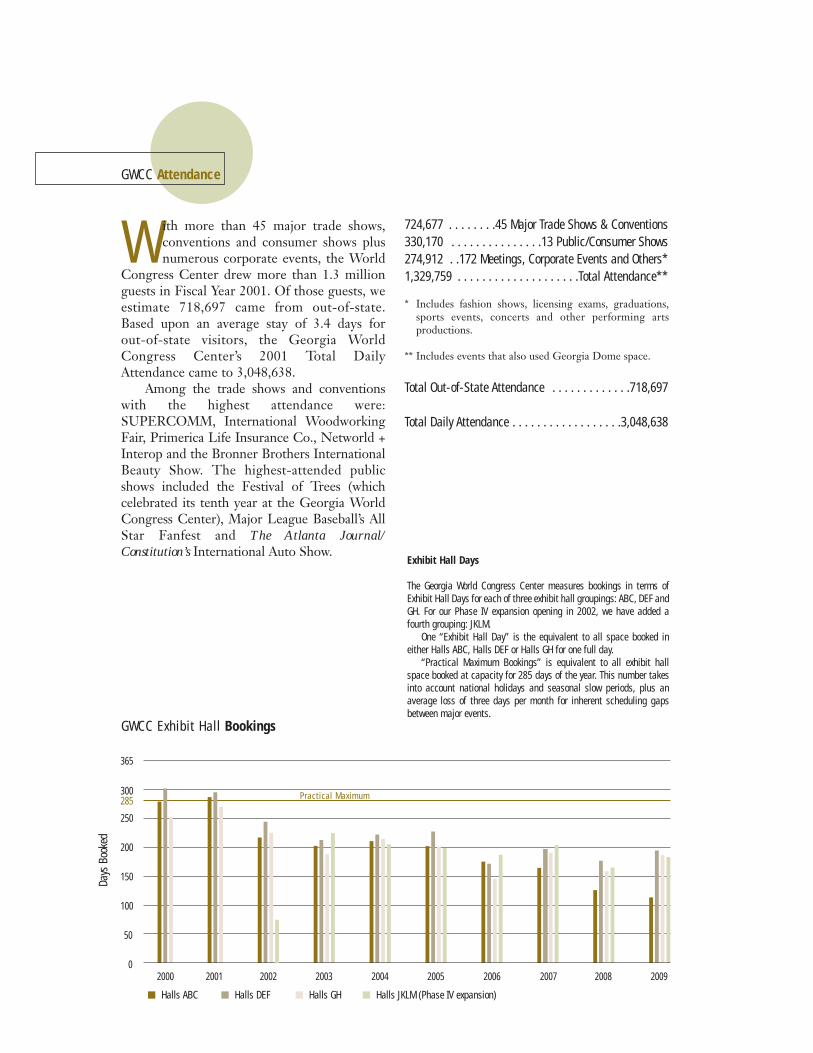
GWCC Exhibit Hall Bookings
Days
Boo
ked
365
300285
250
200
150
100
50
02000 2001 2002 2003 2004 2005 2006 2007 2008 2009
■ Halls ABC ■ Halls DEF ■ Halls GH ■ Halls JKLM (Phase IV expansion)
Practical Maximum
Exhibit Hall Days
The Georgia World Congress Center measures bookings in terms ofExhibit Hall Days for each of three exhibit hall groupings: ABC, DEF andGH. For our Phase IV expansion opening in 2002, we have added afourth grouping: JKLM.
One “Exhibit Hall Day” is the equivalent to all space booked ineither Halls ABC, Halls DEF or Halls GH for one full day.
“Practical Maximum Bookings” is equivalent to all exhibit hallspace booked at capacity for 285 days of the year. This number takesinto account national holidays and seasonal slow periods, plus anaverage loss of three days per month for inherent scheduling gapsbetween major events.
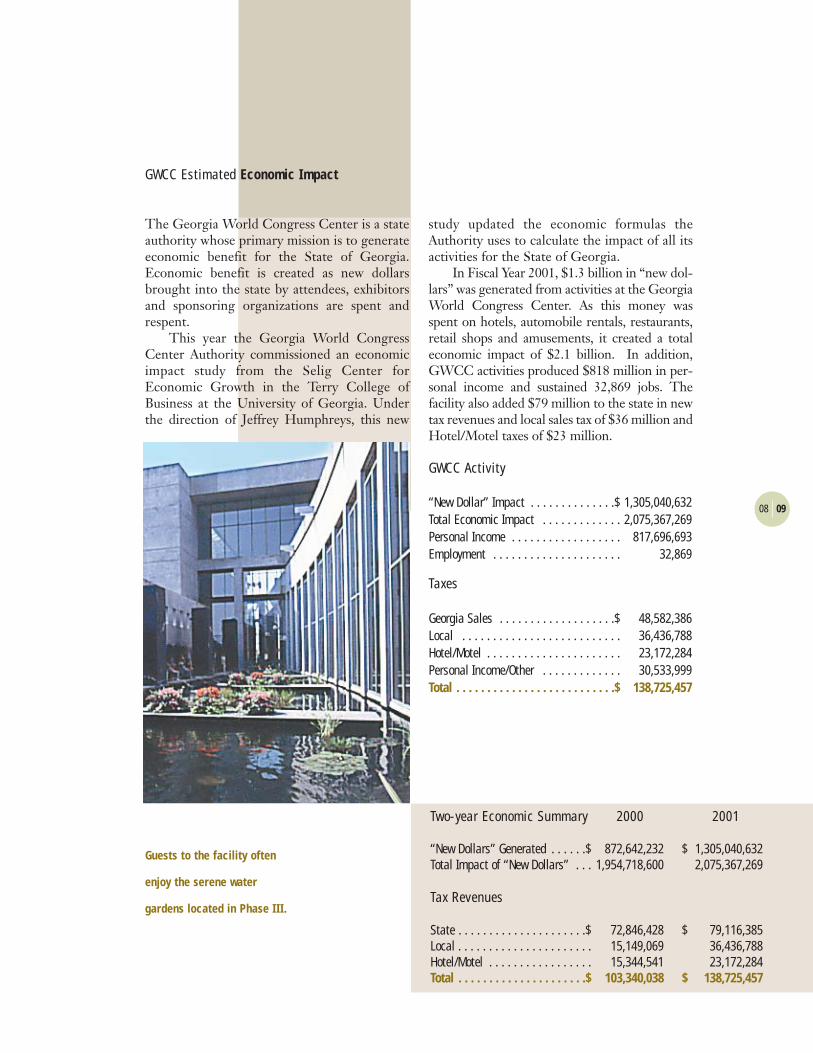
The Georgia World Congress Center is a stateauthority whose primary mission is to generateeconomic benefit for the State of Georgia.Economic benefit is created as new dollarsbrought into the state by attendees, exhibitorsand sponsoring organizations are spent andrespent.
This year the Georgia World CongressCenter Authority commissioned an economicimpact study from the Selig Center forEconomic Growth in the Terry College ofBusiness at the University of Georgia. Underthe direction of Jeffrey Humphreys, this new
study updated the economic formulas theAuthority uses to calculate the impact of all itsactivities for the State of Georgia.
In Fiscal Year 2001, $1.3 billion in “new dol-lars” was generated from activities at the GeorgiaWorld Congress Center. As this money wasspent on hotels, automobile rentals, restaurants,retail shops and amusements, it created a totaleconomic impact of $2.1 billion. In addition,GWCC activities produced $818 million in per-sonal income and sustained 32,869 jobs. Thefacility also added $79 million to the state in newtax revenues and local sales tax of $36 million andHotel/Motel taxes of $23 million.
GWCC Activity
“New Dollar” Impact . . . . . . . . . . . . . .$ 1,305,040,632Total Economic Impact . . . . . . . . . . . . . 2,075,367,269Personal Income . . . . . . . . . . . . . . . . . . 817,696,693Employment . . . . . . . . . . . . . . . . . . . . . 32,869
Taxes
Georgia Sales . . . . . . . . . . . . . . . . . . .$ 48,582,386Local . . . . . . . . . . . . . . . . . . . . . . . . . . 36,436,788Hotel/Motel . . . . . . . . . . . . . . . . . . . . . . 23,172,284Personal Income/Other . . . . . . . . . . . . . 30,533,999Total . . . . . . . . . . . . . . . . . . . . . . . . . .$ 138,725,457
08 09
GWCC Estimated Economic Impact
Two-year Economic Summary 2000 2001
“New Dollars” Generated . . . . . .$ 872,642,232 $ 1,305,040,632Total Impact of “New Dollars” . . . 1,954,718,600 2,075,367,269
Tax Revenues
State . . . . . . . . . . . . . . . . . . . . .$ 72,846,428 $ 79,116,385Local . . . . . . . . . . . . . . . . . . . . . . 15,149,069 36,436,788Hotel/Motel . . . . . . . . . . . . . . . . . 15,344,541 23,172,284Total . . . . . . . . . . . . . . . . . . . . .$ 103,340,038 $ 138,725,457
Guests to the facility often
enjoy the serene water
gardens located in Phase III.
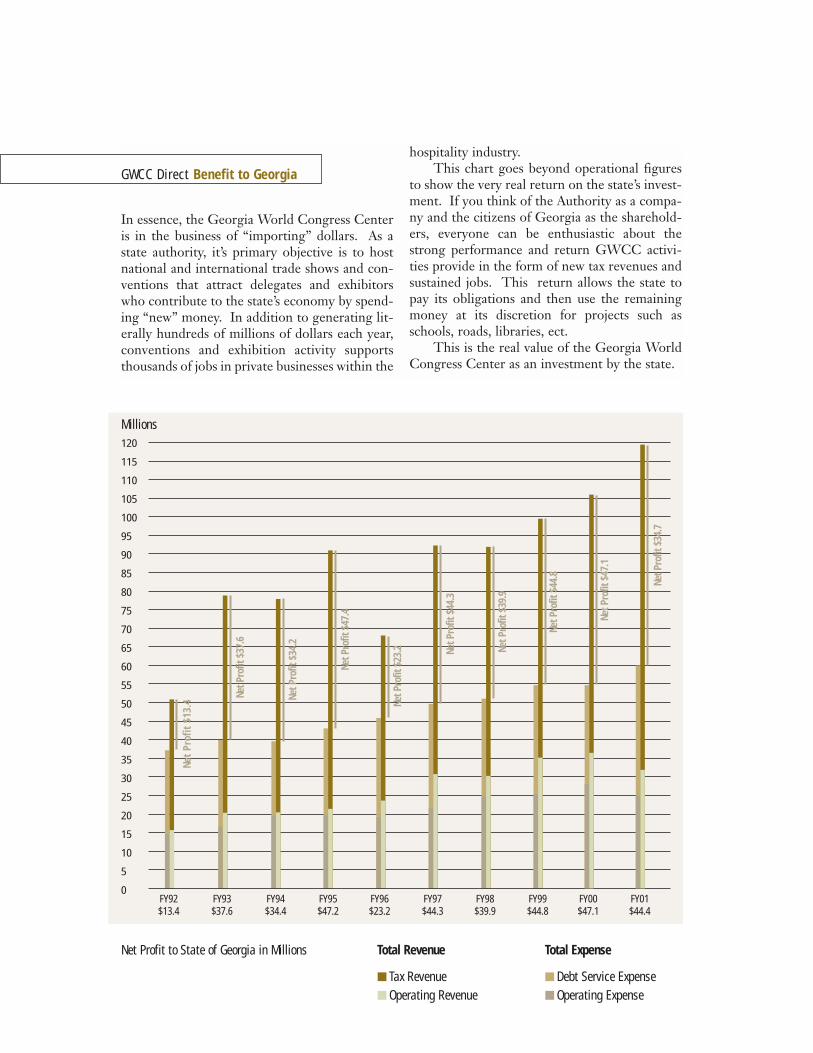
In essence, the Georgia World Congress Centeris in the business of “importing” dollars. As astate authority, it’s primary objective is to hostnational and international trade shows and con-ventions that attract delegates and exhibitorswho contribute to the state’s economy by spend-ing “new” money. In addition to generating lit-erally hundreds of millions of dollars each year,conventions and exhibition activity supportsthousands of jobs in private businesses within the
hospitality industry.This chart goes beyond operational figures
to show the very real return on the state’s invest-ment. If you think of the Authority as a compa-ny and the citizens of Georgia as the sharehold-ers, everyone can be enthusiastic about thestrong performance and return GWCC activi-ties provide in the form of new tax revenues andsustained jobs. This return allows the state topay its obligations and then use the remainingmoney at its discretion for projects such asschools, roads, libraries, ect.
This is the real value of the Georgia WorldCongress Center as an investment by the state.
Millions
Total Revenue
■ Tax Revenue■ Operating Revenue
Total Expense
■ Debt Service Expense■ Operating Expense
GWCC Direct Benefit to Georgia
FY92 FY93 FY94 FY95 FY96 FY97 FY98 FY99 FY00 FY01$13.4 $37.6 $34.4 $47.2 $23.2 $44.3 $39.9 $44.8 $47.1 $44.4
Net Profit to State of Georgia in Millions
120
115
110
105
100
95
90
85
80
75
70
65
60
55
50
45
40
35
30
25
20
15
10
5
0
Net
Prof
it $1
3.4
Net P
rofit
$37
.6
Net P
rofit
$34
.2
Net P
rofit
$47
.4
Net P
rofit
$23
.2 Net P
rofit
$44
.3
Net P
rofit
$39
.9
Net P
rofit
$44
.8
Net P
rofit
$47
.1
Net P
rofit
$34
.7
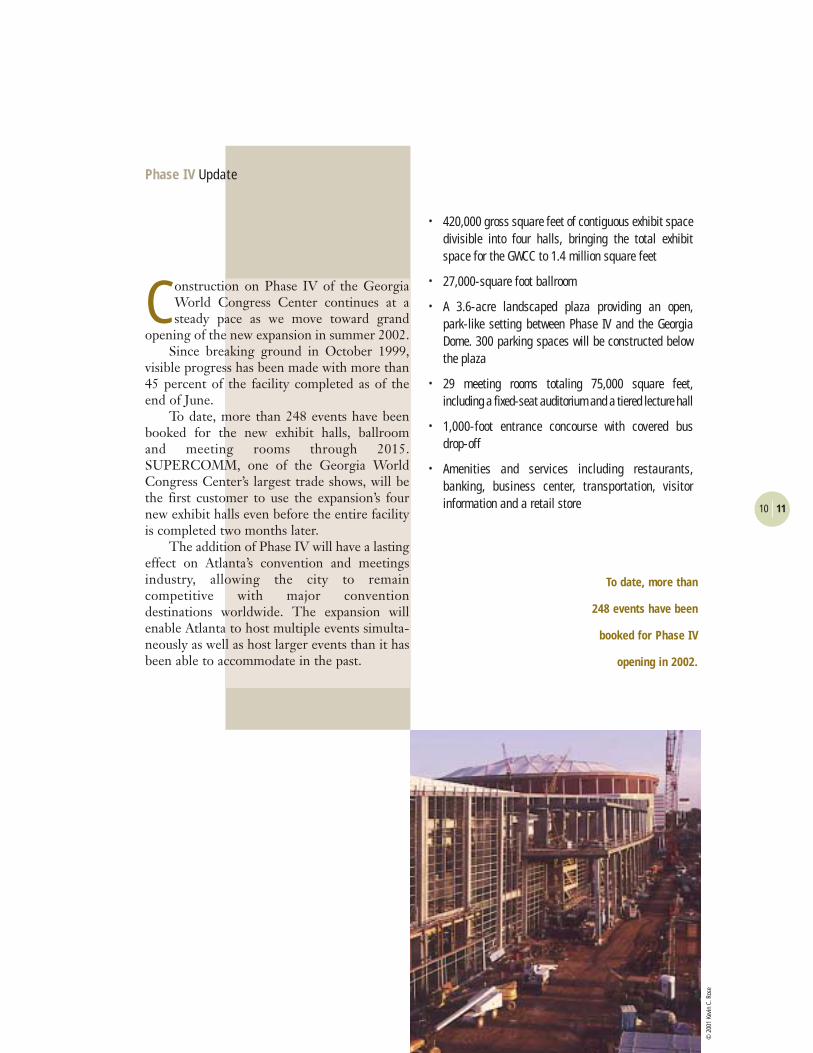
Phase IV Update
Construction on Phase IV of the GeorgiaWorld Congress Center continues at asteady pace as we move toward grand
opening of the new expansion in summer 2002. Since breaking ground in October 1999,
visible progress has been made with more than45 percent of the facility completed as of theend of June.
To date, more than 248 events have beenbooked for the new exhibit halls, ballroom and meeting rooms through 2015. SUPERCOMM, one of the Georgia WorldCongress Center’s largest trade shows, will bethe first customer to use the expansion’s fournew exhibit halls even before the entire facilityis completed two months later.
The addition of Phase IV will have a lastingeffect on Atlanta’s convention and meetingsindustry, allowing the city to remain competitive with major convention destinations worldwide. The expansion willenable Atlanta to host multiple events simulta-neously as well as host larger events than it hasbeen able to accommodate in the past.
• 420,000 gross square feet of contiguous exhibit spacedivisible into four halls, bringing the total exhibitspace for the GWCC to 1.4 million square feet
• 27,000-square foot ballroom
• A 3.6-acre landscaped plaza providing an open, park-like setting between Phase IV and the GeorgiaDome. 300 parking spaces will be constructed belowthe plaza
• 29 meeting rooms totaling 75,000 square feet, including a fixed-seat auditorium and a tiered lecture hall
• 1,000-foot entrance concourse with covered bus drop-off
• Amenities and services including restaurants, banking, business center, transportation, visitor information and a retail store 10 11
To date, more than
248 events have been
booked for Phase IV
opening in 2002.
© 2
001
Kevi
n C.
Ros
e
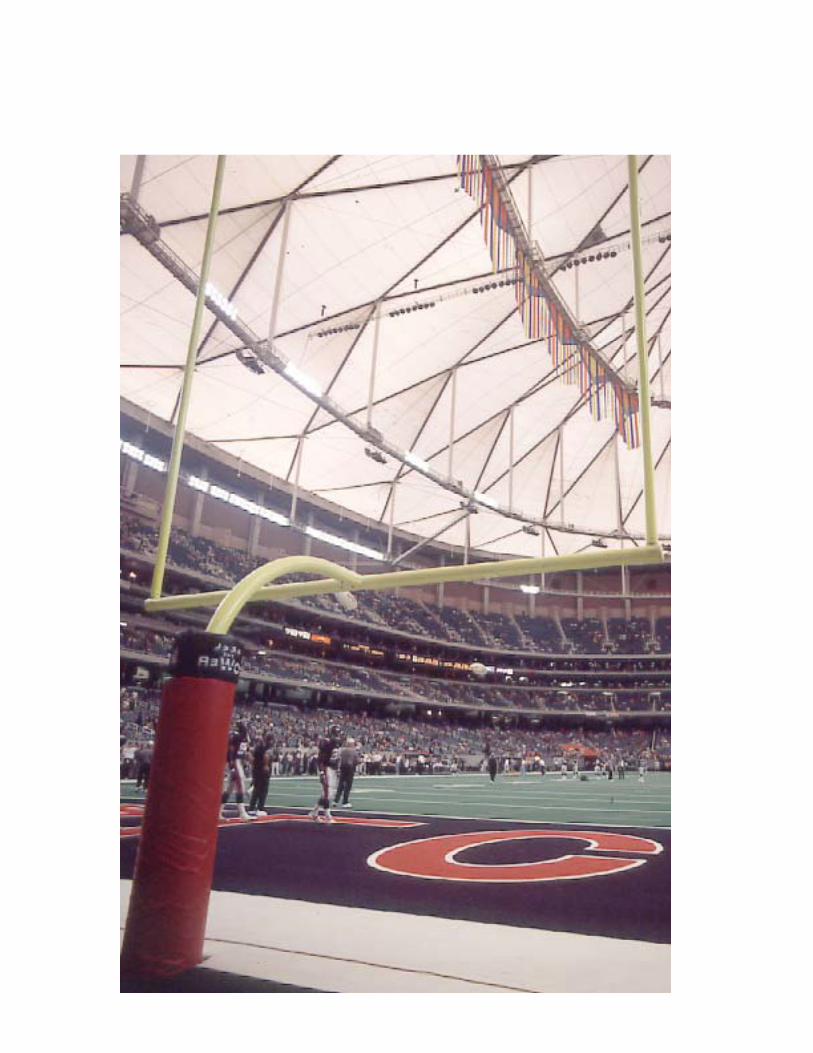
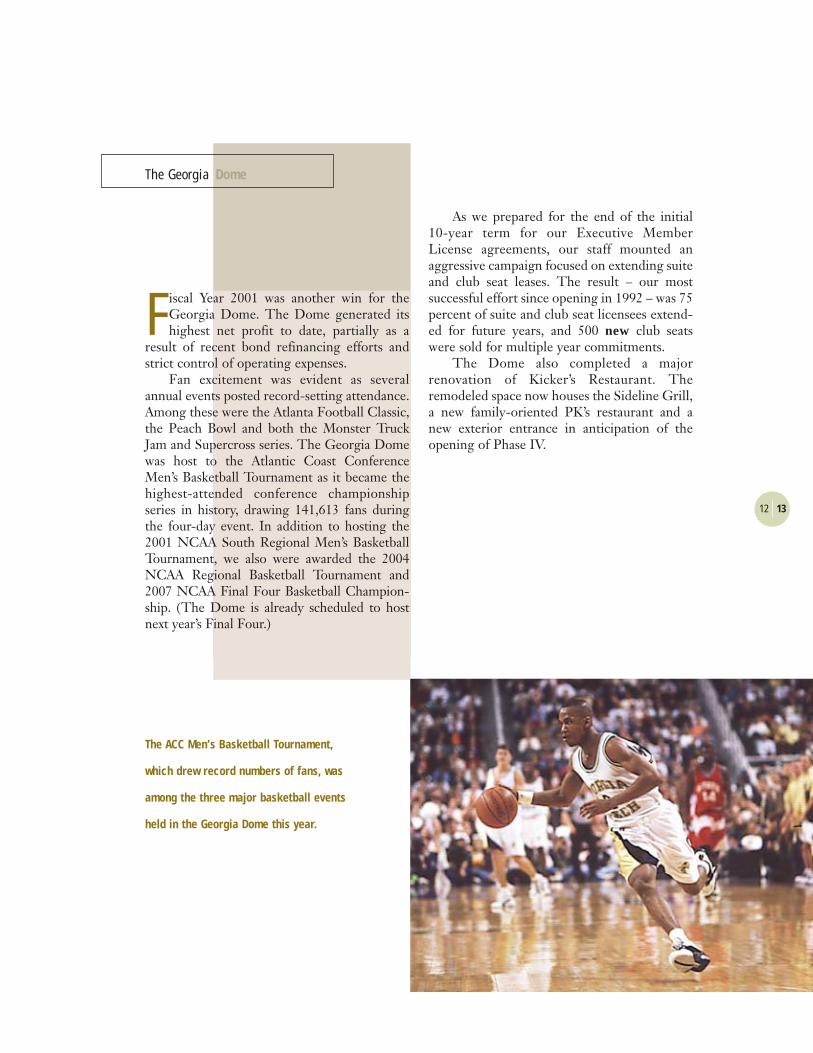
Fiscal Year 2001 was another win for theGeorgia Dome. The Dome generated itshighest net profit to date, partially as a
result of recent bond refinancing efforts andstrict control of operating expenses.
Fan excitement was evident as severalannual events posted record-setting attendance.Among these were the Atlanta Football Classic,the Peach Bowl and both the Monster TruckJam and Supercross series. The Georgia Domewas host to the Atlantic Coast ConferenceMen’s Basketball Tournament as it became thehighest-attended conference championshipseries in history, drawing 141,613 fans duringthe four-day event. In addition to hosting the2001 NCAA South Regional Men’s BasketballTournament, we also were awarded the 2004NCAA Regional Basketball Tournament and2007 NCAA Final Four Basketball Champion-ship. (The Dome is already scheduled to hostnext year’s Final Four.)
As we prepared for the end of the initial10-year term for our Executive MemberLicense agreements, our staff mounted anaggressive campaign focused on extending suiteand club seat leases. The result – our most successful effort since opening in 1992 – was 75percent of suite and club seat licensees extend-ed for future years, and 500 new club seatswere sold for multiple year commitments.
The Dome also completed a major renovation of Kicker’s Restaurant. The remodeled space now houses the Sideline Grill,a new family-oriented PK’s restaurant and anew exterior entrance in anticipation of theopening of Phase IV.
12 13
The Georgia Dome
The ACC Men’s Basketball Tournament,
which drew record numbers of fans, was
among the three major basketball events
held in the Georgia Dome this year.
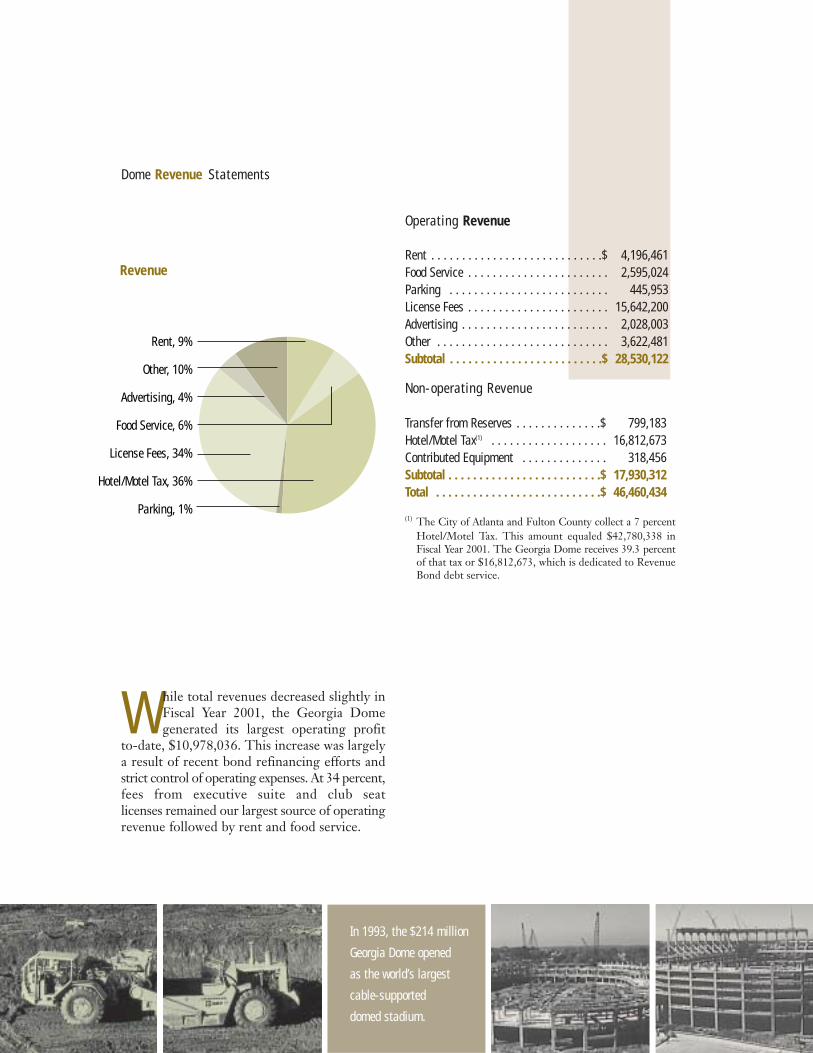
While total revenues decreased slightly inFiscal Year 2001, the Georgia Domegenerated its largest operating profit
to-date, $10,978,036. This increase was largelya result of recent bond refinancing efforts andstrict control of operating expenses. At 34 percent,fees from executive suite and club seat licenses remained our largest source of operatingrevenue followed by rent and food service.
Dome Revenue Statements
Rent, 9%
Other, 10%
Advertising, 4%
Food Service, 6%
License Fees, 34%
Hotel/Motel Tax, 36%
Parking, 1%
Operating Revenue
Rent . . . . . . . . . . . . . . . . . . . . . . . . . . . .$ 4,196,461Food Service . . . . . . . . . . . . . . . . . . . . . . . 2,595,024Parking . . . . . . . . . . . . . . . . . . . . . . . . . . 445,953License Fees . . . . . . . . . . . . . . . . . . . . . . . 15,642,200Advertising . . . . . . . . . . . . . . . . . . . . . . . . 2,028,003Other . . . . . . . . . . . . . . . . . . . . . . . . . . . . 3,622,481Subtotal . . . . . . . . . . . . . . . . . . . . . . . . .$ 28,530,122
Non-operating Revenue
Transfer from Reserves . . . . . . . . . . . . . .$ 799,183Hotel/Motel Tax(1) . . . . . . . . . . . . . . . . . . . 16,812,673Contributed Equipment . . . . . . . . . . . . . . 318,456Subtotal . . . . . . . . . . . . . . . . . . . . . . . . .$ 17,930,312Total . . . . . . . . . . . . . . . . . . . . . . . . . . .$ 46,460,434
(1) The City of Atlanta and Fulton County collect a 7 percentHotel/Motel Tax. This amount equaled $42,780,338 inFiscal Year 2001. The Georgia Dome receives 39.3 percentof that tax or $16,812,673, which is dedicated to RevenueBond debt service.
In 1993, the $214 million
Georgia Dome opened
as the world’s largest
cable-supported
domed stadium.
Revenue
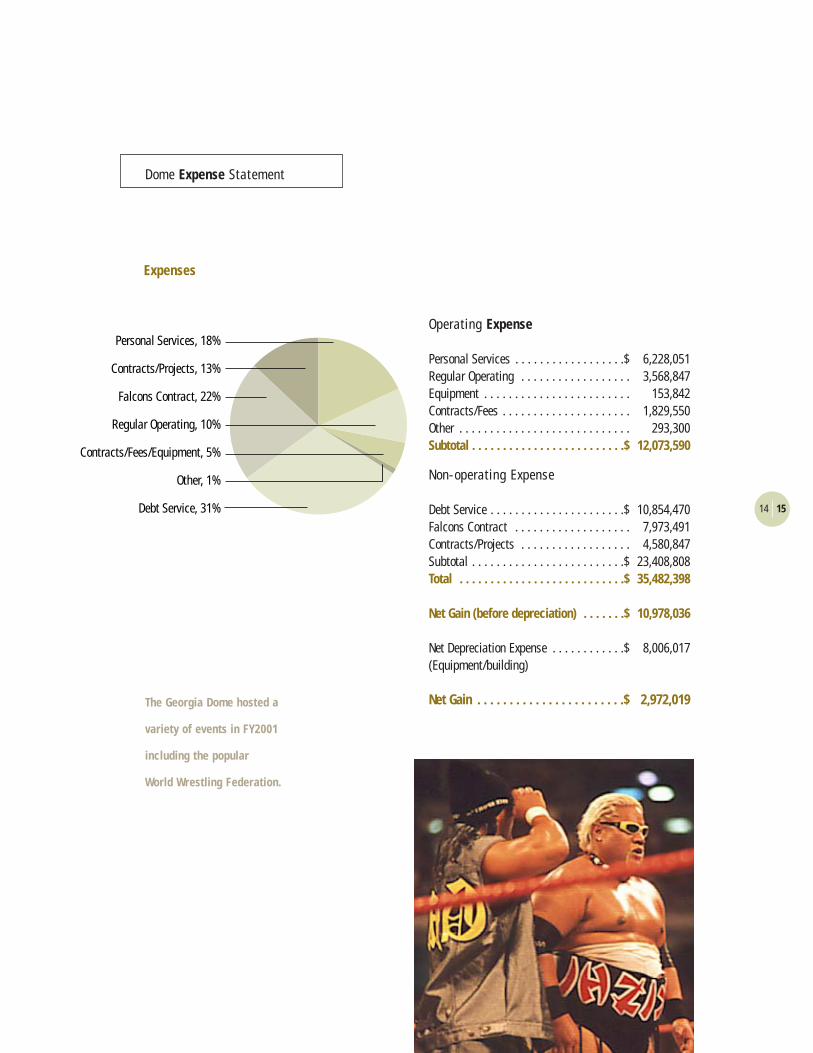
Operating Expense
Personal Services . . . . . . . . . . . . . . . . . .$ 6,228,051Regular Operating . . . . . . . . . . . . . . . . . . 3,568,847Equipment . . . . . . . . . . . . . . . . . . . . . . . . 153,842Contracts/Fees . . . . . . . . . . . . . . . . . . . . . 1,829,550Other . . . . . . . . . . . . . . . . . . . . . . . . . . . . 293,300Subtotal . . . . . . . . . . . . . . . . . . . . . . . . .$ 12,073,590
Non-operating Expense
Debt Service . . . . . . . . . . . . . . . . . . . . . .$ 10,854,470Falcons Contract . . . . . . . . . . . . . . . . . . . 7,973,491Contracts/Projects . . . . . . . . . . . . . . . . . . 4,580,847Subtotal . . . . . . . . . . . . . . . . . . . . . . . . .$ 23,408,808Total . . . . . . . . . . . . . . . . . . . . . . . . . . .$ 35,482,398
Net Gain (before depreciation) . . . . . . .$ 10,978,036
Net Depreciation Expense . . . . . . . . . . . .$ 8,006,017(Equipment/building)
Net Gain . . . . . . . . . . . . . . . . . . . . . . .$ 2,972,019
14 15
Dome Expense Statement
Personal Services, 18%
Contracts/Projects, 13%
Falcons Contract, 22%
Regular Operating, 10%
Contracts/Fees/Equipment, 5%
Other, 1%
Debt Service, 31%
The Georgia Dome hosted a
variety of events in FY2001
including the popular
World Wrestling Federation.
Expenses
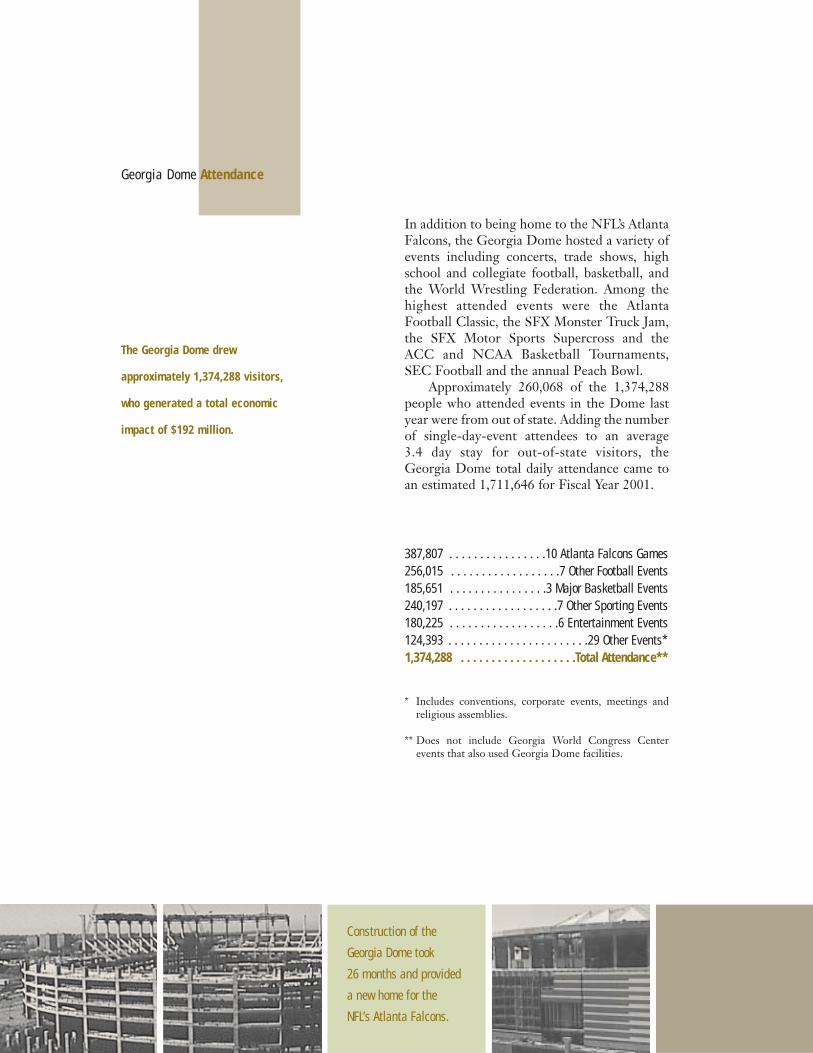
In addition to being home to the NFL’s AtlantaFalcons, the Georgia Dome hosted a variety ofevents including concerts, trade shows, highschool and collegiate football, basketball, andthe World Wrestling Federation. Among thehighest attended events were the AtlantaFootball Classic, the SFX Monster Truck Jam,the SFX Motor Sports Supercross and theACC and NCAA Basketball Tournaments,SEC Football and the annual Peach Bowl.
Approximately 260,068 of the 1,374,288people who attended events in the Dome lastyear were from out of state. Adding the numberof single-day-event attendees to an average 3.4 day stay for out-of-state visitors, theGeorgia Dome total daily attendance came toan estimated 1,711,646 for Fiscal Year 2001.
387,807 . . . . . . . . . . . . . . . .10 Atlanta Falcons Games256,015 . . . . . . . . . . . . . . . . . .7 Other Football Events185,651 . . . . . . . . . . . . . . . .3 Major Basketball Events240,197 . . . . . . . . . . . . . . . . . .7 Other Sporting Events180,225 . . . . . . . . . . . . . . . . . .6 Entertainment Events124,393 . . . . . . . . . . . . . . . . . . . . . . .29 Other Events*1,374,288 . . . . . . . . . . . . . . . . . . .Total Attendance**
* Includes conventions, corporate events, meetings and religious assemblies.
** Does not include Georgia World Congress Centerevents that also used Georgia Dome facilities.
Georgia Dome Attendance
The Georgia Dome drew
approximately 1,374,288 visitors,
who generated a total economic
impact of $192 million.
Construction of the
Georgia Dome took
26 months and provided
a new home for the
NFL’s Atlanta Falcons.
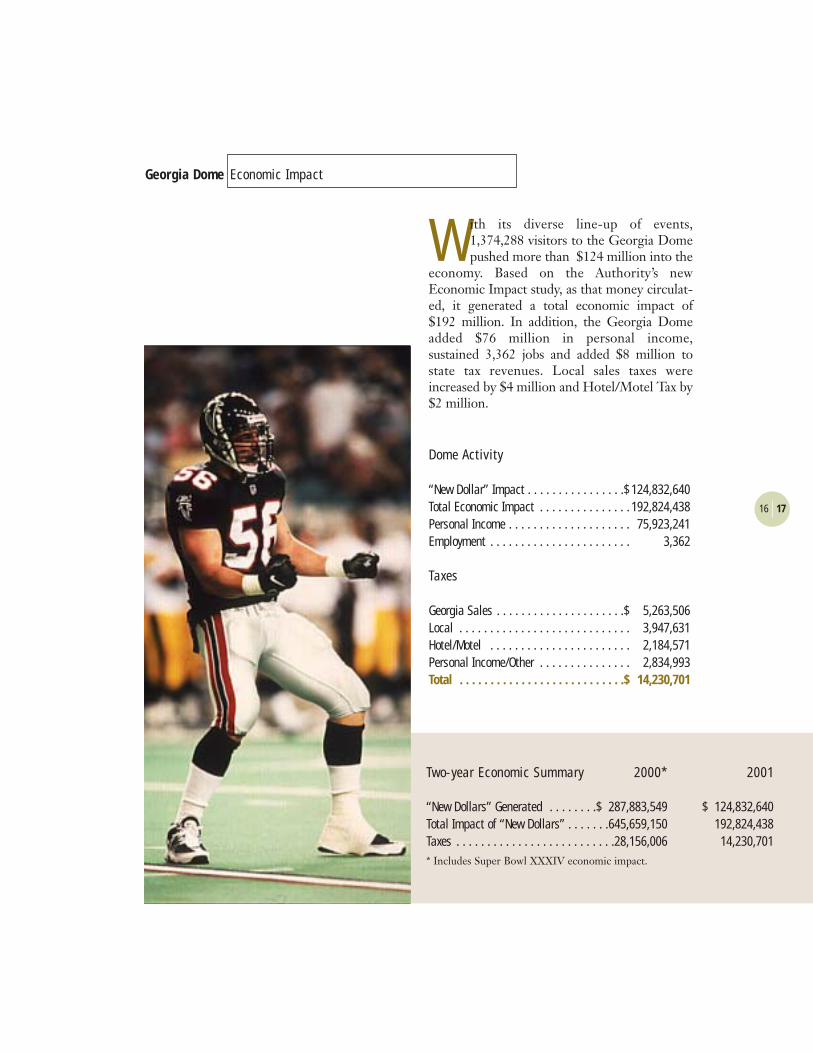
With its diverse line-up of events,1,374,288 visitors to the Georgia Domepushed more than $124 million into the
economy. Based on the Authority’s newEconomic Impact study, as that money circulat-ed, it generated a total economic impact of $192 million. In addition, the Georgia Domeadded $76 million in personal income, sustained 3,362 jobs and added $8 million tostate tax revenues. Local sales taxes wereincreased by $4 million and Hotel/Motel Tax by$2 million.
Dome Activity
“New Dollar” Impact . . . . . . . . . . . . . . . .$ 124,832,640Total Economic Impact . . . . . . . . . . . . . . . 192,824,438Personal Income . . . . . . . . . . . . . . . . . . . . 75,923,241Employment . . . . . . . . . . . . . . . . . . . . . . . 3,362
Taxes
Georgia Sales . . . . . . . . . . . . . . . . . . . . .$ 5,263,506Local . . . . . . . . . . . . . . . . . . . . . . . . . . . . 3,947,631Hotel/Motel . . . . . . . . . . . . . . . . . . . . . . . 2,184,571Personal Income/Other . . . . . . . . . . . . . . . 2,834,993Total . . . . . . . . . . . . . . . . . . . . . . . . . . .$ 14,230,701
16 17
Georgia Dome Economic Impact
Two-year Economic Summary 2000* 2001
“New Dollars” Generated . . . . . . . .$ 287,883,549 $ 124,832,640Total Impact of “New Dollars” . . . . . . .645,659,150 192,824,438Taxes . . . . . . . . . . . . . . . . . . . . . . . . . .28,156,006 14,230,701* Includes Super Bowl XXXIV economic impact.
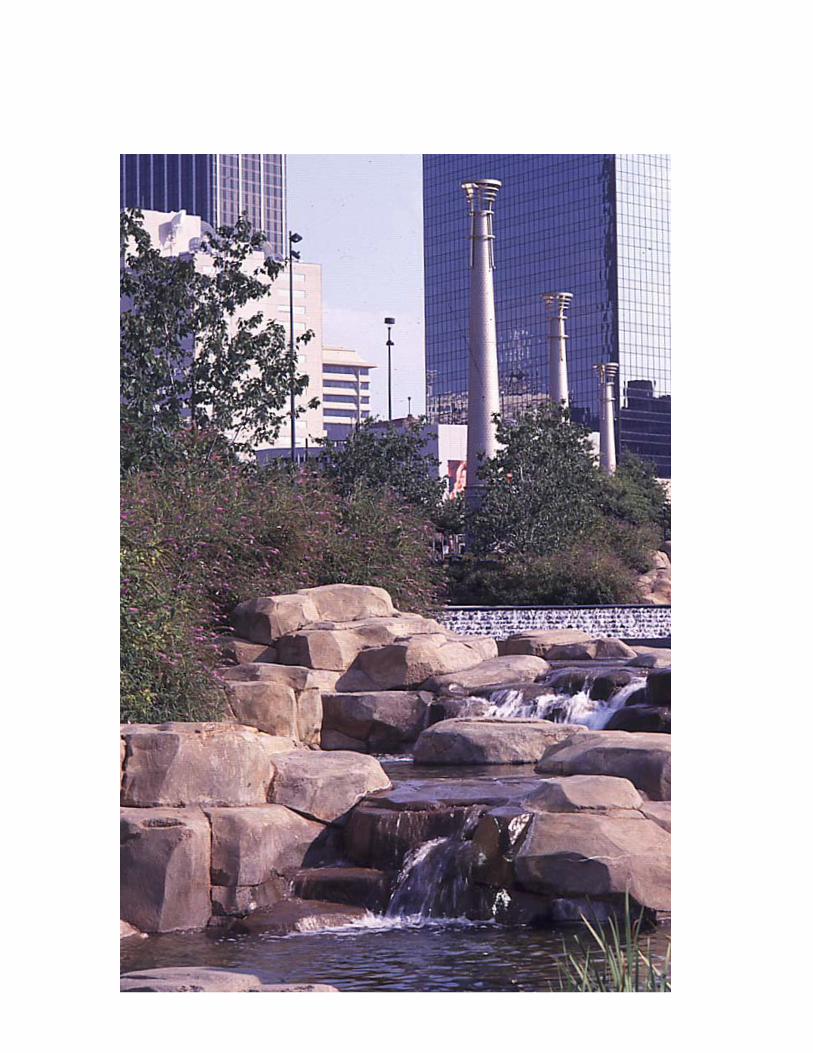
Centennial Olympic Park continues todraw millions of visitors to its beautiful,wide-open green spaces and world famous
“Fountain of Rings.” Many came to enjoynumerous festivals and concerts, while otherscame to find a peaceful oasis in the heart ofdowntown Atlanta. Created as the world’s gathering place for the 1996 CentennialOlympic Games, the Park continues to serve asa catalyst for economic revitalization in downtown Atlanta.
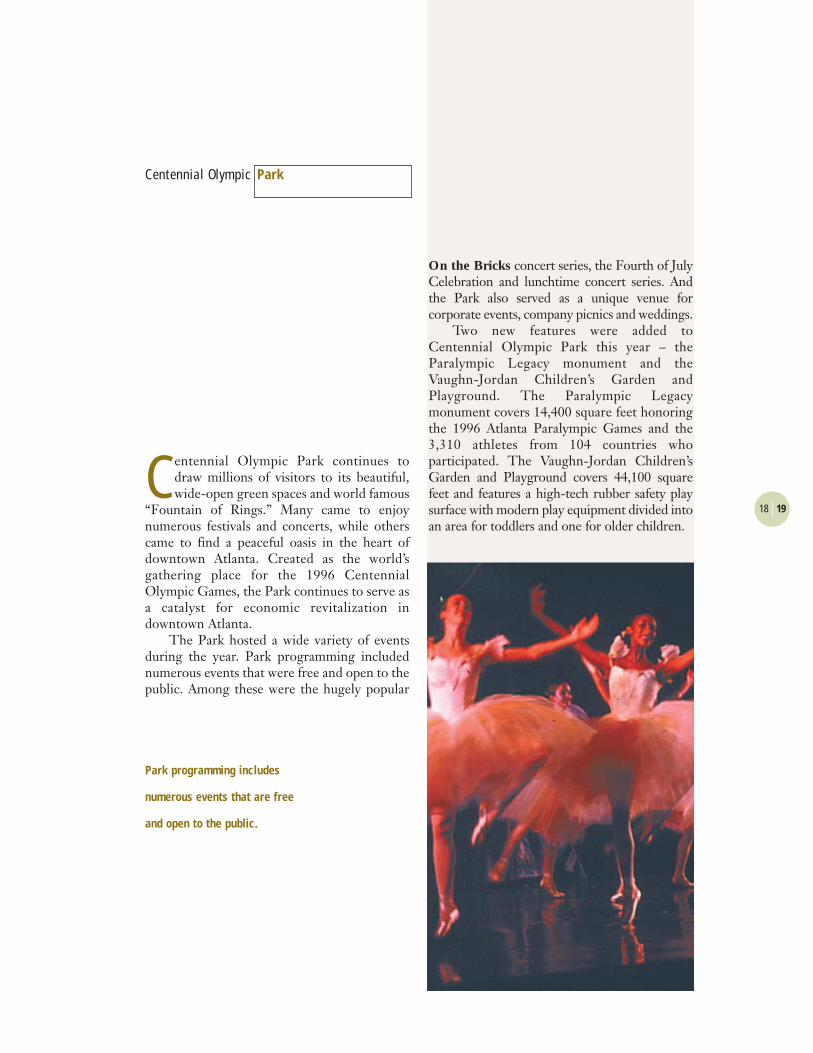
The Park hosted a wide variety of eventsduring the year. Park programming includednumerous events that were free and open to thepublic. Among these were the hugely popular
On the Bricks concert series, the Fourth of JulyCelebration and lunchtime concert series. Andthe Park also served as a unique venue for corporate events, company picnics and weddings.
Two new features were added toCentennial Olympic Park this year – theParalympic Legacy monument and theVaughn-Jordan Children’s Garden andPlayground. The Paralympic Legacy monument covers 14,400 square feet honoringthe 1996 Atlanta Paralympic Games and the3,310 athletes from 104 countries who participated. The Vaughn-Jordan Children’sGarden and Playground covers 44,100 squarefeet and features a high-tech rubber safety playsurface with modern play equipment divided intoan area for toddlers and one for older children.
18 19
Centennial Olympic Park
Park programming includes
numerous events that are free
and open to the public.
Operating Revenue
Rent . . . . . . . . . . . . . . . . . . . . . . . . . . . .$ 90,497Exhibit Utility Services . . . . . . . . . . . . . . . . 17,632Food Service . . . . . . . . . . . . . . . . . . . . . . . 540,677Other . . . . . . . . . . . . . . . . . . . . . . . . . . . . 97,637Sponsorship . . . . . . . . . . . . . . . . . . . . . . . 358,622Subtotal . . . . . . . . . . . . . . . . . . . . . . . . .$ 1,105,065
Non-Operating Revenue
Transfers from Reserve . . . . . . . . . . . . . .$ 73,859GWCC Contribution (1) . . . . . . . . . . . . . . . . 1,466,342Subtotal . . . . . . . . . . . . . . . . . . . . . . . . .$ 1,540,201Total . . . . . . . . . . . . . . . . . . . . . . . . . . . .$ 2,645,266
(1) Contribution from GWCC to assist funding ofOperating Expenses.
Centennial Olympic Park Revenue Statement
Rent, 8%
Sponsorship, 32%
Exhibit Utility Services, 2%
Other, 9%
Food Service, 49%
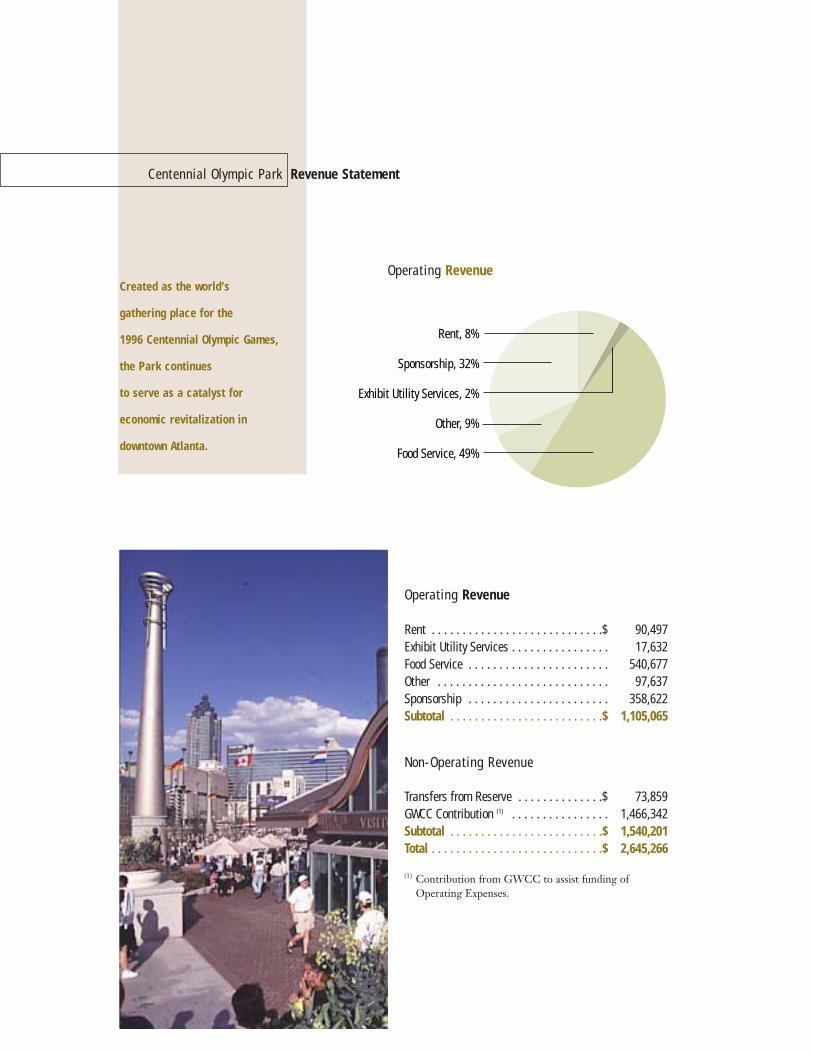
Created as the world’s
gathering place for the
1996 Centennial Olympic Games,
the Park continues
to serve as a catalyst for
economic revitalization in
downtown Atlanta.
Operating Revenue
Operating Expense
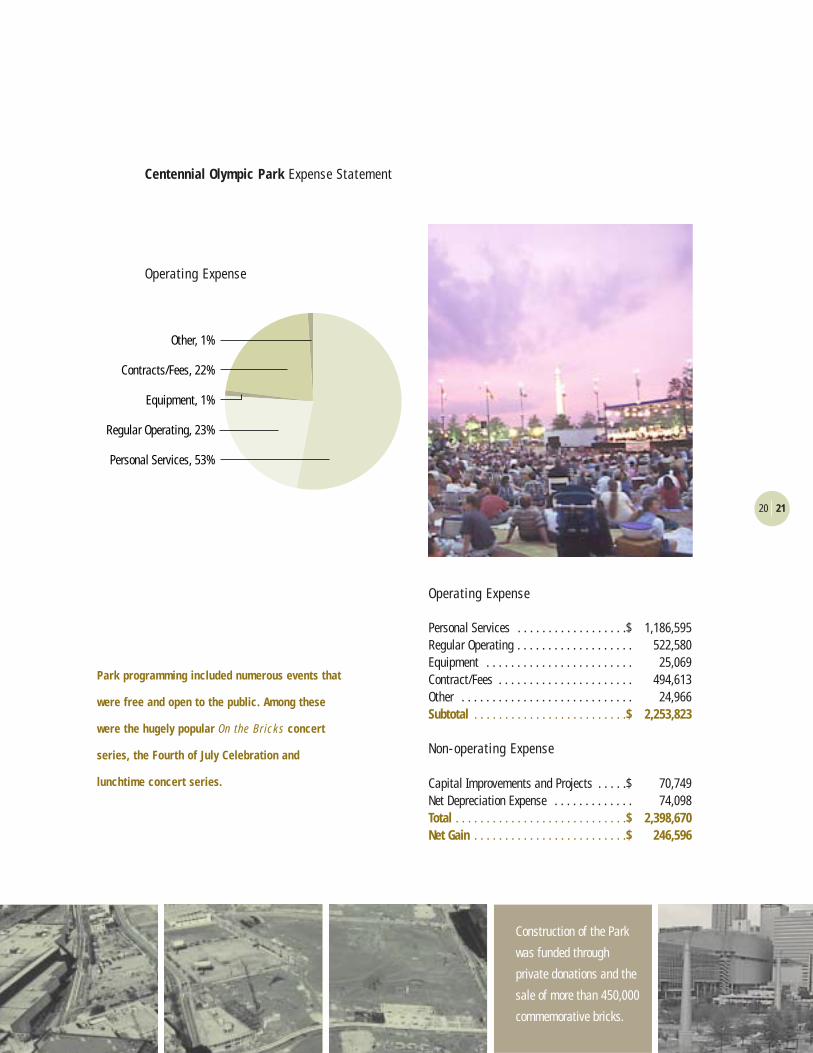
Operating Expense
Personal Services . . . . . . . . . . . . . . . . . .$ 1,186,595Regular Operating . . . . . . . . . . . . . . . . . . . 522,580Equipment . . . . . . . . . . . . . . . . . . . . . . . . 25,069Contract/Fees . . . . . . . . . . . . . . . . . . . . . . 494,613Other . . . . . . . . . . . . . . . . . . . . . . . . . . . . 24,966Subtotal . . . . . . . . . . . . . . . . . . . . . . . . .$ 2,253,823
Non-operating Expense
Capital Improvements and Projects . . . . .$ 70,749Net Depreciation Expense . . . . . . . . . . . . . 74,098Total . . . . . . . . . . . . . . . . . . . . . . . . . . . .$ 2,398,670Net Gain . . . . . . . . . . . . . . . . . . . . . . . . .$ 246,596
20 21
Centennial Olympic Park Expense Statement
Other, 1%
Contracts/Fees, 22%
Equipment, 1%
Regular Operating, 23%
Personal Services, 53%
Park programming included numerous events that
were free and open to the public. Among these
were the hugely popular On the Bricks concert
series, the Fourth of July Celebration and
lunchtime concert series.
Construction of the Park
was funded through
private donations and the
sale of more than 450,000
commemorative bricks.
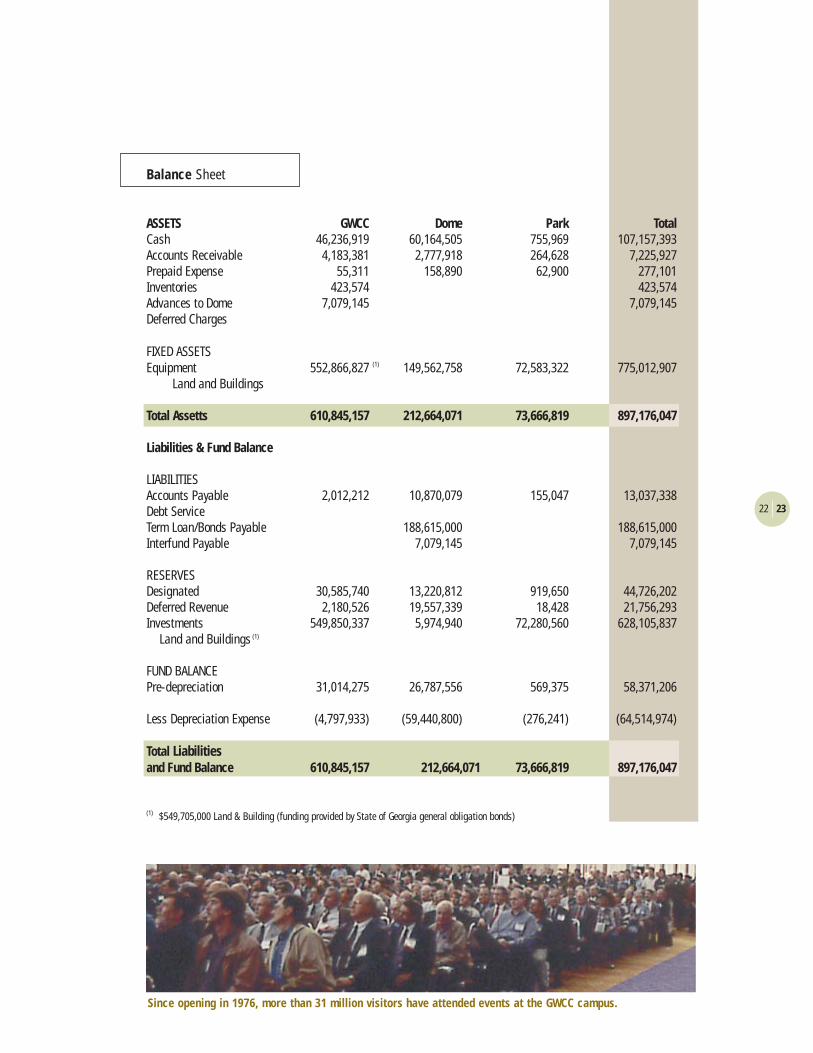
ASSETS GWCC Dome Park TotalCash 46,236,919 60,164,505 755,969 107,157,393 Accounts Receivable 4,183,381 2,777,918 264,628 7,225,927 Prepaid Expense 55,311 158,890 62,900 277,101 Inventories 423,574 423,574 Advances to Dome 7,079,145 7,079,145 Deferred Charges
FIXED ASSETSEquipment 552,866,827 149,562,758 72,583,322 775,012,907
Land and Buildings
Total Assetts 610,845,157 212,664,071 73,666,819 897,176,047
Liabilities & Fund Balance
LIABILITIESAccounts Payable 2,012,212 10,870,079 155,047 13,037,338 Debt ServiceTerm Loan/Bonds Payable 188,615,000 188,615,000 Interfund Payable 7,079,145 7,079,145
RESERVESDesignated 30,585,740 13,220,812 919,650 44,726,202 Deferred Revenue 2,180,526 19,557,339 18,428 21,756,293 Investments 549,850,337 5,974,940 72,280,560 628,105,837
Land and Buildings (1)
FUND BALANCEPre-depreciation 31,014,275 26,787,556 569,375 58,371,206
Less Depreciation Expense (4,797,933) (59,440,800) (276,241) (64,514,974)
Total Liabilities and Fund Balance 610,845,157 212,664,071 73,666,819 897,176,047
(1) $549,705,000 Land & Building (funding provided by State of Georgia general obligation bonds)
22 23
Balance Sheet
(1)
Since opening in 1976, more than 31 million visitors have attended events at the GWCC campus.
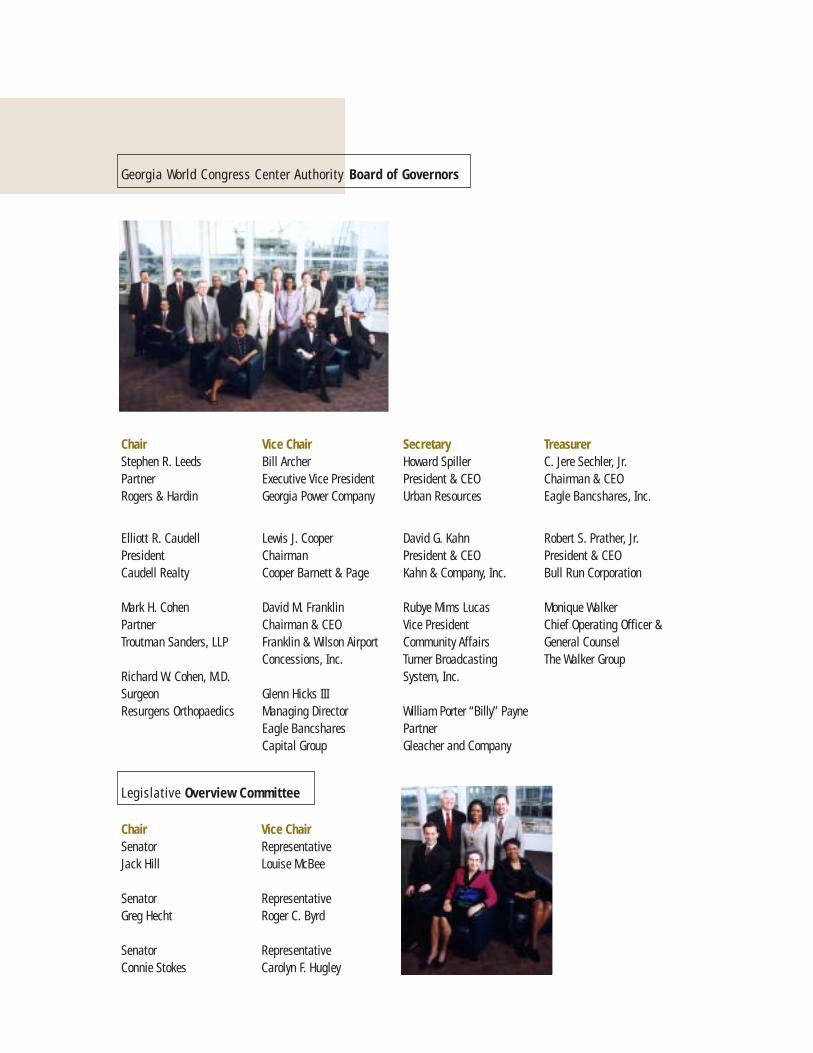
ChairStephen R. LeedsPartnerRogers & Hardin
Vice ChairBill ArcherExecutive Vice PresidentGeorgia Power Company
SecretaryHoward SpillerPresident & CEOUrban Resources
TreasurerC. Jere Sechler, Jr.Chairman & CEOEagle Bancshares, Inc.
Elliott R. CaudellPresidentCaudell Realty
Mark H. CohenPartnerTroutman Sanders, LLP
Richard W. Cohen, M.D.SurgeonResurgens Orthopaedics
Lewis J. CooperChairmanCooper Barnett & Page
David M. FranklinChairman & CEOFranklin & Wilson AirportConcessions, Inc.
Glenn Hicks IIIManaging DirectorEagle Bancshares Capital Group
David G. KahnPresident & CEOKahn & Company, Inc.
Rubye Mims LucasVice President Community AffairsTurner BroadcastingSystem, Inc.
William Porter “Billy” PaynePartnerGleacher and Company
Robert S. Prather, Jr.President & CEOBull Run Corporation
Monique WalkerChief Operating Officer &General Counsel The Walker Group
ChairSenator Jack Hill
Senator Greg Hecht
Senator Connie Stokes
Georgia World Congress Center Authority Board of Governors
Legislative Overview Committee
Vice ChairRepresentative Louise McBee
Representative Roger C. Byrd
Representative Carolyn F. Hugley