geospatial enabled business processes for electric...
TRANSCRIPT
Geospatial Enabled Business Processes
for Electric Utility
Tarun Batra
Head of Group- GIS
Tata Power Delhi Distribution Limited
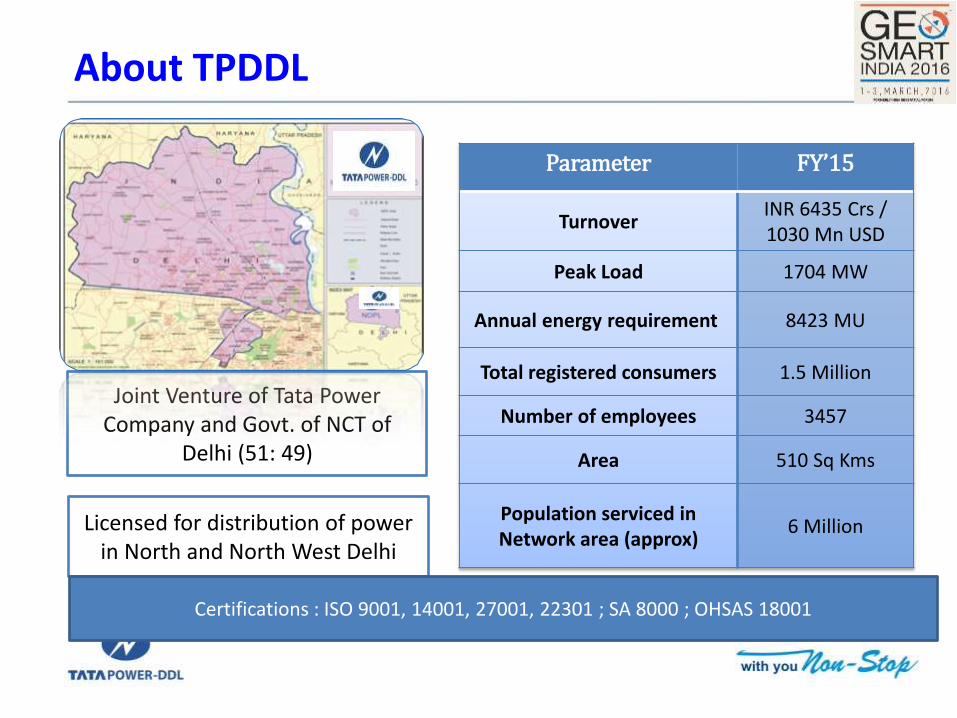
Joint Venture of Tata Power Company and Govt. of NCT of
Delhi (51: 49)
Licensed for distribution of power in North and North West Delhi
Certifications : ISO 9001, 14001, 27001, 22301 ; SA 8000 ; OHSAS 18001
About TPDDL
Parameter FY’15
Turnover INR 6435 Crs / 1030 Mn USD
Peak Load 1704 MW
Annual energy requirement 8423 MU
Total registered consumers 1.5 Million
Number of employees 3457
Area 510 Sq Kms
Population serviced in Network area (approx)
6 Million
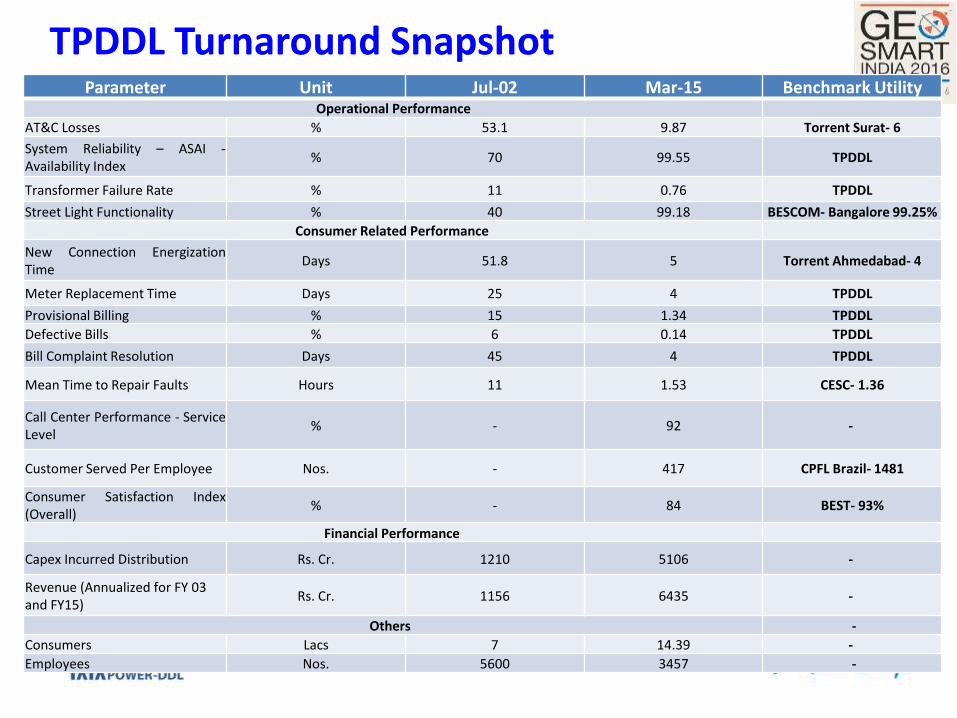
TPDDL Turnaround Snapshot Parameter Unit Jul-02 Mar-15 Benchmark Utility
Operational Performance
AT&C Losses % 53.1 9.87 Torrent Surat- 6
System Reliability – ASAI -Availability Index
% 70 99.55 TPDDL
Transformer Failure Rate % 11 0.76 TPDDL
Street Light Functionality % 40 99.18 BESCOM- Bangalore 99.25%
Consumer Related Performance
New Connection Energization Time
Days 51.8 5 Torrent Ahmedabad- 4
Meter Replacement Time Days 25 4 TPDDL
Provisional Billing % 15 1.34 TPDDL
Defective Bills % 6 0.14 TPDDL
Bill Complaint Resolution Days 45 4 TPDDL
Mean Time to Repair Faults Hours 11 1.53 CESC- 1.36
Call Center Performance - Service Level
% - 92 -
Customer Served Per Employee Nos. - 417 CPFL Brazil- 1481
Consumer Satisfaction Index (Overall)
% - 84 BEST- 93%
Financial Performance
Capex Incurred Distribution Rs. Cr. 1210 5106 -
Revenue (Annualized for FY 03 and FY15)
Rs. Cr. 1156 6435 -
Others -
Consumers Lacs 7 14.39 -
Employees Nos. 5600 3457 -
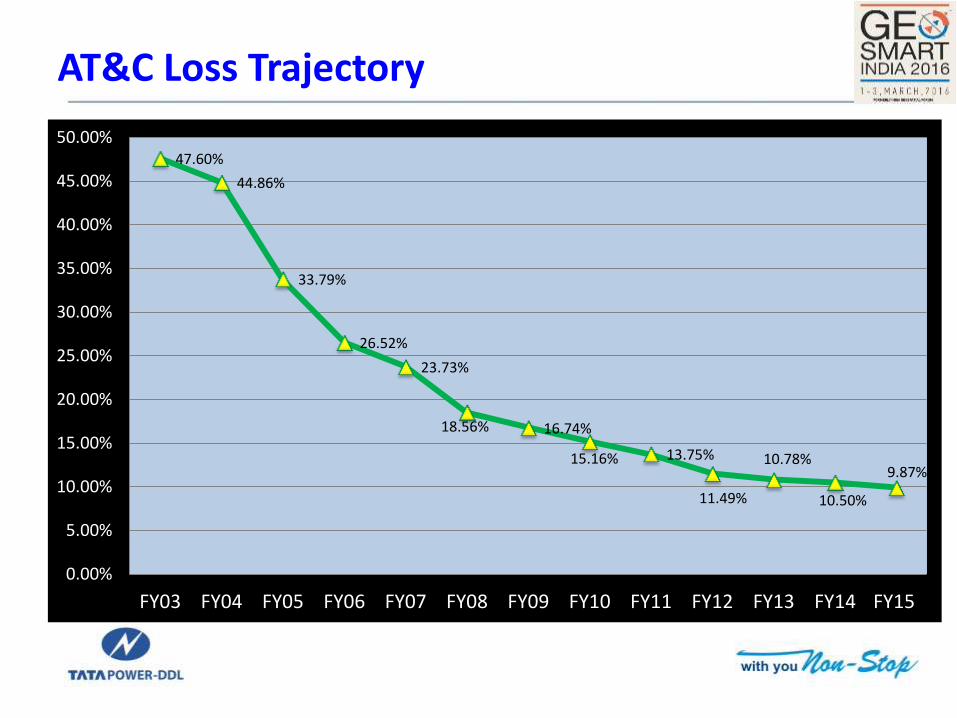
47.60%
44.86%
33.79%
26.52%
23.73%
18.56% 16.74%
15.16% 13.75%
11.49%
10.78%
10.50%
9.87%
0.00%
5.00%
10.00%
15.00%
20.00%
25.00%
30.00%
35.00%
40.00%
45.00%
50.00%
FY03 FY04 FY05 FY06 FY07 FY08 FY09 FY10 FY11 FY12 FY13 FY14 FY15
AT&C Loss Trajectory
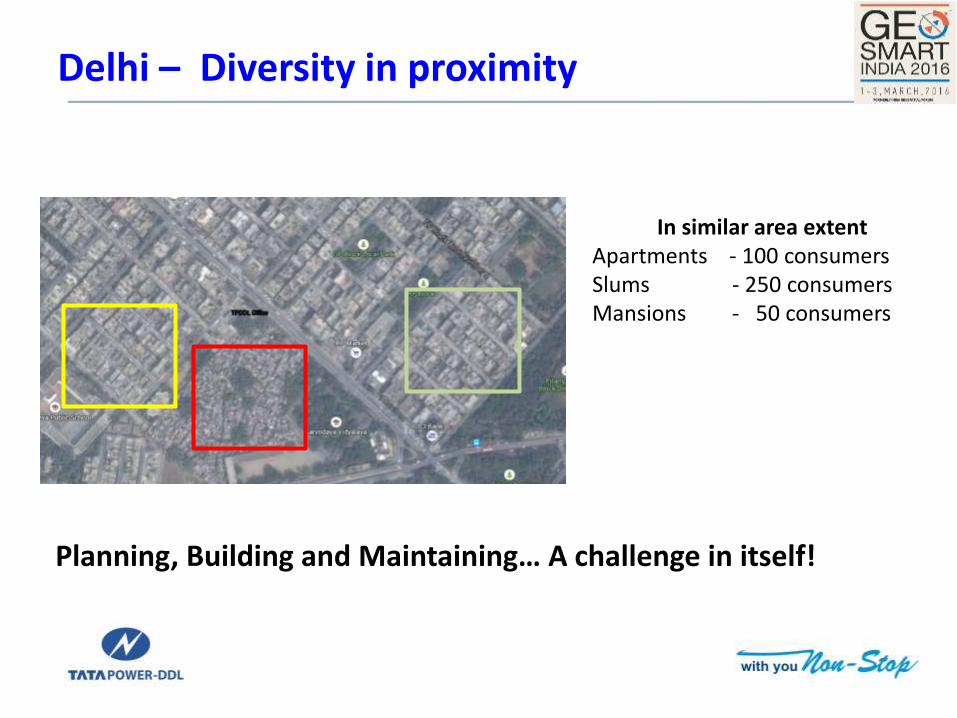
In similar area extent Apartments - 100 consumers Slums - 250 consumers Mansions - 50 consumers
Delhi – Diversity in proximity
Planning, Building and Maintaining… A challenge in itself!

GIS – Platform for unifying the diversity
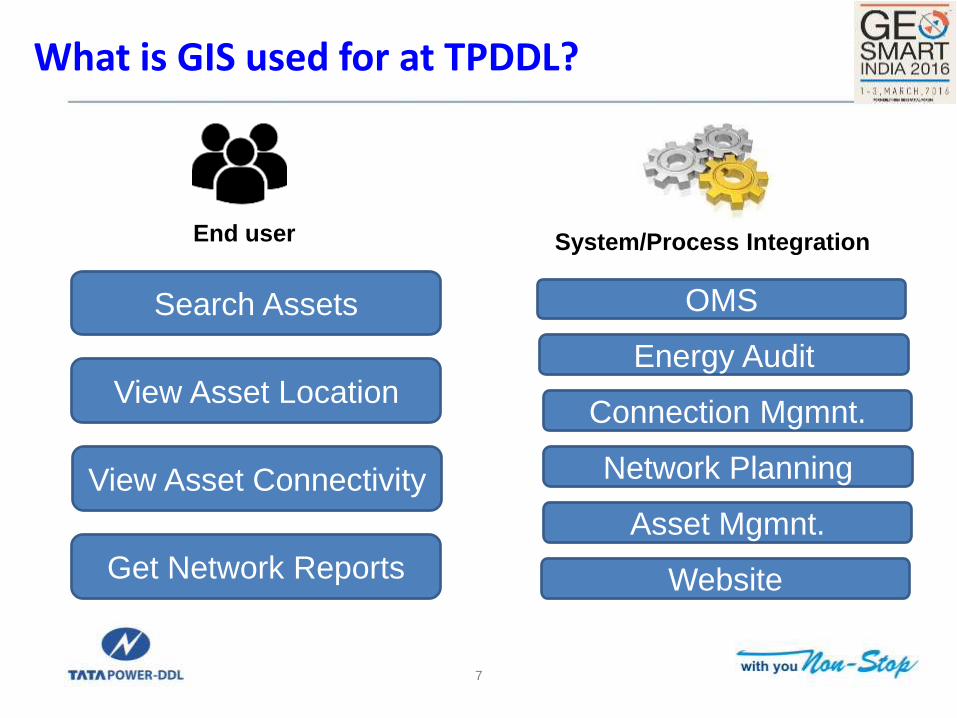
What is GIS used for at TPDDL?
7
Search Assets
View Asset Location
View Asset Connectivity
Get Network Reports
OMS
Energy Audit
Connection Mgmnt.
Network Planning
Asset Mgmnt.
End user System/Process Integration
Website
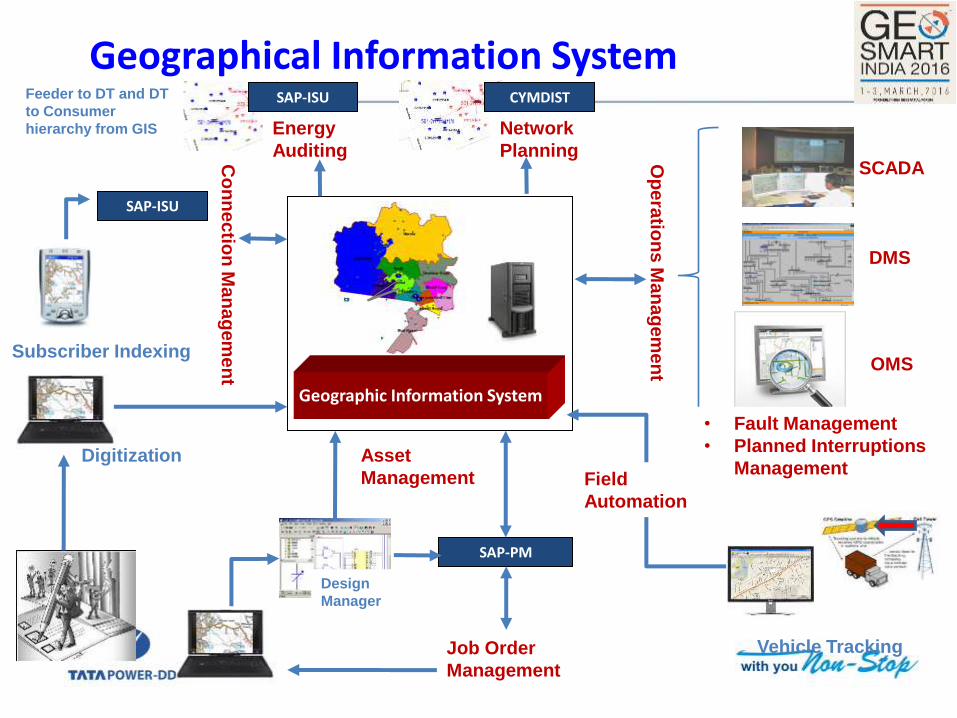
Geographical Information System
Asset
Management
Digitization
SAP-PM
Vehicle Tracking
Design
Manager
Geographic Information System
Subscriber Indexing
Co
nn
ec
tion
Ma
na
gem
en
t
Op
era
tion
s M
an
ag
em
en
t
SCADA
DMS
OMS
Field
Automation
SAP-ISU
Job Order
Management
• Fault Management
• Planned Interruptions
Management
Energy
Auditing
Network
Planning
SAP-ISU Feeder to DT and DT
to Consumer
hierarchy from GIS
CYMDIST
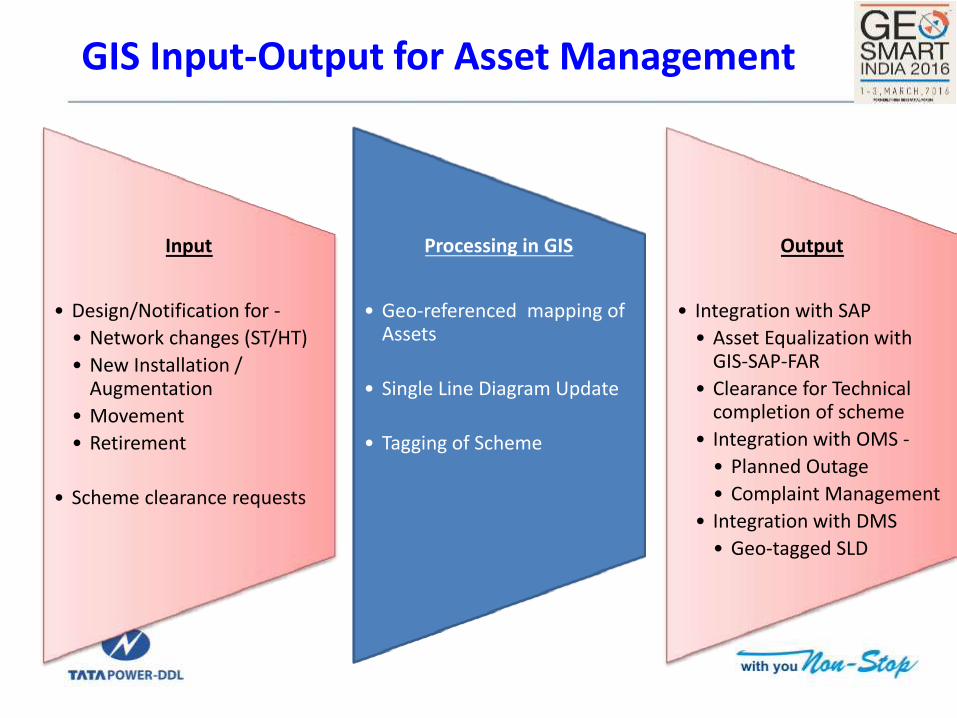
GIS Input-Output for Asset Management
Input
• Design/Notification for -
• Network changes (ST/HT)
• New Installation / Augmentation
• Movement
• Retirement
• Scheme clearance requests
Processing in GIS
• Geo-referenced mapping of Assets
• Single Line Diagram Update
• Tagging of Scheme
Output
• Integration with SAP
• Asset Equalization with GIS-SAP-FAR
• Clearance for Technical completion of scheme
• Integration with OMS -
• Planned Outage
• Complaint Management
• Integration with DMS
• Geo-tagged SLD
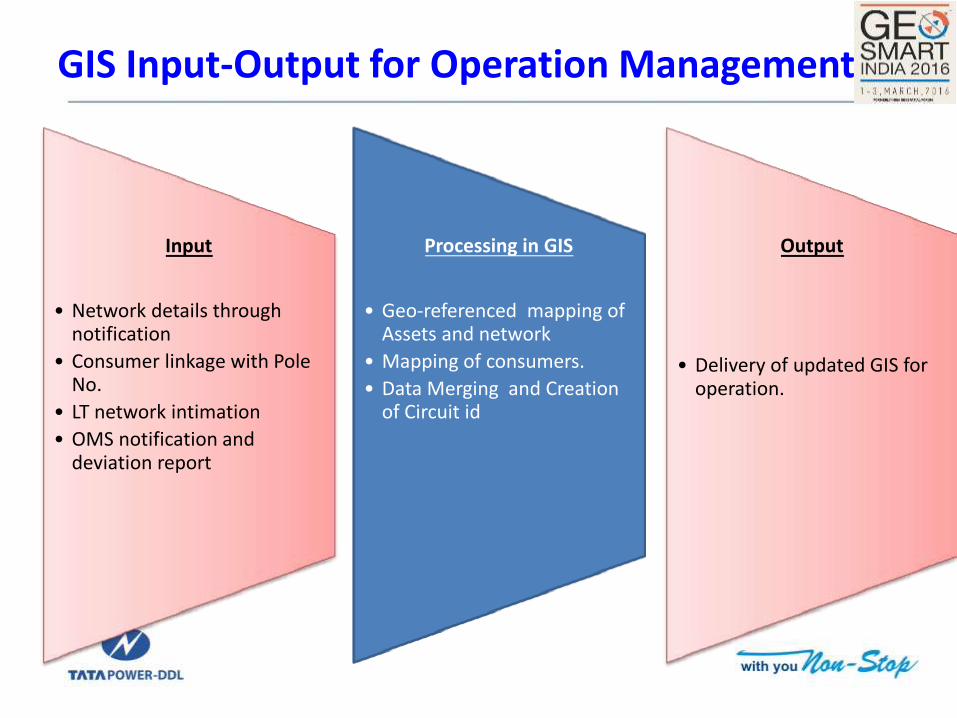
GIS Input-Output for Operation Management
Input
• Network details through notification
• Consumer linkage with Pole No.
• LT network intimation
• OMS notification and deviation report
Processing in GIS
• Geo-referenced mapping of Assets and network
• Mapping of consumers.
• Data Merging and Creation of Circuit id
Output
• Delivery of updated GIS for operation.
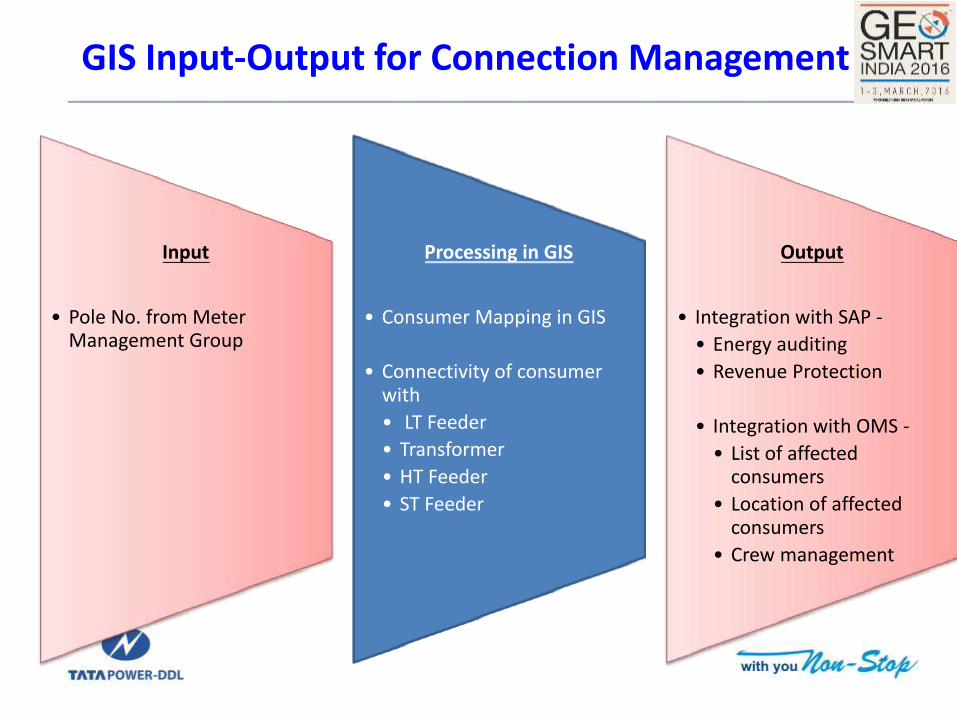
GIS Input-Output for Connection Management
Input
• Pole No. from Meter Management Group
Processing in GIS
• Consumer Mapping in GIS
• Connectivity of consumer with
• LT Feeder
• Transformer
• HT Feeder
• ST Feeder
Output
• Integration with SAP -
• Energy auditing
• Revenue Protection
• Integration with OMS -
• List of affected consumers
• Location of affected consumers
• Crew management
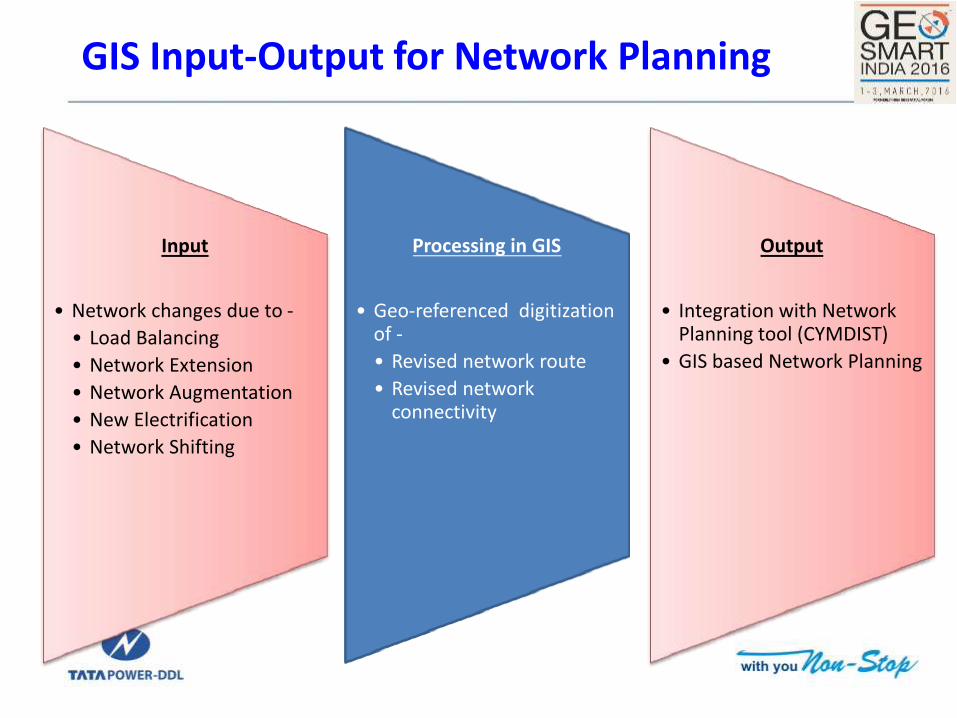
GIS Input-Output for Network Planning
Input
• Network changes due to -
• Load Balancing
• Network Extension
• Network Augmentation
• New Electrification
• Network Shifting
Processing in GIS
• Geo-referenced digitization of -
• Revised network route
• Revised network connectivity
Output
• Integration with Network Planning tool (CYMDIST)
• GIS based Network Planning
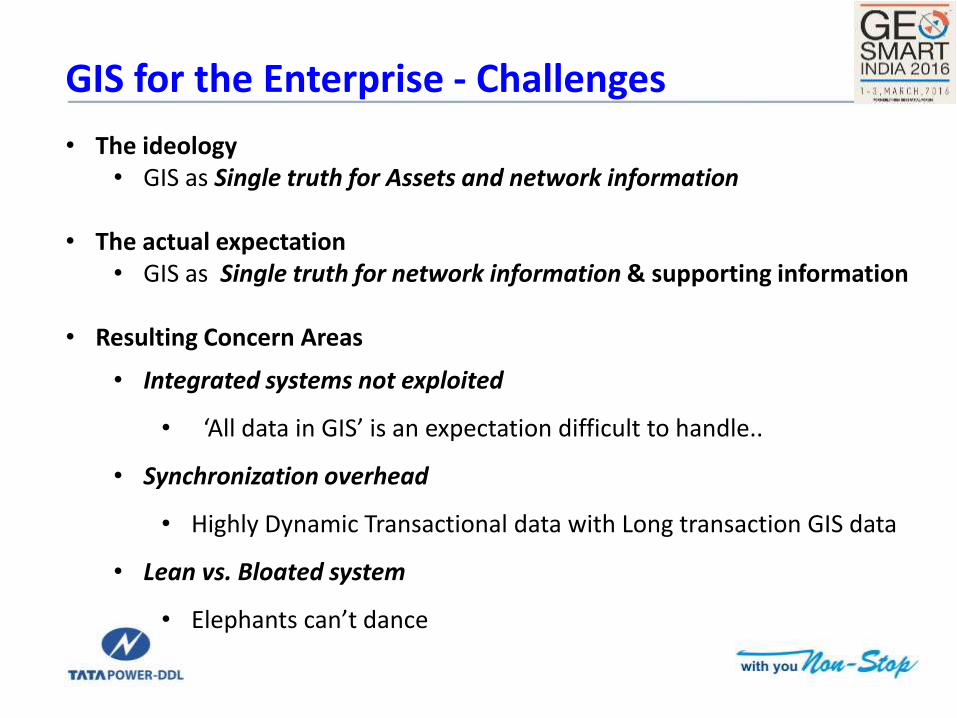
• The ideology • GIS as Single truth for Assets and network information
• The actual expectation
• GIS as Single truth for network information & supporting information
• Resulting Concern Areas
• Integrated systems not exploited
• ‘All data in GIS’ is an expectation difficult to handle..
• Synchronization overhead
• Highly Dynamic Transactional data with Long transaction GIS data
• Lean vs. Bloated system
• Elephants can’t dance
GIS for the Enterprise - Challenges
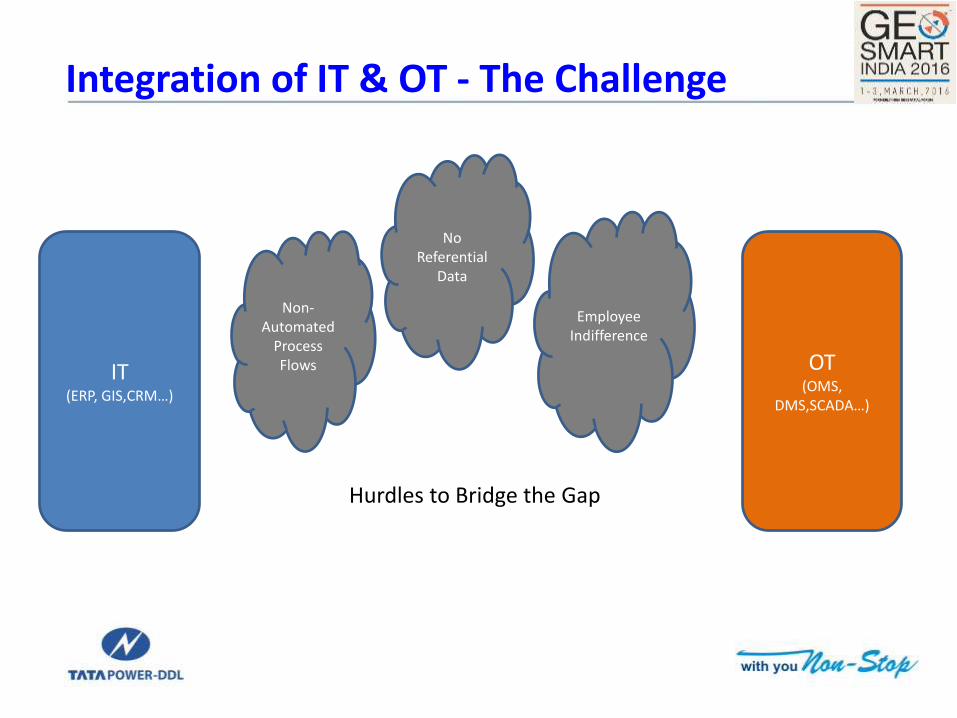
Integration of IT & OT - The Challenge
IT (ERP, GIS,CRM…)
OT (OMS,
DMS,SCADA…)
Non-Automated
Process Flows
No Referential
Data
Employee Indifference
Hurdles to Bridge the Gap
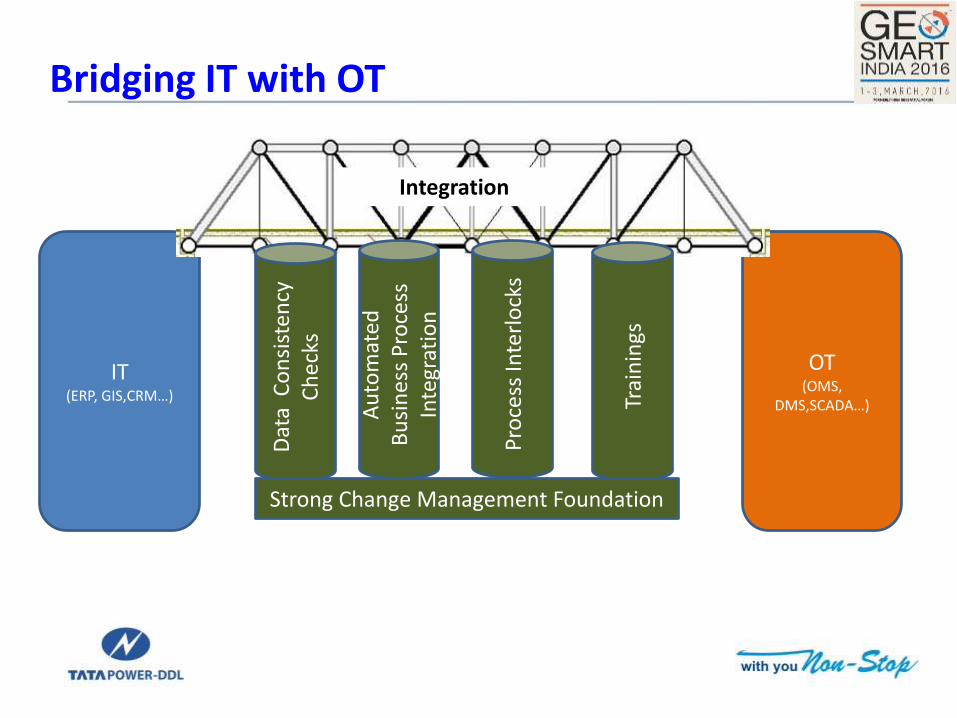
Bridging IT with OT
IT (ERP, GIS,CRM…)
OT (OMS,
DMS,SCADA…)
Integration
Trai
nin
gs
Au
tom
ated
B
usi
nes
s P
roce
ss
Inte
grat
ion
Dat
a C
on
sist
ency
C
he
cks
Pro
cess
Inte
rlo
cks
Strong Change Management Foundation
• Driving Operations based on GIS requires GIS data to be qualified in terms of –
• Completeness • Accuracy • Timeliness
• Technology plays a key role in ease of integration at a ‘systems/data’ level
• However, a major role is also played by definition of processes that ensure
quality of GIS data and support the integration between IT & OT • TPDDL has been successful in the implementation of it Smart Grid Vision
due to the Business Process Re-Engineering , Change Management and definition of robust processes for sustenance of data quality in it’s enterprise GIS
GIS data readiness for Operations
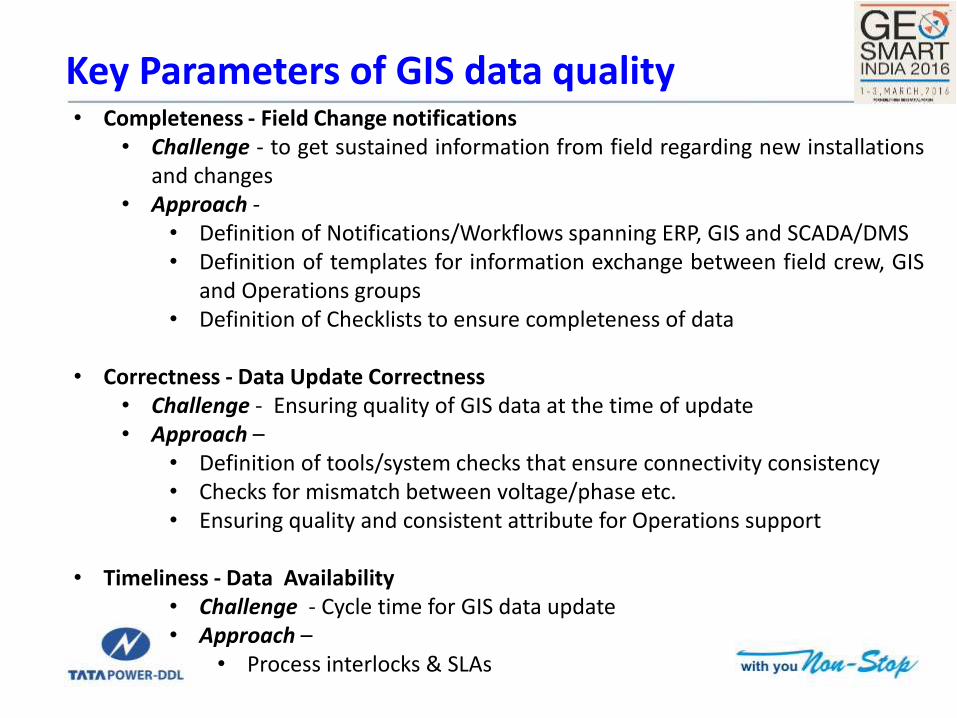
• Completeness - Field Change notifications • Challenge - to get sustained information from field regarding new installations
and changes • Approach -
• Definition of Notifications/Workflows spanning ERP, GIS and SCADA/DMS • Definition of templates for information exchange between field crew, GIS
and Operations groups • Definition of Checklists to ensure completeness of data
• Correctness - Data Update Correctness
• Challenge - Ensuring quality of GIS data at the time of update • Approach –
• Definition of tools/system checks that ensure connectivity consistency • Checks for mismatch between voltage/phase etc. • Ensuring quality and consistent attribute for Operations support
• Timeliness - Data Availability
• Challenge - Cycle time for GIS data update • Approach –
• Process interlocks & SLAs
Key Parameters of GIS data quality
18
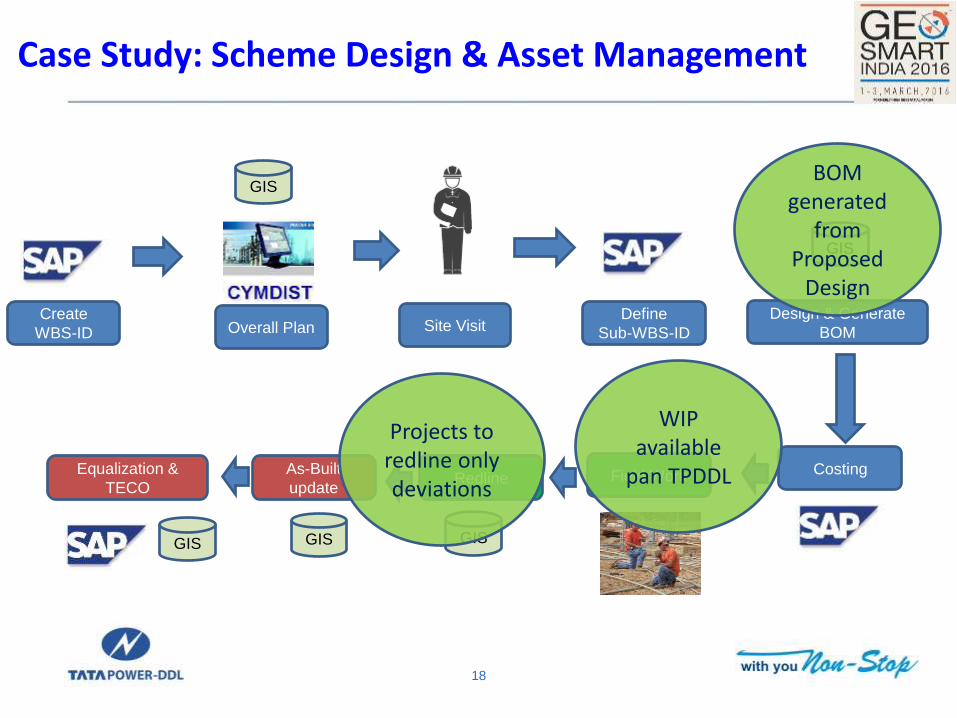
Create
WBS-ID
GIS
Define
Sub-WBS-ID Overall Plan Site Visit Design & Generate
BOM
Costing Field Work
GIS
Redline
GIS
As-Built
update
GIS
GIS
BOM generated
from Proposed
Design
WIP available
pan TPDDL
Projects to redline only deviations
Equalization &
TECO
Case Study: Scheme Design & Asset Management
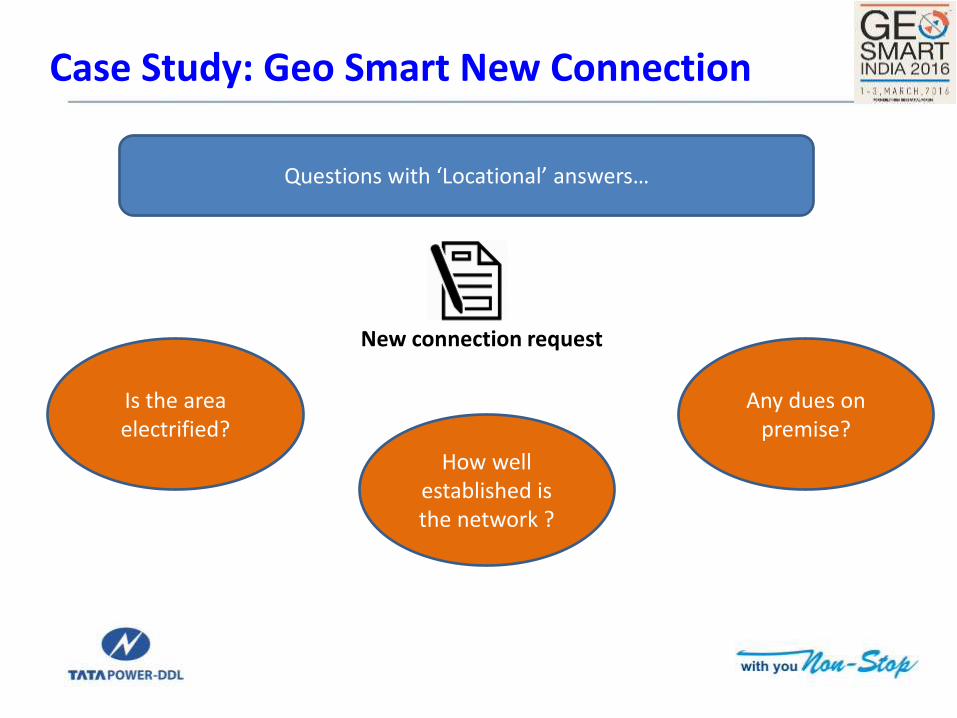
Questions with ‘Locational’ answers…
Is the area electrified?
How well established is the network ?
Any dues on premise?
New connection request
Case Study: Geo Smart New Connection
Functional
Location
Flagging
Status
Electrification
Status Zone District Circle
Master
Area Short desc.
300000015714 Flagged Partially Electrified 513 BWN SUB URBAN 513-10 VILLAGE KARALA
300000015881 Flagged Partially Electrified 513 BWN SUB URBAN 513-10 VILLAGE KARALA
300000016050 Flagged Partially Electrified 513 BWN SUB URBAN 513-4 PREM NAGAR
300000016152 Flagged Partially Electrified 513 BWN SUB URBAN 513-4 PREM NAGAR
300000008378 Flagged Partially Electrified 513 BWN SUB URBAN 513-10 VILLAGE KARALA
300000003335 Flagged Partially Electrified 513 BWN SUB URBAN 513-13 VILLAGE MOHAMADPUR MAZRI
300000009558 Flagged Partially Electrified 513 BWN SUB URBAN 513-4 PREM NAGAR
300000007480 Flagged Partially Electrified 513 BWN SUB URBAN 513-10 VILLAGE KARALA
300000019066 Flagged Partially Electrified 513 BWN SUB URBAN 513-10 VILLAGE KARALA
300000002087 Flagged Partially Electrified 513 BWN SUB URBAN 513-14 VILLAGE MUBARKPUR
300000012500 Flagged Partially Electrified 513 BWN SUB URBAN 513-10 VILLAGE KARALA
300000019746 Flagged Partially Electrified 513 BWN SUB URBAN 513-10 VILLAGE KARALA
300000005114 Flagged Partially Electrified 1302 MTN City 1302-6 VILLAGE NARAINA
300000013579 Flagged Partially Electrified 513 BWN SUB URBAN 513-4 PREM NAGAR
300000007660 Flagged Partially Electrified 513 BWN SUB URBAN 513-4 PREM NAGAR
300000008168 Flagged Partially Electrified 513 BWN SUB URBAN 513-2 INDER ENCLAVE
300000014377 Flagged Un-electrified 513 BWN SUB URBAN 513-18 ROHINI
300000013204 Flagged Partially Electrified 513 BWN SUB URBAN 513-4 PREM NAGAR
300000003520 Flagged Partially Electrified 513 BWN SUB URBAN 513-10 VILLAGE KARALA
300000003741 Flagged Partially Electrified 513 BWN SUB URBAN 513-2 INDER ENCLAVE
300000002186 Flagged Partially Electrified 513 BWN SUB URBAN 513-10 VILLAGE KARALA
300000015663 Flagged Partially Electrified 513 BWN SUB URBAN 513-10 VILLAGE KARALA
300000016936 Flagged Partially Electrified 513 BWN SUB URBAN 513-4 PREM NAGAR
300000018630 Flagged Partially Electrified 513 BWN SUB URBAN 513-4 PREM NAGAR
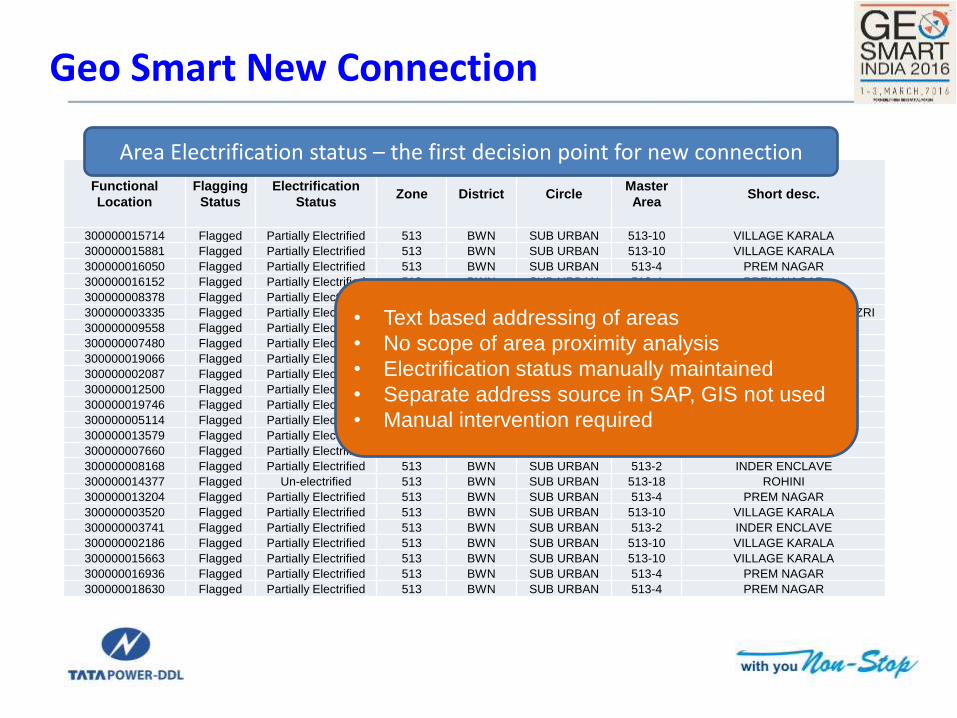
• Text based addressing of areas
• No scope of area proximity analysis
• Electrification status manually maintained
• Separate address source in SAP, GIS not used
• Manual intervention required
Area Electrification status – the first decision point for new connection
Geo Smart New Connection

Locational answers – by Geo-SMART applications
Is the area electrified?
How well established is the network ?
Any dues on premise?
New connection request
Area feasibility
Network feasibility
Commercial feasibility
The answers lie with the Location – the location is GIS
Geo Smart New Connection
22
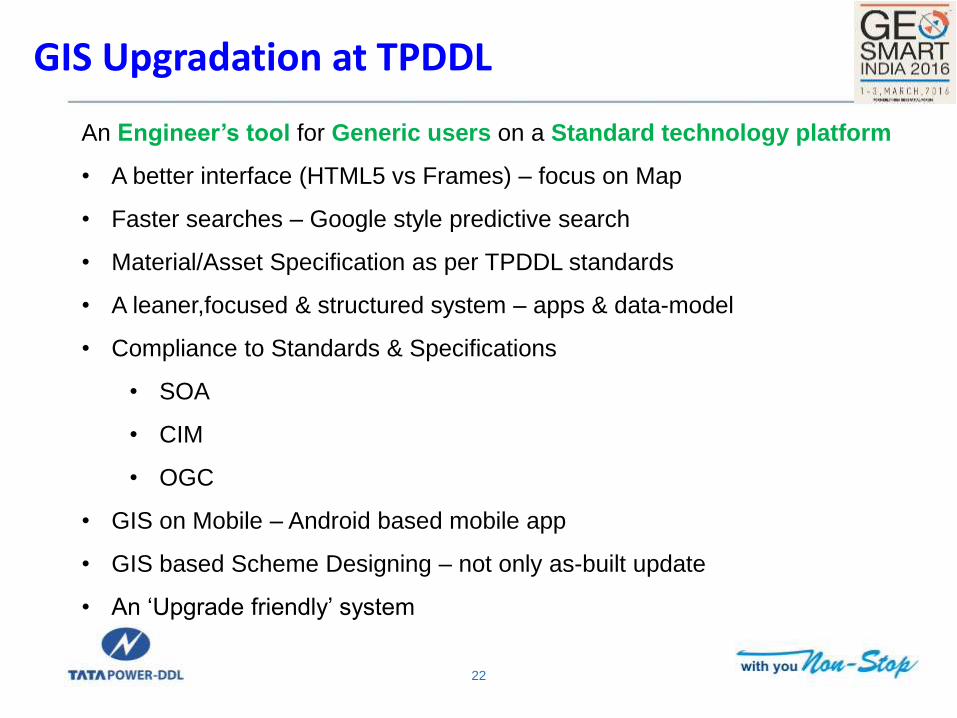
GIS Upgradation at TPDDL
An Engineer’s tool for Generic users on a Standard technology platform
• A better interface (HTML5 vs Frames) – focus on Map
• Faster searches – Google style predictive search
• Material/Asset Specification as per TPDDL standards
• A leaner,focused & structured system – apps & data-model
• Compliance to Standards & Specifications
• SOA
• CIM
• OGC
• GIS on Mobile – Android based mobile app
• GIS based Scheme Designing – not only as-built update
• An ‘Upgrade friendly’ system