geosphere causes and consequences of flat-slab subduction ... · causes and consequences of...
TRANSCRIPT

Research Paper
1Bishop et al. | Flat subduction in southern PeruGEOSPHERE | Volume 13 | Number 5
Causes and consequences of flat-slab subduction in southern PeruBrandon T. Bishop1, Susan L. Beck1, George Zandt1, Lara Wagner2, Maureen Long3, Sanja Knezevic Antonijevic4, Abhash Kumar5, and Hernando Tavera6
1Department of Geosciences, University of Arizona, 1040 East 4th Street, Tucson, Arizona 85721, USA2Department of Terrestrial Magnetism, Carnegie Institution for Science, 5241 Broad Branch Road NW, Washington, D.C. 20015, USA3Department of Geology and Geophysics, Yale University, 210 Whitney Avenue, New Haven, Connecticut 06511, USA4University of North Carolina at Chapel Hill, CB #3312, Chapel Hill, North Carolina 27599, USA5National Energy Technology Laboratory, 626 Cochrans Mill Road, Pittsburgh, Pennsylvania 15236, USA6Instituto Geofísico del Perú, Calle Badajoz 169, Lima 15012, Peru
ABSTRACT
Flat or near-horizontal subduction of oceanic lithosphere has been an im-portant tectonic process both currently and in the geologic past. Subduction of the aseismic Nazca Ridge beneath South America has been associated with the onset of flat subduction and the termination of arc volcanism in Peru, making it an ideal place to study flat-slab subduction. Recently acquired seis-mic recordings for 144 broadband seismic stations in Peru permit us to image the Mohorovičić discontinuity (Moho) of the subducted oceanic Nazca plate, Nazca Ridge, and the overlying continental Moho of the South American crust in detail through the calculation of receiver functions. We find that the sub-ducted over-thickened ridge crust is likely significantly eclogitized ~350 km from the trench, requiring that the inboard continuation of the flat slab be supported by mechanisms other than low-density crustal material. This contin-uation coincides with a low-velocity anomaly identified in prior tomography studies of the region immediately below the flat slab, and this anomaly may provide some support for the flat slab. The subduction of the Nazca Ridge has displaced most, if not the entire South American lithospheric mantle beneath the high Andes as well as up to 10 km of the lowermost continental crust. The lack of deep upper-plate seismicity suggests that the Andean crust has remained warm during flat subduction and is deforming ductilely around the subducted ridge. This deformation shows significant coupling between the subducting Nazca oceanic plate and overriding South American conti-nental plate up to ~500 km from the trench. These results provide important modern constraints for interpreting the geological consequences of past and present flat-slab subduction locations globally.
INTRODUCTION
Near-horizontal subduction or flat-slab subduction of oceanic lithosphere occurs along ~10% of all subduction zones today and has been postulated to have occurred in many subduction zones in the past to explain patterns of overriding plate magmatism and deformation (Gutscher et al., 2000; Kay and Mpodozis, 2002). In this mode of subduction, the descending slab initially
dips at a normal angle (~30°) down to a depth of ~80–100 km, then becomes horizontal for several hundred km, before descending more steeply into the mantle. Studying present-day flat-slab subduction, including the Peruvian flat slab, may provide important insights into this process. How strongly coupled the downgoing and overriding plates may be in a flat-slab system has long been debated, and our study suggests that the South American and Nazca plates are strongly coupled in the segment of the Peruvian flat slab associated with the subduction of the Nazca Ridge. The causes of flat subduction and the effects on the upper plate also remain topics of vigorous debate. Numerous studies suggest several factors are important, including the age of the sub-ducting slab, the absolute motion of the plates, and the presence of buoyant features, such as aseismic ridges on the descending plate (e.g., Gutscher et al., 2000; van Hunen et al., 2002a). Other studies suggest these features are not sufficient and that dynamic effects and the structure of the upper plate play an important role (e.g., Gerya et al., 2009; Manea et al., 2012; O’Driscoll et al., 2012). Additional parameters potentially influencing flat subduction include changes in the viscosity and geometry of the mantle wedge separating the two plates, with relatively shallow low-viscosity regions in the mantle wedge acting to enhance slab flattening by reducing viscous resistance (Manea and Gurnis, 2007). Prior studies of the proposed Cretaceous to mid-Cenozoic Lara-mide flat slab beneath the western United States and the present-day Sierras Pampeanas flat slab beneath Chile and Argentina have argued that flat-slab subduction leads to both the termination of arc volcanism (e.g., Dickinson and Snyder, 1978, for Laramide; Barazangi and Isacks, 1976, for Sierras Pampeanas) and compressional thick-skinned crustal deformation in the upper plate (see Erslev, 2005, for a review of the Laramide; Jordan and Allmendinger, 1986, for the Sierras Pampeanas). However, not all instances of present-day flat subduc-tion are associated with these features. The Mexico flat slab occurs in associa-tion with an inboard active arc and a neutral to extensional state of stress in the upper plate (Suter et al., 2001; Gérault et al., 2015), while the Peruvian flat slab is associated with a cessation of arc volcanism (e.g., Rosenbaum et al., 2005) and long spatial wavelength foreland uplift (Espurt et al., 2007). This diverse range of behavior indicates that no single set of upper-plate responses can be linked to all flat subduction occurrences (see Manea et al., 2017, for a detailed review of present-day flat-slab systems).
GEOSPHERE
GEOSPHERE; v. 13, no. 5
doi:10.1130/GES01440.1
7 figures; 3 supplemental files
CORRESPONDENCE: brandontbishop@email .arizona .edu
CITATION: Bishop, B.T., Beck, S.L., Zandt, G., Wag-ner, L., Long, M., Knezevic Antonijevic, S., Kumar, A., and Tavera, H., 2017, Causes and consequences of flat-slab subduction in southern Peru: Geosphere, v. 13, no. 5, p. 1–16, doi:10.1130/GES01440.1.
Received 6 October 2016Revision received 18 April 2017Accepted 9 June 2017
For permission to copy, contact Copyright Permissions, GSA, or [email protected].
© 2017 Geological Society of America
THEMED ISSUE: Subduction Top to Bottom 2

Research Paper
2Bishop et al. | Flat subduction in southern PeruGEOSPHERE | Volume 13 | Number 5
We present new receiver function images of the flat-slab region in southern Peru calculated using data from recent deployments of broadband seismic sta-tions. We identify both the South American continental Moho and subducted Nazca oceanic Moho, map the depths to both discontinuities, and calculate an isopach map of the thickness separating the two. The results show up to 20 km of continental crustal thickness variation and delineate the flat slab’s depth and areal extent. The new information on the geometry of the flat slab and the structure of the overlying continental crust, in conjunction with recent tomo-graphic results, reveal new clues on the causes of flat subduction and provide details on the tectonic effects in the overlying plate.
SOUTHERN PERUVIAN FLAT SLAB
The Nazca and South American plates have a present convergence rate in our study region of ~7 cm/yr oriented at an azimuth of 71° (DeMets et al., 2010), a significant departure from the calculated 0 Ma to 5 Ma average con-vergence value of 8.5 cm/yr oriented along an azimuth of 82° (Somoza and Ghidella, 2012). The oceanic Nazca plate first subducts at an angle of ~30°, then flattens near a depth of 100 km to become nearly horizontal in the upper-most mantle beneath South America between 2°S and 15°S and subducts at a continuous angle of ~30° south of ~15°S (Gutscher et al., 2000). The mod-ern gap in active arc volcanism characterizing northern and central Peru was established between 2 and 3 Ma (Noble and McKee, 1982; Rosenbaum et al., 2005) following a significant pulse of magmatism between 16 Ma and 4 Ma (Rosenbaum et al., 2005). Approximately perpendicular to the Peruvian Trench lies the Nazca Ridge, an aseismic ridge with ~17–20-km-thick oceanic crust (Hampel et al., 2004; Tassara et al., 2006) formed from the interaction of the Easter-Salas Hotspot and the East Pacific Rise (Coffin and Eldholm, 1994; Ray et al., 2012). Subduction of the Nazca Ridge has been linked to the cessation of volcanism and ongoing flat-slab subduction between ~9°S and 15°S (Fig. 1) (e.g., Gutscher et al., 1999; Gutscher et al., 2000; Hampel, 2002; Rosenbaum et al., 2005; Antonijevic et al., 2015). Slab seismicity relocated by Kumar et al. (2016) for a 2.5 year period shows earthquakes at depths of <~100 km in the re-gion where the Nazca Ridge subducts and a gap in deeper seismicity >~100 km along the projection of the subducting Nazca Ridge (Fig. 2).
The western margin of South America between 9°S and 17°S can be di-vided into seven major morphostructural units (Fig. 1, modified from Espurt et al., 2010; Carlotto, 2013). From west to east, the forearc, Western Cordillera (WC), Eastern Cordillera (EC), Subandes, and Amazonian foreland basin ex-tend along a northwest-southeast trend throughout the study region. The Alti-plano Plateau is localized in the southeastern corner of our study region, and the Fitzcarrald Arch is a broad foreland uplift aligned with the inland projection of the oceanic Nazca Ridge (Fig. 1). While uplift of the forearc (e.g., Macharé and Ortlieb, 1992; Saillard et al., 2011) and the formation of the Fitzcarrald Arch (e.g., Espurt et al., 2007; Espurt et al., 2010) have been proposed to correspond to the ongoing subduction of the Nazca Ridge, no ridge-related deformation
inboard of the 500 m elevation contour of the WC has been documented within the cordillera (Wipf et al., 2008).
Crustal seismicity in the WC is limited to <10 km depth, while that in the EC is limited to <20 km depth (Dorbath et al., 1990; Dorbath et al., 1991; Devlin et al., 2012) in contrast to seismicity observed at >30 km depth in the Subandes (Dorbath et al., 1991; Devlin et al., 2012). This suggests a comparatively shallow brittle to ductile transition depth in the WC and EC relative to the Subandes. East of the forearc, little to no seismicity is observed between this seismo genic
80°W 78°W 76°W 74°W 72°W 70°W
16°S
18°S
14°S
12°S
10°S
8°S
8.5 cm/yr
Nazca Ridge
10.8 Ma7.85 Ma
4.9 Ma
Present
A
A′
B
D
B′
D′C
2C′
2′
1
1′
Fitzcarrald Arch
Altiplano
Forearc
W. Cord.
E. Cord.Subandes
N
Holocene Volcanic Center Symbols:
Prior Cont. Moho Constraint
GSN Permanent StationPULSE Temporary StationPeruSE Temporary StationCAUGHT Temporary Station
Peru-Chile TrenchRidge Tip Through TimeActive Thrust Fault
Nazca-S. America Convergence Vector
Morphostructural UnitNazca Ridge 4km Contour
100 km
–8–6–4–2012345Elevation(km)
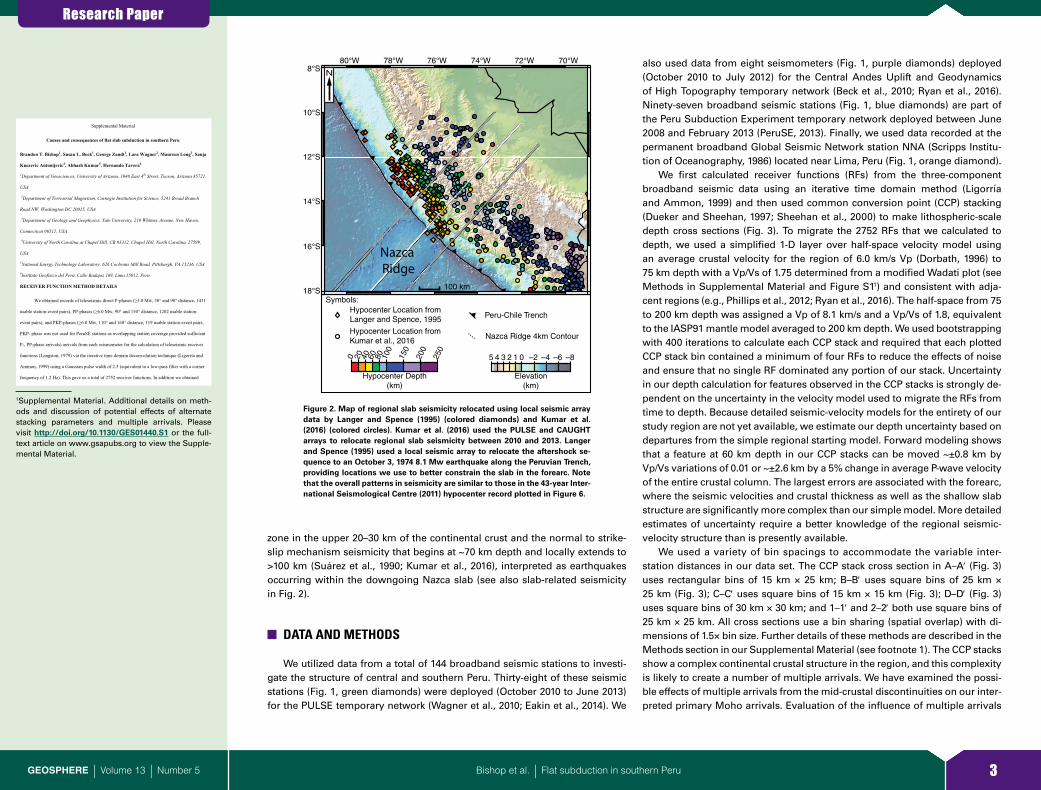
Figure 1. Tectonic features of central Peru and adjacent regions with loca-tions of broadband seismic stations used in this study and of receiver func-tion profiles from this study. White line marks projection of Nazca Ridge axis; gray lines mark projection of ridge edges based on Saillard et al. (2011) seafloor bathymetry. These projections correspond to the uplifted Peruvian Forearc, the intersection of the Fitzcarrald Arch foreland uplift with the Andean thrust front, and the approximate termination of the active Holocene volcanic arc near 15°S. Orange circles mark constraints on continental Moho depth from prior seismic studies (James and Snoke, 1994; McGlashan et al., 2008). Red circles and associated ages mark the approximate position of a point on the southern edge of the subducted Nazca Ridge through time as it passes through the PULSE area, following the Hampel (2002) model. See text for details of morphostructural units (modified from Espurt et al., 2007; Carlotto, 2013) and seismic arrays. Holocene volcanic centers from Global Volcanism Program (2013), present Nazca–South America convergence vec-tor at 12°S from Somoza and Ghidella (2012), and Marotta et al. (2013).
Research Paper
3Bishop et al. | Flat subduction in southern PeruGEOSPHERE | Volume 13 | Number 5
zone in the upper 20–30 km of the continental crust and the normal to strike-slip mechanism seismicity that begins at ~70 km depth and locally extends to >100 km (Suárez et al., 1990; Kumar et al., 2016), interpreted as earthquakes occurring within the downgoing Nazca slab (see also slab-related seismicity in Fig. 2).
DATA AND METHODS
We utilized data from a total of 144 broadband seismic stations to investi-gate the structure of central and southern Peru. Thirty-eight of these seismic stations (Fig. 1, green diamonds) were deployed (October 2010 to June 2013) for the PULSE temporary network (Wagner et al., 2010; Eakin et al., 2014). We
also used data from eight seismometers (Fig. 1, purple diamonds) deployed (October 2010 to July 2012) for the Central Andes Uplift and Geodynamics of High Topography temporary network (Beck et al., 2010; Ryan et al., 2016). Ninety- seven broadband seismic stations (Fig. 1, blue diamonds) are part of the Peru Subduction Experiment temporary network deployed between June 2008 and February 2013 (PeruSE, 2013). Finally, we used data recorded at the permanent broadband Global Seismic Network station NNA (Scripps Institu-tion of Oceanography, 1986) located near Lima, Peru (Fig. 1, orange diamond).
We first calculated receiver functions (RFs) from the three-component broadband seismic data using an iterative time domain method (Ligorría and Ammon, 1999) and then used common conversion point (CCP) stacking (Dueker and Sheehan, 1997; Sheehan et al., 2000) to make lithospheric-scale depth cross sections (Fig. 3). To migrate the 2752 RFs that we calculated to depth, we used a simplified 1-D layer over half-space velocity model using an average crustal velocity for the region of 6.0 km/s Vp (Dorbath, 1996) to 75 km depth with a Vp/Vs of 1.75 determined from a modified Wadati plot (see Methods in Supplemental Material and Figure S11) and consistent with adja-cent regions (e.g., Phillips et al., 2012; Ryan et al., 2016). The half-space from 75 to 200 km depth was assigned a Vp of 8.1 km/s and a Vp/Vs of 1.8, equivalent to the IASP91 mantle model averaged to 200 km depth. We used bootstrapping with 400 iterations to calculate each CCP stack and required that each plotted CCP stack bin contained a minimum of four RFs to reduce the effects of noise and ensure that no single RF dominated any portion of our stack. Uncertainty in our depth calculation for features observed in the CCP stacks is strongly de-pendent on the uncertainty in the velocity model used to migrate the RFs from time to depth. Because detailed seismic-velocity models for the entirety of our study region are not yet available, we estimate our depth uncertainty based on departures from the simple regional starting model. Forward modeling shows that a feature at 60 km depth in our CCP stacks can be moved ~±0.8 km by Vp/Vs variations of 0.01 or ~±2.6 km by a 5% change in average P-wave velocity of the entire crustal column. The largest errors are associated with the forearc, where the seismic velocities and crustal thickness as well as the shallow slab structure are significantly more complex than our simple model. More detailed estimates of uncertainty require a better knowledge of the regional seismic- velocity structure than is presently available.
We used a variety of bin spacings to accommodate the variable inter-station distances in our data set. The CCP stack cross section in A–A′ (Fig. 3) uses rectangu lar bins of 15 km × 25 km; B–B′ uses square bins of 25 km × 25 km (Fig. 3); C–C′ uses square bins of 15 km × 15 km (Fig. 3); D–D′ (Fig. 3) uses square bins of 30 km × 30 km; and 1–1′ and 2–2′ both use square bins of 25 km × 25 km. All cross sections use a bin sharing (spatial overlap) with di-mensions of 1.5× bin size. Further details of these methods are described in the Methods section in our Supplemental Material (see footnote 1). The CCP stacks show a complex continental crustal structure in the region, and this complexity is likely to create a number of multiple arrivals. We have examined the possi-ble effects of multiple arrivals from the mid-crustal discontinuities on our inter-preted primary Moho arrivals. Evaluation of the influence of multiple arrivals
80°W 78°W 76°W 74°W 72°W 70°W
16°S
18°S
14°S
12°S
10°S
8°S
Nazca Ridge
N
Symbols:
Hypocenter Location from Kumar et al., 2016
Hypocenter Location fromLanger and Spence, 1995 Peru-Chile Trench
Nazca Ridge 4km Contour
100 km
–8–6–4–2012345
Elevation(km)
0 20 40 60 80 100
150
200
250
Hypocenter Depth(km)
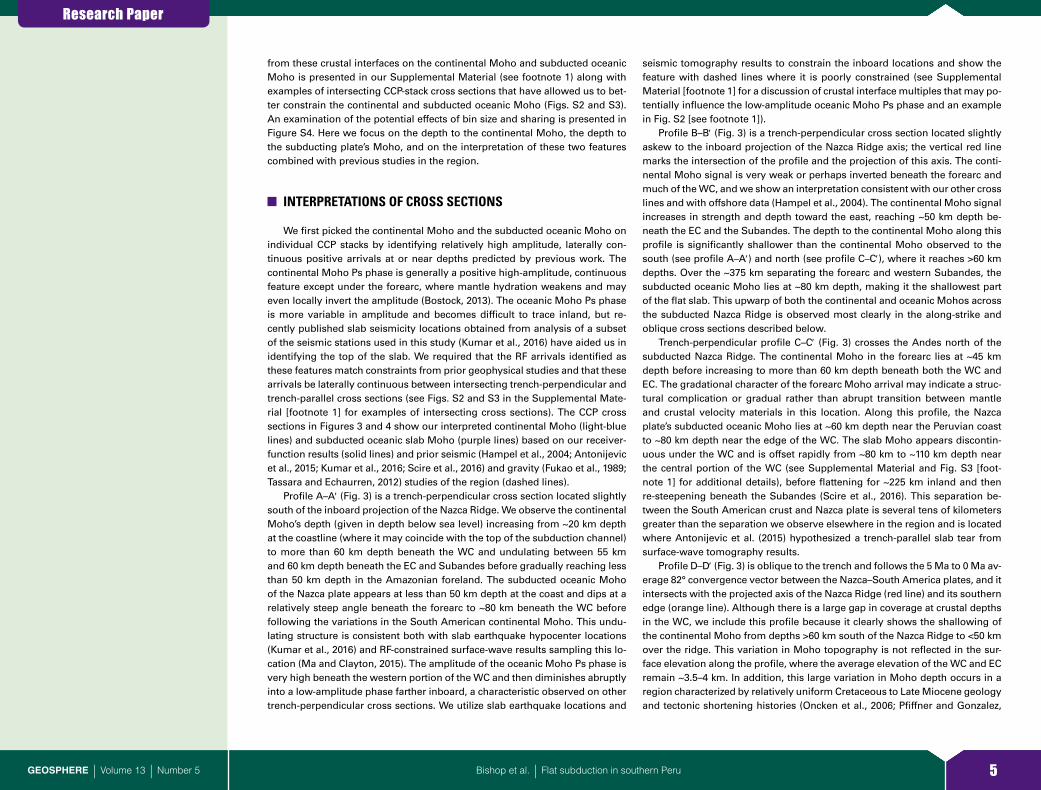
Figure 2. Map of regional slab seismicity relocated using local seismic array data by Langer and Spence (1995) (colored diamonds) and Kumar et al. (2016) (colored circles). Kumar et al. (2016) used the PULSE and CAUGHT arrays to relocate regional slab seismicity between 2010 and 2013. Langer and Spence (1995) used a local seismic array to relocate the aftershock se-quence to an October 3, 1974 8.1 Mw earthquake along the Peruvian Trench, providing locations we use to better constrain the slab in the forearc. Note that the overall patterns in seismicity are similar to those in the 43-year Inter-national Seismological Centre (2011) hypocenter record plotted in Figure 6.
Supplemental Material
Causes and consequences of flat slab subduction in southern Peru
Brandon T. Bishop1, Susan L. Beck1, George Zandt1, Lara Wagner2, Maureen Long3, Sanja
Knezevic Antonijevic4, Abhash Kumar5, Hernando Tavera6
1Department of Geosciences, University of Arizona, 1040 East 4th Street, Tucson, Arizona 85721,
USA
2Department of Terrestrial Magnetism, Carnegie Institution for Science, 5241 Broad Branch
Road NW, Washington DC 20015, USA
3Department of Geology and Geophysics, Yale University, 210 Whitney Avenue, New Haven,
Connecticut 06511, USA
4University of North Carolina at Chapel Hill, CB #3312, Chapel Hill, North Carolina, 27599,
USA
5National Energy Technology Laboratory, 626 Cochrans Mill Road, Pittsburgh, PA 15236, USA
6Instituto Geofísico del Perú, Calle Badajoz 169, Lima 15012, Peru
RECEIVER FUNCTION METHOD DETAILS
We obtained records of teleseismic direct P-phases (≥5.0 Mw, 30° and 90° distance, 1431
usable station-event pairs), PP-phases (≥6.0 Mw, 90° and 150° distance, 1202 usable station-
event pairs), and PKP-phases (≥6.0 Mw, 110° and 160° distance, 119 usable station-event pairs,
PKP- phase was not used for PeruSE stations as overlapping station coverage provided sufficient
P-, PP-phase arrivals) arrivals from each seismometer for the calculation of teleseismic receiver
functions (Langston, 1979) via the iterative time domain deconvolution technique (Ligorría and
Ammon, 1999) using a Gaussian pulse width of 2.5 (equivalent to a low-pass filter with a corner
frequency of 1.2 Hz). This gave us a total of 2752 receiver functions. In addition we obtained
1Supplemental Material. Additional details on meth-ods and discussion of potential effects of alternate stacking parameters and multiple arrivals. Please visit http:// doi .org /10 .1130 /GES01440 .S1 or the full-text article on www .gsapubs .org to view the Supple-mental Material.

Research Paper
4Bishop et al. | Flat subduction in southern PeruGEOSPHERE | Volume 13 | Number 5
6420
50
100
150
200
Ele
v. (
km)
Dep
th (
km)
14.15°S76.79°W
13.89°S74.86°W
13.62°S72.94°W
13.37°S71.01°W
13.10°S69.09°W
D
2 AB 1
D′
D
6420
50
100
150
200E
lev.
(km
)D
epth
(km
)
15.45°S75.47°W
14.70°S74.32°W
13.95°S73.16°W
13.19°S72.01°W
12.36°S70.74°W
A
21 D
A′
A
6420
50
100
150
200
Ele
v. (
km)
Dep
th (
km)
14.34°S76.08°W
13.58°S74.93°W
12.83°S73.77°W
12.08°S72.62°W
11.32°S71.46°W
B
2D 1
B′
B6420
50
100
150
200
Ele
v. (
km)
Dep
th (
km)
12.29°S77.20°W
11.88°S76.65°W
11.39°S75.99°W
10.90°S75.33°W
10.58°S74.89°W
C
21
C′
C
100 kmFigure 3. Receiver-function common con-version point (CCP) stack profiles. A–A′, B–B′, and C–C′ are trench-perpendicular cross sections from south (A–A′) to north (C–C′). Cross section D–D′ follows a strike parallel to the 5 Ma to 0 Ma average South America plate–Nazca plate convergence vector. Receiver- function CCP stack bin size varies between profiles; line A–A′ uses rectangular bins of 15 km × 25 km; B–B′ uses square 25 km × 25 km bins; C–C′ uses square 15 km × 15 km bins; and line D–D′ uses square 30 km × 30 km bins. All profiles use 1.5× bin sharing. Light-blue lines mark interpreted continental Moho; purple lines mark interpreted subducted oceanic Moho; dashed dark-blue line at western edge of D–D′ marks inferred top of subduc tion channel (see text). Moho and subducted oceanic Moho lines dashed where inferred, approximate location of slab re-steepening based on Scire et al. (2016) and Antonijevic et al. (2015) tomo-graphic imaging of the Nazca Slab while trench-ward features are based on loca-tion of trench, Slab 1.0 megathrust sur-face (Hampel et al., 2004; Hayes et al., 2012). White dots mark slab seismicity from Kumar et al. (2016), while gray dots mark slab and megathrust seismicity from Langer and Spence (1995), projected on to each section from 30 km to each side. Black vertical lines show locations of in-tersecting profiles. Red vertical line marks inter section of profile with projected Nazca Ridge axis; orange vertical lines mark intersection of profile with projec-tion of the edges of the ridge. Blue tri-angles mark location of seismic stations. Surface topography averaged across each profile and six parallel lines spaced at CCP stack bin width.
Research Paper
5Bishop et al. | Flat subduction in southern PeruGEOSPHERE | Volume 13 | Number 5
from these crustal interfaces on the continental Moho and subducted oceanic Moho is presented in our Supplemental Material (see footnote 1) along with examples of intersecting CCP-stack cross sections that have allowed us to bet-ter constrain the continental and subducted oceanic Moho (Figs. S2 and S3). An examination of the potential effects of bin size and sharing is presented in Figure S4. Here we focus on the depth to the continental Moho, the depth to the subducting plate’s Moho, and on the interpretation of these two features combined with previous studies in the region.
INTERPRETATIONS OF CROSS SECTIONS
We first picked the continental Moho and the subducted oceanic Moho on individual CCP stacks by identifying relatively high amplitude, laterally con-tinuous positive arrivals at or near depths predicted by previous work. The continental Moho Ps phase is generally a positive high-amplitude, continuous feature except under the forearc, where mantle hydration weakens and may even locally invert the amplitude (Bostock, 2013). The oceanic Moho Ps phase is more variable in amplitude and becomes difficult to trace inland, but re-cently published slab seismicity locations obtained from analysis of a subset of the seismic stations used in this study (Kumar et al., 2016) have aided us in identifying the top of the slab. We required that the RF arrivals identified as these features match constraints from prior geophysical studies and that these arrivals be laterally continuous between intersecting trench-perpendicular and trench-parallel cross sections (see Figs. S2 and S3 in the Supplemental Mate-rial [footnote 1] for examples of intersecting cross sections). The CCP cross sections in Figures 3 and 4 show our interpreted continental Moho (light-blue lines) and subducted oceanic slab Moho (purple lines) based on our receiver- function results (solid lines) and prior seismic (Hampel et al., 2004; Antonijevic et al., 2015; Kumar et al., 2016; Scire et al., 2016) and gravity (Fukao et al., 1989; Tassara and Echaurren, 2012) studies of the region (dashed lines).
Profile A–A′ (Fig. 3) is a trench-perpendicular cross section located slightly south of the inboard projection of the Nazca Ridge. We observe the continental Moho’s depth (given in depth below sea level) increasing from ~20 km depth at the coastline (where it may coincide with the top of the subduction channel) to more than 60 km depth beneath the WC and undulating between 55 km and 60 km depth beneath the EC and Subandes before gradually reaching less than 50 km depth in the Amazonian foreland. The subducted oceanic Moho of the Nazca plate appears at less than 50 km depth at the coast and dips at a relatively steep angle beneath the forearc to ~80 km beneath the WC before following the variations in the South American continental Moho. This undu-lating structure is consistent both with slab earthquake hypocenter locations (Kumar et al., 2016) and RF-constrained surface-wave results sampling this lo-cation (Ma and Clayton, 2015). The amplitude of the oceanic Moho Ps phase is very high beneath the western portion of the WC and then diminishes abruptly into a low-amplitude phase farther inboard, a characteristic observed on other trench-perpendicular cross sections. We utilize slab earthquake locations and
seismic tomography results to constrain the inboard locations and show the feature with dashed lines where it is poorly constrained (see Supplemental Material [footnote 1] for a discussion of crustal interface multiples that may po-tentially influence the low-amplitude oceanic Moho Ps phase and an example in Fig. S2 [see footnote 1]).
Profile B–B′ (Fig. 3) is a trench-perpendicular cross section located slightly askew to the inboard projection of the Nazca Ridge axis; the vertical red line marks the intersection of the profile and the projection of this axis. The conti-nental Moho signal is very weak or perhaps inverted beneath the forearc and much of the WC, and we show an interpretation consistent with our other cross lines and with offshore data (Hampel et al., 2004). The continental Moho signal increases in strength and depth toward the east, reaching ~50 km depth be-neath the EC and the Subandes. The depth to the continental Moho along this profile is significantly shallower than the continental Moho observed to the south (see profile A–A′) and north (see profile C–C′), where it reaches >60 km depths. Over the ~375 km separating the forearc and western Subandes, the subducted oceanic Moho lies at ~80 km depth, making it the shallowest part of the flat slab. This upwarp of both the continental and oceanic Mohos across the subducted Nazca Ridge is observed most clearly in the along-strike and oblique cross sections described below.
Trench-perpendicular profile C–C′ (Fig. 3) crosses the Andes north of the subducted Nazca Ridge. The continental Moho in the forearc lies at ~45 km depth before increasing to more than 60 km depth beneath both the WC and EC. The gradational character of the forearc Moho arrival may indicate a struc-tural complication or gradual rather than abrupt transition between mantle and crustal velocity materials in this location. Along this profile, the Nazca plate’s subducted oceanic Moho lies at ~60 km depth near the Peruvian coast to ~80 km depth near the edge of the WC. The slab Moho appears discontin-uous under the WC and is offset rapidly from ~80 km to ~110 km depth near the central portion of the WC (see Supplemental Material and Fig. S3 [foot-note 1] for additional details), before flattening for ~225 km inland and then re-steepening beneath the Subandes (Scire et al., 2016). This separation be-tween the South American crust and Nazca plate is several tens of kilometers greater than the separation we observe elsewhere in the region and is located where Antonijevic et al. (2015) hypothesized a trench-parallel slab tear from surface-wave tomography results.
Profile D–D′ (Fig. 3) is oblique to the trench and follows the 5 Ma to 0 Ma av-erage 82° convergence vector between the Nazca–South America plates, and it intersects with the projected axis of the Nazca Ridge (red line) and its southern edge (orange line). Although there is a large gap in coverage at crustal depths in the WC, we include this profile because it clearly shows the shallowing of the continental Moho from depths >60 km south of the Nazca Ridge to <50 km over the ridge. This variation in Moho topography is not reflected in the sur-face elevation along the profile, where the average elevation of the WC and EC remain ~3.5–4 km. In addition, this large variation in Moho depth occurs in a region characterized by relatively uniform Cretaceous to Late Miocene geology and tectonic shortening histories (Oncken et al., 2006; Pfiffner and Gonzalez,

Research Paper
6Bishop et al. | Flat subduction in southern PeruGEOSPHERE | Volume 13 | Number 5
2013), suggesting this variation may relate to the underthrusting of the Nazca Ridge. The slab Moho signal is strong under most of the WC and weakens abruptly under the dense line of stations in the central part of the high cor di-llera. Based on a few slab earthquakes and tomography results, we interpret the slab to remain flat ~180 km beyond the projection of the Nazca Ridge’s southeastern edge, suggesting the subducted ridge may be wider or less linear than the non-subducted portion. Alternately, this may indicate that additional factors are promoting flat-slab subduction in this area. Under the forearc, a large negative arrival near 50 km depth appears to correspond to mega thrust-related earthquakes (gray dots in Fig. 3, Langer and Spence, 1995) and the
down-dip projection of the top of the subducting slab (dashed dark-blue line, Hampel et al., 2004), suggesting this feature marks the top of the slab. If so, the subducted ridge has a crustal thickness of ~20 km, indistinguishable from the non-subducted portion of the oceanic ridge crust within the limits of our resolution and uncertainty.
Profile 1–1′ (Fig. 4) samples the forearc, highlighting the complicated nature of the continental forearc Moho structure in this region. Aside from the area near the intersection of this line with A–A′, the continental Moho ap-pears as a diffuse or low-amplitude arrival that is much weaker than the under-lying subducted slab oceanic Moho. This indicates that the velocity contrast
6420
50
100
150
200
Ele
v. (
km)
Dep
th (
km)
1 1′
11.86°S77.22°W
13.34°S75.81°W
14.81°S74.40°W
16.29°S72.99°W
17.77°S71.58°W
C B D A
11.17°S76.38°W
12.58°S74.89°W
13.82°S73.57°W
15.23°S72.08°W
16.48°S70.76°W
2
B D AC
2′
6420
50
100
150
200
Ele
v. (
km)
Dep
th (
km)
100 km
1
2
Figure 4. Receiver-function common con-version point (CCP) stack profiles. Cross sections 1–1′ and 2–2′ strike approximately perpendicular to the inboard projection of the Nazca Ridge Axis and trench-perpen-dicular cross sections A–A′, B–B′, and C–C′. Both cross sections use square 25 km × 25 km bins and 1.5× bin sharing. Blue vertical line in 1–1′ marks location where Langer and Spence (1995) report strike-slip earthquakes within the subducting Nazca plate (see text). Dashed orange line in 2–2′ marks possible inverted continental Moho and bottom of mantle low-velocity zone possibly related to magmatic arc pro-cesses (see text). All other symbols and topog raphy features as in Figure 3.
Research Paper
7Bishop et al. | Flat subduction in southern PeruGEOSPHERE | Volume 13 | Number 5
between the forearc mantle material and overlying crust in this region may be significantly less than that farther inboard or that the forearc Moho represents a gradational rather than abrupt velocity structure. It is also possible that the high-amplitude negative arrival near 50 km depth along the inboard projection of the Nazca Ridge (area between the orange lines, Fig. 4) marks a location where the continental crust is in direct contact with the underlying subducted oceanic crust. However, this interpretation is difficult to reconcile with mega-thrust coseismic slip depths in this location (e.g., Motagh et al., 2008) and grav-ity-based estimates of forearc Moho depth (e.g., Fukao et al., 1989), which sug-gest separation between the overlying and subducting crust at these depths. This negative arrival approximately corresponds to the area where Dougherty and Clayton (2015) found evidence for a thin (≤3 km), slow-velocity layer lying on top of the slab, which was interpreted as localized hydration of the mantle wedge. The spatial coincidence of our RF negative arrival and Dougherty and Clayton’s (2015) slow layer suggests the RF arrival may mark the top of this layer. We also note that extensive subduction erosion in this region (Clift et al., 2003; Hampel et al., 2004) may have introduced a large amount of near-trench forearc crustal material into the subduction channel at this location, and this may be partly responsible for the complexity of the continental Moho. Finally, we note a set of intra-slab strike-slip earthquakes reported by Langer and Spence (1995) (gray circles surrounding blue line, Fig. 4) with fault strikes trending perpendicular to the trench and at depths within the slab that oc-curred as aftershocks to a mega thrust earthquake. These earthquakes corre-spond to an ~10 km offset in the slab Moho arrival, suggesting that this is a sharp monoclinal fold or zone of faulting that accommodates differential in-board postseismic motion between adjacent segments of the slab.
Profile 2–2′ (Fig. 4) approximately follows the strike of the WC and is nearly perpendicular to the inboard projection of the Nazca Ridge (region between the two orange lines, Fig. 4). The profile’s most prominent feature is a high-ampli tude positive arrival on the northwest side at 60 km depth that drops to 70 km at the projected edge of the Nazca Ridge and then dips down to ~80 km by the profile’s middle. The arrival’s apparent continuity suggests it is a single feature; however, our interpretations along the intersecting profiles C–C′ and B–B′ reveal that this arrival is the continental Moho to the NW of the edge of the Nazca Ridge but is the oceanic Moho under the Nazca Ridge itself. With this interpretation, the continental Moho makes a 10 km step down off the northwestern edge of the Nazca Ridge, and the oceanic Moho “sags” down from 80 km under the ridge to ~100 km under profile C–C′. This interpretation is supported by the relocated slab earthquakes (Kumar et al., 2016) and previous interpretations of a “sag” in the subducted flat slab to the north of the ridge based on long-term seismicity (Gutscher et al., 1999). On this profile, the depth of the South American Moho changes from ~60 km near 11°S to ~50 km depth above the inboard projection of the subducting Nazca Ridge before increasing to ~60 km near 14°S. The absence of a significant topographic change across this boundary suggests the average density structure across this significant change in lithospheric structure must be on average equivalent. In addition, the ~20 km separating the continental and oceanic “Mohos” suggest there is
little to no continental mantle remaining above the subducted Nazca Ridge, consistent with an observed lack of local S-wave splitting along the inboard projection of the ridge (Eakin et al., 2014). Assuming the subducted portion of the ridge’s crust is comparable to the unsubducted portion with 17–20-km-thick oceanic crust, less than ~3 km of continental mantle separates the subducted ridge’s crust and the overriding continental crust.
The rapid change in the subducted oceanic Moho depth from ~80 to ~60 km depth where profile 2–2′ crosses the northwest edge of the Nazca Ridge (left orange line in Fig. 4) suggests the presence of a trench-perpendic-ular lithosphere scale fold or fault in the Nazca plate. This feature is inboard and oriented approximately along the same strike as the intra-slab strike-slip fault Langer and Spence (1995) observed in seismicity patterns that we dis-cussed above in relation to profile 1–1′. This suggests that this feature may be a continuation of the fault system. It is also approximately in line with a possible slab tear or hole hypothesized in the deeper slab based on teleseis-mic tomography (Scire et al., 2016). This suggests that the fault system may control, at least in part, the rapid drop of the flat slab from ~80 km depth along the inboard projection of the Nazca Ridge to ~100 km depth to the northwest.
South of the flat-slab region, we follow slab seismicity (Dougherty and Clayton, 2015; Kumar et al., 2016) and prior tomography results (Scire et al., 2016) to infer the slab’s location. In this area (near 15.23°S), a prominent, paired negative-over-positive arrival appears in the uppermost mantle below the northernmost active arc volcanic center. We associate this with a significant mantle low-velocity zone imaged by surface-wave tomography (e.g., Ma and Clayton, 2014; Ward et al., 2016). We interpret the negative arrival as marking a location where mantle material is significantly slower than the overlying conti-nental crustal material, resulting in an inverted Moho, and the deeper positive arrival as marking the bottom of the low velocity zone. This feature is likely related to active arc processes at this location.
SUMMARY MOHO MAPS
In addition to calculating CCP stack profiles shown in Figures 3 and 4, we also picked the continental and subducted oceanic Moho from a second set of CCP stacks covering the study region in a 25 km × 25 km grid. We then created interpolated maps of the continental Moho (Fig. 5A) and the subducted oce-anic Moho (Fig. 5B) augmented by additional constraints from prior studies. Additional continental Moho constraints are from James and Snoke (1994), McGlashan et al. (2008), Tassara and Echaurren (2012), and Ryan et al. (2016). See Figure S5A in our Supplemental Material (footnote 1) for a map of the Moho constraints and locations used as well as Supplemental Table S12 for latitudes, longitudes, and depths of each constraint. Additional oceanic Moho constraints are augmented by data from Hayes et al. (2012) and Scire et al. (2016). See Supplemental Material Figure S5B (footnote 1) for a map of the slab constraints and locations used as well as Supplemental Table S23 for latitudes, longitudes, and depths of each constraint. We then subtracted the depths to
Lat Long Depth Comment(°S) (°W) (km)
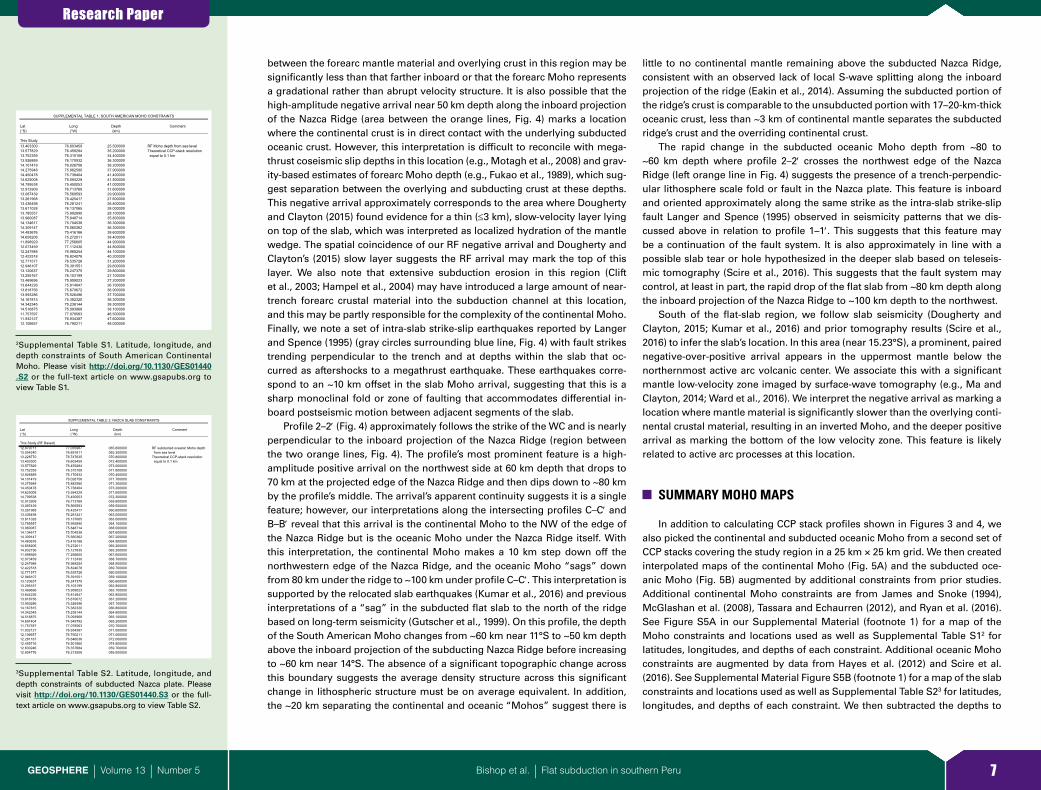
13.403300 76.603459 25.500000 RF Moho depth from sea level13.577829 76.459284 35.200000 Theoretical CCP-stack resolution 13.752359 76.315108 34.400000 equal to 0.1 km13.926889 76.170932 36.30000014.101419 76.026756 38.20000014.275948 75.882580 37.90000014.450478 75.738404 41.40000014.625008 75.594229 41.50000014.799538 75.450053 41.00000012.912909 76.713769 31.60000013.087439 76.569593 29.90000013.261968 76.425417 27.60000013.436498 76.281241 26.80000013.611028 76.137065 28.00000013.785557 75.992890 28.10000013.960087 75.848714 35.80000014.134617 75.704538 36.30000014.309147 75.560362 36.30000014.483676 75.416186 38.60000014.658206 75.272011 38.40000011.898929 77.256605 44.90000012.073459 77.112430 44.80000012.247988 76.968254 44.10000012.422518 76.824078 40.20000012.771577 76.535726 31.20000012.946107 76.391551 29.60000013.120637 76.247375 29.80000013.295167 76.103199 27.10000013.469696 75.959023 27.20000013.644226 75.814847 26.70000013.818756 75.670672 36.90000013.993286 75.526496 37.70000014.167815 75.382320 36.30000014.342345 75.238144 38.30000014.516875 75.093968 38.10000011.757597 77.078563 46.50000011.932127 76.934387 47.60000012.106657 76.790211 48.000000
SUPPLEMENTAL TABLE 1. SOUTH AMERICAN MOHO CONSTRAINTS
This Study
Lat Long Depth Comment(°S) (°W) (km)
12.879711 77.035987 065.600000 RF subducted oceanic Moho depth13.054240 76.891811 065.300000 from sea level13.228770 76.747635 070.800000 Theoretical CCP-stack resolution13.403300 76.603459 072.400000 equal to 0.1 km13.577829 76.459284 073.00000013.752359 76.315108 071.80000013.926889 76.170932 070.40000014.101419 76.026756 071.70000014.275948 75.882580 071.30000014.450478 75.738404 073.20000014.625008 75.594229 071.60000014.799538 75.450053 072.30000012.912909 76.713769 059.80000013.087439 76.569593 059.50000013.261968 76.425417 060.60000013.436498 76.281241 063.00000013.611028 76.137065 063.00000013.785557 75.992890 064.10000013.960087 75.848714 068.00000014.134617 75.704538 067.60000014.309147 75.560362 067.20000014.483676 75.416186 064.90000014.658206 75.272011 065.20000014.832736 75.127835 065.20000011.898929 77.256605 067.60000012.073459 77.112430 068.70000012.247988 76.968254 068.90000012.422518 76.824078 069.70000012.771577 76.535726 060.00000012.946107 76.391551 059.10000013.120637 76.247375 060.60000013.295167 76.103199 062.80000013.469696 75.959023 063.10000013.644226 75.814847 062.80000013.818756 75.670672 067.20000013.993286 75.526496 067.10000014.167815 75.382320 066.80000014.342345 75.238144 064.80000014.516875 75.093968 065.10000014.691404 74.949792 065.20000011.757597 77.078563 070.70000011.932127 76.934387 071.00000012.106657 76.790211 071.00000012.281187 76.646036 072.00000012.455716 76.501860 074.80000012.630246 76.357684 059.70000012.804776 76.213508 059.000000
SUPPLEMENTAL TABLE 2. NAZCA SLAB CONSTRAINTS
This Study (RF Based)
2Supplemental Table S1. Latitude, longitude, and depth constraints of South American Continental Moho. Please visit http:// doi .org /10 .1130 /GES01440 .S2 or the full-text article on www .gsapubs .org to view Table S1.
3Supplemental Table S2. Latitude, longitude, and depth constraints of subducted Nazca plate. Please visit http:// doi .org /10 .1130 /GES01440 .S3 or the full-text article on www .gsapubs .org to view Table S2.

Research Paper
8Bishop et al. | Flat subduction in southern PeruGEOSPHERE | Volume 13 | Number 5
these surfaces to obtain a map showing the separation between the continen-tal and subducted oceanic Mohos (Fig. 5C). All maps have been filtered using a low-pass spatial filter passing spatial wavelengths greater than 650 km and re-jecting wavelengths less than 50 km, with a cosine taper over wavelengths be-tween these two values. We applied this filter to eliminate any features smaller than 50 km × 50 km, which are effectively below the lateral resolution of our
array. The South American continental Moho depth map (Fig. 5A) shows the close correspondence between the shallow Moho beneath the WC (see pro-files D–D′ and 2–2′ above) and the likely location of the subducted Nazca Ridge (region bound by gray lines in Fig. 5A). Here continental Moho depths ~60 km typically associated with the high Andes shallow to ~50 km, strongly suggest-ing that the thick crustal root of the cordillera has been partially displaced by
80°W 78°W 76°W 74°W 72°W 70°W
A
N
50 k
m
50 km 40 km
60 km
60 km
70 km
100 km
C
20 km40 km
60 km
80 km
80°W 78°W 76°W 74°W 72°W 70°W
?
????Tear
80°W 78°W 76°W 74°W 72°W 70°W18°S
16°S
14°S
12°S
10°S
Slab Offset
B
80 km
100 km
Curre
nt R
idge
~4 M
a Ridg
e
Fitzcarrald Arch
18°S
16°S
14°S
12°S
10°SD
80°W 78°W 76°W 74°W 72°W 70°W
0.00
0.25
0.50
1.00
1.50
2.00
3.00
3.75
4.50
5.00
Elevation (km)
80706050403020100
Separation (km)
Velocity Perturbation ( Vs)
–9% 9%0%0.00
0.25
0.50
1.00
1.50
2.00
3.00
3.75
4.50
5.00
Elevation (km)
Figure 5. Maps showing our results. Map symbols in A, B, and C are the same as in Figure 1. (A) Moho depth map of the South American continental Moho incorporating receiver- function (RF) constraints (CAUGHT stations not in-cluded in Fig. 1) from this study and Ryan et al. (2016) along with additional seismic constraints (James and Snoke, 1994; McGlashan et al., 2008) and gravity constraints from Tassara and Echaurren (2012) (see Fig. S2A [footnote 1] for locations of constraint on these features). Solid contours mark 10-km-depth increments, dashed contours mark 5 km increments. (B) Slab depth contour map for subducted Nazca plate to 130 km depth overlain on S-wave teleseismic tomography results from Scire et al. (2016) (130-km-depth slice). Slab Moho contours between 50 and 110 km depth are from our RF study; contours <~50 km are based on slab seismicity (Hayes et al., 2012) and contours >~110 km are based on slab seismicity (Dougherty and Clayton, 2015; Kumar et al., 2016) and tomography (Scire et al., 2016). Slab tear marked by white solid line seen in RF profile C–C′ (Fig. 3), slab offset seen in profile 1–1′ (Fig. 3); tear feature to northeast presented in Scire et al. (2016). See text for discussion. (C) Separation between South American con-tinental Moho shown in A and subducted Nazca oceanic Moho shown in B. Solid and dashed contours alternate marking 10 km increments. Note that active volcanic cen-ters terminate near the 40 km contour. The area of least separation between the continental Moho and slab Moho occurs well inboard of the trench and extends south of the inland projection of the southeastern edge of the Nazca Ridge. (D) Simplified outline of shallowest segment of flat slab and present location of Nazca Ridge (transparent blue) and location of same features (transparent orange) at 4 Ma following Hampel (2002) convergence vector plate recon-struction. Red arrow shows motion of the northeastern end of the shallow segment over the past 4 m.y. Black contours are continental Moho as in Figure 5A. Present position of shallow segment links the current position of the sub-ducting Nazca Ridge to the southwestern most part of the Fitzcarrald Arch and taken together with the ridge’s migra-tion history suggest the shallow segment of the subducted Nazca plate passed directly through the region of South American continental crust with a shallow continental Moho (see text for discussion).

Research Paper
9Bishop et al. | Flat subduction in southern PeruGEOSPHERE | Volume 13 | Number 5
the subducting ridge. This location also corresponds to the shallowest section of flat subduction and may relate to the subduction of the main body of the over-thickened Nazca Ridge. The southeastern edge of the ridge is likely to correspond to the increase in continental Moho depth to >60 km. This depth increase may partially reflect the eastward displacement of crustal material as ridge subduction progresses.
Compilation of our subducting slab depth map (Fig. 5B) is complicated by differing criteria used by different authors to determine slab depth. In the re-gion sampled by our array, we have used the subducted oceanic Moho from our RF results to constrain slab depth. In this region, the top of the slab itself is likely to be ~8 to ~20 km above the mapped slab Moho depth. In the areas outside our array coverage, we have used Slab1.0 (Hayes et al., 2012) to define the slab above 95 km and seismicity (Dougherty and Clayton, 2015; Kumar et al., 2016) along with tomography-based contours (Scire et al., 2016) to de-fine the slab below 95 km depth. Both Hayes et al. (2012) and Scire et al. (2016) use different criteria to define their slab locations (slab surface and center of high-velocity slab anomaly, respectively). To reduce potential artifacts result-ing from the incorporation of these disparate data sets, we maintained a gap of at least 25 km where the data sets gave differing values, allowing for a gradual shift between what are presumably nearly parallel surfaces in the subducting plate. We further avoid interpretation of the slab Moho surface near the edge of individual data sets (especially the rapid re-steepening of the surface to the east) and focus on only large-scale features. For the locations of the slab-depth constraints used in the calculations of Figure 5B, see Supplemental Figure S5B (footnote 1).
We also note the similarity of our slab contours at and below 90 km depth to those determined independently by Antonijevic et al. (2015) using surface-wave tomography and slab earthquake locations. Differences above 90 km depth likely reflect greater vertical resolution by receiver functions than that possible with surface-wave tomography. The southeastern corner to the flat slab, in a region well sampled by our array, extends well beyond the south-ern margin of the Nazca Ridge projection and directly above a prominent sub-slab low-velocity zone image at 130 km depth by teleseismic S-wave tomog-raphy (Fig. 5B) (Scire et al., 2016) and surface-wave tomography (Antonijevic et al., 2016). These low velocities could be produced by increased temperature, the presence of partial melt, and/or the presence of hydrous phases, imply-ing that more buoyant material is present in this area than in the surrounding mantle (Antonijevic et al., 2016; Scire et al., 2016). The correspondence be-tween the 100- and 120-km contours and the edge of the low-velocity anomaly is consistent with the southern margin of the flat slab being partially supported by this material. We further note that this location corresponds to an area of complicated mantle anisotropy identified in shear-wave splitting results; this area contrasts with observations immediately to the north and south of the ridge (Eakin et al., 2015), further indicating the mantle beneath the subducted ridge is distinct from other parts of the upper mantle.
The slab, where it re-steepens to the southeast, appears to be continuous despite the rapid change in slab dip. This contrasts with the behavior we ob-
serve northwest of the Nazca Ridge where smaller changes in slab dip are associated with a clear down-drop of the slab from 70 km to 100 km depth. A trench-perpendicular fold or fault zone, imaged by our RFs at ~80 km depth, which may develop into a slab tear at 120 km to 300 km depth as imaged by teleseismic tomography (Scire et al., 2016), accommodates this down-drop. This feature intersects a second, trench-parallel apparent offset that we image on profile C–C′ at the same location as Antonijevic et al. (2015) inferred a tear from surface-wave tomography. This offset corresponds to the southern mar-gin of the “sag” in the flat slab proposed by Gutscher et al. (1999). These pro-posed tears and/or faults would allow the continuation of flat subduction NW of the subducted Nazca Ridge, but at a depth >20 km deeper than along the ridge itself. While our observations are consistent with the “sag” feature of Gutscher et al. (1999), we lack the coverage to test for the hypothesized “Lost Inca Plateau,” which Gutscher et al. (1999) proposed as a second, buoyant subducted oceanic feature to explain the northern segment of the Peruvian flat slab.
Figure 5C shows a map of the separation between the South American continental Moho and the slab Moho based on the previous maps. The sub-ducted ridge requires a minimum of ~17 km of separation between these two surfaces to accommodate the over-thickened oceanic crust. This suggests that the southern edge of the ridge is in contact with the overriding continental crust, consistent with a comparison of the continental Moho contours and the 70 km and 80 km slab Moho contours (Fig. 5D). These slab contours closely follow the complex geometry of the continental Moho, suggesting coupling between the two features. Figure 5D also shows the present position of the Nazca Ridge in blue and the simplified outline of the <80 km depth segment of the flat slab (transparent blue) and the position of the ridge and this <80 km depth segment at ca. 4 Ma (transparent orange). Assuming that the shallowest part of the observed flat slab, characterized by a subducted oceanic Moho lying at <80 km depth, has remained at this depth or shallower over the past 4 m.y., we find an interesting relationship between the shallow slab and the overrid-ing continental crust. Figure 5D indicates that this shallow segment passed directly beneath the region of the WC and EC with anomalously thin crust. We return to this possibility later in the following discussion.
DISCUSSION
Our results have important implications for the possible explanation for flat-slab subduction and its effects on the overriding plate. We suggest that continued flat subduction in central Peru, while related to the subducting Nazca Ridge, cannot be solely attributed to buoyancy of the ridge’s compara-tively thick crust and is likely to be associated with additional buoyancy from mantle anomalies below or within the subducted Nazca plate. We also suggest that the near-horizontal subducting ridge has significantly thinned both the South American lithospheric mantle and the South American crust. We discuss these major results below.
Research Paper
10Bishop et al. | Flat subduction in southern PeruGEOSPHERE | Volume 13 | Number 5
Causes of Flat-Slab Subduction in Southern Peru
Numerical and analogue modeling of flat-slab subduction (e.g., van Hunen et al., 2002a; Martinod et al., 2005; Espurt et al., 2008; Currie and Beaumont, 2011; Manea et al., 2012) has repeatedly shown that over-thickened oceanic crust is insufficient to account for flat-slab subduction extending for >300 km from the trench without the contribution of factors related to the overriding plate. Exceptions to this (e.g., van Hunen et al., 2004; Arrial and Billen, 2013) require a significantly delayed basalt-to-eclogite conversion of the subducting crust—a proposition that is readily testable through the relative amplitude of Ps conver-sions from the subducted oceanic Moho recorded in RFs and directly analogous to the interpretation of changing subducted oceanic Moho seismic character discussed by Rondenay et al. (2008) in Cascadia and Alaska. The strong velocity contrast between basaltic crust and the underlying mantle lithosphere of the oceanic plate should produce a high-amplitude Ps conversion. This contrast would be increased if the crust is hydrated and the mantle was relatively dry, as proposed for the lithosphere under the thick crust of the Nazca Ridge where the ridge remains seismically active (Kumar et al., 2016). A crust with a significant eclogitized component should have a much weaker velocity contrast with the underlying mantle lithosphere, yielding a lower amplitude Ps conversion.
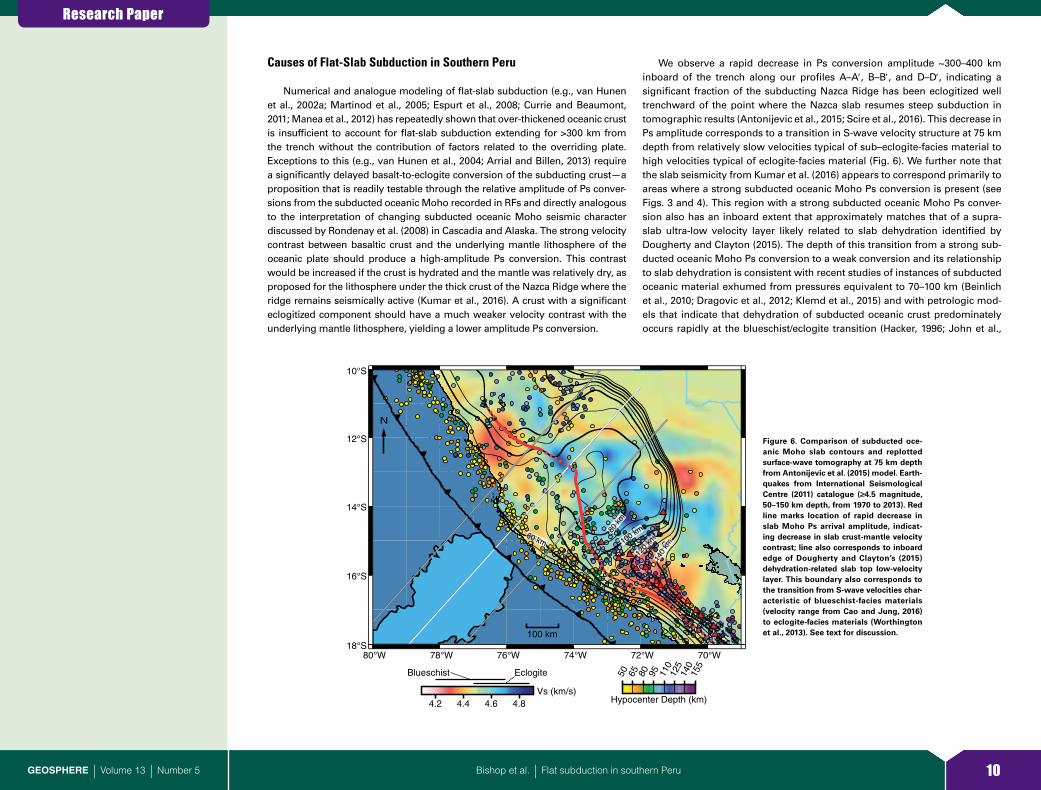
We observe a rapid decrease in Ps conversion amplitude ~300–400 km inboard of the trench along our profiles A–A′, B–B′, and D–D′, indicating a significant fraction of the subducting Nazca Ridge has been eclogitized well trenchward of the point where the Nazca slab resumes steep subduction in tomographic results (Antonijevic et al., 2015; Scire et al., 2016). This decrease in Ps amplitude corresponds to a transition in S-wave velocity structure at 75 km depth from relatively slow velocities typical of sub–eclogite-facies material to high velocities typical of eclogite-facies material (Fig. 6). We further note that the slab seismicity from Kumar et al. (2016) appears to correspond primarily to areas where a strong subducted oceanic Moho Ps conversion is present (see Figs. 3 and 4). This region with a strong subducted oceanic Moho Ps conver-sion also has an inboard extent that approximately matches that of a supra- slab ultra-low velocity layer likely related to slab dehydration identified by Dougherty and Clayton (2015). The depth of this transition from a strong sub-ducted oceanic Moho Ps conversion to a weak conversion and its relationship to slab dehydration is consistent with recent studies of instances of subducted oceanic material exhumed from pressures equivalent to 70–100 km (Beinlich et al., 2010; Dragovic et al., 2012; Klemd et al., 2015) and with petrologic mod-els that indicate that dehydration of subducted oceanic crust predominately occurs rapidly at the blueschist/eclogite transition (Hacker, 1996; John et al.,
80°W 78°W 76°W 74°W 72°W 70°W18°S
16°S
14°S
12°S
10°S
Vs (km/s)4.2 4.4 4.6 4.8
Blueschist Eclogite 50 65 80 95 110
125
140
155
Hypocenter Depth (km)
N
100 km
80 k
m
60 km 100 km
120
km
140
km
Figure 6. Comparison of subducted oce-anic Moho slab contours and replotted surface-wave tomography at 75 km depth from Antonijevic et al. (2015) model. Earth-quakes from International Seismological Centre (2011) catalogue (≥4.5 magnitude, 50–150 km depth, from 1970 to 2013). Red line marks location of rapid decrease in slab Moho Ps arrival amplitude, indicat-ing decrease in slab crust-mantle velocity contrast; line also corresponds to inboard edge of Dougherty and Clayton’s (2015) dehydration-related slab top low-velocity layer. This boundary also corresponds to the transition from S-wave velocities char-acteristic of blueschist-facies materials (velocity range from Cao and Jung, 2016) to eclogite-facies materials (Worthington et al., 2013). See text for discussion.

Research Paper
11Bishop et al. | Flat subduction in southern PeruGEOSPHERE | Volume 13 | Number 5
2012; Baxter and Caddick, 2013). This interpretation is also consistent with the inference by Kumar et al. (2016) that the rapid decrease in slab seismicity in the Peruvian flat slab in the vicinity of the subducted Nazca Ridge is a re-sult of the ridge’s subducted oceanic crust largely being dehydrated by 80 km depth. Our results suggest that numerical models of flat slabs that model a rapid eclogite transition occurring 300 km to 350 km from the trench (e.g., van Hunen et al., 2002a; Currie and Beaumont, 2011) are an accurate representation of the processes occurring within the Peruvian flat slab.
In Figure 6, we summarize the relationship between this “eclogitization front,” the slab Moho contours, long-term (>40 year) patterns of slab seismicity from the International Seismological Centre (2011) catalogue (note similarity to patterns shown in Fig. 2 from short-term (~2.5 years) seismicity relocated using local arrays), and the S-wave velocity structure at 75 km depth from surface-wave tomography (Antonijevic et al., 2015). Two important relation-ships are revealed in Figure 6. First, the shallowest part (<80 km depth) of the flat slab resides roughly between the projected locations of the edges of the subducted Nazca Ridge and extends ~500 km inboard of the trench. While the precise shape and size of the subducted portion of the Nazca Ridge cannot be known with certainty, reconstructions (e.g., Hampel, 2002; Rosenbaum et al., 2005) indicate that as the ridge formed at the intersection of the Easter-Salas Hotspot and the East Pacific Rise, the Tuamotu Plateau is likely the Nazca Ridge’s conjugate and of comparable size. Given the size and position of the Tuamotu Plateau relative to the East Pacific Rise and given plate motion recon-structions, the present-day location of the end of the subducted Nazca Ridge is likely located ~400–500 km farther down-dip in the slab (Hampel, 2002) than the present inboard limit of flat subduction. This suggests that much of the ridge has been subducted and is presently located within the section of the slab that descends nearly vertically into the mantle (Scire et al., 2016). Second, the flat segment extends several hundred kilometers beyond the eclogitization front, indicating that additional forces (in addition to the positive buoyancy of the subducted oceanic crust) must be acting to maintain the flat geometry. Both our observations and those of Ma and Clayton (2015) using a similar data set show that some of the shallowest segments of the flat slab occur along the projection of the Nazca Ridge beyond 350 km from the trench in the area with at least partially eclogitized oceanic crust. Additionally, the southern edge of the flat slab appears to extend farther south than the projected southern edge of the ridge. While numerical models of flat subduction incorporating ac-tive over-thrusting of the overriding plate (van Hunen et al., 2002a; Currie and Beaumont, 2011) suggest that over-thrusting can promote flat-slab subduction, the correspondence of the shallowest inboard part of the flat slab to the Nazca Ridge and a region of slow S-wave velocities in the mantle immediately be-neath the shallow flat slab (Fig. 5B) suggest that a second source of buoyancy may also be acting on the slab, in addition to any dynamic effects, in agree-ment with findings by Antonijevic et al. (2016). The origin of this low-velocity feature remains unclear (Antonijevic et al., 2016; Scire et al., 2016).
While this sub-slab, low-velocity feature’s origin is unknown, our observa-tions and those of prior studies allow us to better understand its present-day
relationship with the flat slab. Comparison of our subducted oceanic Moho depth over this region (~80 km) and the most intense negative velocity anom-aly in tomographic results (concentrated between ~100 and 200 km though po-tentially extending to ~400 km depth; Antonijevic et al., 2016; Scire et al., 2016) indicates that it is separated from the oceanic crust by at least 20–30 km of high-velocity slab lithosphere. This indicates the anomaly is unlikely to be due to hydration-related serpentinization of the slab’s lithosphere, a mechanism invoked for other flat-slab occurrences (e.g., Kopp et al., 2004). Our observa-tions support the interpretation of this feature as a region of anomalously hot mantle material (Antonijevic et al., 2016; Scire et al. 2016) or a portion of the mantle containing melt (Antonijevic et al., 2016). Calculations by Antonijevic et al. (2016) indicate the low-velocity material can be explained by a mantle temperature anomaly of 200 °C or the presence of at least 1% partial melt. We emphasize that either possibility would decrease the density of mantle beneath this segment of the flat slab, helping to promote continued flat subduction.
The existence of complicated shear-wave splitting anisotropy in the mantle along the projection of the ridge (Eakin et al., 2015) further indicates that man-tle beneath the ridge differs significantly from that to the north or south. Based on this correlation, we suggest that low-velocity, low-density upper mantle be-neath the ridge may be a contributing factor to its continued buoyancy, some-what analogous to other low-density mantle anomalies observed along the Juan Fernandez Ridge and associated Sierra Pampeanas flat slab (e.g., Kopp et al., 2004; Porter et al., 2012), though affecting the base of the oceanic litho-spheric mantle rather than its top.
There are two end-member possibilities for the geodynamic evolution of this flat-slab geometry. One is that the flat geometry is initiated as soon as the ridge enters the subduction zone as implicitly assumed in Hampel (2002), Rosenbaum et al. (2005), and others. The other possibility is that the leading segment of the ridge is subducted at a normal angle until a sufficient volume of buoyant crust (or mantle) is subducted to compensate for the negative buoy-ancy of the lower part of the slab (Espurt et al., 2008). In the case of southern Peru, plate reconstructions show the ridge entered the trench ca. 11 Ma (Fig. 1) but the volcanic arc was not extinguished until 4 Ma (Rosenbaum et al., 2005), a delay of 7 m.y. between the initial subduction of the buoyant ridge and the formation of flat subduction under the arc that is consistent with the analogue modeling studies of Espurt et al. (2008) and numerical modeling studies by Hu et al. (2016). We have used the 5–0 Ma average convergence rate of 8.5 cm/yr (Somoza and Ghidella, 2012) to restore the approximate position of what is now the 80-km-depth contour of the Nazca subducted oceanic Moho to its po-sition at ca. 4 Ma (orange transparency in Fig. 5D). Assuming that the slab material represented by this contour has remained at <80 km depth since its subduction, we find that this shallow feature should have lain directly below the WC volcanic arc, indicating that it is likely associated with the final clo-sure of the volcanic arc mantle wedge ca. 4 Ma. This association suggests that the current inboard hinge separating flat and steep slab subduction has progressed inboard since the full establishment of flat subduction at ca. 4 Ma with little re-steepening within the flat segment itself.
Research Paper
12Bishop et al. | Flat subduction in southern PeruGEOSPHERE | Volume 13 | Number 5
Coupling of the Nazca and South American Plates
The shallow depth of the subducted Nazca Ridge and the corresponding deep continental Moho, especially to the southeast of the ridge (see Fig. 5), suggest that strong mechanical coupling occurs between the Nazca and South American plates. The WC and EC southeast of the ridge are characterized by a number of short-wavelength changes of >5 km in Moho depth (see Fig. 5A). Variations on this scale over such short lateral distances are difficult to attribute to variations in crustal thickening due to variations in structural shortening amounts, which occur over a much larger spatial wavelength in this region (Oncken et al., 2006; Pfiffner and Gonzalez, 2013), or to variations in mag-matic addition, as these features include areas free of Cenozoic arc volcanism (Rosenbaum et al., 2005; Mamani et al., 2010). These changes in Moho depth appear to interlock with changes in the depth to the subducted slab oceanic Moho (see Fig. 5B). The correspondence of these slab and continental features leads to the remarkably uniform, <20 km separation between the continental and oceanic Mohos in this area (see Fig. 5C), suggesting the overriding conti-nental crust and subducting slab have deformed one another. When combined with the arch-like structure apparent in the continental Moho directly above the shallowest part of the flat slab (discussed in detail in the subsequent two sections), we take this as evidence for significant displacement of upper-plate material, and by extension, we infer strong mechanical coupling of the plates in response to the subduction of the Nazca Ridge.
The shallow depth and potential mechanical coupling in this portion of the Peruvian flat slab contrast with some other modern flat-slab occurrences where the subducting plate lies well below the continental Moho, as in Chile (e.g., Porter et al., 2012), or a weak layer separates the plates, preventing sig-nificant coupling, as in Mexico (e.g., Kim et al., 2012). In central Peru, however, a number of observations suggest that strong coupling occurs between the two plates along the southern edge of the subducted Nazca Ridge. These ob-servations include coseismic slip to 75 km depth associated with a 1996–1997 earthquake sequence (Spence et al., 1999), increased subduction erosion along the trench removing on the order of 100 km of the forearc (e.g., Clift et al., 2003; Hampel et al., 2004), and vertical uplift of the Peruvian forearc both near the trench (Hagen and Moberly, 1994) and inland of the present shoreline (e.g., Macharé and Ortlieb, 1992; le Roux et al., 2000; Wipf et al., 2008; Saillard et al., 2011). To further understand this coupling, we examine its effects on the litho-spheric mantle and lower crust of the upper plate in more detail.
Effects of Flat-Slab Subduction on the Upper Plate
Displacement of the Continental Lithospheric Mantle
The thick (>50 to ~60 km) continental crust beneath the WC and EC that overlies the subducted oceanic Moho of the Nazca Ridge observed at 70–80 km depth leaves little room for continental mantle lithosphere. Assuming the
crustal thickness of the subducted ridge is comparable to the 17–20 km thick-ness of its unsubducted equivalent (Hampel et al., 2004; Tassara et al., 2006), less than 3 km of continental mantle lithosphere may separate these features. Crustal shortening estimates for the WC and EC of ~30% for the Cretaceous through Cenozoic (Pfiffner and Gonzalez, 2013) would require proportional thickening of the mantle lithosphere. The present configuration of the sub-ducted slab and overriding continental crust requires that much of the South American mantle lithosphere has been thinned prior to, or as a consequence of, ridge subduction. Thinning as a consequence of ridge subduction is consis-tent with shear-wave splitting for local S events and indicates that the subduct-ing ridge actively deforms the mantle lithosphere as it moves with respect to South America (Eakin et al., 2014). These lines of evidence suggest the removal of a significant part of the mantle lithosphere is a response to ridge subduction in central Peru. The inboard extent of this removal is difficult to constrain; how-ever, given both the thinning of the South American crust near the Shira Uplift in the Subandes (James and Snoke, 1994) and the re-steepening of the Nazca slab near 71°W (Scire et al., 2016), it is possible that the lithospheric mantle remains thicker beneath the Subandes and Fitzcarrald Arch.
Displacement of WC and EC Crust along the Subducted Nazca Ridge
With the exception of the region along the projected axis of the subducting Nazca Ridge, we find that the South American Moho beneath the WC and EC extends to depths greater than 55 km and locally to depths greater than 65 km. These Moho depths are similar to those reported for the central to northern Altiplano immediately to the south (e.g., Dorbath et al., 1993; Tassara et al., 2006; McGlashan et al., 2008; Phillips et al., 2012; Ryan et al., 2016) and some-what surprising given the differences in tectonic shortening between the two regions (~120 km to ~150 km for central Peru [Gotberg et al., 2010; Pfiffner and Gonzalez, 2013] versus up to ~250 km for the central Altiplano [e.g., Oncken et al., 2006]). The similarity in Moho depth despite differing shortening histo-ries may support models in which crustal flow moves material from the Alti-plano to the regions to the north (e.g., Kley and Monaldi, 1998; Gotberg et al., 2010) or those that reflect the effects of regional variations in magmatic addi-tion (e.g., Mamani et al., 2010; Chapman et al., 2015).
It is interesting to note that the one location where we find significant dis-agreement between the gravity-derived Moho of Tassara et al. (2006) and the seismically observed Mohos reported by both Lloyd et al. (2010) and in our own results occurs directly over the shallowest part of the flat slab. Both our results and larger patterns in continental crustal thickness observed by Lloyd et al. (2010) indicate the continental Moho is much shallower (by ~20 km) near 13°S, 75°W (see decrease in Moho depth beneath WC and EC in Fig. 5C) than the calculation by Tassara et al. (2006) from gravity data (prior to the availabil-ity of regional seismic constraints). This location marks both the intersection of the projected axis of the subducting Nazca Ridge, where we observe the subducted oceanic Moho of the Nazca plate at depths of less than 75 km, and

Research Paper
13Bishop et al. | Flat subduction in southern PeruGEOSPHERE | Volume 13 | Number 5
the high elevations of the WC and EC. We suggest that the unexpectedly shal-low slab combined with the unusually thick oceanic crust of the subducting ridge may have complicated interpretation of the gravity data at this location.
The migration history of the tip of the Nazca Ridge over the past 10 m.y., based on the plate reconstruction of the mirror image of the Tuamoto Pla-teau (Fig. 1) (Hampel, 2002; Rosenbaum et al., 2005), suggests an apparent kinematic problem with the formation of this crustal arch: if the Nazca Ridge produced flat subduction immediately upon entering the subduction zone, it should have passed at an equally shallow depth to the north, where crust >60 km thick remains (Fig. 5). We have already discussed the possibility that this apparent conflict is due to a delay in the start of flat subduction following initial subduction of the ridge. Alternately, progressive development of fault-ing and tearing along the northern edge of the ridge may have reduced the downward force exerted on the ridge by the rest of the slab and allowed this segment to shallow. This alternative is somewhat less likely given the continu-ity of the slab observed to the east and southeast (Schneider and Sacks, 1987; Phillips and Clayton, 2014; Dougherty and Clayton, 2015; Scire et al., 2016), in the overall plate subduction direction, that would be the dominant sources of downward slab pull.
While we prefer the scenario presented above to explain the relationship between the overriding continental crustal structure and the subducting ridge, we are unable to conclusively rule out two other possibilities that could also account for thicker crust north of the subducting ridge: (1) re-thickening of crust north of the ridge via crustal flow or (2) crustal underplating of material tec-tonically eroded from the near-trench forearc. High temperatures in the lower continental crust (~1000 °C at 40 km depth) have been reported immediately south of the subducting ridge (Chapman et al., 2015). These temperatures are sufficiently high to induce the formation of partial melt in the middle to lower crust (Clark et al., 2011) and above temperatures necessary to induce ductile flow (Jamieson and Beaumont, 2013). This raises the possibility that ductile flow at mid-crustal levels may have supplied a path for material to pass over the shallowly subducting slab and fill in the region to the north as the ridge migrates. This requires that the crust of the overriding plate remained at a high temperature following the onset of flat subduction. This requirement may be fulfilled; numerical models incorporating temporal transitions from normal to flat subduction (van Hunen et al., 2002a, 2002b; Arrial and Billen, 2013) indi-cate the crust of the upper plate above a flat slab may cool only slightly even >10 m.y. after the onset of flat subduction. Alternately, material may have been available to re-thicken the continental crust north of the ridge through under-plating of tectonically eroded forearc materials. Significant forearc subduction erosion has been documented to the north of the Nazca Ridge (Clift et al., 2003; Hampel et al., 2004) and dated to a period following subduction of the ridge. This tectonically eroded material may have allowed extensive underplating to occur north of the ridge.
Although both of these mechanisms may be possible explanations for the presence of thick continental crust north of the subducting Nazca Ridge, they require processes that are not yet documented in central Peru and are more
complicated than our preferred model, in which the ridge only begins to affect the continental crust at ca. 4 Ma when the mantle wedge is finally closed and volcanism ceases in this region (Rosenbaum et al., 2005). We also note that all four mechanisms discussed above require the modification of the conti-nental crust by the subducting Nazca Ridge and strong coupling between the two plates.
CONCLUSIONS
We have used CCP receiver function analysis and prior geophysical studies to constrain the depth to both the South American plate’s continental Moho and the Nazca plate’s subducted oceanic Moho in the southern segment of the Peruvian flat slab. The schematic plate-scale 3D model for the region in Figure 7 shows what we find to be the key features of the southern segment of the Peruvian flat slab. In this trench-parallel view, the subducted oceanic Moho of the Nazca slab is very close to the base of the continental crust, leaving very little room for continental mantle lithosphere between the two. Specifically, the oceanic Moho is separated from the overriding continental crust by less than 40 km, and locally less than 20 km. Given the 17–20 km thickness of the Nazca Ridge’s crust, less than 3 km of mantle lithosphere may locally separate the subducted Nazca Ridge and the base of the overriding continental crust. The thickness of the continental crust varies significantly over the subducted
South Americancrust
Sub-ridgelow velocity mantle
Subducted Nazca crust
Subducted Nazca mantle
Figure 7. Schematic 3D model of the Nazca Ridge’s subduction in central Peru. This is a trench-parallel view based primarily on cross section 2–2′ in Figure 4. Continental crust (light blue) beneath the high cordilleras is gen-erally separated from the subducted oceanic crust of the Nazca plate (dark blue), but thinned due to deformation caused by the shallow subduction of the Nazca Ridge’s comparatively thick crust. The continental lithospheric mantle is not shown for clarity but generally occupies the space between the continental crust and subducted oceanic crust. The subducted oceanic crust is separated by the lithospheric mantle of the subducting plate ( purple) from low-velocity material (orange to light orange) located beneath the sub-ducting Nazca Ridge. This low-velocity material is likely to be relatively low density due to thermal (including partial melt) or compositional effects.

Research Paper
14Bishop et al. | Flat subduction in southern PeruGEOSPHERE | Volume 13 | Number 5
Nazca Ridge, suggesting that the ongoing subduction of the Nazca Ridge has driven deformation of the continental crust of the Western and Eastern Cor di-lleras, thinning it by ~5–10 km. This thinning may have displaced lower-crustal material to the southeast of the ridge, locally causing thickening in advance of the ridge. This clear thinning and possible displacement indicates that the subducting and overriding plates are strongly mechanically coupled around the subducting ridge.
Our results show that the shallowest part of the flat slab corresponds to the inboard projection of the Nazca Ridge and extends considerably inboard of the blueschist-to-eclogite transition of the ridge’s over-thickened crust. This indicates that an additional source of buoyancy is required to support the flat slab; this support may be provided in part by a body of thermally or composi-tionally (partial melt) buoyant sub-slab mantle material beneath the flat slab, consistent with low seismic velocities observed previously in the region. The origin of this buoyant material is unclear; however, the >30 km separation be-tween the observed slab Moho and this buoyant material suggests it is present deep within the slab’s lithospheric mantle or in the underlying asthenosphere and is not a product of hydration and serpentinization at the base of the Nazca oceanic crust. These results may provide further insights for interpreting past flat subduction episodes such as the Laramide event in the western United States and introduce additional parameters to investigate in numerical model-ing studies of flat subduction.
ACKNOWLEDGMENTS
This work was supported by National Science Foundation grants EAR-0943991, EAR-0907880, EAR-1415914, EAR-0943962, and EAR-0944184. B. Bishop was also supported by: University of Ari-zona Graduate College Scholarship, Sumner Scholarship, BP General Scholarship, Galileo Circle Scholarship, and Chevron-Texaco Geology Fellowship. We also thank the following individuals and organizations: CAUGHT/PULSE instrumentation by the Incorporated Research Institutions for Seismology (IRIS) through the PASSCAL Instrument Center; CAUGHT/PULSE station installa-tion, maintenance by Cristóbal Condori and other IGP members, Oak Rankin, along with partici-pants from University of Arizona, University of North Carolina at Chapel Hill, Yale University, and PASSCAL; data set management by PASSCAL and data set retrieval by the IRIS Data Management System; and Rob Clayton and Paul Davis for early access to eight stations of the PeruSE network. We also thank Shanaka de Silva and two anonymous reviewers for their comments and sugges-tions that have greatly helped us to improve this manuscript.
REFERENCES CITED
Antonijevic, S.K., Wagner, L.S., Kumar, A., Beck, S.L., Long, M.D., Zandt, G., Tavera, H., and Con-dori, C., 2015, The role of ridges in the formation and longevity of flat slabs: Nature, v. 524, p. 212–215, doi: 10 .1038 /nature14648 .
Antonijevic, S.K., Wagner, L.S., Beck, S.L., Long, M.D., and Tavera, H., 2016, Effects of change in slab geometry on the mantle flow and slab fabric in southern Peru: Journal of Geophysical Research. Solid Earth, v. 121, p. 7252–7270, doi: 10 .1002 /2016JB013064 .
Arrial, P.-A., and Billen, M.I., 2013, Influence of geometry and eclogitization on oceanic plateau subduction: Earth and Planetary Science Letters, v. 363, p. 34–43, doi: 10 .1016 /j .epsl .2012 .12 .011 .
Barazangi, M., and Isacks, B.L., 1976, Spatial distribution of earthquakes and subduction of the Nazca plate beneath South America: Geology, v. 4, no. 11, p. 686–692, doi: 10 .1130 /0091 -7613 (1976)4 <686: SDOEAS>2 .0 .CO;2 .
Baxter, E.F., and Caddick, M.J., 2013, Garnet growth as a proxy for progressive subduction zone dehydration: Geology, v. 41, no. 6, p. 643–646, doi: 10 .1130 /G34004 .1 .
Beck, S., Zandt, G., and Wagner, L., 2010, Central Andean uplift and the geodynamics of high topog raphy (dataset): International Federation of Digital Seismograph Networks, doi: 10 .7914 /SN /ZG_2010 .
Beinlich, A., Klemd, R., John, T., and Jun, G., 2010, Trace-element mobilization during Ca-meta-somatism along a major fluid conduit: Eclogitization of blueschist as a consequence of fluid- rock interaction: Geochimica et Cosmochimica Acta, v. 74, p. 1892–1922, doi: 10 .1016 /j .gca .2009 .12 .011 .
Bostock, M.G., 2013, The Moho in subduction zones: Tectonophysics, v. 609, p. 547–557, doi: 10 .1016 /j .tecto .2012 .07 .007 .
Cao, Y., and Jung, H., 2016, Seismic properties of subducting oceanic crust: Constraints from natural lawsonite-bearing blueschist and eclogite in Sivrihisar Massif, Turkey: Physics of the Earth and Planetary Interiors, v. 250, p. 12–30, doi: 10 .1016 /j .pepi .2015 .10 .003 .
Carlotto, V., 2013, Paleogeographic and tectonic controls on the evolution of Cenozoic basins in the Altiplano and Western Cordillera of southern Peru: Tectonophysics, v. 589, p. 195–219, doi: 10 .1016 /j .tecto .2013 .01 .002 .
Chapman, A.D., Ducea, M.N., McQuarrie, N., Coble, M., Petrescu, L., and Hoffman, D., 2015, Constraints on plateau architecture and assembly from deep crustal xenoliths, northern Alti-plano (SE Peru): Geological Society of America Bulletin, v. 127, no. 11/12, p. 1777–1797, doi: 10 .1130 /B31206 .1 .
Clark, C., Fitzsimons, I.C.W., Healy, D., and Harley, S.L., 2011, How does the continental crust get really hot?: Elements, v. 7, p. 235–240, doi: 10 .2113 /gselements .7 .4 .235 .
Clift, P.D., Pecher, I., Kukowski, N., and Hampel, A., 2003, Tectonic erosion of the Peruvian forearc, Lima Basin, by subduction and Nazca Ridge collision: Tectonics, v. 22, no. 3, 1023, doi: 10 .1029 /2002TC001386 .
Coffin, M.F., and Eldholm, O., 1994, Large igneous provinces: Crustal structure, dimensions, and external consequences: Reviews of Geophysics, v. 32, p. 1–36, doi: 10 .1029 /93RG02508 .
Currie, C.A., and Beaumont, C., 2011, Are diamond-bearing Cretaceous kimberlites related to low-angle subduction beneath western North America?: Earth and Planetary Science Let-ters, v. 303, p. 59–70, doi: 10 .1016 /j .epsl .2010 .12 .036 .
DeMets, C., Gordon, R.G., and Argus, D.F., 2010, Geologically current plate motions: Geophysical Journal International, v. 181, p. 1–80, doi: 10 .1111 /j .1365 -246X .2009 .04491 .x .
Devlin, S., Isacks, B.L., Pritchard, M.E., Barnhart, W.D., and Lohman, R.B., 2012, Depths and focal mechanisms of crustal earthquakes in the central Andes determined from teleseismic wave-form analysis and InSAR: Tectonics, v. 31, TC2002, doi: 10 .1029 /2011TC002914 .
Dickinson, W.R., and Snyder, W.S., 1978, Plate tectonics of the Laramide orogeny: Geological Society of America, v. 151, p. 355–366, doi: 10 .1130 /MEM151 -p355 .
Dorbath, C., 1996, Velocity structure of the Andes of central Peru from locally recorded earth-quakes: Geophysical Research Letters, v. 23, p. 205–208, doi: 10 .1029 /95GL03778 .
Dorbath, C., Dorbath, L., Cisternas, A., Deverchére, J., and Sebrier, M., 1990, Seismicity of the Huancayo Basin (central Peru) and the Huaytapallana fault: Journal of South American Earth Sciences, v. 3, p. 21–29, doi: 10 .1016 /0895 -9811 (90)90015 -S .
Dorbath, C., Granet, M., Poupinet, G., and Martinez, C., 1993, A teleseismic study of the Altiplano and the eastern Cordillera in northern Bolivia: New constraints on a lithospheric model: Journal of Geophysical Research, v. 98, p. 9825–9844, doi: 10 .1029 /92JB02406 .
Dorbath, L., Dorbath, C., Jimenez, E., and Rivera, L., 1991, Seismicity and tectonic deformation in the Eastern Cordillera and sub-Andean zone of central Peru: Journal of South American Earth Sciences, v. 4, p. 13–24, doi: 10 .1016 /0895 -9811 (91)90015 -D .
Dougherty, S.L., and Clayton, R.W., 2015, Seismic structure in southern Peru: Evidence for a smooth contortion between flat and normal subduction of the Nazca plate: Geophysical Journal International, v. 200, p. 534–555, doi: 10 .1093 /gji /ggu415 .
Dragovic, B., Samanta, L.M., Baxter, E.F., and Selverstone, J., 2012, Using garnet to constrain the duration and rate of water-releasing metamorphic reactions during subduction: An example from Sifnos, Greece: Chemical Geology, v. 314–317, p. 9–22, doi: 10 .1016 /j .chemgeo .2012 .04 .016 .
Dueker, K.G., and Sheehan, A.F., 1997, Mantle discontinuity structure from midpoint stacks of converted P to S waves across the Yellowstone hotspot track: Journal of Geophysical Re-search, v. 102, p. 8313–8327, doi: 10 .1029 /96JB03857 .
Eakin, C.M., Long, M.D., Beck, S.L., Wagner, L.S., Tavera, H., and Condori, C., 2014, Response of the mantle to flat slab evolution: Insights from local S splitting beneath Peru: Geophysical Research Letters, v. 41, p. 3438–3446, doi: 10 .1002 /2014GL059943 .
Eakin, C.M., Long, M.D., Wagner, L.S., Beck, S.L., and Tavera, H., 2015, Upper mantle anisotropy beneath Peru from SKS splitting: Constraints on flat slab dynamics and interactions with

Research Paper
15Bishop et al. | Flat subduction in southern PeruGEOSPHERE | Volume 13 | Number 5
the Nazca Ridge: Earth and Planetary Science Letters, v. 412, p. 152–162, doi: 10 .1016 /j .epsl .2014 .12 .015 .
Erslev, E.A., 2005, 2D Laramide geometries and kinematics of the Rocky Mountains, Western U.S.A., in Kalstrom, K.E., and Keller, G.R., eds., The Rocky Mountain Region: An Evolving Lithosphere Tectonics, Geochemistry, and Geophysics: Washington, D.C., American Geo-physical Union, doi: 10 .1029 /154GM02 .
Espurt, N., Baby, P., Brusset, S., Roddaz, M., Hermoza, V., Antoine, P.O., Salas-Gismondi, R., and Bolaños, R., 2007, How does the Nazca Ridge subduction influence the modern Amazonian foreland basin?: Geology, v. 35, no. 6, p. 515–518, doi: 10 .1130 /G23237A .1 .
Espurt, N., Funiciello, F., Martinod, J., Guillaume, B., Regard, V., Faccenna, C., and Brusset, S., 2008, Flat subduction dynamics and deformation of the South American plate: Insights from analog modeling: Tectonics, v. 27, TC3011, doi: 10 .1029 /2007TC002175 .
Espurt, N., Baby, P., Brusset, S., Roddaz, M., Hermoza, W., and Barbarand, J., 2010, The Nazca Ridge and uplift of the Fitzcarrald Arch: Implications for regional geology in northern South America, in Hoorn, C., and Wesselingh, F.P., eds., Amazonia, Landscape, and Species Evolution: A Look into the Past: Oxford, UK, Wiley-Blackwell, p. 89–100, doi: 10 .1002 /9781444306408 .ch6 .
Fukao, Y., Yamamoto, A., and Masaru, K., 1989, Gravity anomaly across the Peruvian Andes: Journal of Geophysical Research, v. 94, p. 3867–3890, doi: 10 .1029 /JB094iB04p03867 .
Gérault, M., Husson, L., Miller, M.S., and Humphreys, E.D., 2015, Flat-slab subduction, topog-raphy, and mantle dynamics in southwestern Mexico: Tectonics, v. 34, p. 1892–1909, doi: 10 .1002 /2015TC003908 .
Gerya, T.V., Fossati, D., Cantieni, C., and Seward, D., 2009, Dynamic effects of aseismic ridge subduction: Numerical modelling: European Journal of Mineralogy, v. 21, p. 649–661, doi: 10 .1127 /0935 -1221 /2009 /0021 -1931 .
Global Volcanism Program, 2013, Volcanoes of the World, v. 4.5.0: Washington, D.C., Smithso-nian Institution, doi: 10 .5479 /si .GVP .VOTW4 -2013 (accessed September 2016) .
Gotberg, N., McQuarrie, N., and Carlotto Caillaux, V., 2010, Comparison of crustal thickening budget and shortening estimates in southern Peru (12–14°S): Implications for mass balance and rotations in the “Bolivian orocline”: Geological Society of America Bulletin, v. 122, no. 5/6, p. 727–742, doi: 10 .1130 /B26477 .1 .
Gutscher, M.A., Olivet, J.L., Aslanian, D., Eissen, J.P., and Maury, R., 1999, The “lost Inca Pla-teau”: Cause of flat subduction beneath Peru?: Earth and Planetary Science Letters, v. 171, p. 335–341, doi: 10 .1016 /S0012 -821X (99)00153 -3 .
Gutscher, M.A., Spakman, W., Bijwaard, H., and Engdahl, E.R., 2000, Geodynamics of flat sub-duction: Seismicity and tomographic constraints from the Andean margin: Tectonics, v. 19, no. 5, p. 814–833, doi: 10 .1029 /1999TC001152 .
Hacker, B.R., 1996, Eclogite formation and the rheology, buoyancy, seismicity, and H2O content of oceanic crust, in Bebout, G.E., Scholl, D.W., Kirby, S.H., and Platt, J.P., eds., Subduction Top to Bottom: Washington, D.C., American Geophysical Union. doi: 10 .1029 /GM096p0337 .
Hagen, R.A., and Moberly, R., 1994, Tectonic effects of a subducting aseismic ridge: The subduc-tion of the Nazca Ridge at the Peru Trench: Marine Geophysical Researches, v. 16, p. 145–161, doi: 10 .1007 /BF01224757 .
Hampel, A., 2002, The migration history of the Nazca Ridge along the Peruvian active margin: A re-evaluation: Earth and Planetary Science Letters, v. 203, p. 665–679, doi: 10 .1016 /S0012 -821X (02)00859 -2 .
Hampel, A., Kukowski, N., Bialas, J., Huebscher, C., and Heinbockel, R., 2004, Ridge subduction at an erosive margin: The collision zone of the Nazca Ridge in southern Peru: Journal of Geophysical Research, v. 109, B02101, doi: 10 .1029 /2003JB002593 .
Hayes, G.P., Wald, D.J., and Johnson, R.L., 2012, Slab1.0: A three-dimensional model of global subduction zone geometries: Journal of Geophysical Research, v. 117, B01302, doi: 10 .1029 /2011JB008524 .
Hu, J., Liu, L., Hermosillo, A., and Quan, Z., 2016, Simulation of late Cenozoic South American flat-slab subduction using geodynamic models with data assimilation: Earth and Planetary Science Letters, v. 438, p. 1–13, doi: 10 .1016 /j .epsl .2016 .01 .011 .
International Seismological Centre, 2011, Online global earthquake bulletin database: http:// www .isc .ac .uk /iscbulletin/ (accessed September 2016).
James, D.E., and Snoke, A., 1994, Structure and tectonics in the region of flat subduction be-neath central Peru: Crust and uppermost mantle: Journal of Geophysical Research, v. 99, p. 6899–6912, doi: 10 .1029 /93JB03112 .
Jamieson, R.A., and Beaumont, C., 2013, On the origin of orogens: Geological Society of Amer-ica Bulletin, v. 125, no. 11/12, p. 1671–1702, doi: 10 .1130 /B30855 .1 .
John, T., Gussone, N., Podladchikov, Y.Y., Bebout, G.E., Dohmen, R., Halama, R., Klemd, R., Magna, T., and Seitz, H.-M., 2012, Volcanic arcs fed by rapid pulsed fluid flow through sub-ducting slabs: Nature Geoscience, v. 5, p. 489–492, doi: 10 .1038 /ngeo1482 .
Jordan, T.E., and Allmendinger, R.W., 1986, The Sierras Pampeanas of Argentina: A modern analogue of Rocky Mountain foreland deformation: American Journal of Science, v. 286, p. 737–764, doi: 10 .2475 /ajs .286 .10 .737 .
Kay, S.M., and Mpodozis, C., 2002, Magmatism as a probe to the Neogene shallowing of the Nazca plate beneath the modern Chilean flat-slab: Journal of South American Earth Sci-ences, v. 15, p. 39–57, doi: 10 .1016 /S0895 -9811 (02)00005 -6 .
Kim, Y., Miller, M.S., Pearce, F., and Clayton, R.W., 2012, Seismic imaging of the Cocos Plate sub-duction zone system in central Mexico: Geochemistry Geophysics Geosystems, v. 13, no. 7, Q07001, doi: 10 .1029 /2012GC004033 .
Klemd, R., Gao, J., Li, J.-L., and Meyer, M., 2015, Metamorphic evolution of (ultra)-high-pressure subduction-related transient crust in the south Tianshan orogen (Central Asian Orogenic Belt): Geodynamic implications: Gondwana Research, v. 28, p. 1–25, doi: 10 .1016 /j .gr .2014 .11 .008 .
Kley, J., and Monaldi, C.R., 1998, Tectonic shortening and crustal thickness in the central Andes: How good is the correlation?: Geology, v. 26, no. 8, p. 723–726, doi: 10 .1130 /0091 -7613 (1998)026 <0723: TSACTI>2 .3 .CO;2 .
Kopp, H., Flueh, E.R., Papenberg, C., and Klaeschen, D., 2004, Seismic investigation of the O’Higgins Seamount Group and Juan Fernández Ridge: Aseismic ridge emplacement and lithosphere hydration: Tectonics, v. 23, TC2009, doi: 10 .1029 /2003TC001590 .
Kumar, A., Wagner, L.S., Beck, S.L., Long, M.D., Zandt, G., Young, B., Tavera, H., and Minaya, E., 2016, Seismicity and state of stress in the central and southern Peruvian flat slab: Earth and Planetary Science Letters, v. 441, p. 71–80, doi: 10 .1016 /j .epsl .2016 .02 .023 .
Langer, C.J., and Spence, W., 1995, The 1974 Peru earthquake series: Bulletin of the Seismologi-cal Society of America, v. 85, p. 665–687.
le Roux, J.P., Tavares Correa, C., and Alayza, F., 2000, Sedimentology of the Rímac-Chillón allu-vial fan at Lima, Peru, as related to Plio-Pleistocene sea-level changes, glacial cycles and tectonics: Journal of South American Earth Sciences, v. 13, p. 499–510, doi: 10 .1016 /S0895 -9811 (00)00044 -4 .
Ligorría, J.P., and Ammon, C.J., 1999, Iterative deconvolution and receiver-function estimation: Bulletin of the Seismological Society of America, v. 89, p. 1395–1400.
Lloyd, S., van der Lee, S., França, G.S., Assumpção, M., and Mei, F., 2010, Moho map of South America from receiver functions and surface waves: Journal of Geophysical Research, v. 115, B11315, doi: 10 .1029 /2009JB006829 .
Ma, Y., and Clayton, R.W., 2014, The crust and uppermost mantle structure of Southern Peru from ambient noise and earthquake surface wave analysis: Earth and Planetary Science Letters, v. 395, p. 61–70, doi: 10 .1016 /j .epsl .2014 .03 .013 .
Ma, Y., and Clayton, R.W., 2015, Flat slab deformation caused by interplate suction force: Geo-physical Research Letters, v. 42, p. 7064–7072, doi: 10 .1002 /2015GL065195 .
Macharé, J., and Ortlieb, L., 1992, Plio-Quaternary vertical motions and the subduction of the Nazca Ridge, central coast of Peru: Tectonophysics, v. 205, p. 97–108, doi: 10 .1016 /0040 -1951 (92)90420 -B .
Mamani, M., Wörner, G., and Sempere, T., 2010, Geochemical variations in igneous rocks of the Central Andean orocline (13°S to 18°S): Tracing crustal thickening and magma generation through time and space: Geological Society of America Bulletin, v. 122, no. 1/2, p. 162–182, doi: 10 .1130 /B26538 .1 .
Manea, V., and Gurnis, M., 2007, Subduction zone evolution and low viscosity wedges and chan-nels: Earth and Planetary Science Letters, v. 264, p. 22–45, doi: 10 .1016 /j .epsl .2007 .08 .030 .
Manea, V.C., Pérez-Gussinyé, M., and Manea, M., 2012, Chilean flat slab subduction controlled by overriding plate thickness and trench rollback: Geology, v. 40, no. 1, p. 35–38, doi: 10 .1130 /G32543 .1 .
Manea, V.C., Manea, M., Ferrari, L., Orozco-Esquivel, T., Valenzuela, R.W., Husker, A., and Kostog-lodov, V., 2017, A review of the geodynamic evolution of flat subduction in Mexico, Peru, and Chile: Tectonophysics, v. 695, p. 27–52, doi: 10 .1016 /j .tecto .2016 .11 .037 .
Marotta, G.S., França, G.S., Monico, J.F.G., Fuck, R.A., and Araújo-Filho, J.O.d., 2013, Strain rate of the South American lithospheric plate by SIRGAS-CON geodetic observations: Journal of South American Earth Sciences, v. 47, p. 136–141, doi: 10 .1016 /j .jsames .2013 .07 .004 .
Martinod, J., Funiciello, F., Faccenna, C., Labanieh, S., and Regard, V., 2005, Dynamical effects of subducting ridges: Insights from 3-D laboratory models: Geophysical Journal International, v. 163, p. 1137–1150, doi: 10 .1111 /j .1365 -246X .2005 .02797 .x .
Research Paper
16Bishop et al. | Flat subduction in southern PeruGEOSPHERE | Volume 13 | Number 5
McGlashan, N., Brown, L., and Kay, S., 2008, Crustal thickness in the central Andes from tele-seismically recorded depth phase precursors: Geophysical Journal International, v. 175, p. 1013–1022, doi: 10 .1111 /j .1365 -246X .2008 .03897 .x .
Motagh, M., Wang, R., Walter, T.R., Bürgmann, R., Fielding, E., Anderssohn, J., and Zschau, J., 2008, Coseismic slip model of the 2007 August Pisco earthquake (Peru) as constrained by Wide Swath radar observations: Geophysical Journal International, v. 174, p. 842–848, doi: 10 .1111 /j .1365 -246X .2008 .03852 .x .
Noble, D.C., and McKee, E.H., 1982, Nevado Portugueza volcanic center, central Peru: A Pliocene central volcano-collapse caldera complex with associated silver mineralization: Economic Geology and the Bulletin of the Society of Economic Geologists, v. 77, no. 8, p. 1893–1900, doi: 10 .2113 /gsecongeo .77 .8 .1893 .
O’Driscoll, L.J., Richards, M.A., and Humphreys, E.D., 2012, Nazca–South America interactions and the late Eocene–late Oligocene flat-slab episode in the central Andes: Tectonics, v. 31, TC2013, doi: 10 .1029 /2011TC003036 .
Oncken, O., Hindle, D., Kley, J., Elger, K., Victor, P., and Schemmann, K., 2006, Deformation of the central Andean upper plate system—Facts, fiction, and constraints for plateau models, in Oncken, O., Chong, G., Franz, G., Giese, P., Götze, H.-J., Ramos, V.A., Strecker, M.R., and Wigger, P., eds., The Andes: Active Subduction Orogeny: Berlin, Springer-Verlag, p. 3–27, doi: 10 .1007 /978 -3 -540 -48684 -8_1 .
PeruSE, 2013, Peru subduction experiment (dataset): Caltech, doi: 10 .7909 /C3H41PBZ .Pfiffner, O., and Gonzalez, L., 2013, Mesozoic-Cenozoic evolution of the western margin of South
America: Case study of the Peruvian Andes: Geosciences, v. 3, p. 262–310, doi: 10 .3390 /geosciences3020262 .
Phillips, K., and Clayton, R.W., 2014, Structure of the subduction transition region from seismic array data in southern Peru: Geophysical Journal International, v. 196, p. 1889–1905, doi: 10 .1093 /gji /ggt504 .
Phillips, K., Clayton, R.W., Davis, P., Tavera, H., Guy, R., Skinner, S., Stubailo, I., Audin, L., and Aguilar, V., 2012, Structure of the subduction system in southern Peru from seismic array data: Journal of Geophysical Research, v. 117, B11306, doi: 10 .1029 /2012JB009540 .
Porter, R., Gilbert, H., Zandt, G., Beck, S., Warren, L., Calkins, J., Alvarado, P., and Anderson, M., 2012, Shear wave velocities in the Pampean flat-slab region from Rayleigh wave tomogra-phy: Implications for slab and upper mantle hydration: Journal of Geophysical Research, v. 117, B11301, doi: 10 .1029 /2012JB009350 .
Ray, J.S., Mahoney, J.J., Duncan, R.A., Ray, J., Wessel, P., and Naar, D.F., 2012, Chronology and geochemistry of lavas from the Nazca Ridge and Easter Seamount Chain: An ~30 Myr hotspot record: Journal of Petrology, v. 53, no. 7, p. 1417–1448, doi: 10 .1093 /petrology /egs021 .
Rondenay, S., Abers, G.A., and van Keken, P.E., 2008, Seismic imaging of subduction zone meta-morphism: Geology, v. 36, no. 4, p. 275–278, doi: 10 .1130 /G24112A .1 .
Rosenbaum, G., Giles, D., Saxon, M., Betts, P.G., Weinberg, R.F., and Duboz, C., 2005, Subduction of the Nazca Ridge and the Inca Plateau: Insights into the formation of ore deposits in Peru: Earth and Planetary Science Letters, v. 239, p. 18–32, doi: 10 .1016 /j .epsl .2005 .08 .003 .
Ryan, J., Beck, S., Zandt, G., Wagner, L., Minaya, E., and Tavera, H., 2016, Central Andean crustal structure from receiver function analysis: Tectonophysics, v. 682, p. 120–133, doi: 10 .1016 /j .tecto .2016 .04 .048 .
Saillard, M., Hall, S.R., Audin, L., Farber, D.L., Regard, V., and Hérail, G., 2011, Andean coastal uplift and active tectonics in southern Peru: 10Be surface exposure dating of differentially uplifted marine terrace sequences (San Juan de Marcona, ~15.4°S): Geomorphology, v. 128, p. 178–190, doi: 10 .1016 /j .geomorph .2011 .01 .004 .
Schneider, J.F., and Sacks, S., 1987, Stress in the contorted Nazca Plate beneath southern Peru from local earthquakes: Journal of Geophysical Research, v. 92, p. 13,887–13,902, doi: 10 .1029 /JB092iB13p13887 .
Scire, A., Zandt, G., Beck, S., Long, M., Wagner, L., Minaya, E., and Tavera, H., 2016, Imaging the transition from flat to normal subduction: Variations in the structure of the Nazca slab and upper mantle under southern Peru and northwestern Bolivia: Geophysical Journal Interna-tional, v. 204, p. 457–479, doi: 10 .1093 /gji /ggv452 .
Scripps Institution of Oceanography, 1986, IRIS/IDA Seismic Network (dataset): International Federation of Digital Seismograph Networks, doi: 10 .7914 /SN /II .
Sheehan, A.F., Shearer, P.M., Gilbert, H.J., and Dueker, K.G., 2000, Seismic migration processing of P-SV converted phases for mantle discontinuity structure beneath the Snake River Plane, western United States: Journal of Geophysical Research, v. 105, p. 19,055–19,065, doi: 10 .1029 /2000JB900112 .
Somoza, R., and Ghidella, M.E., 2012, Late Cretaceous to recent plate motions in western South America revisited: Earth and Planetary Science Letters, v. 331–332, p. 152–163, doi: 10 .1016 /j .epsl .2012 .03 .003 .
Spence, W., Mendoza, C., Engdahl, E.R., Choy, G.L., and Norabuena, E., 1999, Seismic subduc-tion of the Nazca Ridge as shown by the 1996–97 Peru earthquakes: Pure and Applied Geo-physics, v. 154, p. 753–776, doi: 10 .1007 /s000240050251 .
Suárez, G., Gagnepain, J., Cisternas, A., Hatzfeld, D., Molnar, P., Ocola, L., Roecker, S.W., and Viodé, J.P., 1990, Tectonic deformation of the Andes and the configuration of the subducted slab in central Peru: Results from a microseismic experiment: Geophysical Journal Interna-tional, v. 103, p. 1–12, doi: 10 .1111 /j .1365 -246X .1990 .tb01747 .x .
Suter, M., Martínez, M.L., Legorreta, O.Q., and Martínez, M.C., 2001, Quaternary intra-arc ex-tension in the central Trans-Mexican volcanic belt: Geological Society of America Bulletin, v. 113, no. 6, p. 693–703, doi: 10 .1130 /0016 -7606 (2001)113 <0693: QIAEIT>2 .0 .CO;2 .
Tassara, A., and Echaurren, A., 2012, Anatomy of the Andean subduction zone: Three-dimen-sional density model upgraded and compared against global-scale models: Geophysical Journal International, v. 189, p. 161–168, doi: 10 .1111 /j .1365 -246X .2012 .05397 .x .
Tassara, A., Götze, H.-J., Schmidt, S., and Hackney, R., 2006, Three-dimensional density model of the Nazca Plate and the Andean continental margin: Journal of Geophysical Research, v. 111, B09404, doi: 10 .1029 /2005JB003976 .
van Hunen, J., van den Berg, A.P., and Vlaar, N.J., 2002a, On the role of subducting oceanic plateaus in the development of shallow flat subduction: Tectonophysics, v. 352, p. 317–333, doi: 10 .1016 /S0040 -1951 (02)00263 -9 .
van Hunen, J., van den Berg, A.P., and Vlaar, N.J., 2002b, The impact of South-American plate motion and the Nazca Ridge subduction on the flat subduction below south Peru: Geo physi-cal Research Letters, v. 29, p. 35-1–35-4, doi: 10 .1029 /2001GL014004 .
van Hunen, J., van den Berg, A.P., and Vlaar, N.J., 2004, Various mechanisms to induce present- day shallow flat subduction and implications for the younger Earth: A numerical parameter study: Physics of the Earth and Planetary Interiors, v. 146, p. 179–194, doi: 10 .1016 /j .pepi .2003 .07 .027 .
Wagner, L., Beck, S., and Long, M., 2010, Peru lithosphere and slab experiment (dataset): Interna-tional Federation of Digital Seismograph Networks, doi: 10 .7914 /SN /ZD_2010 .
Ward, K.M., Zandt, G., Beck, S.L., Wagner, L.S., and Tavera, H., 2016, Lithospheric structure be-neath the northern Central Andean Plateau from the joint inversion of ambient noise and earthquake-generated surface waves: Journal of Geophysical Research. Solid Earth, v. 121, p. 8217–8238, doi: 10 .1002 /2016JB013237 .
Wipf, M., Zeilinger, G., Seward, D., and Schlunegger, F., 2008, Focused subaerial erosion during ridge subduction: Impact on the geomorphology in south-central Peru: Terra Nova, v. 20, p. 1–10, doi: 10 .1111 /j .1365 -3121 .2007 .00780 .x .
Worthington, J.R., Hacker, B.R., and Zandt, G., 2013, Distinguishing eclogite from peridotite: EBSD-based calculations of seismic velocities: Geophysical Journal International, v. 193, p. 489–505, doi: 10 .1093 /gji /ggt004 .