geostatistical comparison between blast and drill holes in
TRANSCRIPT
HAL Id: hal-01160562https://hal-mines-paristech.archives-ouvertes.fr/hal-01160562v2
Submitted on 22 Jun 2016
HAL is a multi-disciplinary open accessarchive for the deposit and dissemination of sci-entific research documents, whether they are pub-lished or not. The documents may come fromteaching and research institutions in France orabroad, or from public or private research centers.
L’archive ouverte pluridisciplinaire HAL, estdestinée au dépôt et à la diffusion de documentsscientifiques de niveau recherche, publiés ou non,émanant des établissements d’enseignement et derecherche français ou étrangers, des laboratoirespublics ou privés.
Distributed under a Creative Commons Attribution| 4.0 International License
Geostatistical comparison between blast and drill holesin a porphyry copper deposit
Serge Antoine Séguret
To cite this version:Serge Antoine Séguret. Geostatistical comparison between blast and drill holes in a porphyry cop-per deposit. WCSB7 7th world conference on sampling and blending, Jun 2015, bordeaux, France.�10.1255/t0sf.51�. �hal-01160562v2�

S. A. Séguret “Blast & Drill holes...” Draft author. Final paper in: Proceedings of the 7th International Con-
ference on Sampling and Blending , Kim H. Esbensen Editor, IMP publications, DOI 10.1255/t0sf.51
Geostatistical comparison between blast and drill holes in a porphyry
copper deposit
(June 2016 version)
Serge Antoine Séguret
MINES ParisTech, Center for Geosciences/Geostatistical team, 35 rue Saint Honoré, 7730 Fontainebleau, France. E-mail:
Serge has worked for more than thirty years in the famous laboratory founded by Georges Matheron in 1968 at Fontainebleau, where the major developments of Geostatistics have been achieved. For the last ten years, he has been heavily involved in mining operations via a long term collaboration with Codelco (Chile) and Vale (Brazil).
Abstract
Diamond drill-hole grades are known to be of better quality than those of blast holes; is this true? We present a formal study of a
porphyry copper deposit in Chile where the variogram of 3 meter long drill hole samples is compared to 15 meter long blast hole
ones and we show that the blast holes can be assumed to regularizing the point information deduced from the drill holes, except for
a nugget effect specific to the blast samples. Complementary analyses based on migrated data show that the drill holes also have
their own errors.
After a brief description of the first steps in the blast sampling protocol, we show, by using extension variance concepts, that the
blast error is not due to the arbitrary removal of material from the sampling cone produced by drilling.
The present study establishes a formal link between blast and drill holes which leads to linear systems:
Removal by kriging of the blast (or the drill) error;
Deconvolution of the blast measurements to transform them into point ones;
Block modeling where drill and blast holes are used together.
In the following, we thought it useful to detail some calculations and give some key formulas so that the reader can eventually adapt
to other comparisons such as diamond drill holes compared to reverse circulation drill holes. Overall, this study shows how to
combine measurements known on two different supports, a very complex challenge.
Data
The data comes from an open-pit copper mine in Northern Chile of which a 600x400x125 m3 sub domain is analysed (Figure 1) as
it is almost homogeneously covered by around 3,000 drill-hole samples (3m long) and 13,000 blast-hole samples (15m long).

S. A. Séguret “Blast & Drill holes...” Draft author. Final paper in: Proceedings of the 7th International Con-
ference on Sampling and Blending , Kim H. Esbensen Editor, IMP publications, DOI 10.1255/t0sf.51
Figure 1. Base maps of blast (black) and drill (red) measurements
Over this sub domain, the averaged copper grades of the blast and the drill holes are almost identical (around 0.6%). The
variograms of blast and drill holes have similar behaviours (Figure 2), a high percentage of nugget effect (around 50%) and they
differ mainly by their sills (0.12 for drill holes, 0.8 for blast holes), a comprehensible property as the blast support is larger.
Figure 2. (a) Drill hole copper grade variogram; (b) Blast copper grade variogram. Three directions are represented,
45° North (N45), 135° North (N135), and vertical (D-90). Black continuous line is the isotropic variogram
Methodology
The geostatistical comparison between the two types of measurements is decomposed into two steps:
1 Deconvolution & Convolution:
Starting from the drill variogram, identifying the basic structures that model its behavior and deducing the underlying “point”
variogram by deconvolution;
Making the theoretical convolution of the point variogram on 15-meter long supports and checking that it correctly fits the
vertical and horizontal blast variograms, except for an additional nugget effect of 0.2.
2 Migration & Cross variogram
As there is no point where both drill and blast measurements are known, we make some blast holes migrate to drill hole
locations and calculate the cross variogram;
The objective is to measure the nugget effect shared by the two types of measurements.
There are not enough drill samples to distinguish between horizontal and vertical drill variograms (they are drilled along many
different directions). This is the first reason why an omnidirectional variogram will be considered for the drill samples, the second
one is that all the formulas at our disposal require isotropy.
Consequently, we make two comparisons between:
An omnidirectional drill variogram and a vertical blast one;
An omnidirectional drill variogram and a horizontal blast one.
The distinction is important because the formulas differ between the two cases.
General formulas
All the formulas have been known for a long time in the literature, but in different places, and some are not even published. For the
convolution charts, the most useful reference is probably 1; for the complete fundamental formulas, refer to
2. Concerning the
extension formulas, refer to 3.
In the following we apply a procedure illustrated in 4 where we use the following approximation of a variogram regularized over a

S. A. Séguret “Blast & Drill holes...” Draft author. Final paper in: Proceedings of the 7th International Con-
ference on Sampling and Blending , Kim H. Esbensen Editor, IMP publications, DOI 10.1255/t0sf.51
support “l” (the distance “h” being large in comparison with the dimension of the support):
γ ( ) γ( ) γ( , )l h h l l (1)
with
2
0 0
1γ( , ) ( )
l l
l l u v dudvl
(2)
is the average of the point variogram when both extremities of vector h describe the support independently. In (2), 1D inte-
grals are used because the core diameters are small compared to the lengths.
The way this formula is applied depends on the structure of the point variogram (spherical, exponential, linear, etc…) but also on the
calculation direction compared with the regularization direction. In the following, we consider two situations:
The calculation direction is parallel to the regularization direction, notation// ( )l h ;
The calculation direction is perpendicular to the regularization direction, notation ( )l h .
For the structures with a range, whether asymptotically (Exponential, Gaussian) or real (Spherical), we have:
range of γ (h)l = range of γ(h) + l (3)
Note that (3) is not compatible with approximation (1) which amounts to assigning to the regularized model the same range as that
of the point model. So (1) is essentially useful for comparing the sills of regularized structures.
Step 1: deconvolution & convolution
Fitting the drill-hole variogram
Three basic structures are necessary: nugget, exponential, linear:
| |
2γ (h) (1 ) | |drill
h
a
drill drill drill drillC e b h
(4)
with:
2 0.0150.05, 0.05, 3 35 ,
100drill drill drill drillC a m b
Figure 3. Drill hole variogram fitting. Dotted line, the experimental curve; continuous line, the model
S. A. Séguret “Blast & Drill holes...” Draft author. Final paper in: Proceedings of the 7th International Con-
ference on Sampling and Blending , Kim H. Esbensen Editor, IMP publications, DOI 10.1255/t0sf.51
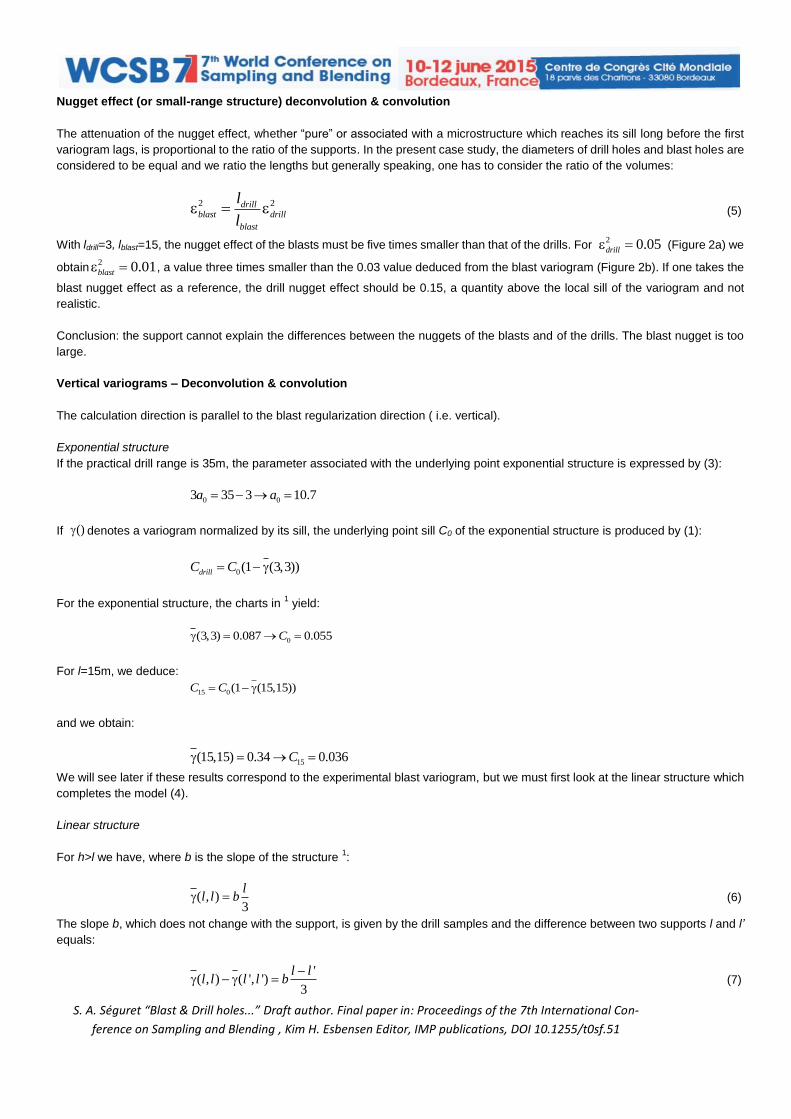
Nugget effect (or small-range structure) deconvolution & convolution
The attenuation of the nugget effect, whether “pure” or associated with a microstructure which reaches its sill long before the first
variogram lags, is proportional to the ratio of the supports. In the present case study, the diameters of drill holes and blast holes are
considered to be equal and we ratio the lengths but generally speaking, one has to consider the ratio of the volumes:
2 2drillblast drill
blast
l
l (5)
With ldrill=3, lblast=15, the nugget effect of the blasts must be five times smaller than that of the drills. For 2 0.05drill (Figure 2a) we
obtain2 0.01blast , a value three times smaller than the 0.03 value deduced from the blast variogram (Figure 2b). If one takes the
blast nugget effect as a reference, the drill nugget effect should be 0.15, a quantity above the local sill of the variogram and not
realistic.
Conclusion: the support cannot explain the differences between the nuggets of the blasts and of the drills. The blast nugget is too
large.
Vertical variograms – Deconvolution & convolution
The calculation direction is parallel to the blast regularization direction ( i.e. vertical).
Exponential structure
If the practical drill range is 35m, the parameter associated with the underlying point exponential structure is expressed by (3):
0 03 35 3 10.7a a
If () denotes a variogram normalized by its sill, the underlying point sill C0 of the exponential structure is produced by (1):
0(1 (3,3))drillC C
For the exponential structure, the charts in 1 yield:
0(3,3) 0.087 0.055C
For l=15m, we deduce:
15 0(1 (15,15))C C
and we obtain:
15(15,15) 0.34 0.036C
We will see later if these results correspond to the experimental blast variogram, but we must first look at the linear structure which
completes the model (4).
Linear structure
For h>l we have, where b is the slope of the structure 1:
( , )3
ll l b (6)
The slope b, which does not change with the support, is given by the drill samples and the difference between two supports l and l’
equals:
'( , ) ( ', ')
3
l ll l l l b
(7)

S. A. Séguret “Blast & Drill holes...” Draft author. Final paper in: Proceedings of the 7th International Con-
ference on Sampling and Blending , Kim H. Esbensen Editor, IMP publications, DOI 10.1255/t0sf.51
When l=0m and l’=3m, and with0.015
100drillb obtained by (4), the attenuation is 0.00015, a negligible quantity. When l=3m and
l’=15m, the attenuation is 0.0006, still negligible. In any case, the effect of the regularization on the linear structure is negligible. This
is due to the weak slope of the linear structure.
The combination of all the regularizations is shown in figure 4a where the dotted line represents the actual model and the red line the
model we should obtain with a more realistic nugget effect. One can see that apart from the problem of the nugget effect, the
variation range is acceptable, even if the linear part of the theoretical structure does not appear in the vertical experimental blast
variogram.
Figure 4. In blue, the points of the experimental blast variogram; dotted line, the theoretical model for the blasts
deduced from the drills; in red, the theoretical model with a more realistic nugget effect (a) Theoretical regulari-
zation parallel to the vertical blast variogram (b) Theoretical regularization perpendicular to the horizontal blast
variogram.
Horizontal variograms – Deconvolution & convolution
The calculation direction is perpendicular to the blast regularization direction (i.e. horizontal).
The same procedure is followed, the only difference is that approximation (1) is not acceptable and we have to use charts that
produce the exact calculation (see 1, chart number 11).
We obtain figure 4b where the dotted line represents the actual model and the red line the model we should obtain with a more
realistic nugget effect. The fit is good.
First conclusions
If we omit the problem of the nugget effect, we see that both blast and drill holes can be considered as a regularization of the same
reality according to their respective supports. This result, which we did not dare to hope, surprised us pleasantly and shows that the
measurements from the blast holes are not as bad as people often think, anyway the case for this company. But the approach
followed up to now suffers from two uncertainties:
The analyses are done independently. Imagine that all the blast locations have been shifted from a constant equal to the
range (around 100m). In that case, the correlation between blast and drills will be zero while the same coherence prop-
erties are maintained when making individual regularizations as previously;
The analyses refer to the drill nugget assumed to be a “natural” micro structure; is this true?
To answer these questions, cross variograms must be calculated but we do not have any location with both measurements, so a
migration is necessary.
Step 2: migration & cross variogram

S. A. Séguret “Blast & Drill holes...” Draft author. Final paper in: Proceedings of the 7th International Con-
ference on Sampling and Blending , Kim H. Esbensen Editor, IMP publications, DOI 10.1255/t0sf.51
Migration
In order to obtain a significant number of measurements at the same location, around 1,000 blasts samples were migrated to drill
locations when the migration distance did not exceed 10 meters. Figure 5a presents the scatter diagram between the migrated
values and the drill ones. The correlation coefficient is low (0.4) because the nugget effects are large.
Figure 5. (a) Scatter diagram between migrated blasts and drills; (b) Direct variogram of migrated blasts (black
triangles), corresponding drills (red points) and cross-variogram of both (blue stars). The cross variogram reveals a
tiny negative nugget effect with no comparison with the drill or blast ones
On Figure 5b, points (resp. triangles) present the migrated blast (resp. drill) variograms. They differ slightly from the previous ones
because the number of samples is smaller and the migration affects the results. In the same figure, the stars represent the cross
variogram which does not show a significant nugget effect, possibly a small negative one without any magnitude in common with the
effects encountered on the individual variograms.
Conclusions
It seems that the drill-holes have their own errors too, independent of the blast ones, and the two measurements share only the
structured parts of the variogram: the exponential and linear structures.
Analyse of the blast error
Description of the blast sampling
Up to now the theoretical blast support has been set to 15m but in fact the blast drilling length is approximately 17m, producing a
large cone from the floor of which around 5cm of material is removed by hand across the entire surface, the idea being to restore an
overall volume of 15m. Without any consideration of the numerous sampling procedures, we stay at this stage and ask the question:
could the error specific to the blasts be due to the arbitrary removal of material and the blast length variability?
Randomization of the blast support
Let l and l’ be two different supports. One finds in 3 the formula which expresses the variance of the difference between the two
grades Y over l and l’, called “extension variance from l to l’, also equal to twice the variogram between the grades averaged over the
two supports:
2 2 '
' ' '( ( ) ( )) [( ( ) ( )) ]) 2 ( ) 2 ( , ) ( , ) ( ', ')l l l l ll hD Y x Y x h E Y x Y x h h l l l l l l (8)

S. A. Séguret “Blast & Drill holes...” Draft author. Final paper in: Proceedings of the 7th International Con-
ference on Sampling and Blending , Kim H. Esbensen Editor, IMP publications, DOI 10.1255/t0sf.51
In (8), l’h represents the translation of the support l’ by a vector h. ( , )l l and ( ', ')l l represent the averaged variogram when
two points move independently along both the supports involved.
Suppose that l and l’ are randomly and independently selected uniformly in an interval, for example equal to [12.5m, 17.5m]. Then
one has to calculate the mathematical expectation of (8) to obtain the resulting variogram. We have:
[ ( , )] [ ( ', ')]E l l E l l (9)
'
'[ ( )] [ ( , )] [ ( , )]ll hE h E l l E l l (10)
(10) is the theoretical variogram that we want to compare to the actual experimental variogram in order to verify if the blast nugget
could be associated with some support-length uncertainty.
'[ ( , )]hE l l is a continuous function, complex to calculate as it depends on the mutual configuration of l and l’, but about which we
know that for h greater than the range plus l, it reaches and stays at the sill of the underlying point variogram. In practice, the only
structure that we consider is the exponential; its point sill is 0.055. For the interval of support-length uncertainty [12.5m, 17.5m],we
deduce from (10) that the sill is reduced by a quantity obtained by: 17.5
12.5
1[ ( , )] ( , )E l l l l dl
l (11)
To evaluate the range of variations, the integral (11) is approximated by a finite sum:
13,14,15,16,17
1[ ( , )] ( , )
5 l
E l l l l
(12)
We use the same charts as previously to calculate the values of ( , )l l involved and finally (12) yields:
1[ ( , )] 0.055 (0.295 0.305 0.325 0.337 0.352) 0.055*0.323
5E l l (13)
Notice that even if we randomize the blast support over a larger interval still centered around 15m, the variance reduction does not
change and stays approximately equal to the sill multiplied by 0.325. If we suppose that the support fluctuation is not symmetric
around 15m, but around 13m for example, the multiplicative factor for the sill reduction decreases to 0.295. In any case, we con-
clude that:
The uncertainty on the support length does not produce a nugget effect but a variance reduction;
This variance reduction represents approximately 30% of the underlying variogram sill ;
The arbitrary removal of the material, as well as the uncertainty on the blast length, cannot explain an error specific to the
blasts and necessarily linked to the subsequent sampling procedures.
Summary: a formal link between blast and drill holes
Formal link
Finally, we have:
15( , , ) ( , , ) ( ) ( , , )blast mY x y z Y x y z p z R x y z (14)
with
Y(x,y,z), the point grade assumed to be isotropic and devoid of any measurement error;
“*” denotes a convolution product;
15 15( , , ) ( ) ( , , ) ( )m mY x y z p z Y x y u p z u du
;

S. A. Séguret “Blast & Drill holes...” Draft author. Final paper in: Proceedings of the 7th International Con-
ference on Sampling and Blending , Kim H. Esbensen Editor, IMP publications, DOI 10.1255/t0sf.51
15 15[0, ]
2
1( ) 1 (| |)
15mp z z ;
15[0, ]
2
1 (| |)z the indicator function equal to 0 outside the interval and 1 inside it;
R(x,y,z), a “white noise” residual statistically and spatially independent from Y(x,y,z) and representing the
blast error
The variogram of Yblast(x,y,z) becomes:
15( ) ( ) ( )blast m Rh h h (15)
with
( )R h , the nugget effect due to the blast error, having the variance 2
R ;
15 15 15( ) ( )( ) ( )(0)m m mh P h P ;
( )h , the point variogram, assumed to be isotropic;
15 [0,15]2
1( ) ( ) ( | | 15)1 (| |)
15mP h p p h h h
The model supposes that the blasts and the drills have the same average because the independent residuals are of zero mean. It
must be verified when using this model. It is approximately the case here (0.63 for the drills, 0.69 for the blasts).
Removing the blast error by kriging
Model (14) can be used to remove the blast error by “Factorial Kriging” estimation5. One can easily build a linear system applicable
to each blast measurement, choosing a local neighborhood of surrounding blast samples. The system is presented symbolically by
using matrix formalism:
In this system, R disappears from the second member of the linear system whereby we remove, from the estimation, the part
associated with the measurement error. It does not mean that in the remaining part there is no nugget effect; it means
that only the “natural” part remains. In our case, the complete nugget effect has to be removed because blasts and drills do not
share any micro-structure.
Deconvolution by kriging
It may be interesting to remove the effect of regularization on the blast using a kriging system which estimates, for each blast
measurement, a “point” value while simultaneously removing the part of the nugget effect associated with blast errors:
The difference with the previous system is that in the second member, (capital “ ”) is replaced by:
15 15( , , ) ( , , ) ( )m x y z x y m zp h h h h h u p h u du
(small “p”).
Block estimate by cokriging drill and blast measures
Finally, one can imagine locally renewing the mine planning block model by using blasts and drills together through a cokriging
system with a linked mean (same average for both measurements):

S. A. Séguret “Blast & Drill holes...” Draft author. Final paper in: Proceedings of the 7th International Con-
ference on Sampling and Blending , Kim H. Esbensen Editor, IMP publications, DOI 10.1255/t0sf.51
These systems were tested on a realistic simulation where the truth is known; they produce good results which will be published in
the near future.
Conclusion
In this deposit – and more generally, in this company (other test have been done), diamond drill hole grades and blast hole grades
are consistent in the sense that, apart from the nugget effect, the structured part of their respective variograms follow the theoretical
laws of regularization.
Concerning the nugget effects, we discover, by cross-analyses, that there is no natural micro-structure in the underlying point grade
and the large nugget effects encountered on the variograms (approximately 50% of the variance for blasts and drills) are due to blast
and drill measurement errors, independent of either measurement type.
The analysis of the blast error leads to the conclusion that the error is not due to the first step of the sampling procedure, it has to be
found later in the process.
As a conclusion, some linear systems are proposed for removing the nugget effects from the data, reducing the effect of convolution
and, more importantly, using blasts and drills together for the short-term mine planning. These systems, among numerous different
potential ones, easy to demonstrate, result directly from the formal link established here between blast and drill holes. Before using
these systems, the link must be verified by adhering to the methodology presented here.
Acknowledgements
The author would like to thank CODELCO Chile, for its strong support in the implementation of good geostatistical practices along
the copper business value chain. I warmly thank the Editor for his excellent recommendations which improved the manuscript. Many
thanks to Sebastian de La Fuentes and the complete team of R&T. Without them, nothing would have been possible.
References
1. A.G. Journel, Ch. J. Huijbregts, “Mining Geostatistics”, 5nd
Edn. The Blackburn Press (1991).
2. J. Serra, « Echantillonnage et estimation locale des phénomènes de transition miniers ». Doctoral thesis, Faculté des
Sciences de Nancy (1967).
3. G. Matheron, « Les Variables Régionalisées et leur estimation ». Masson et Cie Editeurs (1965).
4. S. A. Séguret, “Spatial sampling effect of laboratory practices in a porphyry copper deposit”. Proceedings of the 5th world
conference on Sampling and Blending, Santiago, Chile (October 2011).
5. J. P. Chilès, P. Delfiner, “Geostatistics”, 2nd
edition, Willey (2012)