geotechnical analysis and designapps.itd.idaho.gov/apps/manuals/materials/sec 600.pdf · materials...
TRANSCRIPT

Materials Geotechnical Analysis and Design 600.00
2015
SECTION 600.00 - GEOTECHNICAL ANALYSIS AND DESIGN SECTION 601.00 – ROLE OF HEADQUARTERS AND DISTRICTS
601.1 Coordination between Districts and Headquarters Regarding Emergency Response. 601.2 Geotechnical Report Preparation and Review Process. 601.3 Information for Bidders. 601.4 Geotechnical Designs and Their Basis. 601.5 Geotechnical Construction Support Policy. 601.6 Proprietary Retaining Walls.
SECTION 610.00 - FIELD INVESTIGATIONS
SECTION 615.00 - SOIL AND ROCK CLASSIFICATION
SECTION 620.00 - ENGINEERING PROPERTIES OF SOIL AND ROCK 620.1 Methods of Determining Soil and Rock Properties. 620.2 In Situ Field Testing. 620.3 Laboratory Testing of Soil and Rock. 620.4 Developing the Testing Plan. 620.5 Engineering Properties of Soil. 620.6 Correlations for Estimating Engineering Properties of Soil. 620.7 Engineering Properties of Rock. 620.8 Final Design Values. 620.9 References.
SECTION 630.00 - SEISMIC DESIGN 630.1 Seismic Design Responsibility. 630.2 Seismic Design Policy and Objectives.
630.2.1 Governing Design Specifications. 630.2.2 Additional Resources.
630.3 Geotechnical Seismic Design Considerations. 630.3.1 Overview of Design Options. 630.3.2 Site Characterization. 630.3.3 Soil Profile. 630.3.4 Information for Structural Design.
630.4 Seismic Hazard and Site Response. 630.4.1 Determination of Seismic Hazard Level. 630.4.2 Site Ground Response Analysis. 630.4.3 Site Response For Structures Using IBC. 630.4.4 Near-Field Adjustments. 630.4.5 Earthquake Magnitude.

Materials Geotechnical Analysis and Design 600.00
2015
630.5 Seismic Geologic Hazards. 630.05.01. Fault Rupture. 630.5.2 Liquefaction.
630.05.02.01 Evaluation of Liquefaction Potential. 630.05.02.02 Minimum Factor of Safety Against Liquefaction. 630.05.02.03 Liquefaction Induced Settlement. 630.05.02.04 Residual Strength Parameters. 630.05.02.05 Flow Failures and Lateral Spreading.
630.5.3 Slope Instability. 630.05.03.01 Pseudo-Static Analysis. 630.05.03.02 Deformations.
630.6 Input for Structural Design. 630.6.1 Shallow Foundations. 630.6.2 Deep Foundations. 630.6.3 Earthquake Induced Earth Pressures on Retaining Structures. 630.6.4 Lateral Spread / Slope Failure Loads on Structures.
630.06.04.01 Displacement Based Approach. 630.06.04.02 Force Based Approach.
630.6.5 Mitigation Alternatives. 630.06.05.01 Structural Options 630.06.05.02 Ground Improvement.
630.7 Seismic Hazard and Site Response Analysis. 630.7.1 Background Information and Regional Seismicity. 630.7.2 Design Earthquake Magnitude. 630.7.3 Attenuation Relationships. 630.7.4 Site Specific Response Analysis.
630.07.04.01 Simplified Analysis: 630.07.04.02 Equivalent-Linear-One Dimensional Site Response Analysis: 630.07.04.03 Two Dimensional Site Response Analysis:
630.8 References.
SECTION 640.00 - SLOPE STABILITY 640.1 Introduction. 640.2 Design Parameters and Other Input Data for Slope Stability Analysis. 640.3 Design Requirements. 640.4 Safety Factors for Slope Stability Analysis. 640.5 Stability Analysis Computer Programs. 640.6 References.
SECTION 641.00 - ROCK SLOPE STABILITY 641.1 Mechanics of Rock Slope Stability.
641.1.1 Planar Failure.

Materials Geotechnical Analysis and Design 600.00
2015
641.1.2 Wedge Failure. 641.01.03 Toppling Failure. 641.01.04 Circular Failures. 641.01.05 Blasting.
641.2 Stabilization of Rock Slopes. 641.2.1 Tied Back Walls. 641.2.2 Shotcrete. 641.2.3 Buttresses. 641.2.4 Drainage. 641.2.5 Re-sloping and Unloading. 641.2.6 Trimming and Scaling. 641.2.7 Rock fall. 641.2.8 Benches. 641.2.9 Barriers. 641.2.10 Rock Slope Ratings.
641.3 References.
SECTION 645.00 – LANDSLIDES 645.01 References.
SECTION 648.00 - FILTRATION AND INFILTRATION 648.01 References.
SECTION 650.00 - EMBANKMENT DESIGN 650.1 Field Exploration and Laboratory Testing. 650.2 Design Considerations.
650.2.1 Rock Embankments. 650.2.2 Soil Embankments and Bridge Approach Embankments. 650.2.3 Placement of Fill Below Water.
650.3 Embankments for Water Detention / Retention. 650.4 Stability Assessment.
650.4.1 Safety Factors. 650.4.2 Strength Parameters. 650.4.3 Embankment Settlement Assessment.
650.04.03.01 Settlement Impacts. 650.04.03.02 Settlement Analysis. 650.04.03.03 Stress Distribution. 650.04.03.04 Rate of Settlement.
650.5 Stability Mitigation. 650.5.1 Staged Construction. 650.5.2 Base Reinforcement. 650.5.3 Ground Improvement. 650.5.4 Lightweight Fills.

Materials Geotechnical Analysis and Design 600.00
2015
650.5.4.1 Geofoam. 650.5.4.2 Lightweight Aggregate. 650.05.04.03 Wood Fiber. 650.05.04.04 Scrap Rubber Tires. 650.05.04.05 Light Weight Cellular Concrete.
650.05.05 Toe Berms and Shear Keys. 650.6 Settlement Mitigation.
650.6.1 Settlement Acceleration Using Wick Drains. 650.6.2 Settlement Acceleration Using Surcharges. 650.6.3 Lightweight Fill. 650.6.4 Over-excavation.
650.7 Construction Considerations. 650.7.1 Settlement and Pore Pressure Monitoring. 650.7.2 Instrumentation.
650.07.02.01 Piezometers. 650.07.02.02 Instrumentation for Settlement.
650.8 References.
SECTION 655.00 - GROUND IMPROVEMENT 655.1 Development of Design Parameters for Ground Improvement Analysis. 655.2 Design Requirements.
SECTION 660.00 - STRUCTURE FOUNDATIONS 660.1 Design Process for Structure Foundations. 660.2 Data Needed for Foundation Design. 660.3 Considerations for Foundation Selection. 660.4 Overview of LRFD for Foundations. 660.5 Loads, Load Groups and Limit States.
660.5.1 Foundation Analysis to Establish Load Distribution. 660.5.2 Downdrag Loads. 660.5.3 Uplift Loads Due to Expansive Soils. 660.5.4 Soil Loads on Buried Structures. 660.5.5 Service Limit States.
660.05.05.01 Foundation Movement. 660.05.05.02. Overall Stability Evaluation of Earth Slopes. 660.05.05.03. Abutment Transitions.
660.5.6 Strength Limit States. 660.5.7 Extreme Limit States.
660.6 Resistance Factors for Foundation Design, Design Parameters. 660.7 Resistance Factors for Foundation Design, Service Limit States. 660.8 Resistance Factors for Foundation Design – Strength Limit States. 660.9 Resistance Factors for Foundation Design – Extreme Limit States.

Materials Geotechnical Analysis and Design 600.00
2015
660.9.1 Scour. 660.9.2 Other Extreme Events Limit States.
660.10 Spread Footing Design. 660.10.1 Loads and Load Factor Application to Footing Design. 660.10.2 Foundation Design, Spread Footings.
660.10.02.01 Nearby Structures. 660.10.02.02 Service Limit State Design of Footings. 660.10.02.03 Strength Limit State Design of Footings. 660.10.02.04 Extreme Event Limit State Design of Footings.
660.11 Driven Pile Foundation Design. 660.11.1 Loads and Load Factor Application to Driven Pile Design. 660.11.2 Driven Pile Foundation, Geotechnical Design. 660.11.02.01 Driven Pile, Maximum Resistance. 660.11.02.02 Minimum Pile Spacing. 660.11.2.3 Lateral Pile Resistance. 660.11.2.4 Service Limit State Design of Pile Foundations.
660.11.2.4.1 Overall Stability. 660.11.02.04.02 Horizontal Movement.
660.11.2.5 Strength Limit State Design of Pile Foundations. 660.11.2.5.1 Scour. 660.11.2.5.2 Downdrag. 660.11.2.5.3 Determination Of Nominal Axial Pile Resistance In Compression. 660.11.02.05.04. Nominal Horizontal Resistance of Pile Foundations.
660.11.2.6 Extreme Event Limit State Design of Pile Foundations. 660.12 Construction of Driven Pile Foundations.
660.12.1 Pile Capacity. 660.12.2 Pile Points. 660.12.3 Pre-Drilling.
660.13 Drilled Shaft Foundations. 660.13.1 Loads and Load Factor Application to Drilled Shaft Design. 660.13.2 Drilled Shaft Geotechnical Design.
660.13.02.01 Nearby Structures. 660.13.2.2 Service Limit State Design of Drilled Shafts. 660.13.2.3 Strength Limit State, Geotechnical Design of Drilled Shafts. 660.13.02.04 Extreme Event Limit State Design of Drilled Shafts.
660.14 Micropiles. 660.15 Proprietary Foundation Systems. 660.16 References.
SECTION 670.00 - RETAINING STRUCTURES AND REINFORCED SLOPES 670.1 Wall Systems.

Materials Geotechnical Analysis and Design 600.00
2015
670.2 Geotechnical Data Required for Retaining wall and Reinforced Slope Design. 670.3 Walls and Slopes Requiring Additional Exploration.
670.3.1 Soil Nail Walls. 670.3.2 Walls With Ground Anchors. 670.3.3 Walls With Steep Back and Toe Slopes.
670.4 Field and Laboratory Testing for Retaining Walls and Reinforced Slopes. 670.5 Groundwater. 670.6 General Design Requirements.
670.6.1 Special Requirements. 670.6.2 Tiered Walls. 670.6.3 Back-to-Back Walls. 670.6.4 Walls on Slopes. 670.6.5 MSE Wall Supported Abutments. 670.6.6 Minimum Embedment. 670.6.7 Serviceability Requirements. 670.6.8 Earth Pressures. 670.6.9 Surcharge Loads. 670.6.10 Seismic Earth Pressures. 670.6.11 Liquefaction. 670.6.12 Overall Stability. 670.6.13 Wall Drainage. 670.6.14 Utilities. 670.6.15 Guardrail and Barriers.
670.7 Specific Design Requirements. 670.7.1 Abutments and Conventional Retaining Walls. 670.7.2 Non-gravity Cantilever and Anchored Walls.
670.07.02.01 Non-Gravity Ccantilever Walls. 670.07.02.02 Anchored/Braced Walls. 670.07.02.03 Permanent Ground Anchors. 670.07.02.04 Deadmen.
670.7.3 Mechanically Stabilized Earth (MSE) Walls. 670.7.4 Prefabricated Modular Walls. 670.7.5 Reinforced Slopes. 670.7.6 Soil Nail Walls.
670.8 References.
SECTION 675.00 - REVIEW AND ACCEPTANCE PROCEDURES FOR EARTH- RETAINING SYSTEMS
675.1 Background. 675.2 General Requirements. 675.3 Initial System Approval. 675.4 Wall Selection Procedure.

Materials Geotechnical Analysis and Design 600.00
2015
675.5 Economic Considerations for Wall Selection. 675.6 Conceptual Plan Preparation. 675.7 Bidding Instructions. 675.8 Requirements for Supplier-Prepared Design and Plans. 675.9 Materials Approval. 675.10 ITD Responsibility.
675.10.01: Initial System Approval. 675.10.02: Retaining System Selection. 675.10.03 Post-Award Design and Plan Review. 675.10.04: Construction.
SECTION 680.00 - SETTLEMENT ANALYSIS 680.1 Stress Analysis. 680.2 Immediate Settlement. 680.3 Consolidation Settlement. 680.4 Secondary Compression. 680.5 References.
SECTION 685.00 - SIGN AND SIGNAL STRUCTURES 685.1 Geotechnical Investigation. 685.2 Foundation Design.

Materials Geotechnical Analysis and Design 600.00
2015
SECTION 600.00 - GEOTECHNICAL ANALYSIS AND DESIGN
The focus of this Geotechnical Analysis and Design Section is to present methods and guidelines for developing design parameters for Geotechnical Design, Construction and Maintenance Support. Development of this manual section relied heavily on the Washington State DOT Geotechnical Design Manual for organization and content.
Typical Geotechnical activities include the following: • Subsurface field investigations• Field and laboratory characterization of soil and rock• Soil cut and fill slope stability• Embankment design• Subsurface ground improvement• Seismic site characterization and design parameters• Rock slope design• Landslide analysis and remediation• Structure foundation and retaining wall design• Infiltration and subsurface drainage• Preparation of Materials Phase Reports and special geotechnical reports• Site monitoring for geotechnical purposes• Design and Construction with geosynthetics• Research• Support to District and Headquarters Construction staff regarding geotechnical issues• Support to District and Headquarters Maintenance staff regarding geotechnical
problems that arise on the Statewide transportation system
The analysis methods and guidelines presented in this section should be performed by or under the supervision of a registered professional engineer, experienced in geotechnical analysis or a registered professional geologist with training and experience in geotechnical analysis.

Materials Field Investigations 601.00
2015
SECTION 601.00 – ROLE OF HEADQUARTERS AND DISTRICTS
The responsibility for geotechnical investigation and analysis rests in the District Materials Sections, with support of the Construction/Materials Section Geotechnical Engineer. The Geotechnical Engineer will provide detailed analysis and design recommendations as necessary, depending on the level of experience at the District level. The Geotechnical Engineer will review all analyses performed at the District Level.
Analyses and recommendations developed by Consultants shall be reviewed by the Districts and the Geotechnical Engineer. The Districts have primary responsibility for overseeing Consultant investigations as outlined in Section 400.00 of this manual. Responsibility for certain geotechnical analyses will be retained by the Geotechnical Engineer except when Consultants are responsible for design and/or will be administering the construction contract.
601.1 Coordination between Districts and Headquarters Regarding Emergency Response. The need for emergency geotechnical response is typically due to slope failure or structural foundation distress due to settlement, flooding or earthquake.
District Maintenance usually will make the initial assessment of the site of a slope failure or structural problem. District Materials is called out by District Maintenance to make a geotechnical assessment
District Materials performs a site review as soon as possible to assess the magnitude of the problem. District Materials informs the Geotechnical Engineer of the problem and either may request a joint review if the problem appears to require a detailed geotechnical assessment.
Recommendations from the initial geotechnical assessment will be evaluated by District Materials, Construction/Materials Section, and Maintenance personnel to determine if the problem presents a danger to the public. As a result, road closure or restriction may be necessary during a subsequent investigation and/or repair.
Depending on the scope of a proposed geotechnical investigation for the problem, a Consultant may be retained to perform the investigation and recommend solutions. The Consultant contract will typically be administered by District Materials. The Geotechnical Engineer and the District will jointly review the Consultants exploration plan, analysis and recommendations.
During stabilization activities, the point of contact for the construction activities will be the District Resident Engineer or District Materials Engineer for Consultant investigations. Multiple activities by several District and Headquarters’ offices will occur simultaneously in addressing emergency geotechnical problems, so frequent meetings or teleconferences between the various parties should be held throughout the duration of the repairs.
Investigations shall be conducted in accordance with the requirements of Section 400.00.

Materials Field Investigations 601.00
2015
601.2 Geotechnical Report Preparation and Review Process. The process of preparing and reviewing Materials Phase Reports is documented in Manual Section 210.00. Special Geotechnical Reports may include landslide investigations, specific problem studies for embankments, cut stability, retaining wall distress, structure foundation distress and drainage. The requirements for preparation of these Geotechnical Reports are presented in Manual Section 400.00.
The majority of these involve slope instability. Guidelines for reporting the results of landslide investigations are presented in Manual Section 430.06. The Geotechnical Reports are typically authored by the Geotechnical Engineer or jointly between the Geotechnical Engineer and the District Materials Section. If, due to time requirements, or equipment availability, the Department cannot respond to a geotechnical problem, Consultants may be retained to make the investigation. Pre-qualified Consultants may be chosen from the Term Agreements List. Where those reports are prepared by the Districts or Consultants, the review will be performed by the Geotechnical Engineer, and the District Engineer may approve the report or request approval by the Geotechnical Engineer.
Design recommendations for geogrid reinforced embankments, steepened slopes; subgrade stabilization, etc. are typically provided by the Geotechnical Engineer.
A second type of geotechnical report concerns construction support. Providing the results of Wave Equation analysis for pile driving is one example. The Pile Driving analysis is performed by the Geotechnical Engineer and transmitted to the District Resident Engineer.
601.3 Information for Bidders. There are three types of samples obtained during geotechnical exploration: disturbed soil samples (includes sack samples from test pits), undisturbed samples, and rock cores. Disturbed soil samples are most often used for index properties and classification, although they may be re-compacted and used for more sophisticated tests. Undisturbed samples are typically used for more sophisticated tests such as consolidation and strength tests. The undisturbed samples may also be used for classification and for evaluation of soil structure. Undisturbed samples degrade with time and are probably not suitable for the more sophisticated tests after from 3 to about 6 months, depending on moisture content and soil type and structure. Cohesionless soil samples are less affected by time.
Disturbed and undisturbed soil samples that have not been tested by the Districts, Headquarters’ Laboratory or a Consultant will be retained for a minimum of 90 days after the Materials Phase or Geotechnical Report is completed. Prior to disposal, Consultants shall contact the District Materials Engineer or Geologist so that they may take possession of the samples if so desired.
Rock cores are typically retained until after the construction project is complete, and it is clear that there are no claims related to the rock. After construction and the project is given final inspection, the cores may be disposed. Rock Cores recovered by Consultant exploration shall be delivered to the District Materials Section as part of the Geotechnical or Phase Report.
All soil and rock samples recovered by Consultants on ITD projects and delivered to the Department shall become the property of ITD.

Materials Field Investigations 601.00
2015
For more information on soil and rock sampling and care and preservation of samples, see Manual Sections 450.03.01, Soil Sampling, Section 450.03.02, Rock Sampling and Section 450.03.03, Sampling Methods Summary.
601.4 Geotechnical Designs and Their Basis. Technical policies and design requirements provided in this manual have been derived from national standards and design guidelines such as those produced by AASHTO, FHWA, USCOE, WSDOT and ITD sponsored research.
• AASHTO LRFD Bridge Design Specifications, most current edition plus interims• AASHTO Manual on Subsurface Investigations• FHWA Geotechnical Design Manuals• USCOE Engineering Manuals• NAVFAC DM-7• WSDOT Geotechnical Design Manual
(Link available to ITD Employees only.)
601.5 Geotechnical Construction Support Policy. Geotechnical support to Headquarters Construction, and support to District Resident offices must be technical in nature. Construction administration issues are left to the construction offices. District Materials Sections are the lead on technical construction issues. If the problem cannot be resolved at the District level, the District Materials Section or the Resident Engineer will solicit the assistance of the Geotechnical Engineer. Direct communications by the Geotechnical Engineer to the Contractor are to be avoided unless previously authorized by District construction personnel. Any communication in writing, including e-mail correspondence, must only communicate technical issues.
If potential Contractor claims are involved in the construction project, the Geotechnical Engineer will provide assistance to the District as requested.
Where a Consultant is retained to administer a construction project, geotechnical support will be provided at the request of the Consultant and will consist of only technical assistance or review. The District may request geotechnical review of Consultant’s recommended problem solution. When a Consultant is retained by the District to investigate a construction problem, District Materials and the Geotechnical Engineer will provide technical review of the Consultant’s recommendations.
Construction support, in the form of a wave equation analysis for pile driving criteria, analysis of test pile results, review and approval of Contractor’s geotechnical designs for retaining walls or temporary support systems, Contractor qualifications, and construction plans for geotechnical works, review and approval of geotechnical field testing performed by the Contractor, etc. will be provided by the Geotechnical Engineer. The results of the analysis or review shall be transmitted to the District Resident Engineer and to the District Materials Engineer. Where a Consultant is retained to do these works, the Geotechnical Engineer will act in a review capacity.
Blasting plans and rock slope stabilization submittals (rock bolts or rock-fall mitigation) will be reviewed at the District Level. The Geotechnical Engineer will provide technical review when requested by the District.

Materials Field Investigations 601.00
2015
601.6 Proprietary Retaining Walls. Preapproved wall manufacturers submittals of MSE wall designs will be reviewed by District Materials, the Bridge Design Section and the Geotechnical Engineer. The review of non-MSE walls, such as concrete cantilever walls and gabion walls will be made by the District Materials, Headquarters’ Bridge Design Section and the Geotechnical Engineer.
Criteria for proprietary retaining wall submittals for preapproval are presented in Section 675.00.

Materials Field Investigations 610.00
2015
SECTION 610.00 - FIELD INVESTIGATIONS
The requirements for field investigations are presented in Section 400.00. For guidelines for preparation of boring logs see Section 445.00, guidelines for Preparation of Subsurface Investigation Field Logs. Guidelines for field sampling and testing are presented in Section 450.00.
SECTION 615.00 - SOIL AND ROCK CLASSIFICATION
For detailed information on soil and rock classification, see Section 455.00.

Materials Engineering Properties of Soil and Rock 620.00
2015
SECTION 620.00 - ENGINEERING PROPERTIES OF SOIL AND ROCK
The purpose of this section is to identify appropriate methods of estimating soil and rock properties and how to use these properties to develop design parameters. The final properties to be used for design should be based on the results of field exploration and testing and the laboratory testing. Site performance data, if available, should be used to help determine the geotechnical design parameters. The Geotechnical Engineer, in coordination with District Materials, will determine which parameters and test methods are appropriate for a given project and then supervise the laboratory testing to develop those parameters. Where a Consultant is responsible for the investigation, the determination of the design parameters is the geotechnical Consultant’s responsibility subject to review by District Materials and the Geotechnical Engineer.
The focus of geotechnical design parameter development is the geologic strata that exist at the project site. An individual stratum is characterized by the same geologic depositional history and stress history. The characteristics, such as density, mineralogy, stress history and hydrogeology, have similarities throughout a given stratum. The physical and mechanical properties within any given stratum may vary significantly from point to point. Even if the properties at one point in a stratum may have more similarity to properties of a different stratum, soil and rock properties for design should not be averaged across stratum boundaries. Strength properties may also vary within a stratum, depending on depth below the top of a stratum or overburden stress; for instance, normally consolidated clays. Where the mechanical property varies in this manner, the variation should be taken into account in developing the design parameters.
Many soil and rock properties used for design vary depending on in-situ and laboratory test conditions. In-situ stresses, the presence of water or a water table or the rate and direction of loading during testing can affect the behavior of the material. It is important to determine how conditions may change over the life of a project. New surcharge loads may be applied due to construction of new embankments, for instance. Seasonal or more permanent changes in ground water level may increase or decrease in-situ stresses.
620.1 Methods of Determining Soil and Rock Properties. Subsurface soil or rock properties are typically determined using one or more of the following methods.
• In-situ or Field Testing during the Field Exploration Program.
• Laboratory Testing
• Analysis based on Site Performance Data.
Indirect determination based on correlations with other soil or rock properties.

Materials Engineering Properties of Soil and Rock 620.00
2015
620.2 In Situ Field Testing. The two most common in-situ tests for use in soil are the Standard Penetration Test (SPT) and the Cone Penetrometer test (CPT). Refer to Materials Manual Section 450.04.01- Field Testing for Soils and Section 450.04.02 – Field Testing for Rock for descriptions and applications of these and other in-situ tests. Guidelines for the interpretation of soil and rock properties are presented in FHWA-IF-02-034, “Evaluation of Soil and Rock Properties”, Geotechnical Engineering Circular No. 5, Sabatini et al (2002).
620.3 Laboratory Testing of Soil and Rock. Laboratory testing is an important part of any geotechnical investigation. The purpose of laboratory testing is to use repeatable procedures to confirm and/or refine the visual observations and field tests made during the field exploration program. Laboratory testing is intended to provide information on how a soil or rock will behave when subjected to the impact of the proposed project. Depending on the scope of the project, the laboratory testing program may be as simple as soil and rock classification or require more complex strength and deformation testing.
Improper storage, transportation and handling of samples can significantly alter the properties of soil and rock samples; particularly “undisturbed samples”. This can lead to erroneous test results and design parameters. The requirements of Manual Section 450, Guidelines for Sampling and Field Testing shall be followed. For additional information on handling samples, see ITD Laboratory Operations Manual.
Laboratories conducting geotechnical testing shall be AASHTO accredited meeting the requirements of AASHTO R18 for qualifying testers, test methods and equipment calibration for the tests being performed. In addition, consider the following guidelines for Laboratory testing of soils:
1. Protect samples to prevent moisture loss and structural disturbance.
2. Carefully handle undisturbed samples during extrusion; samples must be extruded properly andsupported upon their exit from the tube.
3. Avoid long term storage of samples in Shelby tubes.
4. Properly number and identify samples.
5. Store samples in properly controlled environments.
6. Visually examine and identify soil samples after removal of smear from the sample surface.
7. Use pocket penetrometer or miniature vane only for an indication of strength.
8. Carefully select “representative” specimens for testing.
9. Have a sufficient number of samples to select from.
10. Always consult the field logs for proper selection of specimens.

Materials Engineering Properties of Soil and Rock 620.00
2015
11. Recognize disturbances caused by sampling, the presence of cuttings, drilling mud, or otherforeign matter and avoid during the selection of specimens.
12. Do not depend solely on the visual identification of soils for classification.
13. Always perform organic content tests when classifying soils as peat or organic. Visualclassifications of organic soils may be very misleading.
14. Do not dry soils in overheated or underheated ovens.
15. Discard old worn-out equipment; old screens for example, particularly fine (< #40) mesh screensneed to be inspected and replaced often, worn compaction molds or compaction hammers (anerror in the volume of a compaction mold is amplified 30X when translated to unit volume.
16. Performance of Atterberg Limits requires carefully adjusted drop height of the Liquid Limitdevice and proper rolling of the Plastic Limit specimens.
17. Do not use tap water for tests where distilled water is specified.
18. Properly cure stabilization test specimens.
19. Never assume that all samples are saturated as received.
20. Saturation must be performed using properly staged back pressures.
21. Use properly fitted o-rings, membranes, etc. in triaxial or permeability tests.
22. Evenly trim the ends and sides of undisturbed samples.
23. Be careful to identify slickensides and natural fissures. Report slickensides and natural fissures.
24. Also, do not mistakenly indentify failures due to slickensides as shear failures.
25. Do not use unconfined compression test results (stress-strain curves) to determine elasticmodulus values.
26. Incremental loading of consolidation tests should only be performed after the completion ofeach primary stage.
27. Use proper loading rate for strength tests.
28. Do not guesstimate e-log p curves from accelerated, incomplete consolidation tests.
29. Avoid “Reconstituting” soil specimens, disturbed by sampling or handling, for undisturbedtesting.
30. Correctly label laboratory test specimens.
31. Do not take shortcuts; using no-standard equipment or non-standard test procedures.

Materials Engineering Properties of Soil and Rock 620.00
2015
32. Periodically calibrate all testing equipment and maintain calibration records.
33. Always test a sufficient number of samples to obtain representative results is variable material.
See Laboratory Operations Manual, Section 320.00, Soils Laboratory and Section 330.00, Geotechnical Laboratory for Laboratory testing information. For sample handling and test procedures, see Section 330.01, Preparing Samples and 330.03, List of Test Procedures.
620.4 Developing the Testing Plan. The amount of laboratory testing required for a project will depend on the nature of the project, the soils encountered and the amount of pre-existing site or structure information. Laboratory testing should be sufficient to provide the necessary data and design parameters as economically as possible. The requirements of the Materials Phase II – Soils Report and the Phase IV – Foundation Report are presented in Section 230.00 and Section 250.00 respectively. The requirements of investigations for various structures are presented in Section 405.00 through 440.00.
Laboratory testing should be performed on both representative and critical samples obtained from the various strata encountered. Critical areas are those where laboratory test results could result in significant changes to the project design. In general, index tests and soil classification are used to correlate a few, more complex, tests covering the range of soil properties across the site. The following should be considered when developing a testing program.
• Type of project (building, bridge, embankment, etc)
• Project dimensions
• Type and magnitude of loads to be imposed.
• Whether the loading duration will be short or long term
• Limitations on movement or deformation
• Horizontal and Vertical variation in the properties of the various strata encountered.
• Conditions requiring special attention (i.e. swelling soils, collapse potential, organics, earthquakerisk, etc.)
• Presence of slickensides, fissures, cementation, etc.
• Schedule and budget
A listing of the Laboratory Test methods is presented in the Laboratory Operations Manual, Sections 320.03 and 330.03.
On some projects, typically slope failures, the soil or rock properties may be developed from analysis of the failure mechanism. Back calculation of soil strength parameters from site conditions and the results

Materials Engineering Properties of Soil and Rock 620.00
2015
of inclinometer data are often performed in lieu of more detailed field and laboratory data due to safety and the need for more rapid results.
620.5 Engineering Properties of Soil. Soil Index Properties are primarily used for classification, but may also be used to estimate design parameters through correlations with performance. Index Properties are also used to extend performance test data across soil strata. Index tests include grain- size analysis and plasticity indices. Physical properties such as moisture content and density are also important in interpreting site data and choosing samples for more complex performance testing.
Grain-size analysis may include hydrometer analysis of material finer than the #200 sieve. Some project conditions will require a hydrometer analysis including liquefaction analysis and hydrologic analysis.
Laboratory performance testing is used to estimate strength, compressibility and permeability characteristics of soil and rock. In rock, the intact strength and the shear resistance of joints and seams within the rock mass are of most interest. In soil, strength parameters can be determined on undisturbed specimens of fine grained and cohesive soils and on remolded specimens where undisturbed samples are impossible or very difficult to obtain, such as in sandy or gravelly cohesionless soils. There are a variety of strength tests that can be used. The specific test in any instance will be dictated by the particular project applications. The Geotechnical Engineer provides guidance in determining the appropriate tests for each project. Additional guidance regarding the specific tests appropriate for various applications is presented in FHWA: IF-02-034, Geotechnical Engineering Circular #5 and in Section 400 of this Manual. A list of the current geotechnical test methods is presented in Laboratory Operations Manual, Section 330.03
It is difficult to get very accurate results from strength tests on remolded or disturbed specimens. These tests are most often used to supplement information from back analysis of existing slopes in slope stability analysis. The in-place density will not typically be known However, for estimating the strength parameters of compacted embankment material, tests on remolded specimens may provide more accurate results, since the physical properties of the compacted fill can be recreated in the laboratory Where the material contains a significant percentage of gravel-sized particles, fairly large test specimens are required, which may exceed the capacity of the laboratory equipment.
To limit the size of the test specimen to a size (3 or 4 inch diameter) that will not exceed the capacity of the triaxial compression test equipment, disturbed samples are sieved to remove gravel particles larger than ¼ of the test specimen diameter. In the direct shear test, the particle size must be restricted to about ¼ the thickness (typically 1 inch) of the test specimen. Disturbed material is compacted in a mold to a density and moisture content that simulates the field conditions.
If necessary to simulate in service conditions, saturation of either remolded or undisturbed triaxial test specimens is performed using appropriate back pressure methods. In saturated specimens the triaxial compression test can simulate drained conditions by measuring internal pore-pressures during the test. In the direct shear test, the test speed is reduced to the point that the specimen is fully drained during the test. Estimating the appropriate testing speed can be difficult. Multiple specimens should be tested using at least three different confining pressures. In triaxial compression tests, two or more confining

Materials Engineering Properties of Soil and Rock 620.00
2015
pressures may be applied to the same specimen, by increasing the confining pressure for the next stage to a level close to that of the effective compressive stress from the previous test.
Compressive strength, compressibility or permeability of existing finer grained soils must be determined using undisturbed samples. Disturbance adversely affects consolidation or compressibility tests by obscuring the preconsolidation pressure and retarding lateral drainage. Permeability of a soil is influenced by grain-size and the size and distribution of voids. Mineral composition and soil fabric significantly affect permeability in clays, but sands and gravels are primarily dependent on grain-size and distribution. Correlations between particle size and permeability are commonly available
620.6 Correlations for Estimating Engineering Properties of Soil. Correlations relating in-situ test results or laboratory index tests may be used to estimate, often preliminary, geotechnical design parameters. These index test results may be used in lieu of performance tests or in conjunction with performance tests to extend the results. If possible, multiple index test results should be used when correlating with the engineering properties of a geologic stratum.
The most common correlation is estimating the effective stress internal angle of friction in sands from the results of the Standard Penetration Test (SPT). The penetration test results must be corrected for overburden pressures and hammer efficiencies different from the standard 60%. The assumption may be made that the N value recorded in the field represents 60% efficiency. Depending on the type of hammer system used, the actual efficiency may be considerably different.

Materials Engineering Properties of Soil and Rock 620.00
2015
Use Table 620.06.1 to correlate SPT N-value results to relative density and internal angle of friction for sands with an overburden pressure of one ton per square foot.
Table 620.06.1: Relationship between Standard Penetration Resistance and Relative Density and Internal Angle of Friction for Cohesionless Soils (Modified from Mitchell and Katti, 1981)
Descriptive
Relative Density
Standard
Penetration
Resistance
N *
Relative Density Angle of
Internal
Friction
Φ
Blows / ft % Degrees
Very Loose < 4 < 15 < 30
Loose 4 - 10 15 - 35 30 - 32
Medium Dense 10 - 30 35 - 65 32 - 35
Dense 30 - 50 65 - 85 35 - 38
Very Dense > 50 85 - 100 > 38 * N-value at an effective vertical overburden pressure of one tsf.For sand with little or no fines, use the higher angle

Materials Engineering Properties of Soil and Rock 620.00
2015
Figure 620.06.1 can be used to correct the SPT N-values for the effective overburden pressures, where N is the measured value and N’ is the corrected value.
Figure 620.06.1: Correction of SPT N Value for Effective Overburden Pressure (Bazaraa, 1967)
Care must be exercised when using correlations of SPT results to soil engineering properties. Not all correlations are based on the standard N-values (60% efficiency) and often the soil will not meet the assumptions of the correlation. Fine uniform sands, silty sands and gravelly sands may not meet the requirements of the correlation. The angle of internal friction may higher for well drained gravelly soils and lower in dirty sands or fine uniform sands. Penetration resistance in gravel will often be erroneous. Individual particles may lodge in the driving shoe or the sampler may refuse on a cobble causing the blow counts to be unrealistically high. As pointed out in Materials Manual Section 450.04.01, soil heaving up into the casing when sampling below the water table can result in unrealistically low blow counts.

Materials Engineering Properties of Soil and Rock 620.00
2015
Table 620.06.2, correlation between Angle of Internal Friction and Static Cone Resistance is also modified from Mitchell and Katti (1981).
Table 620.06.2 Correlation between Angle of Internal Friction and Static Cone Resistance (Mitchell & Katti, 1981)
Descriptive Relative
Density
Static Cone Resistance
Qc
Angle of Internal
Friction , Φ’
Tons / sq ft Degrees
Very Loose < 50 < 30
Loose 50 - 100 30 - 32
Medium Dense 100 - 150 32 - 35
Dense 150 - 200 35 - 38
Very Dense > 200 > 38
Meyerhoff, (1976) extended the correlation to a Limiting Static Cone Resistance of 400 tsf. as in Table 620.06.3.
Table 620.06.3: Correlation between Static Cone Resistance (> 200 tsf) and Angle of Internal Friction (Meyerhoff, 1976)
Static Cone
Resistance
Qc
Angle of Internal
Friction
Φ’
Tons / Sq. Ft. Degrees
200 - 250 39 - 41
250 - 300 41 - 42
300 - 350 42 - 43
350 - 400 43 - 44
The CPT – Angle of Internal Friction correlation is also affected by the overburden pressure. The correlations above are assumed to be applicable to an overburden pressure of one ton per square foot. There are a number of relationships presented in “Shear Strength Correlations for Geotechnical Engineering” by Duncan, Holtz and Yang, Virginia Polytechnic University, August

Materials Engineering Properties of Soil and Rock 620.00
2015
1989. Correlations between Cone Penetration Resistance (CPT), SPT and Relative Density have been developed by the Bureau and Reclamation, 1974, and between CPT, SPT and mean grain size by Robertson and Campanella, 1984. Schmertmann, 1970, developed the following correlation between CPT tip resistance, uncorrected SPT and Soil Types in Table 620.06.4.
Table 620.06.4: Correlation between Soil Type, CPT Tip Resistance and SPT N-Value (Schmertmann, 1970)
Soil Type qc/N
Silts, sandy silts, slightly cohesive silt – sand mixtures 2.0
Clean, fine to medium sands and slightly silty sands 3.5
Coarse sands and sands with little gravel 5.0
Sandy gravel and gravel 6.0
Note: Units of qc are tons per square foot (tsf); units of N are blows per foot.
Correlations between cohesive soil strengths and Standard Penetration Resistance are not reliable. Therefore, the correlation in Section 445.02.15 should be considered as preliminary estimates only. The moisture content and degree of saturation can vary significantly affect the penetration resistance. The unconfined compressive strengths shown are assumed to be for the saturated condition.
Correlations between SPT blow count (N), and undrained shear strength for cohesive soils are approximate at best, and are best used for classification purposes. The SPT blow count will be highly dependent on the moisture content, sand or gravel content and sensitivity, and would be best suited to estimating the undrained strengths of relatively insensitive clays. The following relationship in Table 620.03.5 was presented by Terzaghi and Peck (1967).

Materials Engineering Properties of Soil and Rock 620.00
2015
Table 620.03.5: Correlation SPT N Value and Undrained Shear Strength of Cohesive Soils (Terzaghi & Peck, 1967)
Soil Consistency SPT
(N)
Su
(psf)
Very Soft < 2 < 250
Soft 2 - 4 250 - 500
Medium 4 - 8 500 - 1000
Stiff 8 - 15 1000 - 2000
Very Stiff 15 - 30 2000 - 4000
Hard > 30 > 4000
Sabatini, et al, (2002), provides correlations with soil properties other than those listed above. Local correlations may be based on local geology and comparisons with laboratory test data.
620.7 Engineering Properties of Rock. The properties of rock are typically controlled by the discontinuities within the mass rather than the properties of the intact rock. Developing engineering properties of rock much take into account both the properties of the intact material and the properties of the mass.
Intact rock properties are typically determined from laboratory tests such as compression, tension and shear tests on small samples, usually from cores. Rock mass properties are determined by visual examination of the discontinuities and their effect on the behavior of the mass. Original work on rock mass strength properties was published by Hoek and Brown (1988) and has been updated by Hoek et al (2002).
ASTM D5731 is the standard method of test to estimate uniaxial compressive strength of rock from point load tests. The results of the point load test are primarily intended as an aid to rock classification. Rock classification descriptions and the corresponding approximate uniaxial compressive strength ranges are shown in Section 450.04.02.

Materials Engineering Properties of Soil and Rock 620.00
2015
620.8 Final Design Values. After the field and laboratory testing is completed, the District Materials Engineer, District Geologist and the Geotechnical Engineer should review the data for consistency and validity. In addition to the field and laboratory information, the geotechnical project manager may have previous experience in the local area and with the geologic units encountered. Field and laboratory test data that is inconsistent with previous experience should be carefully evaluated to determine the reasons for the discrepancy.
The intent of the field and laboratory testing is to develop a geotechnical model of the individual geologic strata at the project site. The data for any given strata will show an inherent variability in the geotechnical properties. There is also variability due to the sampling and testing procedures. In addition to a review of the reliability of the test data, the variability should be evaluated. Sabatini, et al. (2002) provides a step by step method of analyzing data and variability
Guidance for developing final design parameters for various transportation-related projects is contained in Manual Section 400 - Guidelines for Subsurface Investigations.

Materials Engineering Properties of Soil and Rock 620.00
2015
620.9 References.
Bowles, J.E., (1979), Physical and Geotechnical Properties of Soils, McGraw Hill, Inc.
Duncan, J.M., Horz, R.C., Yang, T.L, (1989) “Shear Strength Correlations for Geotechnical Engineering”, Civil Engineering Dept., Virginia Polytechnic Institute, Blacksburg, VA.
Hoek E., and Brown, E.T., (1988), “The Hoek-Brown Failure Criterion – a 1988 Update”, Proceedings 15th Canadian Rock Mechanics Symposium, Toronto, Ontario, Canada.
Hoek, E., Carranza-Torres,C., and Corkum, B. (2002), “Hoek-Brown Criterion-2002 Edition”, Proceedings NARMS-TAC Conference, Toronto, Ontario, Canada.
Lunne, T. and Kleven, A., (1982), “Role of The CPT in North Sea Foundation Engineering”, Norwegian Geotechnical Institute Publication 139.
Meyerhoff, G.G., (1976), “Bearing Capacity and Settlement of Pile Foundations”, Journal of the Geotechnical Division, ASCE, Volume 102, GT3.
Mitchell J.K., and Katti, R.K., (1981), “Soil Improvement, State-of-The-Art Report, Proceedings Tenth International Conference of Soil Mechanics and Foundation Engineering, Stockholm, General Reports”, P 2 64.
Robinson, P.K., and Campanella, R.G., (1983),”Interpretation of Cone Penetrometer Tests- Part I ,Sand”, Canadian Geotechnical Journal, Vol. 20, No.4.
Robinson, P.K. and Campanella, R.G., (1984), “Guideline for Use and Interpretation of the Electronic Cone Penetrometer Test”, Soil Mechanics Series, No. 69, Dept. of Civil Engineering, The University of British Columbia, Vancouver, British Columbia, Canada.
Sabatini, P.J., Bachus, R.C., Mayne, P.W., Schneider, J.A., Zettler, T.E., (2002), Geotechnical Circular #5, “Evaluation of Soil and Rock Properties”, FHWA-IF-02-034.
Schmertmann, J.H., 1970, “Static Cone to Compute Static Settlement Over Sand” Journal of the Soil Mechanics and Foundation Engineering Division, American Society of Civil Engineers, Vol. 96, SM3.
Terzaghi, K., and Peck, R.B. (1967), Soil Mechanics in Engineering Practice, John Wiley, New York, NY.

Materials Seismic Design 630.00
2015
SECTION 630.00 - SEISMIC DESIGN
630.1 Seismic Design Responsibility. The Geotechnical Engineer in the Headquarters’ Construction/Materials Section is responsible for providing geotechnical seismic design parameters to the Districts and to the Bridge Sections upon request. The specific information includes design ground motion parameters, site response and input for evaluation of soil- structure interaction such as liquefaction and seismic earth pressures on retaining structures.
630.2 Seismic Design Policy and Objectives. The latest AASHTO Load and Resistance Factor Design (LRFD) specifications shall be followed for structural classification of bridges as Critical, Essential or Other. Most structures will fall in the “Other “category, with a few being “essential” or “critical”.
The seismic design philosophy is based on a low probability loss of life or serious injury due to structure collapse during seismically induced ground shaking. Small to moderate earthquakes should be resisted within the elastic range of the structural components without significant damage. Ground shaking due to large earthquakes should not cause collapse of all or part of the bridge. Realistic seismic ground motion intensities and forces should be used in design. Essential bridges are those which should be remain open at least to emergency vehicles and for security / defense purposes immediately following the design earthquake (1000 year return period – 7% probability of exceedence in 75 years). Critical bridges must remain open to all traffic immediately following the design earthquake and be useable for emergency vehicles immediately after a “large” earthquake, e.g. a maximum probable event defined as an event with a 2500 year return period (2% probability of exceedence in 50 years).
In keeping with the low potential for collapse, approach embankments and fills over cut and cover tunnels should be designed to remain stable during the design earthquake. The extent of the seismically designed embankments should be adequate to preclude collapse of the structure due to instability or loading imposed by the embankment. Typically the distance of evaluation and mitigation is within 100 ft. of the abutment or tunnel wall. Instability including hazards such as liquefaction, lateral spreading, downdrag, and settlement may require mitigation near the structure to ensure that the structure integrity is not compromised during the design earthquake. These hazards should be evaluated at internal pier locations to provide stable foundation conditions and minimize the potential for structural failure.
Retaining walls, including abutments, shall be evaluated for seismic stability both internally and externally. All walls supporting the roadway or walls more than 10 ft. high that are adjacent to the roadway should be designed to remain stable during the design earthquake. Walls less than 10 feet high adjacent to the roadway and walls more than 10 feet from the roadway have much lower risk to the traveling public. These may include retaining structures, unless they are supporting adjacent structures or buildings, and sound walls.

Materials Seismic Design 630.00
2015
It may not be practical to design walls for seismic forces where they are located on a marginally stable area such as an existing landslide. Such a wall usually has a very minor effect on a large marginally stable area, and it is not feasible to design a wall to stabilize an existing landslide during a seismic event. Seismic effects for sign structures, box culverts or buried structures need not be considered unless failure of the box culvert or buried structures will affect the function of the bridge.
630.2.1 Governing Design Specifications. The specifications applicable to seismic design of a given project depend upon the type of facility.
The most current version of the AASHTO Guide Specifications for LRFD Seismic Bridge Design (referred to in this manual as the AASHTO Guide Specifications) and the latest AASHTO LRFD Bridge Design Specifications shall be used for geotechnical seismic design, in addition to the ITD Geotechnical Manual and ITD Bridge LRFD Design Manual. The Geotechnical Manual provides specific application of the AASHTO Specifications to ITD design policy and practice.
The most current International Building Code (IBC) should be used for seismic design of new buildings and non-roadway infrastructure.
630.2.2 Additional Resources. In addition to the above-mentioned design specifications, geotechnical designers may utilize other resources that are available for geotechnical earthquake engineering to provide more detailed guidance in seismic design for design issues and areas not addressed in detail in the AASHTO specifications or herein. Four of these additional references are listed below:
1. FHWA Geotechnical Engineering Circular No. 3 (Kavazanjian, et al., 2011). This documentprovides design guidance for geotechnical earthquake engineering for highways, rangingfrom fundamentals, hazard analysis, site characterization, ground motion, site response,seismic slope stability, liquefaction, foundation and wall design as well as designexamples.
2. NCHRP Report 472 (ATC-MCEER Joint Venture, 2001 and 2002). This report contains thefindings of a study completed to develop recommended specifications for seismic designor highway bridges. The report covers design earthquakes and performance objectives,foundation design, and liquefaction hazard assessment and design. Of particular interestis a case-study on liquefaction assessment of a hypothetical bridge inWashington State, including the resulting lateral spreading induced loads.
United States Geological Survey (USGS) Website. www.usgs.gov. The USGS NationalHazard Mapping Project website assists in characterizing the seismic hazard for aspecific site. The website allows the user to Identify the USGS developed peak groundacceleration (PGA) on soft bedrock / very dense or hard soils and spectral accelerationordinates at periods of 0.2, 0.3 and 1 second for hazard levels of 2, 5 and 10 percentprobabilities of exceedence in 50 years. The 5% in 50 years is roughly equivalent to the

Materials Seismic Design 630.00
2015
7% in 75 years in the AASHTO Guide Specifications. It also provides interactive de- aggregation of a site’s probabilistic seismic hazard, useful in liquefaction hazard evaluation.
3. Idaho Geologic Survey Web site: www.idahogeology.org. This site presents aninteractive map of Miocene and younger faults in Idaho. A description of each fault isactivated by clicking on the fault or selecting the fault from the drop down list. This wasthe source of the faults shown in Figure 630.05.01.1
4. Geotechnical Earthquake Engineering Textbook: The textbook titled GeotechnicalEarthquake Engineering (Kramer, 1996) provides a wealth of information togeotechnical engineers for seismic design. Included are: a comprehensive summary ofseismic hazards, seismology, ground motion, seismic hazard analysis, dynamic soilproperties, ground response, liquefaction, slope stability, seismic design of retainingwalls and ground improvement.
Geotechnical seismic design is a rapidly developing sub-discipline. New resources, such as journal articles and research reports are increasingly available. Where new methods not given in the AASHTO Specifications or herein are proposed, the new methods shall be discussed with the Geotechnical Engineer before use on the project under consideration.
630.3 Geotechnical Seismic Design Considerations.
630.3.1 Overview of Design Options. Four basic options are available for seismic design. • Use specification / code based hazard (Section 630.04.01) with specification / code
based ground motion response (Section 630.04.02)• Use specification / code based hazard (Section 630.04.01) with site specific ground
motion response (Section 630.04.03)• Use site specific hazard (Section 630.04.03) with specification / code based ground
motion response (Section 630.04.02)• Use site specific hazard (Section 630.04.03) with site specific ground motion response
(Section 630.04.03)
630.3.2 Site Characterization. The geotechnical parameters required for seismic design depend on the type and importance of the structure or roadway feature, and the type of analysis planned. For most structures, specification based design criteria that are appropriate for the site conditions, may be all that is needed. Unusual, important and critical structures may require more detailed design requiring additional geotechnical parameters. Site conditions such as proximity to an active or potentially active fault or potentially unstable soils may require detailed geotechnical evaluation to quantify the geologic hazards.
With any geotechnical investigation, the goal is to characterize the site’s soil conditions and determine their effect on the proposed construction. Seismic design is a cooperative effort

Materials Seismic Design 630.00
2015
between the geotechnical and structural engineering areas. The geotechnical investigation should do the following as a minimum.
• Identify performance criteria (e.g., limiting settlements, collapse prevention, etc.) anddesign risk levels (e.g., 7% in 75 yrs.).
• Identify potential geologic hazards, (e.g., soft or liquefiable soils, fault rupture) and thevariability of the local geology.
• Identify the method by which risk-compatible ground motion parameters will beestablished.
• Identify the geotechnical analyses to be performed, such as site specific responseanalyses.
• Identify the engineering properties needed for these analyses.• Determine the methods to obtain these properties.• Determine the number and location of samples or field tests needed.
It is assumed that basic geotechnical investigations as outlined in Section 400.00 have been or will be conducted for the various transportation elements in the project. Additional subsurface data needed for seismic design would typically be obtained as a part of the basic study. Additional exploration is usually not necessary for seismic design. However, the field testing and sampling programs may need adjustment to obtain the necessary seismic design parameters. Geophysical methods may be needed to provide shear velocity data. Rotary drilling methods may be needed for liquefaction analysis. It may be necessary to extend at least one boring to develop an adequate shear wave velocity profile. The goal is to develop the subsurface profile and soil property information needed for seismic analysis. Soil parameters generally needed for seismic design include:
• Shear wave velocities or dynamic shear modulus at small strains;• Equivalent viscous damping ratio;• Shear modulus reduction and damping characteristics as a function of shear strain;• Peak and residual cyclic shear strength parameters;• Liquefaction resistance parameters.
Table 630.03.02.1 is adapted from WSDOT (after Sabatini, et al., 2002) and provides a summary of the site characterization needs and testing considerations for geotechnical seismic design.

Materials Seismic Design 630.00
2015
Table 630.03.02.1: Summary of Site Characterization Needs and Testing Considerations for Seismic Design (modified from WSDOT GDM Table 6-1)
Geotechnic al
Issues
Engineering Evaluations
Necessary Information for Analyses
Field Testing Lab. Testing
Site Response
◦ Source characterization and ground motion attenuation
◦ Site response spectra
◦ Time History
◦ Subsurface profile (soil,groundwater, depth to rock) ◦ Shear wave velocity ◦ Shear modulus at low strains ◦ Shear modulus reduction with increasing shear strain ◦ Equivalent viscous damping ratio ◦ Poisson’s ratio ◦ Unit weight ◦ Relative density ◦ Seismicity (design earthquakes-source, distance, magnitude, recurrence).
◦ SPT ◦ CPT ◦ Seismic
cone ◦ GeophysicalTesting (shear wave velocity) ◦ Piezometer
◦ Cyclic Triaxial ◦ Atterberg Limits ◦ Specific Gravity ◦ Unit Weight ◦ Resonant Column ◦ Cyclic direct simple
shear ◦ Torsional simple
shear
Geologic Hazards Evaluation (e.g., liquefactio n, lateral spreading, slope stability)
◦ Liquefaction susceptibility
◦ Liquefaction induced settlement
◦ Settlement of drysands
◦ Lateral spreading ◦ Slope Stability and
deformations
◦ Subsurface profile ◦ Shear strengths (peak and
residual) ◦ Unit weights ◦ Grain Size Distribution ◦ Plasticity ◦ Relative Density ◦ Penetration Resistance ◦ Shear wave Velocity ◦ Seismicity (Peak ground
acceleration, design earthquake ground motion).
◦ Site topography
◦ SPT ◦ CPT ◦ Seismic cone ◦ Becker
Penetration test
◦ Vane shear◦ Piezometers ◦ Geophysical
testing (shear wave velocity.)
◦ Soil shear tests ◦ Triaxial tests
include cyclic ◦ Grain size distr. ◦ Atterberg Limits ◦ Specific gravity ◦ Organic content ◦ Moisture content ◦ Unit Weight
Input for Structural Design
◦ Soil stiffness for shallow foundation (e.g. Spring)
◦ P-y data for deep foundations
◦ Down drag on deep foundations
◦ Residual strength ◦ Lateral earth
pressures ◦ Lateral spreading/
slope movement loading
◦ Post earthquake settlement
◦ Subsurface profile (soil,groundwater, rock)
◦ Shear strength (peak and residual)
◦ Seismic horizontal earth pressure coefficients
◦ Shear Modulus at low strains or shear wave velocity.
◦ Shear Modulus / Strain relationship
◦ Unit weight ◦ Poisson’s ratio ◦ Seismicity, PGA, design
earthquake, Response spectrum, ground motion
◦ Site topography
◦ CPT ◦ SPT ◦ Seismic cone ◦ Piezometers ◦ Geophysical
testing (shear wave velocity.)
◦ Vane Shear
◦ Triaxial tests ◦ Soil shear tests ◦ Unconfined
compression ◦ Grain size
distribution ◦ Atterberg limits ◦ Specific gravity ◦ Moisture content ◦ Unit weight ◦ Resonant column ◦ Cyclic direct simple
shear test ◦ Torsional simple
shear test

Materials Seismic Design 630.00
2015
630.3.3 Soil Profile. Section 620.00 of this manual covers the development of design parameters from the results of the field exploration and field and laboratory test programs. For routine designs, in-situ field testing or laboratory testing to develop parameters such as the dynamic shear modulus at small strains, equivalent viscous damping, shear modulus and damping ratio characteristics versus shear strain and residual shear strength are generally not done. Instead, correlations based on index properties may be used to estimate these values. More rigorous testing and analysis may be needed for critical or unusual structures.
The AASHTO LRFD Bridge Design Specifications, Section 3.10.3.1 establishes six site classes depending on the shear wave velocity of the soil profile in the uppermost 100 ft. The geotechnical investigation shall be of sufficient scope to define the appropriate soil profile. To define the site specific period of vibration of the soil column, at least one boring must extend to bedrock or to a very stiff soil layer. In the absence of rock or very stiff soils, one boring should extend to a depth of at least 100 feet. In addition to the soil and rock parameters developed in a typical geotechnical investigation, parameters such as relative density, shear wave velocity, and peak and residual shear strength are needed for seismic response analysis. Relative density is commonly estimated using SPT or CPT data. See Section 620.06. Shear wave velocity is most often measured in the field using Cross-hole or Down-hole geophysical surveys or more recently spectral analysis of surface waves. The surface wave velocity and the shear wave velocity are usually within 5% of each other in most soils. Peak and residual shear strengths are typically measured in direct shear tests. The shear wave velocity may be estimated based on average SPT blow count or average undrained shear strength.
If a site specific ground motion response analysis is conducted, field measurements of the shear wave velocity should be obtained. Correlations between field measurements of compression wave velocity and shear wave velocity may be satisfactory. Table 630.03.03.2 shows typical values of shear modulus for various soil types.
Table 630.03.03.2: Typical Values of Initial Shear Modulus (Modified from Table 5 Kavazanjian, et al, 1997)
Type of Soil Initial Shear Modulus, Gmax (ksf)
Soft Clays 55 - 285
Firm Clays 145 - 720
Silty Sands 575 - 2880
Dense Sands and Gravels 1200 - 7200

Materials Seismic Design 630.00
2015
If correlations are used to obtain soil properties for seismic design, and site- or region-specific relationships are not available, then the following correlations should be used.
• Table 630.03.03.3, which presents correlation for estimating initial shear modulus basedon relative density, penetration resistance or void ratio.
• Shear modulus reduction curves and equivalent viscous damping ratios for sands as afunction of shear strain and depth shown in Figure 630.03.03.1 and Figure 630.03.03.2which respectively show shear modulus reduction curves and equivalent viscousdamping ratios for fine grained soils as a function of cyclic shear strain and plasticityindex.
• Figures 630.03.03.3 through 630.03.03.5 present charts for estimating undrainedresidual strength for liquefied soils from SPT blow counts. A weighting scheme shouldbe used to average the results of all of these figures. Table 630.03.03.4 is an example ofa weighting scheme recommended by Kramer (2008). Geotechnical designers shouldfamiliarize themselves with the assumptions underlying these correlations beforeselecting a final weighting scheme for a project.
Other property value correlations may be used after discussing with the Geotechnical Engineer. Alternate correlations based on CPT data may also be considered. Regional or project specific correlations for these seismic design properties are strongly recommended.
Two curves are shown in Figure 630.03.03.4. One curve is for use when void redistribution is likely and the other when void redistribution is not likely. Void redistribution is more likely if a relatively thick liquefiable layer is capped by a relatively impermeable layer. Use of this figure will need engineering judgment to determine which curve to use.
These correlations are based on the response of a range of soil types and the behavior of any specific soil may depart significantly from these averages. Conduct sensitivity studies to determine the effects of variation in properties on the design. Typical variations are:
• In situ shear wave velocity : 10 to 20%• Shear modulus and viscous damping versus shear strain: 20%• Residual strength: 20%
There are a number of correlations between SPT, N value and Gmax for cohesionless soils and between Over-consolidation Ratio, Void Ratio and Gmax for cohesive soils.

Materials Seismic Design 630.00
Table 630.03.03.3: Correlations for Estimating Initial Shear Modulus
Reference Correlation (1) Units Limitations
Seed et al. (1984) 𝐺𝐺𝑚𝑚𝑚𝑚𝑚𝑚 = (𝐾𝐾2)𝑚𝑚𝑚𝑚𝑚𝑚(𝜎𝜎′𝑚𝑚)1 2⁄
(𝐾𝐾2)𝑚𝑚𝑚𝑚𝑚𝑚 = 20(𝑁𝑁)1 3⁄
ksf (2)
(𝐾𝐾2)𝑚𝑚𝑚𝑚𝑚𝑚 is about 30 for very loose sands and 75 for very dense sands; about 80 to 180 for dense well graded gravels; limited to cohesionless soils.
Imai and Tonouchi (1982)
𝐺𝐺𝑚𝑚𝑚𝑚𝑚𝑚 = 325𝑁𝑁0.68 ksf Limited to cohesionless soils
Mayne and Rix (1993)
𝐺𝐺𝑚𝑚𝑚𝑚𝑚𝑚 = 0.1(𝑃𝑃𝑚𝑚)0.305(𝑞𝑞𝑐𝑐)0.695 (𝑒𝑒𝑜𝑜)1.13⁄ ksf (3) Limited to cohesive soils
Notes: • Modified from Washington DOT Geotechnical Manual, Table 6.2; original pressures in
Kpa • σ’m is overburden pressure at mid-depth, in ksf • Pa is atmospheric pressure (2116 psf), qc is CPT tip resistance in psf and eo is soil void
ratio
The shear modulus, G, is the parameter used to develop the dynamic properties of the soil profile. Shear modulus at very low strain (Gmax) can be estimated directly from SPT, but must be reduced for larger strain levels. A soil strain of 0.1% is recommended in Kavazanjian, et al, FHWA Geotechnical Circular No. 3, 1997 for earthquakes of Magnitude 6.0 and ground accelerations of 0.4g or less. Very large earthquakes could produce strains approaching 1% or more.
Shear modulus Gmax is related to shear wave velocity by:𝐺𝐺𝑚𝑚𝑚𝑚𝑚𝑚 = 𝜌𝜌𝑚𝑚(𝑉𝑉𝑠𝑠)2 Where 𝜌𝜌 = 𝛾𝛾𝑡𝑡 𝑔𝑔⁄ or total unit weight (pcf) divided by the acceleration of gravity (32.19 ft/sec2). Gmax is in psf, Vs is shear wave velocity in ft/sec.
The natural frequency or period of the soil profile is related to the shear wave velocity by the following: 𝑇𝑇𝑠𝑠𝑜𝑜𝑠𝑠𝑠𝑠 = 4𝐷𝐷 𝑉𝑉𝑠𝑠⁄ Where: 𝑇𝑇𝑠𝑠𝑜𝑜𝑠𝑠𝑠𝑠 = Period of soil column in seconds.
𝑉𝑉𝑠𝑠 = 2/3 the weighted average shear wave velocity of the soils underlying the site to the depth D D = Depth of soil to the point where the shear wave velocity equals or exceeds 2500 fps
1/14

Materials Seismic Design 630.00
2015
Shear Modulus Reduction Curves For Sand 1.2
1
0.8
0.6
0.4
0.2
0 0.000 0.001 0. Shear Strain % 1.0 10. 01 0.1
Damping Ratios for Sand
35
30
25
20
15
10
5
0
0.0001 0.001 0.01 0.1 1.0 10.0 Shear Strain %
Figure 630.03.03.1 Shear Modulus Reduction and Damping Ratio Curves for Sand (Modified from WSDOT GDM Figure 6-1 after EPRI , 1993)
0 - 20 ft. 20 - 50 ft 50 - 120 ft 120 - 250 ft 250 - 500 ft 500 - 1000 ft
0 - 20 ft ft 500 -1000
0 - 20 ft 0-20 ft 20-50 ft 50-120 ft 120-250 ft 250-500 ft 500-1000 ft
500 - 100 0 ft
Dam
ping
Rat
io %
G
/Gm
ax

Materials Seismic Design 630.00
2015
Figure 630.03.03.2: Shear Modulus Reduction and Damping Ratio Curves for Fine Grained Soil (Modified from WSDOT GDM Fig. 6-2 and 6-3 After Vucetic and Dobry, 1991)

Materials Seismic Design 630.00
2015
1400
1200
1000
800
600
400
200
0 0 4 8 12 16 20 24
Equivalent Clean Sand SPT Corrected Blowcount (N1)60
Figure 630.03.03.3: Equivalent Undrained Residual Shear Strength for Liquefied Soils as a Function of SPT Blow counts (Idriss and Boulanger, 2007) (Modified from WSDOT Geotechnical
Design Manual Figure 6.4)
Figure 630.03.03.4: Estimation of Residual Strength Ratio from SPT Resistance (Idriss and Boulanger, 2007) (Adapted from WSDOT GDM Fig. 6.6)
● Earthquake-induced liquefaction and slidingcase histories where SPT data and residual strength parameters have beenmeasured.
SPT data corrected for fines content
Und
rain
ed R
esid
ual S
hear
Str
engt
h - p
sf

Materials Seismic Design 630.00
2015
Figure 630.03.03.5: Variation of Residual Strength Ratio with SPT Resistance and Initial Vertical Effective Stress Using Kramer-Wang Model (Kramer, 2008)
(Adapted from WSDOT GDM Fig. 6-7)
Table 630.03.03.4: Weighting Factors for Residual Strength Estimation (Kramer, 2008) (Adapted from WSDOT GDM Table 6-3)
Model Weighting Factor
Idriss 0.2
Olson – Stark 0.2
Idriss – Boulanger 0.2
Hybrid 0.4

Materials Seismic Design 630.00
2015
630.3.4 Information for Structural Design. The geotechnical designer, Geotechnical Engineer, District Materials (with the concurrence of the Geotechnical Engineer) or geotechnical Consultant, shall recommend a design ground motion, and shall evaluate geologic hazards for the project. For code-based seismic ground motion analysis, the geotechnical designer shall provide the expected Site Class B Peak Ground Acceleration (PGA) and spectral accelerations at periods of 0.2 and 1.0 seconds, and the multipliers to the PGA and spectral accelerations for the project Site Class. The Site Class determination includes consideration of the site soils up to the ground surface, not just the soil below the foundation. In addition, the geotechnical designer should evaluate the site and soil conditions to the extent necessary to provide the following design parameters.
• Foundation spring values for both lateral and vertical dynamic loading and geotechnicalparameters for evaluation of sliding resistance appropriate for foundation design. Ifliquefaction is possible, provide the spring values for liquefied conditions.
• Earthquake induced earth pressures for retaining structures and below grade walls andother needed geotechnical parameters such as sliding resistance.
• If requested, passive soil springs for use in modeling the abutment fill resistance toseismic motion of the bridge.
• Impacts of seismic geologic hazards including fault rupture, liquefaction, lateralspreading and slope instability on the project. Include estimated loads anddeformations acting on the structure due to seismic hazard.
• When requested, provide information on the potential for incoherent ground motionsfor long bridges.
• Options to mitigate seismic geologic hazards, such as ground improvement, e.g.,vibrofloatation, vibroreplacement, drainage, dynamic compaction, etc. Geotechnicalseismic design parameters should reflect the hazard mitigation.
630.4 Seismic Hazard and Site Response. For most projects, design code ( based seismic hazard and site response are appropriate and should be used. More critical facilities or projects, where the use of code response spectra may result in unconservative design, may require more detailed analysis such as probabilistic seismic hazard analysis and or site-specific response analysis. Sites within 6 miles of an active or probably active fault will require site-specific analysis. See Figure 630.05.1 for locations of active fault. A site-specific seismic hazard analysis should be considered if information regarding active or potentially active seismic sources postdates the USGS / AASHTO Seismic Hazard Maps and may result in significant changes in the seismic hazards at the site.
Site-specific seismic hazard analysis should also be performed for facilities identified as critical or essential, at sites where geologic conditions will likely result in unconservative spectral accelerations if the code response spectra are used, and where site subsurface profiles are classified as Site Class F. Table 630.04.1 describes the Site Classes A through F.

Materials Seismic Design 630.00
2015
Site-specific seismic hazard analysis should also be considered for sites where the effects of liquefaction could cause the code-based ground motion response to be overly conservative or unconservative, or where the site subsurface conditions do not adequately fit the AASHTO or IBC site classes.
Site-specific response analysis shall be conducted in accordance with AASHTO Guide Specifications and procedures in Section 630.07. Where the response spectrum is developed using site-specific analysis and / or a site-specific response analysis, the AASHTO specifications require that the spectrum not be lower than two-thirds of the response spectrum at the ground surface determined by the code-based procedure in the AASHTO Guide Specifications, Article 3.4.1, adjusted by the site coefficients (FPGA) in Article 3.4.2.3 in the region of 0.5 TF to 2.0 TF of the response spectrum. TF is the fundamental period of the structure. For liquefaction analyses and retaining wall design, the ground surface acceleration developed in a site-specific analysis should not be less than two-thirds of the PGA as adjusted by the specification-based site coefficient FPGA.
There are currently no site coefficients for liquefiable sites or for Site Class F. When estimating the minimum ground surface response spectrum using two-thirds of response spectrum from the procedures in the AASHTO Guide Specifications, The following approach should be used.
• For liquefiable sites, use the specification-based site coefficient for soil conditionswithout liquefaction. This is believed to be conservative for higher frequency motions(TF < 1.0 sec). If a site-specific ground response analysis is used, the recommendedresponse spectrum should be no lower than two-thirds of the non-liquefiedspecification-based spectrum. For structures having fundamental periods (TF) greaterthan 1.0 sec., a site-specific ground response analysis should be considered if liquefiablesoils are present.
• For Site Class F sites, conduct a site-specific ground response analysis.
630.4.1 Determination of Seismic Hazard Level. All non-critical transportation structures including bridges and walls shall be designed for no-collapse based on a risk level of 7% probability of being exceeded in 75 years. This is essentially the same as 5% probability of being exceeded in 50 years (recurrence interval of 1000 years) Figure 630.04.01.1 shall be used to estimate the Peak Ground Acceleration on bedrock or firm ground (shear wave velocity 2500 fps or higher) for ITD transportation facilities, unless a site specific seismic hazard evaluation is conducted in accordance with Section 630.07.
Figures 630.04.01.1, 630.04.01.2 and 630.04.01.3, shall be used to estimate PGA, and the spectral accelerations at 0.2 sec. (SS) and 1.0 sec. (S1) unless a site response analysis is performed as discussed in Section 630.07. PGA, Ss and S1 are applied to Site Class B (very hard or very dense soil or soft rock conditions, shear wave velocity 2500 fps or higher). The PGA contours in Figure 630.04.01.1, and those of SS and S1 in Figure 630.04.01.2 and Figure 630.04.01.3 respectively, are based on information published by the USGS (Seismic Design Parameters 2008) and included in the AASHTO LRFD Bridge Design Specifications. When

Materials Seismic Design 630.00
2015
estimating a PGA for Site Class B for a project, interpolation between contours should be used in Figure 630.04.01.1. Acceleration coefficients are expressed in percent of gravity.
All critical transportation structures, as designated by the ITD Bridge Design Engineer, shall be designed based on a risk level of 2% probability of being exceeded in 50 years (an approximate 2,500 year recurrence interval). For critical structures, the most current seismic hazard mapping, for this probability level, from the USGS National Seismic Hazards Mapping Project should be used to estimate the PGA and spectral acceleration coefficients unless a site specific seismic hazard evaluation is conducted in accordance with Section 630.07.
If a probabilistic, site–specific seismic hazard analysis is conducted, it shall be conducted in a manner to generate a uniform-hazard acceleration response spectrum for the chosen probability of exceedence over the entire period range of interest. This analysis shall follow the same basic approach used by the USGS in developing the seismic hazard maps in the AASHTO Guide Specifications. The following are necessary
• The contributing seismic sources• A magnitude fault-rupture-length or source area relationship for each contributing fault
or source area to estimate an upper-bound or maximum credible earthquake magnitudefor each fault or source zone.
• Median attenuation relations for acceleration response spectral values and theirassociated standard deviations.
• A magnitude-recurrence relationship for each fault and source area used.• Weighting factors, with justification, for all branches of logic trees used to establish
ground shaking hazards.
AASHTO allows site-specific ground motion hazard levels to be on a deterministic seismic hazard analysis (DSHA) in regions of known active faults, provided that deterministic spectrum is no less than two-thirds of the probabilistic spectrum (see AASHTO Article 3-10.2.2). This requires that:
• Ground motion at a particular site is largely from known faults, not random seismicity.• The recurrence interval for large earthquakes on the known faults are generally less
than the return period corresponding to the specified seismic risk level (1000 years orless if the risk level is 7% in 75 years).
These conditions are generally not met in Idaho except possibly along the Montana- Wyoming- Idaho border (Yellowstone vicinity) or along the Lost River Fault.
Where a deterministic spectrum is appropriate, the spectrum shall be either: • The envelope of a median spectra calculated for characteristic maximum magnitude
earthquakes on known active faults; or• The deterministic spectra for each fault, ad in the absence of a clearly controlling
spectrum, each spectrum should be used.

Materials Seismic Design 630.00
2015
If the site specific deterministic seismic hazard analysis is combined with a site specific ground motion response analysis, the ordinates of the response spectrum may be as low as two-thirds of the response spectrum at the ground surface using the specification based procedures in Articles 3.4.1 and 3.4.2.3 of the AASHTO Guide Specifications in the region of 0.5 TF to 2TF. The same would apply to the free field acceleration AS in this case.
If a site-specific hazard analysis is not conducted, design response spectra shall be constructed using the response spectral accelerations (PGA, SS and S1) taken from Figures 630.04.01.1, 630.04.01.2 and 630.04.01.3 and the site factors in Tables 630.04.01.1 and 630.04.01.2.

Materials Seismic Design 630.00
2015
Table 630.04.01.1: Site Classes for Seismic Design
Site Class Soil Type and Profile
A Hard Rock with an average measured shear wave velocity, VS ≥ 5000 fps
B Rock with 2500 fps ≤ VS < 5000 fps
C Very dense soil and soil rock mixtures with 1200 fps ≤ VS < 2500 fps, or NAVG > 50 blows per foot or Avg. Su > 2.0 ksf
D Stiff soil with 600 fps ≤ VS < 1200 fps or with either 15 blows / ft < NAVG ≤ 50 blows / ft or 1.0 ksf < Avg. Su ≤ 2.0 ksf
E Soil profile with avg. VS < 600 fps or with either NAVG < 15 blows / ft. or Su < 1.0 ksf, or any profile with more than 10 ft. of soft clay ( PI > 20, w >40% and Su < 0.5 ksf)
F Soils requiring site-specific ground motion response evaluations, such as Peats or highly organic clays (H > 10 ft of peat or highly organic clay, Very high plasticity clays (H > 25 ft. with PI = >75) Very thick soft / to medium stiff clays (H > 120 ft.)
Exceptions: Where the soil properties are not known in sufficient detail to determine the site class, a site investigation shall be undertaken sufficient to determine the site class, Site Class E or F should not be assumed unless the authority having jurisdiction determines that Site Class E or F could be present at the site or in the event that Site Class E or F is established by geotechnical data.
Where: VS = average shear wave velocity for the upper 100 feet of the soil profile as defined below. NAVG = average standard penetration resistance test (SPT) blow count (blows per ft, ASTM
D1586) for the upper 100 feet of the soil profile as defined below. Su = average undrained shear strength in ksf (ASTM D2166 or D2850 for the upper 100 feet
of the soil profile as defined below. PI = Plasticity Index (ASTM D4318) w = moisture content (ASTM D 2216) H = Soil layer thickness Average values of shear wave velocity, SPT blow count, and undrained shear strength are determined by dividing the sum of the individual layer thicknesses by the sum of the individual layer thickness divided by the value of the desired parameter in that layer. ie. Σ di/ Σ (di/VS) as i goes from 1 to n

Materials Seismic Design 630.00
Table 630.04.01.2: Steps for Site Classification (Table C3.10.3.1-1, AASHTO LRFD Bridge Design Specifications, 2008)
Step Description
1 Check for the three categories of Site Class F in Table 630.04.01 requiring site specific evaluation. If the site corresponds to any of these categories, classify the site as Class F and conduct site-specific evaluation
2 Check for the existence of a soft layer with total thickness > 10 ft., where soft layer is defined by Su < 0.5 ksf, w > 40%, and PI > 20. If these criteria are met, classify site as Site Class F.
3
Categorize the site into one of the site classes in Table 630.04.01 using one of the following 3 methods to calculate:
Vs for the top 100 feet (Vs method)
N for the top 100 feet ( N method)
Nch for the cohesionless soil layer (PI <20) in the top 100 feet and Su for cohesive soil layers (PI > 20) in the top 100 feet (Su method)
To make these calculations, the soil profile is subdivided into n distinct soil and rock layers, and in the methods below the symbol i refers to any one of these layers from 1 to n.
Method A: Vs method
The average Vs for the top 100’ is determined as
𝑽𝑽𝑽𝑽 = ∑ 𝑑𝑑𝑑𝑑𝑛𝑛𝑠𝑠=1
∑ 𝑑𝑑𝑑𝑑/𝑉𝑉𝑉𝑉𝑑𝑑𝑛𝑛𝑠𝑠=1
where ∑ 𝑑𝑑𝑑𝑑𝑛𝑛𝑠𝑠=1 = 100 ft.
Vsi = shear wave velocity of a layer, ft./sec.
di = thickness of a layer between 0 and 100 feet deep .
Method B: N method
The average N for the top 100 feet shall be determine as
𝑵𝑵 = ∑ 𝑑𝑑𝑠𝑠𝑛𝑛𝑖𝑖=1
∑ 𝑑𝑑𝑠𝑠/𝑁𝑁𝑠𝑠𝑛𝑛𝑖𝑖=1
where
Ni = Standard Penetration Test blow count for a layer (not to exceed 100 blow/ft.)
1/14

Materials Seismic Design 630.00
3 (cont)
Method C: Su method
The average Nch for cohesionless soil layers in the top 100 feet is determined as:
𝑁𝑁𝑐𝑐ℎ = 𝑑𝑑𝑠𝑠∑ 𝑑𝑑𝑠𝑠/𝑁𝑁𝑐𝑐ℎ𝑠𝑠𝑚𝑚𝑖𝑖=1
In which
∑ 𝑑𝑑𝑑𝑑𝑚𝑚𝑠𝑠=1 = 𝑑𝑑𝑉𝑉
where
m = number of cohesionless soil layers in the top 100 feet.
Nchi = blow count for a cohesionless soil layer (not to exceed 100 blows/foot)
ds = total thickness of cohesionless soil layers in the top 100 feet.
The average Su for cohesive soil layers in the top 100 feet is determined as:
𝑆𝑆𝑆𝑆 = 𝑑𝑑𝑑𝑑
∑ 𝑑𝑑𝑑𝑑/𝑆𝑆𝑆𝑆𝑑𝑑𝑘𝑘𝑠𝑠=1
in which
∑ 𝑑𝑑𝑑𝑑𝑘𝑘𝑠𝑠=1 = 𝑑𝑑𝑑𝑑
where
k = number of cohesive soil layers in the top 100 feet
Sui = undrained shear strength for a cohesive soil layer ( not to exceed 5.0 ksf)
dc = total thickness of cohesive soil layers in the top 100 feet.
Note: When using Method C, if the site class resulting from Nch and Su differs, select the site class that gives the highest site factors for design spectral response in the period of interest. For example, if Nch was equal to 20 blows/ ft. and Su was equal to 0.8 ksf, the site would be classified as D or E in accordance with Method C and the class definition of Table 630.04.01.2. In this example, for relatively low response spectral and long period motions, Table 630.04.02.2 indicates that the site factors are highest for Site Class E. However, for relatively high short- period spectral acceleration (SS > 0.75), short period site factors, Fa, are higher for Site Class.
1/14

Materials Seismic Design 630.00
2015
Figure 630.04.01.1: Horizontal Peak Ground Acceleration Coefficient for Idaho

Materials Seismic Design 630.00
2015
Figure 630.04.01.2: Horizontal Response Spectral Acceleration Coefficient of 0.2 Sec. for Idaho

Materials Seismic Design 630.00
2015
Figure 630.04.01.3: Horizontal Response Spectral Acceleration Coefficient of 1 Sec. for Idaho

Materials Seismic Design 630.00
2015
630.4.2 Site Ground Response Analysis. The AASHTO Guide Specifications require that site effects be included in determining seismic loads for bridge design. The Guide Specifications define all subsurface conditions with six site classes (A through F) as shown in Table 630.04.01.1. Site soil coefficients are provided for Site Classes A through E. Site Class F may require a site- specific response analysis. Code/ specification based response spectra that include the effect of ground motion amplification or de-amplification due to the soil / rock stratigraphy at the site can be developed from the PGA, Ss and S1 and the Site-Class-Based site coefficients FPGA, Fa and FV . These coefficients are shown below in Tables 630.04.02.1 and 630.04.02.2 for Site Classes A through E. No specification based site coefficients are shown for Site Class F. A site-specific ground response analysis must be conducted. See Table 630.04.01.1 and the AASHTO Guide Specifications for conditions that are considered to be included in Site Class F. The site factors in Tables 630.04.02.1 and 630.04.02.2 modify the ground motions imparted to a structure founded on Site Class B rock for the site-specific soil profile. The modified Peak Ground Acceleration and Spectral Accelerations are used to develop the site-specific response spectrum as shown in Figure 630.04.02.1.
Note that the site class should be determined considering the soils up to the ground surface, not just the soil below the foundations.
Table 630.04.02.1: Values of FPGA and Fa as a Function of Site Class and Mapped Peak Ground Acceleration or Short-Period Spectral Acceleration Coefficient (Adapted from AASHTO Guide
Specifications for LRFD Seismic Bridge Design, Table 3.4.2.3-1)
SITE CLASS
Mapped Peak Ground Acceleration or Short Period Spectral Response Coefficient, FPGA or Fa
PGA ≤ 0.10 Ss ≤ 0.25
PGA = 0.20 Ss = 0.50
PGA = 0.30 Ss = 0.75
PGA = 0.40 Ss = 1.00
PGA ≥ 0.50 Ss ≥ 1.25
A 0.8 0.8 0.8 0.8 0.8 B 1.0 1.0 1.0 1.0 1.0 C 1.2 1.2 1.1 1.0 1.0 D 1.6 1.4 1.2 1.1 1.0 E 2.5 1.7 1.2 0.9 0.9 F (1) (1) (1) (1) (1)
(1) Site-specific response geotechnical investigation and dynamic site response analyses should be considered
Note: Use straight line interpretation for intermediate values of PGA and Ss, where PGA is peak ground acceleration and Ss is the spectral acceleration coefficient at 0.2 seconds, obtained from Figures 630.04.01.1 and 630.04.01.2.
.

Materials Seismic Design 630.00
2015
Table 630.04.02.2: Values of FV as a Function of Site Class and Mapped 1-second Period Spectral Acceleration Coefficient. (Adapted from AASHTO Guide Specifications for LRFD
Seismic Bridge Design, Table 3.4.2.3-2)
SITE CLASS Mapped Spectral Response Acceleration Coefficient at 1-second Periods S1 ≤ 0.1 S1 = 0.2 S1 = 0.3 S1 = 0.4 S1 ≥ 0.5
A 0.8 0.8 0.8 0.8 0.8 B 1.0 1.0 1.0 1.0 1.0 C 1.7 1.6 1.5 1.4 1.3 D 2.4 2.0 1.8 1.6 1.5 E 3.5 3.2 2.8 2.4 2.4 F (1) (1) (1) (1) (1) (1) Site-specific response geotechnical investigation and dynamic site response analyses should be considered.
Note: Use straight line interpolation for intermediate values of S1, where S1 is the spectral acceleration coefficient at 1.0 second, obtained from Figure 630.04.02.2.
SDS = FaSS
Sa = SD1 / T
SD1 = FVS1
As =FPGA PGA
0 0.2 TO = 0.2TS
TS = SD1
/ SDS
1.0
Period, T (Seconds)
Figure 630.04.02.1: Design Response Spectrum Construction Using Three Point Method (Adapted from AASHTO Guide Specifications for LRFD Seismic Bridge Design Fig 3.4.4-1
Design earthquake response spectral acceleration coefficients for the free field acceleration coefficient AS, the short period acceleration coefficient, SDS and the 1-second period acceleration coefficient, SD1 shall be determined from the following equations:
Res
pons
e S
pect
ral A
ccle
ratio
n S

Materials Seismic Design 630.00
𝐴𝐴𝑠𝑠 = 𝐹𝐹𝑃𝑃𝑃𝑃𝑃𝑃𝑃𝑃𝐺𝐺𝐴𝐴
𝑆𝑆𝐷𝐷𝐷𝐷 = 𝐹𝐹𝑚𝑚 𝑆𝑆𝑐𝑐
𝑆𝑆𝐷𝐷1 = 𝐹𝐹𝑣𝑣𝑆𝑆1
Where: 𝐹𝐹𝑃𝑃𝑃𝑃𝑃𝑃 = site coefficient for peak ground acceleration shown in Table 630.04.02.2. PGA = peak horizontal ground acceleration on Class B rock 𝐹𝐹𝑚𝑚 = site coefficient for 0.2-second period spectral acceleration shown in Table 630.04.02.1 𝑆𝑆𝐷𝐷𝐷𝐷 = 0.2-second period spectral acceleration coefficient on Class B rock 𝐹𝐹𝑣𝑣 = site coefficient for 1.0-second period spectral acceleration shown in Table 630.04.02.2 𝑆𝑆1 = 1.0-second period spectral acceleration coefficient on Class B rock.
Linear interpolation shall be used to determine the ground motion parameters PGA, SS and S1, for sites located between the contour lines or between contour lines and a local maximum or minimum. The design response spectrum shall be constructed using the three point method as shown in Figure 630.04.02.1. The design response spectrum includes the short period transition from the free field acceleration coefficient to the peak response region. This transition is effective for all modes including fundamental vibration.
For periods greater than or equal to TO and less than or equal to TS, the design spectral acceleration coefficient, Sa, shall be defined as follows:
𝑆𝑆𝑚𝑚 = (𝑆𝑆𝐷𝐷𝐷𝐷 − 𝐴𝐴𝐷𝐷)𝑇𝑇 𝑇𝑇𝑜𝑜� + 𝐴𝐴𝐷𝐷
in which: 𝑇𝑇𝑜𝑜 = 0.2𝑇𝑇𝐷𝐷
𝑇𝑇𝐷𝐷 = 𝑆𝑆𝐷𝐷1𝑆𝑆𝐷𝐷𝐷𝐷�
where: 𝐴𝐴𝐷𝐷 = free field acceleration coefficient 𝑆𝑆𝐷𝐷1 = design spectral acceleration coefficient at 1.0-second period 𝑆𝑆𝐷𝐷𝐷𝐷 = design spectral acceleration coefficient at 0.2-second period 𝑇𝑇 = period of vibration (seconds)
For periods greater than or equal to TO and less than or equal to TS, the design response spectral acceleration coefficient, Sa shall be defined as follows:
𝑆𝑆𝑚𝑚 = 𝑆𝑆𝐷𝐷𝐷𝐷
1/14

Materials Seismic Design 630.00
For periods great than TS, the design response spectral acceleration coefficient, Sa, shall be defined as follows:
𝑆𝑆𝑚𝑚 = 𝑆𝑆𝐷𝐷1𝑇𝑇�
Response spectra constructed using maps and procedures described above are for a damping ratio of 5 percent and do not include near field ground adjustments. See Section 630.04.04 for near-field adjustments.
The AASHTO LRFD Bridge Design Specifications do not specifically require a site-specific seismic response analysis be completed for potentially liquefiable sites. The AASHTO Guide Specifications require the use of the specification-based ground motion spectral response for non-liquefied conditions unless a site –specific ground motion response analysis is conducted. However, for structures with a fundamental Period, TS, greater than 1.0 seconds, a site-specific response analysis is recommended if the site soils are potentially liquefiable.
Sites that contain a strong impedance contrast, such as a boundary between adjacent layers with shear wave velocities that differ by a factor of 2 or more, may benefit from a site-specific response analysis. The strong impedance can occur at sites with a thin (less than about 30 ft.) soil layer over rock, or where soft and stiff soil layers occur.
For liquefaction, lateral spreading, slope stability and retaining wall analyses, the PGA should be multiplied by the appropriate FPGA for the site class. The site coefficient presented in the AASHTO Guide Specifications should be used, unless a site-specific ground response analysis is conducted in accordance with the AASHTO Guide Specifications and this manual.
For short bridges with a limited number of spans, the motion at the abutment is generally the primary way energy is transmitted from the ground to the superstructure. If the abutment is backed by an approach fill, the site class should be determined at the base of the approach fill. The potential effects of the approach fill overburden pressure on the shear wave velocity of the soil should be accounted for in the site class determination.
It may be necessary to determine the site class at a pier location for a long bridge. Then the motion computed at the ground surface is appropriate. For deep foundations, the location of the motion will depend on the lateral stiffness of the soil-pile system. If a stiff pile cap is used, then the motion should be defined at the pile cap. If the pile cap does not provide lateral stiffness or there is no pile cap, then the controlling motion will likely be at some depth below the ground surface. The determination of this elevation requires considerable judgment and should be discussed by the geotechnical bridge designers.
1/14

Materials Seismic Design 630.00
2015
630.4.3 Site Response For Structures Using IBC. Sections 1613 through 1615 of the IBC provide procedures to estimate the earthquake loads for the design of buildings and similar structures. The Earthquake loads are defined by acceleration response spectra, developed through the use of the IBC procedures or through site-specific procedures. The intent of the Maximum Considered Earthquake (MCE) is to preserve life safety and prevent collapse of the structure. The MCE corresponds to a 2 percent probability of exceedence in 50 years or a return period of 2500 years. The IBC general response spectrum uses the mapped MCE spectral response accelerations at short periods (Ss) and at 1-second (S1) to define the seismic hazard at a specific site in the United States.
630.4.4 Near-Field Adjustments. For sites located within 6 mile of an active surface or shallow fault, as shown on the USGS Active Fault Map and on Figure 630.05.01.1, near fault effects on ground motions should be considered to determine if there is significant influence on the structure response.
Near fault effects on horizontal response spectra include: • Higher ground motions due to the proximity of the active fault• Directivity effects that increase ground motions for periods greater than 0.5 seconds if
the ground motion propagates toward the site, and• Directionality effects that increase ground motions for periods greater than 0.5 seconds
in the direction perpendicular to the strike of the fault.
If the active fault is included in the development of national ground motion maps, then the first is already included in the maps shown in Figures 630.04.01.1, 630.04.01.2 and 630.04.01.3. The second and third effects are not included in these maps. They are significant only for periods longer than 0.5 seconds and normally would be evaluated only for essential or critical bridges. For faults shown on Figure 630.05.01.1 which are not included on the USGS Active Fault Map, site-specific attenuation analyses will be necessary to determine PGA.
630.4.5 Earthquake Magnitude. An estimate of earthquake magnitude is necessary for assessment of liquefaction and lateral spreading. The magnitude should be assessed using the seismic de-aggregation data for the site, available through the USGS national seismic hazard website (http://earthquake.usgs.gov/research/hazmaps/) and as discussed in Section 630.07. The de-aggregation used should be for a seismic hazard level consistent with the hazard level for the structure for which liquefaction analysis is being conducted. The ITD Geotechnical Engineer in the Construction/Materials Section can provide assistance with magnitude determination for faults not included in the USGS mapping. Information on earthquake magnitude relationships with fault length are shown in several references. See Figure 630.05.01.1 and Table 630.05.01.1 for locations and information on active and probably active faults in Idaho and those near the borders which could affect response analysis in Idaho.
For routine liquefaction and lateral spreading analysis a default moment magnitude of 7.0 should be used in the Basin and Range and Basin and Range Structure provinces of eastern and

Materials Seismic Design 630.00
2015
east central Idaho and adjacent to Wyoming and Yellowstone. A default magnitude of 6.0 should be used in the Idaho Batholith and in southwestern Idaho. The faults in northwestern Montana, near the Idaho border are capable of an estimated 6.0 magnitude event. A default magnitude of 5.5 should be used in ITD Districts 1 and 2 except for Kootenai, Shoshone, Bonner and Boundary Counties. These counties are closer to the faults in northwest Montana and have a high incidence of deep soft sediments, and a default magnitude of 6.0 should be used. Note that these default magnitudes are intended for use in preliminary liquefaction and lateral spreading analysis only and should not be used for developing design ground motion parameters.
630.5 Seismic Geologic Hazards. The geotechnical designer shall evaluate seismic geologic hazards including fault rupture, liquefaction, lateral spreading, ground settlement and slope stability, and their potential effects on the structure and adjacent roadway.
630.5.1. Fault Rupture. The intermountain seismic belt, which includes Idaho, is one of the most active seismic regions in the country. There are a number of faults in and near the borders of Idaho that are considered active or potentially active. Several of the fault systems are receiving renewed interest in light of recent seismicity. Additional faults that could be considered active may be added to the list. Figure 630.05.01.1 shows the faults that are currently considered active or probably active. The mapped faults include some that are not shown on the USGS hazard mapping, but are considered to be Holocene or very late quaternary in age by the Idaho Geologic Survey. Active and probably active faults are primarily those that appear to have been active in the Holocene (last 10,000 years). Some Late Quaternary age faults have been included that are in the vicinity of historic moderate to large earthquakes. Table 630.05.01.1 lists the mapped faults and provides some information on activity where documented.
Thick sequences of recent geologic deposits, heavy vegetation and the limited amount of instrumentally recorded events on identified faults contribute to the difficulty of identifying active or potentially active faults in Idaho. The major known faults consist of northwest – southeast trending systems in the Basin and Range and Basin and Range Structure provinces of southeastern and east-central Idaho and smaller north and northeast trending faults in the Idaho Batholith and west-central mountains. The Snake River Plain covers a major portion of Southern and eastern Idaho. It consists of hundreds of feet of sediments and volcanic materials. Any continuity of faulting across the plain is obscured by these recent deposits. Northern Idaho is heavily forested and the valleys consist of thick alluvium and glacial outwash, which could conceal evidence of potentially active faulting. There has been almost no recorded seismic activity in northern Idaho.
Potential impacts of fault rupture include abrupt, large, differential ground movements and associated damage to structures that might straddle a fault. The limited number of mapped faults and the thick overburden and relatively recent volcanic activity limit the ability to identify

Materials Seismic Design 630.00
2015
the surface expression of potentially active faulting. However, the potential for fault rupture should be evaluated and considered in the planning and design of new facilities.
630.5.2 Liquefaction. Liquefaction has been one of the most significant causes of damage to bridge structures in past earthquakes (ATC-MCEER Joint Venture, 2002). Liquefaction can damage bridges and other structures in many ways, including:
• Modifying the nature of ground motions;• Bearing failures of shallow foundations founded in or above liquefied soil;• Liquefaction induced ground settlement;• Lateral spreading of liquefied ground;• Large displacements associated with low frequency ground motions;• Increased earth pressure on subsurface structures;• Floating of buoyant buried structures; and• Retaining wall failure.

Materials Seismic Design 630.00
2015
Figure 630.05.01.1: 01 Active Faults in Idaho

Materials Seismic Design 630.00
2015
Table 630.05.01.1: Idaho Fault Catalog
Fault State
Slip Rate (mm/yr)
Characteristic Magnitude
Recurrence Interval
Bear River Fault
Beaverhead Fault
Big Flat – Jakes Creek
Boulder Front Fault
Centennial Fault
Cuddy Mtn-Lick Creek
East Bear Lake
East Pocatello Valley
Halfway Gulch
Lemhi Fault
Lone Pine Fault
Lost River Fault
Madison Fault
Rush Peak Fault
Squaw Creek Fault
Snake River Fault
Teton Fault
Water Tank Fault
Wasatch (W. Cache)
West Bear Lake Fault
Wyoming
Idaho
Idaho
Idaho
Mont.- Idaho
Idaho
Idaho
Idaho
Idaho
Idaho
Idaho
Idaho
Mont.-Idaho
Idaho
Idaho
Idaho- Wyo
Wyoming
Idaho
Utah-Idaho
Idaho
1.5
0.12
0.04
0.9
0.05
0.6
1.2
0.22
0.15
0.4
0.05
0.1
<1
1.3
0.14
0.4
6.9
7
6.81
7.17
6.82
7.29
Historically
7
7
7.45
6.78
7.03
7.16
6.66(Utah Seg)
Active 1975
6500 Yrs
25,000 Yrs
15-30000 Yrs
5200 Yrs
Note: The Characteristic Magnitude given for the Lost River Fault may refer to the average of the segments. The Borah Peak Earthquake of 1983 occurred on a segment of the Lost River Fault and was assigned a magnitude of 7.3.
The fault identified as Wasatch by the Idaho Geologic Survey is a northern extension of the West Cache fault in Northern Utah.
Fault data is as published by the USGS and Idaho Geologic Survey.
Liquefaction refers to the significant loss of strength and stiffness resulting from the generation of excess pore water pressure in saturated cohesionless soils. Liquefaction can occur in soils ranging in size from gravel to silt. However, it is most common in sands. Kramer (1996) and the National Research Council, Committee on Earthquake Engineering Report (1985), provide
Materials Seismic Design 630.00
2015
detailed description of liquefaction including types of liquefaction, evaluation of liquefaction susceptibility and the effects of liquefaction.
Liquefaction assessment includes identifying soils prone to liquefaction, evaluating whether the design earthquake loading will initiate liquefaction, and estimating the potential effects of liquefaction.
630.5.2.1 Evaluation of Liquefaction Potential. Liquefaction potential should be based on soil characteristics using in-situ testing such as Standard Penetration Test (SPT) or Cone Penetration Tests (CPT). Liquefaction potential may also be assessed using shear wave velocity, but the SPT and CPT tests are preferred in most soil conditions. Shear wave velocity or Becker Penetration Tests may be more appropriate in gravelly soils. Samples must be recovered to evaluate the grain-size distribution and provide input into the simplified method. The new criterion for liquefaction potential proposed by Bray and Sancio (2006) is preferred over older methods.
Once preliminary screening is performed, liquefaction potential shall be evaluated using the Simplified Procedure as originally developed by Seed and Idriss (1971) and periodically modified and improved since.
Preliminary Screening. If one or more of the following conditions is present, a detailed evaluation of liquefaction potential is not required.
• The estimated highest groundwater level at the site is determined to be deeper than 75ft. below existing ground or finished grade, whichever is deeper.
• The subsurface profile is characterized as having a minimum SPT resistance (correctedfor overburden depth and hammer energy) N60 of 30 blows/ft. or a CPT cone tipresistance qc of more than 160 tsf or if bedrock is present to the ground surface.
• The soil is clayey, as defined by Bray and Sancio (2006) criteria described below.
If the site does not meet one of the conditions described above, a more detailed assessment of liquefaction shall be conducted.
The Bray and Sancio (2006) criteria should be used to assess the susceptibility of fine and cohesive soils. According to these criteria, fine grained soils are considered susceptible to liquefaction if:
• The soil has a water content (wc) to liquid limit ratio of more than 0.85; and• The soil has a Plasticity Index (PI) of less than 12.
Laboratory cyclic triaxial shear tests may be used to evaluate liquefaction potential in fine grained soils due to the higher quality samples usually recovered.
Liquefaction of Gravels. No specific guidance regarding the susceptibility of gravels is currently available. The primary reason why gravels may not liquefy is the high permeability precludes the development of undrained conditions. However, if bounded by low permeability layers, the

Materials Seismic Design 630.00
liquefaction potential of gravels should be evaluated. If gravel contains sufficient fine sand to restrict permeability, the liquefaction potential should be evaluated.
Simplified Procedure. The Simplified Procedure is based on comparing the cyclic resistance ratio (CRR) of a soil layer (i.e. the cyclic shear stress required to cause liquefaction) to the earthquake induced cyclic shear stress ratio (CSR). The resistance value is estimated based on empirical charts relating the resistance available to specific index properties (i.e. SPT, CPT, BPT or shear wave velocities) and corrected to an equivalent magnitude of 7.5 using a magnitude scaling factor. Youd et al. (2001) provides the empirical liquefaction resistance charts for both SPT and CPT data to be used with the Simplified Method.
The earthquake induced CSR for the Simplified Method shall be estimated using the following equation:
𝐶𝐶𝐶𝐶𝑆𝑆 = 0.65(𝐴𝐴𝑚𝑚𝑚𝑚𝑚𝑚 𝑔𝑔⁄ )(𝜎𝜎𝑜𝑜 𝜎𝜎𝑜𝑜′⁄ )𝑟𝑟𝑑𝑑
Where:
Amax = peak ground acceleration accounting for site amplification g = acceleration due to gravity (32.19 ft/sec.2) σo = initial total vertical stress at depth being evaluated (psf) σo’ = initial effective vertical stress at depth being evaluated (psf) rd = stress reduction coefficient; ratio of the peak shear stress for the soil column to
that of a rigid body. rd may be developed from a site response analysis or, in the absence of site response analysis, from Figure 56 (Kavazanjian et.al. 1997). For depths less than 40 ft., the Seed and Idriss average values are typically used. Alternatively, rd = 1 - 0.0046z where z is depth in feet.
Another source for calculation of CRR is Chapter 8 of Kavazanjian et.al. (1997).
𝐶𝐶𝐶𝐶𝐶𝐶 = (𝐶𝐶𝐶𝐶𝐶𝐶7.5)(𝑘𝑘𝑀𝑀)(𝑘𝑘𝜎𝜎)(𝑘𝑘𝑚𝑚)
Where:
CRR7.5 = Critical stress ration resisting liquefaction for Magnitude 7.5 (Figure 58, Kavazanjian et.al.)
kM = Correction for magnitudes other than 7.5 (Figure 59, Kavazanjian et.al.) kσ = Correction for stress levels larger than one tsf (Figure 60, Kavazanjian et.al.) kα = Correction for initial driving static shear stress. kα depends on both the initial
shear stress and the relative density of the soil. The initial shear stress below sloping ground, embankments or footings can be calculated with closed form solutions. With both values known, kα can be estimated from Figure 61, Kavazanjian, et al.
1/10

Materials Seismic Design 630.00
CRR in the above reference is based on N60. A correlation between the ratio of qc from CPT and N60 and mean grain size is shown in Figure 55, Kavazanjian, et al. Youd, et al. (2001) provides procedures using SPT, CPT, shear wave and BPT criteria.
The factor of safety against liquefaction is defined by:
𝐹𝐹𝑆𝑆𝑠𝑠𝑠𝑠𝑙𝑙 = 𝐶𝐶𝐶𝐶𝐶𝐶 𝐶𝐶𝑆𝑆𝐶𝐶⁄
630.05.02.02 Minimum Factor of Safety Against Liquefaction. Liquefaction hazards assessment and the development of hazard mitigation measures shall be conducted if the factor of safety against liquefaction is less than 1.2. Liquefaction hazards to be assessed include settlement and related effects, and liquefaction induced instability (e.g. flow failure or lateral spreading).
630.05.02.03 Liquefaction Induced Settlement. Both dry and saturated deposits of loose granular soils tend to densify and settle during earthquake shaking. Settlement of dry sands is well documented by Tokimatsu and Seed (1987). The procedure is presented in Section 8.5 in FHWA, Geotechnical Engineering Circular No. 3 ( Kavazanjian et.al., 1997). Settlement of saturated granular deposits due to liquefaction shall be estimated using techniques based on the Simplified Procedure. Non-linear effective stress models may also be used to assess liquefaction potential and related settlement with permission from the Geotechnical Engineer.
If the Simplified Procedure is used to evaluate liquefaction potential, liquefaction induced ground settlement of saturated granular deposits should be estimated using the procedures In Figure 630.05.02.1 (Tokimatsu and Seed 1987) or Figure 630.05.02.2 (Ishihara and Yoshimine 1992).
1/10

Materials Seismic Design 630.00
2015
Figure 630.05.02.1: Liquefaction Induced Settlement Estimated Using the Tokimatsu and Seed Procedure (Tokimatsu and Seed, 1987) (Adapted from WSDOT GDM Figure 6-12)

Materials Seismic Design 630.00
2015
Figure 630.05.02.2: Liquefaction Induced Settlement Estimated Using the Ishihara and Yoshimine Procedure (Ishihara and Yoshimine, 1992) (Adapted from WSDOT
GDM Figure 6-13)
630.5.2.4 Residual Strength Parameters. Liquefaction induced instability is strongly influenced by the residual or reduced strength of the liquefied soil. Instability occurs when the shear stresses required to maintain equilibrium exceed the residual or reduced strength of the soil deposit. Evaluation of this residual or reduced strength is a very difficult problem. Even so there are a number of methods available to estimate the residual strength of liquefied soils. The most widely accepted procedure is that proposed by Idriss and Boulanger, (2007), which is shown in Figure 630.03.03.3 or Figure 630.03.03.4.
The Idriss and Boulanger procedure is based on an empirical relationship between residual undrained shear strength and equivalent clean sand SPT blow counts. This relationship is based

Materials Seismic Design 630.00
on back-calculation of the apparent shear strengths from case histories of flow slides. The Idriss and Boulanger approach yields a range of residual undrained shear strengths for a given corrected SPT N value.
630.05.02.05 Flow Failures and Lateral Spreading. Liquefaction can lead to catastrophic flow failures. Flow failures are driven by large static stresses that lead to large deformations or flow following triggering of liquefaction. Such failures are similar to debris flows. Flow failures are characterized by sudden initiation, rapid failure, and large displacements. Flow failures typically occur during or shortly after shaking. However, delayed flow can occur, based on post-earthquake redistribution of pore water pressure; particularly if the liquefiable layer is capped by relatively impermeable layers. Both stability and deformation should be assessed for flow failures, and mitigated if stability failure or excessive deformation is predicted.
Conventional limit equilibrium slope stability analysis is most often used to assess the likelihood of liquefaction induced slope failures. Residual undrained shear strength parameters are used for the liquefied soil and the slope failure is modeled as an infinite slope or as a block failure. Flow failures are considered likely where the factor of safety is less than unity. In these instances the deformation is usually too large to be acceptable for design of structures, and some form of mitigation is needed. The exception is where the liquefied material and crust flow past the structure and the structure can resist the imposed loads. Where the factor of safety is greater than unity for static conditions, deformations can be estimated using a Newmark type analysis or the empirical approach presented in Youd et.al. (2002). Free field liquefaction-induced lateral displacement can be estimated using the following equation modified from that proposed by Hamada et.al. (1987), to calculate ΔL in feet.
𝛥𝛥𝐿𝐿 = 1.358(𝐻𝐻)1 2� (𝑆𝑆)1 3�
Where H is the thickness of the liquefied layer in feet and S is the ground slope in percent
The above equation is based primarily on Japanese observations of liquefaction displacements of very loose sand deposits having a slope less than 10%. Therefore it should be considered only a rough upper bound estimate of the lateral displacement. Neither density nor the N60 value is reflected in the formula, nor is the depth of the liquefied layer.
In contrast to flow failures, lateral spreading occurs when the shear strength of the liquefied soil is incrementally exceeded by the inertial forces induced during an earthquake. Lateral spreading typically results in horizontal movement of non-liquefied soils located above liquefied soils, in addition to the liquefied soils themselves.
The potential for liquefaction-induced lateral spreading on gently sloping sites or where the site is located near a free face should be evaluated using empirical relationships such as the procedure of Youd et.al. (2002). Youd includes equations for estimating lateral spreading at sites with a free face as well as those with sloping ground.
1/10

Materials Seismic Design 630.00
2015
630.5.3 Slope Instability. Slope instability can be due to inertial effects associated with ground accelerations, liquefaction or increased pore water pressures in slopes associated with a design seismic event. Slope instability can also be initiated during a seismic event due to the weakening of sensitive fine grained soils. If liquefiable soils are present below embankments or within cut slopes, rapid strength loss in the liquefied soil could trigger a general slope failure. The liquefiable layer(s) should be assigned residual strength parameters consistent with Section 630.05.02.04. When using liquefied soil shear strengths, the horizontal and vertical pseudo- static coefficients, kh and kv should be equal to zero, unless the controlling earthquake is of very long duration. Very long duration earthquakes are typical of an Interplate Source Zone, and are not anticipated in Idaho.
630.5.3.1 Pseudo-Static Analysis. Pseudo-static slope stability analysis should be used to evaluate the seismic stability of natural or cut-slopes and embankments. The pseudo-static analysis consists of conventional limit equilibrium static slope stability analysis as described in Materials Manual Section 640.00, combined with horizontal and vertical pseudo-static acceleration coefficients (kh and kv) that act on the critical failure mass.
A horizontal pseudo-static coefficient, kh, of 0.5 peak ground acceleration (PGA) and a vertical pseudo-static coefficient, kv, of zero should be used when the seismic stability of slopes is evaluated and not considering liquefaction. For these conditions, the target factor of safety is 1.1. When bridge foundations or retaining walls are involved the LRFD approach shall be used. In these cases, a resistance factor of 0.9 would be used for slope stability and the slope would be designed at the service limit state.
630.5.3.2 Deformations. Deformation analyses should be employed where an estimate of the magnitude of seismically-induced slope deformation is required. Acceptable methods of estimating the magnitude of seismically-induced slope deformation include Newmark sliding block analysis, simplified charts based on Newmark-type analyses (Makdisi and Seed, 1978 or Bray and Rathje, 1998), or dynamic stress-deformation models. These methods should not be employed to estimate displacements associated with liquefaction or cyclic strength loss if the static factor of safety with the reduced strength parameters is less than 1.0.
Newmark (1965) proposed a seismic slope stability analysis that provides an estimate of seismically-induced slope deformation. The advantage of the Newmark analysis over pseudo- static analysis is that it provides an index of permanent deformation. The Newmark analysis treats the unstable soil mass as a rigid block on an inclined plane. The procedure for the Newmark analysis consists of three steps described as follows.

Materials Seismic Design 630.00
2015
• Identify the yield acceleration of the slope by completing limit equilibrium stabilityanalysis. The yield acceleration is the horizontal pseudo-static coefficient, kh, requiredto bring the factor of safety to 1.0.
• Select an earthquake time history representative of the design earthquake.• Double integrate all relative accelerations (i.e., the difference between acceleration and
yield acceleration) in the earthquake time history.
A number of commercially available computer programs are available to complete Newmark analysis, such as Shake 2000 (Ordoñez, 2000).
Makdisi and Seed (1978) developed a simplified procedure for estimating seismically-induced slope deformations based on Newmark sliding block analysis. The Makdisi-Seed procedure provides and estimated range of permanent seismically-induced slope deformation as a function of the ratio of yield acceleration over maximum acceleration and earthquake magnitude as shown on Figure 630.05.03.1. The Makdesi-Seed procedure provides a useful index of the magnitude of slope deformation, because the procedure includes the dynamic effects of the seismic response of dams. Its results should be interpreted with caution when applied to other slopes.
Figure 630.05.03.1: The Makdisi-Seed Procedure for Estimating the Range of Permanent Seismically-Induced Slope Deformation as a Function of the Ratio of Yield Acceleration over
Maximum Acceleration (Makdisi and Seed, 1978)
Note: 1 cm = 0.3937 inches, Metric vertical scale retained to facilitate use of the data.

Materials Seismic Design 630.00
2015
Bray and Rathje (1998) developed an approach to estimate permanent base sliding deformation for solid waste landfills. The method is based on the Newmark sliding block model, and is similar to the Makdisi-Seed approach. However, the Bray-Rathje charts are based on significantly more analyses and a wider range of earthquake magnitudes, peak ground accelerations and frequency content than the Makdisi-Seed Charts and may be more reliable. A Bray-Rathje chart showing permanent base deformation as a function of yield acceleration (ky) over the maximum horizontal equivalent acceleration (kmax) acting on the slide mass is presented in Figure 630.05.03.2. See Bray and Rathje (1998) for additional discussion.
Figure 630.05.03.2: Permanent Base Sliding Block Displacements as a Function Of Yield Acceleration to Maximum Horizontal Equivalent Acceleration (Bray and Rathje, 1998)
Note: 1 cm = 0.3937 inches, Metric vertical scale retained to facilitate use of the data
Seismically- induced slope deformations can also be estimated through a variety of dynamic stress-deformation computer models such as PLAXIS, DYNAFLOW, and FLAC. These programs are very sensitive to the quality of the input parameters. Due to the complexity, these models should not be used for routine design.
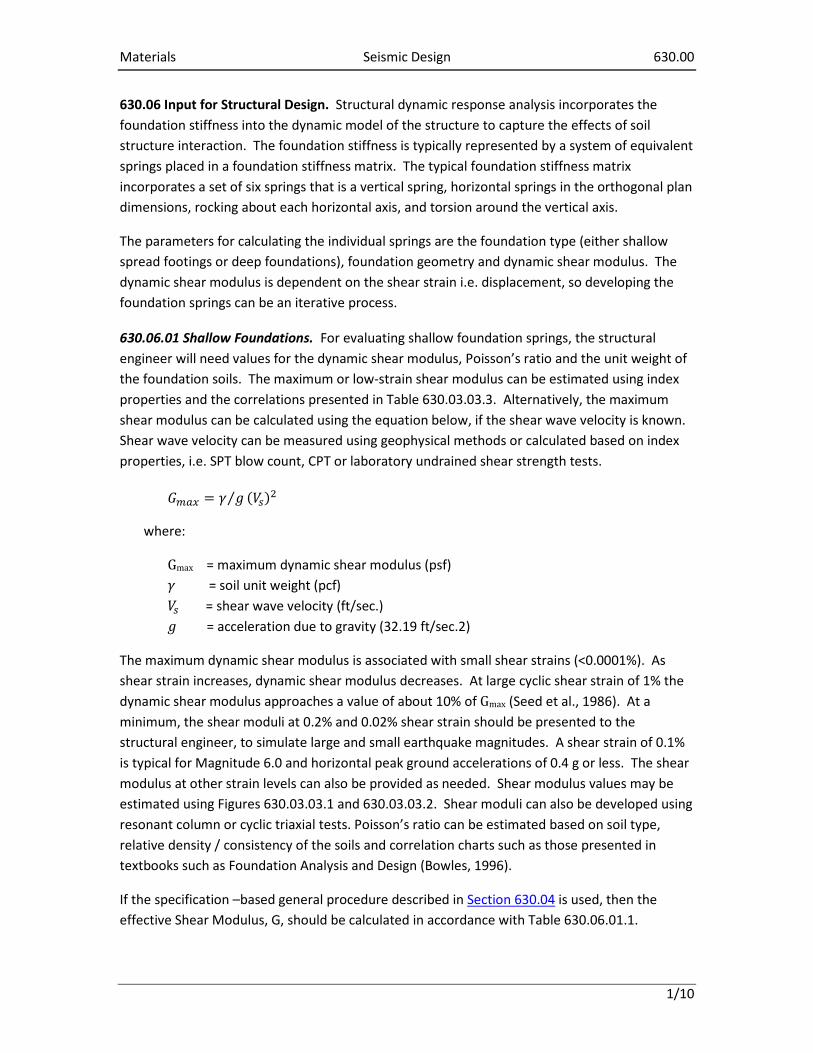
Materials Seismic Design 630.00
630.06 Input for Structural Design. Structural dynamic response analysis incorporates the foundation stiffness into the dynamic model of the structure to capture the effects of soil structure interaction. The foundation stiffness is typically represented by a system of equivalent springs placed in a foundation stiffness matrix. The typical foundation stiffness matrix incorporates a set of six springs that is a vertical spring, horizontal springs in the orthogonal plan dimensions, rocking about each horizontal axis, and torsion around the vertical axis.
The parameters for calculating the individual springs are the foundation type (either shallow spread footings or deep foundations), foundation geometry and dynamic shear modulus. The dynamic shear modulus is dependent on the shear strain i.e. displacement, so developing the foundation springs can be an iterative process.
630.06.01 Shallow Foundations. For evaluating shallow foundation springs, the structural engineer will need values for the dynamic shear modulus, Poisson’s ratio and the unit weight of the foundation soils. The maximum or low-strain shear modulus can be estimated using index properties and the correlations presented in Table 630.03.03.3. Alternatively, the maximum shear modulus can be calculated using the equation below, if the shear wave velocity is known. Shear wave velocity can be measured using geophysical methods or calculated based on index properties, i.e. SPT blow count, CPT or laboratory undrained shear strength tests.
𝐺𝐺𝑚𝑚𝑚𝑚𝑚𝑚 = 𝛾𝛾 𝑔𝑔⁄ (𝑉𝑉𝑠𝑠)2
where:
Gmax = maximum dynamic shear modulus (psf) 𝛾𝛾 = soil unit weight (pcf) 𝑉𝑉𝑠𝑠 = shear wave velocity (ft/sec.) 𝑔𝑔 = acceleration due to gravity (32.19 ft/sec.2)
The maximum dynamic shear modulus is associated with small shear strains (<0.0001%). As shear strain increases, dynamic shear modulus decreases. At large cyclic shear strain of 1% the dynamic shear modulus approaches a value of about 10% of Gmax (Seed et al., 1986). At a minimum, the shear moduli at 0.2% and 0.02% shear strain should be presented to the structural engineer, to simulate large and small earthquake magnitudes. A shear strain of 0.1% is typical for Magnitude 6.0 and horizontal peak ground accelerations of 0.4 g or less. The shear modulus at other strain levels can also be provided as needed. Shear modulus values may be estimated using Figures 630.03.03.1 and 630.03.03.2. Shear moduli can also be developed using resonant column or cyclic triaxial tests. Poisson’s ratio can be estimated based on soil type, relative density / consistency of the soils and correlation charts such as those presented in textbooks such as Foundation Analysis and Design (Bowles, 1996).
If the specification –based general procedure described in Section 630.04 is used, then the effective Shear Modulus, G, should be calculated in accordance with Table 630.06.01.1.
1/10

Materials Seismic Design 630.00
2015
Table 630.06.01.1: Effective Shear Modulus Ratio (G/G0) (Adapted from Table 4.7, FEMA 356, ASCE 2000)
Site Class Effective Peak Acceleration, 𝑺𝑺𝑺𝑺𝑿𝑿𝑿𝑿𝑺𝑺𝑺𝑺⁄𝟐𝟐𝟐𝟐. 𝟓𝟓𝟓𝟓
𝑺𝑺𝑺𝑺𝑿𝑿𝑿𝑿𝑺𝑺𝑺𝑺⁄𝟐𝟐𝟐𝟐. 𝟓𝟓𝟓𝟓 + 𝟎𝟎𝟎𝟎 𝑺𝑺𝑺𝑺𝑿𝑿𝑿𝑿𝑺𝑺𝑺𝑺⁄𝟐𝟐𝟐𝟐. 𝟓𝟓𝟓𝟓 = 𝟎𝟎𝟎𝟎. 𝟏𝟏𝟏𝟏 𝑺𝑺𝑺𝑺𝑿𝑿𝑿𝑿𝑺𝑺𝑺𝑺⁄𝟐𝟐𝟐𝟐. 𝟓𝟓𝟓𝟓 = 𝟎𝟎𝟎𝟎. 𝟒𝟒𝟒𝟒 𝑺𝑺𝑺𝑺𝑿𝑿𝑿𝑿𝑺𝑺𝑺𝑺⁄𝟐𝟐𝟐𝟐. 𝟓𝟓𝟓𝟓 = 𝟎𝟎𝟎𝟎. 𝟖𝟖𝟖𝟖 A 1.00 1.00 1.00 1.00 B 1.00 1.00 0.95 0.90 C 1.00 0.95 0.75 0.60 D 1.00 0.90 0.50 0.10 E 1.00 0.60 0.05 * F * * * Notes: Use straight line interpolation for intermediate values of SXS/2.5 * Site-specific geotechnical investigation and dynamic site response analyses shall beperformed
Note that 𝑆𝑆𝑆𝑆𝑋𝑋𝑋𝑋𝐷𝐷𝐷𝐷⁄2.5 in the table is essentially equivalent to 𝐴𝐴𝐴𝐴𝐷𝐷𝐷𝐷 (i.e., 𝑃𝑃𝑃𝑃𝐺𝐺𝐺𝐺𝐴𝐴𝐴𝐴 × 𝐹𝐹𝐹𝐹𝑃𝑃𝑃𝑃𝑃𝑃𝑃𝑃𝑃𝑃𝑃𝑃) 630.6.2 Deep Foundations. Lateral load capacity for deep foundations shall be determined in accordance with Materials Manual Section 660.00. Downdrag loads on foundations shall be estimated in accordance with Manual Section 660.00.
630.6.3 Earthquake Induced Earth Pressures on Retaining Structures. The Monobe- Okabe pseudo-static method shall be used to estimate the seismic lateral earth pressure, as specified in Materials Manual Section 670.00.
630.6.4 Lateral Spread / Slope Failure Loads on Structures. In general there are two different approaches to estimate the lateral spread induced load on deep foundation systems: a displacement based method and a force based method. Displacement based methods are more common in the United States. The force based approach has been specified in Japanese codes and is based on case histories from past earthquakes, especially the pile foundation failures observed during the 1995 Kobe earthquake. Overviews of both approaches are presented below.
630.6.4.1 Displacement Based Approach. The recommended displacement based approach for evaluating the impact of liquefaction induced lateral spreading loads on deep foundations is presented in the NCHRP Report 472 titled “Comprehensive Specification for Seismic Design of Bridges” The general procedure is as follows.
• Evaluate the Liquefaction Potential and assign residual and reduced strengthparameters to liquefied and partially liquefied soil layers
• Conduct slope stability analysis if liquefaction is predicted, using residual and / orreduced strength parameters as appropriate. If the static factor of safety is less thanone, a flow failure is predicted. If the static factor of safety is greater than one, conductpseudo-static stability analysis to determine the yield acceleration.

Materials Seismic Design 630.00
2015
• Check zone of influence to determine if the estimated failure surface could impactbridge foundations. If the foundation is within the zone of influence, estimate theground deformations.
• For potential failure surfaces with static factors of safety less than one for postliquefaction conditions, flow failure is predicted and displacements are expected to belarge. For potential failure surfaces with yield accelerations greater than zero, estimatethe maximum lateral spread induced displacements.
• Assess whether the soil will displace and flow around a stable foundation or whetherfoundation movement will occur in concert with the soil. This assessment requires acomparison between the passive soil forces exerted on the foundation and the ultimateresistance of the foundation system.
The magnitude of the shear induced in the foundations by the ground displacement can be estimated using soil-pile interaction programs such as L-PILE. See Section 660.00.
630.6.4.2 Force Based Approach. A force base approach to estimate lateral spreading induced loads on deep foundations is specified in the Japanese codes. The method is based on back-calculations from pile foundation failures caused by lateral spreading. The pressures on pile foundations are simply specified as follows:
• The liquefied soil exerts a pressure equal to 30 % of the total overburden pressure. Thatis, a lateral earth pressure coefficient of 0.30 applied to the total vertical stress.
• Non-liquefied layers exert full passive pressure on the foundation system.
Data from simulated earthquake loading of model piles in liquefiable sands in centrifuge tests indicate the Japanese Force Method is an adequate design method (Finn and Fujita, 2004)
Another force-based approach to estimate lateral spreading induced foundation loads is to use a limit equilibrium slope stability program to determine the load the foundation must resist to achieve a target safety factor of 1.1. This force is distributed over the foundation in the liquefiable zone as a uniform stress. See Section 640.00 for slope stability procedures.
630.6.5 Mitigation Alternatives. The two basic options to mitigate the lateral spread induced loads on the foundation system are to design the structure to accommodate the loads or improve the ground such that the hazard does not occur.
630.6.5.1 Structural Options
• If the soil is expected to displace around the foundation elements, the foundation isdesigned for the maximum passive force exerted on the foundation by the flowing soil.The maximum loads determined from the P-y springs for large deflections are applied tothe pile / shaft, and the pile / shaft is evaluated using a soil-structure interactionprogram such as L-PILE. The pile/shaft stiffness, strength and embedment is adjusteduntil the desired structural response is achieved. It is customary to evaluate lateralspreading induced loads separately from forces from earthquake shaking. The peak

Materials Seismic Design 630.00
2015
vibration response is likely to occur in advance of maximum ground displacement and at shallower depths.
• If the assessment indicates that movement of the foundation is likely to occur in concertwith the soil, then the structure is evaluated for the maximum expected grounddisplacement. In this case the soil loads are generally not the maximum possible, butinstead some fraction thereof. The P-y data for the soils in question are used toestimate the loading.
• If the deformations are beyond tolerable limits for structural design, the options are: A;To re-evaluate the deformations based on the pinning or doweling action thatpiles/shafts provide as they cross a potential failure plane, or B; Redesign the system toaccommodate the anticipated loads. Simplified procedures for evaluating the availableresistance to slope movements provided by foundation “pinning” action are presentedin (ATC-MCEER Joint Venture, 2002 and Martin et al, 2002.
630.6.5.2 Ground Improvement. It is often cost prohibitive to design the bridge foundation system to resist the loads imposed by liquefaction induced lateral loads, especially if the depth of liquefaction extends more than about 20 feet below the ground surface and if a non-liquefied layer is part of the failure surface. In these cases, ground improvement is the likely alternative.
• The primary ground improvement techniques to mitigate liquefaction fall into threegeneral categories, densification, altering the soil composition and drainage. A generaldescription of these ground improvement approaches is provided below. See Section655.00 for more information on ground improvement.
• Ground improvement by densification consists of sufficiently compacting the soil suchthat it is no longer susceptible to liquefaction during a design seismic event.Densification techniques include vibrocompaction, vibroflotation, vibroreplacement,deep dynamic compaction, blasting and compaction grouting. Vibroreplacement andcompaction grouting also reinforce the soil by creating columns of stone and grout,respectively. The primary parameters for selection include grain-size distribution ofsoils being improved, depth to groundwater, depth of improvement required, proximityto vibration sensitive infrastructure, and access constraints.
• Altering the composition of the soil typically refers to changing the soil matrix so that itis no longer susceptible to liquefaction. Example ground improvement techniquesinclude permeation grouting, jet grouting, and deep soil mixing. These types of groundimprovement are typically more costly than densification/reinforcement techniques, butmay be the most effective if access is limited, induced vibrations must be kept to aminimum, and/or the improved ground has a secondary function such as a seepagebarrier.
• By improving the drainage properties of soils susceptible to liquefaction, it may bepossible to prevent the build-up of excess pore pressure and thus liquefaction.However, drainage improvement may not be entirely successful due to the influence ofdrainage path on the time required for dissipation, and the tendency for drainagestructures to become clogged either during installation or in service.

Materials Seismic Design 630.00
2015
630.7 Seismic Hazard and Site Response Analysis. Site specific analyses shall be completed where required by the AASHTO specification of where geologic conditions may result in un- conservative results if the generalized code hazard and response spectra are used. Special studies may be required to determine site acceleration coefficients where the site is located close to a fault, or if the importance of the bridge dictates a longer exposure period. When site specific hazard characterization is conducted it shall be conducted using the design risk levels specified in Section 630.04.01.
630.7.1 Background Information and Regional Seismicity. Idaho is located in a seismically active region. The intermountain seismic zone includes areas of active faulting in Utah, Idaho, Montana and Wyoming. In Idaho, the highest seismic activity occurs in the Basin and Range Province in Southeastern Idaho, the Basin and Range Structure Province in the East Central Mountain ranges, and the Idaho Batholith and West Central mountains. These geologic provinces are described in ITD Research Project 79, “Maximum Probable Earthquake Accelerations on Bedrock in the State of Idaho”. Greensfelder, R.W. (1976). The Intermountain Seismic Belt and adjacent areas have experienced a Magnitude 6+ event approximately every 10 years. Two earthquakes in recent years in Idaho or near the Montana border were larger than Magnitude 7; Hebgen- Quake Lake in 1959 and Borah Peak in 1983. In the Basin and Range Structure province and in the Yellowstone area, the Maximum Probable event may be as high as Magnitude 7.5. The Hebgen Lake (M-7.1) and the Borah Peak (M7.3) are the two largest known earthquakes to occur in these areas. Greensfelder (1979) estimated the Maximum probable event in the Basin and Range Province in Southeastern Idaho to be Magnitude 6.5. Two earthquakes of Magnitude 6+ occurred in the vicinity of the Pocatello Valley along the Utah- Idaho border; Hansel Valley, 1934 M-6.6 and Pocatello Valley, 1975 M-6.1.
Since publication of Research Project 79, Quaternary activity has been reported on the Cat Creek Fault, northeast of Lowman in Boise County (Luthy 1981), and the Big Flat, Jakes Creek and Squaw Creek Faults in Gem and Washington Counties that extend north from Black Canyon Dam near Emmett ( Gilbert, et al. 1983). More recent work by Gilbert and by Zollweg and Wood in the Hell’s Canyon area may yield additional fault data. Based on fault segment length, the above listed faults can be expected to generate a maximum probable earthquake of Magnitude 6.4 – 6.7.
The Cat Creek Fault described by Luthy is not shown on the Idaho Geologic Survey fault mapping. This fault may be a part of the Deadwood system shown on both the USGS and Idaho Geologic Survey mapping. Another Fault further east along SH 75 is the Sawtooth Fault which also shows late Quaternary activity. The M6+ epicenters located in the Batholith in the 1940s may have been associated with either of these two systems.

Materials Seismic Design 630.00
2015
630.7.2 Design Earthquake Magnitude. In addition to identifying the site’s source zones, the design earthquake must be characterized for use in evaluating seismic geologic hazards such as liquefaction and lateral spreading. Typically the design earthquake(s) are defined by a specific magnitude, source-to-site distance and peak ground acceleration. The design earthquake should be consistent with the design risk levels prescribed in Section 630.04.01. More than one design earthquake may be appropriate depending on the sources that contribute to the site’s seismic hazard and the impact these earthquakes may have on the site response.
The USGS Interactive de-aggregation tool provides a summary of contribution to seismic hazard for earthquakes of various magnitudes and source-to-site distances for a given risk level and may be used to evaluate relative contribution to ground motion from seismic sources. The magnitudes should not be averaged for input into hazard analysis. If any source contributes more than about 10% of the total hazard, design earthquakes representative of each of the sources should be used for ground motion analysis.
Probabilistic seismic hazard analysis (PSHA) and deterministic seismic hazard analysis (DSHA) can be used to characterize the seismic hazard at a site. A DSHA consists of evaluating the seismic hazard at a site for a specific magnitude earthquake occurring at a specific location. A PSHA consists of completing a number of DSHA for all feasible combinations of earthquake magnitude and source-to-site distance. PSHA’s and DSHA’s may be required where the site is located close to a fault or if the importance of the structure is such that a longer exposure period is required.

Materials Seismic Design 630.00
2015
630.7.3 Attenuation Relationships. Attenuation relationships describe the decay earthquake energy as it travels from the seismic source to the project site. Many of the published relationships are capable of accommodating site soil conditions as well as varying fault type, location relative to the fault, near field effects etc. For both PSHA and DSHA, attenuation relationships used in analysis should be selected based on applicability to both the site conditions and the type of seismic source. Clearly document the rationale for the selection of and assumptions underlying the use of attenuation relationships for risk characterization. One attenuation relationship was developed by Campbell (1987) for earthquakes occurring on basin and range faults in Utah, and was used to develop the acceleration contour maps in this Manual. Using at least three attenuation relationships is recommended.
630.7.4 Site Specific Response Analysis. Site-specific seismic response analyses are generally based on the assumption of a vertically propagating shear wave through uniform horizontal soil layers of infinite lateral extent. The influence of vertical motions, compression waves, laterally non-uniform soil conditions, incoherence and spatial variation of ground motions are typically not accounted for in conventional seismic site response analyses (Kavazanjian, et al., 1997). Evaluation solely of the impact of vertically propagating shear waves in a site response analysis is consistent with common design and code practices. It is also consistent with geotechnical engineering analysis for liquefaction potential and seismic slope stability, which consider only the horizontal component of the seismic motions. Three different levels of site-specific seismic response analysis are available.
• Simplified (empirical) analysis;• Equivalent-linear one-dimensional site response analyses; and• Advanced one- and two-dimensional site response analyses.
630.7.4.1 Simplified Analysis: For screening purposes and preliminary analysis, the influence of local soil conditions on seismic site response can be assessed in a simplified manner using empirical relationships. Earthquake magnitude and peak acceleration at a hypothetical bedrock outcrop at the project site are generally evaluated as part of the seismic hazard analysis. Several investigators have developed empirical relationships between the peak ground acceleration at a hypothetical rock outcrop at the project site to the peak ground acceleration at the site as a function of the local soil conditions. Table 630.04.01 shows NEHRP site classifications and amplification factors for peak rock acceleration. An additional break down of soil classification is presented by Borchert, (1994). Relationships between Peak Horizontal Ground Acceleration on Rock for different local soil conditions have been published by Seed and Idriss (1982) and updated for soft soils by Idriss (1990). Harder (1991) published a comparison of horizontal acceleration at the base of an embankment and crest accelerations. The simplified analysis consists of four steps.
1. Classify the site: Using Table 630.04.1 and/or the published relationships referencedabove, classify the site on the basis of the average shear wave velocity for the top 100feet of soil.

Materials Seismic Design 630.00
2015
2. Estimate the hypothetical free-field bedrock acceleration at the site: Using methodsdiscussed in Section 630.04.01 and Section 630.07.01.
3. Estimate the free-field acceleration at the site: Estimate the potential amplification ofthe hypothetical bedrock peak ground motion by the local soil conditions based on thesoil profile classification.
4. Estimate the peak acceleration at the top of the embankment. Use the relationships byMakdisi and Seed, (1978), or Harder,(1991). For a given embankment height and peakacceleration at the crest, the peak average acceleration may be estimated at anyelevation within and embankment from the Makdisi and Seed (1978) chart.
630.7.4.2 Equivalent-Linear-One Dimensional Site Response Analysis: When an analysis more accurate than the simplified analysis is desired, a formal seismic site response analysis can be performed. Equivalent-linear one-dimensional analysis is by far the most common method used in engineering practice to analyze seismic site response. Even if a two dimensional embankment or slope is to be analyzed, a one-dimensional analysis can be used.
The soil profile is modeled as a horizontally layered, linear visco-elastic material characterized by an initial shear modulus and an equivalent viscous damping ration. To account for strain- dependent behavior the equivalent-linear modulus and equivalent viscous damping ration are evaluated from the modulus reduction and damping curves, Figures 630.03.1 and 630.03.2.
The computer program SHAKE, originally developed by Schnabel et.al. (1972), updated by Idriss and Sun (1992) as SHAKE91, and further updated as SHAKE2000 by Ordoñez, (2000), is the most commonly used computer program for one-dimensional equivalent-linear seismic site response analysis. The original SHAKE program is available in Headquarters’ Materials. SHAKE91 is available from the National Information Service for Earthquake Engineering (NISEE) at the University of California, Berkeley.
Basic input includes the soil profile, soil parameters and the input acceleration time history. Soil parameters include the shear wave velocity or initial (small strain) shear modulus and the unit weight for each soil layer. Also curves relating the shear modulus reduction and equivalent viscous damping ratio to shear strain for each soil type are used. The acceleration time history may be input either as the motion at a hypothetical rock outcrop or at the bedrock-soil interface at the base of the soil column. The results include shear stress, shear strain, and acceleration time histories and peak values for the ground surface, hypothetical rock outcrop, and for each soil layer.
Selecting the input acceleration time history is difficult in Idaho, since there are few available rock records for the range of probable magnitudes and site distances. The record of the 1935 earthquake in Helena, Montana has been used to represent Intermountain Seismic Zone events. More recent records may be available for the 1959 Hebgen and 1983 Borah Peak events. In selecting a time-history from the catalog of available records, an attempt should be made to

Materials Seismic Design 630.00
2015
match as many of the relevant characteristics of the design earthquake as possible. Important characteristics that should be considered include:
• Earthquake Magnitude• Source mechanism (e.g., strike-slip, dip slip, or oblique faulting)• Focal depth• Site-to-source distance• Site geology• Peak ground accelerations• Frequency content• Duration, and• Energy content
The relative importance of these factors varies from case to case. Scaling of the peak acceleration is often necessary to match the design earthquake, but scaling by more than a factor of two should be avoided.
In the absence of an appropriate rock record, generic publically available synthetic ground motions generated to represent and event of the target magnitude may be used. Simulation techniques can be used to generate a project-specific time history starting from the source and propagating the appropriate wave forms to the site to generate a suite of time histories to represent the ground motions at the site of interest.
A very comprehensive discussion of the equivalent-linear one-dimensional seismic site response analysis and selection of the site specific parameters and time histories is presented in FHWA Geotechnical Engineering Circular No. 3. by Kavazanjian et.al. (1997).
630.7.4.3 Two Dimensional Site Response Analysis: A variety of finite element and finite difference computer programs are available for use in two dimensional seismic site response analyses. The computer programs QUAD4 by Idriss et. al. (1973) and updated version QUAD4M by Hudson (1994) are two of the most commonly used finite element programs for two- dimensional analysis. QUAD4 M uses an equivalent-linear soil model similar to that used in SHAKE. Time history of vertical motion may also be applied at the rock soil interface. Limited pre- and post-processing capabilities make finite element mesh generation and processing and interpretation of the results difficult and time consuming. QUAD4M is available from NISEE at the University of California at Berkeley.

Materials Seismic Design 630.00
2015
630.08 References.
Bray, J. and Rathje, E., 1998, “Earthquake Induced Displacements of Solid Waste Landfills.” ASCE Journal of Geotechnical and Geoenvironmental Engineering, Bol. 124.
Bray, J.D., and Sancio, R.B., 2006, “Assessment of the Liquefaction Susceptibility of Fine Grained Soils.” ASCE Journal of Geotechnical and Geoenvironmental Engineering, Vol. 132, No. 9.
Bowles, J.E., 1996, Foundation Analysis and Design, Fifth Edition, The McGraw-Hill Companies, Inc., New York.
ATC-MCEER Joint Venture, 2001, Recommended LRFD Guidelines for the Seismic Design of Highway Bridges, Parts I and II, National Cooperative Research Program, NCHRP Project 12-49.
ATC-MCEER Joint Venture, 2002. Comprehensive Specification for the Seismic Design of Bridges, NCHRP Report 472, National Cooperative Research Program, Washington D.C.
Campbell, K.W., 1987. “Predicting Strong Ground Motion in Utah.” U.S. Geological Survey, Open File Report 87-585, Denver, Colorado.
Electrical Power Research Institute, 1993, Guidelines for Site Specific Ground Motions. Palo Alto CA., EPRI, November-TR-10/22/93.
Finn, W.D. Liam and Fujita, N., 2004, “Behavior of Piles in Liquefiable Soils During Earthquakes, Analysis of Design Issues.” Proceedings: Fifth International Conference on Case Histories in Geotechnical Engineering, New York, NY, April 13-17, 2004.
Gilbert, J.D., Piety, L. and LaForge, R., 1983. “Seismotechtonic Study, Black Canyon Diversion Dam and Reservoir, Boise Project, Idaho.” U.S. Bureau of Reclamation, Seismotectonic Report, 83 – 7.
Greensfelder, R.W., 1976. “Maximum Probable Earthquake Accelerations on Rock in the State of Idaho,” Research Project 79, Idaho Transportation Department, Boise, Idaho.
Hamada, M., Towata, I., Yasuda, S. and Isoyama, R., 1987. “Study on Permanent Ground Displacements Induced by Seismic Liquefaction,” Computers and Geomechanics, Vol. 4.
Harder, L.F. Jr., 1991. “Performance of Earth Dams During the Loma Prieta Earthquake.” Proceedings, Second International Conference on Recent Advances in Geotechnical Earthquake Engineering and Soil Dynamics, University of Missouri, Rolla.
Hudson, M., Idriss, I.M. and Beikae, M., 1994 (“ QUAD4M – A Computer Program to “Evaluate the Seismic Response of Soil Structures using Finite Element Procedures and Incorporating a Compliant Base.” User’s Manual, Center for Geotechnical Modeling, Department of Civil and Environmental Engineering, University of California, Davis California.

Materials Seismic Design 630.00
2015
Idriss, I.M., 1990. “Response of Soft Soil Sites During Earthquakes.” Proceedings, Memorial Symposium to Honor Professor H.B. Seed, Berkeley, CA.
Idriss, I.M., and Sun, J.I. 1992. “User’s Manual for SHAKE91.” Center for Geotechnical Modeling , Department of Civil and Environmental Engineering, University of California, Davis, California.
Idriss, I.M., and Boulanger, R.W., 2007, “Residual Shear Strength of Liquefied Soils,” Proceedings of the 27th USSD Annual Meeting and Conference, Modernization and Optimization of Existing Dams and Reservoirs.
Idriss, I.M. and Boulanger, R.W. 2008, Soil Liquefaction During Earthquakes, Earthquake Engineering Research Institute (EERI), MNO-12.
Idriss, I.M.; Lysmer, j.; Hwang, R. and Seed, H.B., 1973. “QUAD4 – A Computer Program for Evaluating the Seismic Response of Soil Structures by Variable Damping Finite Element Procedures.” Report No. EERC 73-16, Earthquake Engineering Research Center, University of California, Berkeley, California.
International Code Council, Inc. 2006, 2006 International Building Code, Country Club Hills, Illinois.
Ishihara, K., and Yoshimine, M., 1992. “Evaluation of Settlements in Sand Deposits Following Liquefaction During Earthquakes.” Soils and Foundations, ASCE JSSMFE, Vol 32, No.1
Kavazanjian, E., Matasovic, J. Wang, G. Martin, A. Shamsabadi, I. Lam, S. Dickenson and J. Hung. August 2011 (Rev 1) Geotechnical Engineering Circular #3, LRFD Seismic Analysis of Design of Transportation Geotechnical Features and Structural Foundations, Report No. FHWA-NHI-11- 032, U.S. Dept. of Transportation Federal Highway Administration.
Kramer, S.L., 1996. Geotechnical Earthquake Engineering. Prentice-Hall, Inc., Upper Saddle River, NJ.
Luthy, S.T., 1981, “The Petrology of Cretaceous and Tertiary Intrusive Rocks of the Red Mountain – Bull Trout Point Area, Boise, Custer and Valley Counties, Idaho.” University of Montana, M.A.Thesis
Makadisi, F.I. and Seed, H.B., 1978. “Simplified Procedure for Estimating Dam and Embankment Earthquake Induced Deformations.” ASCE Journal of the Geotechnical Engineering Division, Vol. 104, No. GT7.
Newmark, N.M., 1965. “Effects of Earthquakes on Dams and Embankments.” Geotechnique, 15(2).
Ordoñez, G.A., 2000. Shake 2000, Computer Software.
Materials Seismic Design 630.00
2015
Sabatini, P.J., Gachus, R.C., Mayne, P.W., Schneider, J.A., and Zetter, T.E., 2002. Geotechnical Engineering Circular No. 5, Evaluation of Soil and Rock Properties, Report No. FHWA-IF-02-034. U.S. Dept. of Transportation, FHWA, Washington, D.C.
Schnabel, P.B., Lysmer, J. and Seed, H.B., 1972. “SHAKE: A Computer Program for Earthquake Response Analysis of Horizontally Layered Sites,” Report No. EERC 72-12, Earthquake Engineering Research Center, University of California, Berkeley, California. http://nisee.berkeley.edu/elibrary/getpkg?id=SHAKE91
Schmidt. D.L. and Mackin, J.H., 1970, “Quaternary Geology of Long and Bear Valleys, West Central Idaho.” U.S. Geological Survey Bulletin, 1311 – A.
Seed, H.B. and Idriss, I.M, 1970. Soil Moduli and Damping Factors for Dynamic Response Analysis. Report No. EERC 70-10. University of California, Berkeley.
Seed, H.B. and Idriss, I.M., 1971. “Simplified Procedure for Evaluating Soil Liquefaction Potential.” ASCE Journal of Soil Mechanics, Foundations Division, Volume 97, No. SM9.
Seed, H.B. and Idriss, I.M., 1982, “Ground Motions and Soil Liquefaction During Earthquakes.” Monograph No. 5, Earthquake Engineering Research Institute, Berkeley, CA.
Seed, H.B. and Harder, L.F., 1990. “SPT-Based Analysis of Cyclic Pore Pressure Generation and Undrained Residual Strength.” Proceedings, H. Bolton Seed Memorial Symposium, University of California, Berkeley, Vol. 2.
Stewart, J.P., Liu, A.H. and Choi, Y., 2003. “Amplification Factors for Spectral Acceleration in Tectonically Active Regions.” Bulletin of Seismological Society of America, Vol. 93, No. n1.
Tokimatsu, K. and Seed, H.B., 1987. “Evaluation of Settlement in Sands Due to Earthquake Shaking.” ASCE Journal of Geotechnical Engineering. Vol. 113, No.8.
Vucetic, M. and Dobry, R. 1991. “Effect of Soil Plasticity on Cyclic Response.” ASCE, Journal of Geotechnical Engineering, Vol. 117, No. 1.
Youd, T.L.; Idriss, I.M.; Andrus, R.D.; Arango, I.; Castro, G,; Christian, J.T.; Dobry, R.; Finn, W.D.; Harder, L.; Hynes, M.E.; Ishihara, K.; Koester, J.P.; Liao, S.S.C.; Marcuson, W.F.; Martin, G.R.; Mitchell, J.K.; Moriwaki, Y.; Power, M.S.; Robertson, P.K.; Seed, R.B. and Stokoe, K.H., 2001. “Liquefaction Resistance of Soils, Summary Report from the 1996 NCEER and 1998 NCEER/NSF Workshops on Evaluation of Liquefaction Resistance of Soils.” ASCE Journal of Geotechnical and Geoenvironmental Engineering. Volume 127, No 10.
Youd, T.L..; Hansen, C.M. and Bartlett, S.F., 2002. “Revised Multilinear Regression Equations for Prediction of Lateral Spread Displacements.” ASCE Journal of Geotechnical and Geoenvironmental Engineering, vol. 128, n. 12.

Materials Slope Stability 640.00
2015
SECTION 640.00 - SLOPE STABILITY
640.1 Introduction. Slope stability analysis is used in a wide variety of geotechnical engineering problems including, but not limited to:
• Determination of stable cut and fill slopes.• Assessment of overall stability of retaining walls, including permanent and temporary
shoring systems.• Assessment of overall stability of shallow and deep foundations for structures located
on slopes or over potentially unstable soils, including determination of lateral forcesapplied to foundations and walls due to potentially unstable slopes.
• Stability assessment of landslides (mechanism of failure, back calculation of designproperties) and design of mitigation or stabilization techniques.
• Evaluation of instability due to liquefaction.
Types of slope stability analyses include rotational slope failure, sliding block analysis, irregular surfaces of sliding and infinite slope failure. Analysis techniques for soil slopes are also appropriate for highly fractured rock masses that can in effect be treated as soil. Stability analysis for intact rock slopes is described in Section 641.00. Stability Analysis of Landslides is described in Section 645.00.
640.2 Design Parameters and Other Input Data for Slope Stability Analysis. The input data needed for slope stability analysis is described in Section 400.00, Guidelines for Subsurface Investigations. Section 620.00 provides requirements for the assessment of design property input parameters.
A detailed assessment of soil and rock stratigraphy is critical to the assessment of slope stability, and in itself is an input parameter for slope stability analysis. Define any thin and or weak layers present, the presence of slickensides or other evidence of previous instability, etc. as these details could control the stability of the slope in question. Knowledge of the geologic nature of the units present at the site and knowledge of past performance of these units may also be critical factors.
Whether short-term (end of construction ) or long-term conditions will control stability of the slope in question , will affect the soil and rock shear strength parameters used in the analysis. For short-term analysis, undrained shear strength parameters should be obtained. For long- term analysis, drained shear strength parameters should be obtained. Coarse granular soils may exhibit drainage regardless of whether short-term or long-term conditions are analyzed. For assessing the stability of landslides, residual shear strength parameters will be needed. For heavily over consolidated, stiff fissured clays in particular, residual strength parameters should be used for design

Materials Slope Stability 640.00
Detailed information regarding the ground water regime within and beneath the slope is also critical. Piezometric data at multiple locations and depths within and below the slope may be needed depending on the complexity of the groundwater conditions. Possible seepage at the face of the slope must be addressed and in some cases a flow net analysis may be needed. The potential for soil piping should be addressed if seepage exits the slope face, particularly in erodible silts and sands. Long-term monitoring may be needed if the groundwater level fluctuates seasonally or responds quickly to significant rain fall.
640.03 Design Requirements. Limit equilibrium methods shall be used to assess slope stability. The Modified Bishop, simplified Janbu, Spencer or other widely accepted slope stability analysis methods should be used for rotational and irregular surface failure mechanisms. In cases where the stability failure mechanisms are not well modeled by limit equilibrium methods, or if deformation analysis is required, more sophisticated analysis techniques (such as finite difference methodologies) may be used in addition to the limit equilibrium methods. Since these more sophisticated methods are sensitive to the quality of the input data, limit equilibrium methods should also be used. Engineering judgment should be applied in conjunction with field observations to assess differences between methods.
If the potential slope failure mechanism is expected to be relatively shallow and parallel to the slope face, with or without seepage effects, an infinite slope analysis should be performed. For infinite slope analysis, slope heights should be at least 15 to 20 feet. For infinite slopes consisting of cohesionless soils, either above the water table or fully submerged, the factor of safety for slope stability is determined as follows:
𝐹𝐹𝑆𝑆 = tanΦ tanβ⁄
where: FS = Factor of Safety Φ = The angle of internal friction for the soil. β = The slope angle relative to the horizontal.
For infinite slopes that have seepage at the slope face, the factor of safety for slope stability is determined as follows:
𝐹𝐹𝑆𝑆 = (𝛾𝛾𝑏𝑏 𝛾𝛾𝑠𝑠⁄ )(tan𝜙𝜙 tan𝛽𝛽⁄ )
where: 𝛾𝛾𝑏𝑏 = Buoyant unit weight of the soil (pcf). 𝛾𝛾𝑠𝑠 = Saturated unit weight of the soil (pcf).
Since the buoyant unit weight is roughly half of the saturated unit weight, seepage on the slope face can reduce the factor of safety by a factor of two. This condition should be avoided with some type of drainage or a much flatter slope. If the factor of safety in an infinite slope analysis is below 1.15, severe erosion or shallow slumping is likely to occur. Vegetation on the slope can
1/10

Materials Slope Stability 640.00
2015
help alleviate this problem. Note that an infinite slope analysis does not preclude the need to check for deeper slope failure mechanisms.
For very simplified cases, design charts are available to assess slope stability. Examples of simplified design charts are presented in Chapter 7, NAVFAC DM-7.1. These charts are for a cohesive (Φ = 0) soil, and apply only to relatively uniform soil conditions within and below the slope These parameters should be considered for general guidance, and good engineering judgment should be applied to the task of estimating soil parameters for this type of analysis. Simplified design charts should not be used for final design except on non-critical slopes approximately 10 ft. high or less that are consistent with the simplified assumptions used in the design chart. The simplified charts can be used for preliminary analysis of larger slopes.
640.4 Safety Factors for Slope Stability Analysis. For overall stability analysis of walls and structure foundations, design shall be consistent with Materials Manual Section 630.00, Section 660.00 and Section 670.00. For slopes adjacent to but not directly supporting structures, a minimum safety factor of 1.30 should be used. For foundations on slopes that support structures such as bridges and retaining walls, a minimum safety factor of 1.5 should be used. Where minor walls have a minimal impact on the stability of the slope, the 1.3 safety factor should be used.
For general slope stability analysis of permanent cuts, fills and landslide repairs, a minimum safety factor of 1.25 can be used. Larger safety factors should be used if there is significant uncertainty in the slope analysis input parameters. The Monte Carlo simulation features now available in some slope stability programs may be used to determine the probability of failure, provided a coefficient of variation can be determined for each of the input parameters.
Cut-slopes that are part of a temporary excavation, not supporting a structure, shall be designed for a minimum factor of safety of 1.25. If the soil properties are well defined and have low variability, a lower factor of safety may be justified through the use of the Monte Carlo simulation. In this case, a probability of failure of 0.01 or smaller shall be targeted. However, in no case shall a slope safety factor of less than 1.2 be used for the design of temporary cut- slopes.
For seismic analysis a minimum safety factor of 1.10 should be used for slopes involving or adjacent to walls and structure foundations. For other slopes, a minimum safety factor of 1.05 shall be used.
Table 640.04.01.1 shows the probability of failure for various conditions.

Materials Slope Stability 640.00
2015
Table 640.04.01.1: Slope Stability – Probability of Failure (Adapted from WSDOT GDM Table 7- 1 after Santamarina, et al.,1992)
Conditions Probability of Failure,(Pf)
Unacceptable in most cases > 0.1
Temporary structures with no potential life loss and low repair cost
0.1
Slope of riverbank at docks no alternative docks, pier shutdown threatens operations
0.01 to 0.02
Low consequences of failure, repairs when time permits, repair cost less than cost to go to a lower Pf
0.01
Existing large cut on Interstate Highway 0.01 to 0.02
New large cut (i.e., to be constructed on Interstate Highway) 0.01 or less
Acceptable in most cases except that lives may be lost 0.001
Acceptable for all slopes 0.0001
Unnecessarily low 0.00001
640.5 Stability Analysis Computer Programs. Two computer programs for performing slope stability analysis are available in the ITD Construction/Materials Section, X-STABL and SLIDE. X- STABL was developed by the University of Idaho for ITD in 1991, with periodic updates. It is DOS based and handles most of the well-known limit equilibrium programs. It handles anchors by increasing the strength of the anchored layer. It will handle walls and reinforced sections. X- STABL is available in some Districts.
SLIDE, v5.0, developed by Rocscience in 2007 is a comprehensive slope stability program which handles the well-known limit equilibrium methods plus back calculation, and probability analysis. It includes built-in steady-state unsaturated groundwater analysis, and sensitivity analysis for parametric studies. SLIDE 5.0 is available in the Construction/Materials Section and in some Districts. For further information on slope stability analysis, contact the Construction/Materials Section (Geotechnical Engineer).
640.6 References.
NAVFAC DM – 7.1 Soil Mechanics Design Manual, 1982, Department of the Navy, Naval Facilities Engineering Command.
Rocscience, 2007. SLIDE, A Slope Stability Computer Program. Toronto, Ontario, Canada.
Santamarina, L.C., Altschaeffl, A.G. and Chameau, J.L.,1992. “Reliability of Slopes: Incorporating Qualitative Information.” Transportation Research Board, TRR 1343.

Materials Rock Slope Stability 641.00
SECTION 641.00 - ROCK SLOPE STABILITY
The assessment of stability and the design of intact rock cuts is usually concerned with the details of the structural geology, that is, the orientations and characteristics (such as length, roughness, and infilling materials) of the joints, bedding planes and faults that occur behind the rock face. For most rock cuts on highway projects, the stresses in the rock are much less than the rock strength, so there is little concern that fracturing of intact rock will occur, and slope design is concerned with the stability of blocks of rock formed by the discontinuities. The requirements for the geotechnical investigation of slopes are presented in Section 425.00. Information on field testing of rock is contained in Section 450.04.02. Guidelines for the classification of rock are contained in Section 455.00.
Instability in rock cuts typically takes the form of plane failure, wedge failure, toppling failure or circular failure. Circular failure is limited to highly fractured or weathered rock that exhibits the characteristics of a soil slope. Plane failure could occur on bedding planes or joints which dip into the slope at an angle flatter than the slope face. Wedge failures can occur when a block of rock is bounded by bedding, joints or faults that create an unsupported block of rock. Toppling failure can occur when bedding or joints dip steeply into the slope. Stereographic projection can aid in determining the potential for failure. See Hoek and Bray, (1977) and (1988).
641.01 Mechanics of Rock Slope Stability. The stability of rock slopes for the geologic condition in which bedding planes or other discontinuities daylight on the slope face depends on the shear strength generated on the sliding surface. For all shear type failures, the rock can be assumed to be a Mohr-Coulomb material in which the shear strength is expressed in terms of cohesion and a friction angle. The shear stress developed where the effective normal stress is acting on a sliding surface is:
𝜏𝜏 = 𝑑𝑑 = 𝜎𝜎′ tan𝜙𝜙 where: τ is the shear stress (psf) c is cohesion (psf), 𝜎𝜎’ is the effective normal stress (psf), 𝜙𝜙 is the friction angle (degrees).
641.01.01 Planar Failure. The calculation of the factor of safety for the conditions shown in Figure 641.01.01.1 involves the resolution of forces acting on the sliding surface into components acting perpendicular and parallel to this surface. If the dip of the sliding surface is ψp (degrees), the area of the sliding surface is A, and the weight of the block lying above the sliding surface is W, then the normal and shear stresses on the sliding plane are: Normal stress 𝜎𝜎 = 𝑊𝑊cos𝜓𝜓𝑝𝑝 𝐴𝐴 (psf)⁄
Shear stress 𝜏𝜏𝑠𝑠 = 𝑊𝑊sin𝜓𝜓𝑝𝑝 𝐴𝐴 (psf)⁄
1/14

Materials Rock Slope Stability 641.00
Figure 641.01.01.1: Method of Calculating Factor of Safety of a Sliding Block
Factor of Safety 𝐹𝐹 = [resisting forces driving forces⁄ ] 𝐹𝐹 = �𝑑𝑑𝐴𝐴 + 𝑤𝑤 cos𝜓𝜓𝑝𝑝 tan𝜙𝜙 𝑤𝑤 sin𝜓𝜓𝑝𝑝⁄ � where: c is soil cohesion in psf, and 𝜙𝜙 is soil friction angle in degrees. If the sliding surface is clean and contains no infilling then the cohesion is likely to be zero
and the equation reduces to: 𝐹𝐹 = cos𝜓𝜓𝑝𝑝 tan𝜙𝜙 sin𝜓𝜓𝑝𝑝⁄
since: tan𝜙𝜙 = sin𝜓𝜓𝑝𝑝 cos𝜓𝜓𝑝𝑝⁄ 𝐹𝐹 = tan𝜙𝜙 tan𝜓𝜓⁄
This shows that for a clean, dry surface with no support installed, the block of rock will slide when the dip angle of the sliding surface equals the friction angle of the surface, and that stability is independent of the size of the block. Limit Equilibrium analysis can be applied to a wide range of conditions and can incorporate internal forces such as water pressure acting on the sliding surface, applied forces such as earthquake loading and external reinforcing forces such as rock anchors.
Water pressures acting on a tension crack (V, psf) and as uplift (U, psf) on the sliding surface can be calculated as follows:
𝑉𝑉 = 0.5𝛾𝛾𝑤𝑤ℎ𝑤𝑤2
𝑈𝑈 = 0.5𝛾𝛾𝑤𝑤ℎ𝑤𝑤𝐴𝐴
1/14

Materials Rock Slope Stability 641.00
where: 𝛾𝛾𝑤𝑤 is the unit wt. of water (pcf) ℎ𝑤𝑤 is the height of water in the tension crack (feet) A is the area of sliding surface (sq. ft.) The factor of safety is then calculated by the following:
𝐹𝐹 = �𝑑𝑑𝐴𝐴 + �𝑤𝑤 cos𝜓𝜓𝑝𝑝 − 𝑈𝑈 − 𝑉𝑉 sin𝜓𝜓𝑝𝑝� tan𝜙𝜙 � �𝑤𝑤 sin𝜓𝜓𝑝𝑝 + 𝑉𝑉 cos𝜓𝜓𝑝𝑝��
Similarly and equation can be developed for a reinforced slope with a tensioned rock bolt anchor is installed with the anchor below the sliding plane. Earthquake accelerations are applied as horizontal loads on the sliding mass as discussed in Section 630.06.01.
The computer program SLIDE will handle the sliding block analysis as well as irregular sliding surfaces and provide a probability of failure. It is a two-dimensional analysis method and is not suitable for wedge failure analysis.
641.01.02 Wedge Failure. A wedge failure occurs when a wedge of rock is bounded on one side by a bedding plane, joint or other discontinuity and by an intersecting discontinuity. Analysis of a wedge failure is presented in Munfakh, Wylie, and Mah, Rock Slopes Reference Manual, FHWA HI-99-007 (1998). This reference includes wedge stability charts for friction only by Hoek and Bray (1977).
641.01.03 Toppling Failure. Toppling occurs when steeply dipping strata or columns rotate about some fixed base. In flexural toppling, continuous strata or columns are separated by well-developed steeply dipping discontinuities and break in flexure as they bend forward. Block toppling occurs when individual columns of hard rock are divided by widely spaced orthogonal joints. The short columns forming the toe of the slope are pushed forward by the loads from the longer overturning columns behind. This movement at the toe allows further toppling upslope. The base of the failure is better defined than in flexural toppling. There are a number of secondary toppling modes, often in response to overburden pressure or upslope slides.
A limit equilibrium method for analyzing toppling is described in Munfakh et. al (1998). A computer program UDEC by the Itasca group in Minnesota is one of the most suitable programs for analyzing toppling. It can incorporate a number of materials with differing strength properties.
641.01.04 Circular Failures. Circular failures in rock occur in very closely fractured, highly weathered rock and in weakly cemented rock in which there is no strongly defined structure. Broken rock in a large fill will also behave in a similar fashion to that of soil. Analyses of circular failures in rock are performed as in soil slope stability analysis presented in Section 640.00.
Circular failure charts developed by Hoek and Bray (1977) are presented in Munfakh et.al.,(1998), Chapter 7. These charts were developed by running a search routine for the critical combination of failure surface and tension crack for a wide range of slope geometries and ground water conditions. They are valuable for checking the sensitivity of the factor of safety of a slope to a wide range of conditions, particularly in preliminary analyses. These charts
1/14
Materials Rock Slope Stability 641.00
2015
are based on the assumption that the material forming the slope has uniform properties throughout, and that the circular failure passes through the toe of the slope. When these conditions do not apply, use analysis methods such as Bishop’s or Janbu’s, included in the computer programs described in Section 640.05. Janbu’s method will handle irregular surfaces, and is most suitable for relatively shallow failures in materials with friction angles of 30 degrees or more. Janbu’s method should be avoided for analysis of deep failures in material with low friction angles.
641.1.5 Blasting. Blasting can produce fractures in a rock slope well behind the slope face. The zone of crushed rock around the blast holes is controlled by reducing the energy or decoupling the explosive charge in the holes, and by reducing the explosive weight per delay. The design of the blast is the responsibility of the Contractor, but the Contractor should retain the services of a qualified blasting Consultant. Munfakh et. al., (1998) Chapter 9, is devoted to an extensive discussion of blasting techniques, blast design and damage control. Seminar material provided to the department by Konya provides up dated and detailed information on blast design.
641.2 Stabilization of Rock Slopes. Constructing and maintaining transportation facilities in mountainous terrain often require controlling or mitigating rock falls and rock slope failures. A system of hazard rating of rock slopes has been developed by ITD Maintenance and Materials through a research contract with the University of Idaho. The program, called Highway Slope Instability Management System (HiSIMS), is available on the ITD Intranet at: http://intranetapps/apps/hisims/.
Rock slope stabilization programs to minimize rock falls or rock slope failures are described in a number of sources, including Munfakh et al, (1998). It is essential that appropriate stabilization methods be used for the particular conditions at each site. For most rock slopes in highway construction, a factor of safety for long term stability should be at least 1.5. Transportation Research Board Special Report 247, Landslide Investigation and Mitigation, 1966, provides in depth description of rock slope stabilization methods and is extensively used by Munfakh et al. (1998).
The causes of rock fall will vary from site to site, depending on local weather, vegetation, earthquakes, seepage, weathering, geologic structure, etc. In one study, done in California, over half of the rock falls were caused by rain or freeze-thaw. Rock slope stabilization measures consist of reinforcement and removal methods. Re-sloping, trimming, scaling and individual rock removal are the common methods of combating rock fall. Reinforcement methods include rock bolting and dowels, tied-back walls, buttresses, (either rock or concrete), shotcrete, and drainage. Rock fall protection measures include, crown ditches, mesh curtains, catch fences, warning fences, and tunnels or rock sheds. The appropriate stabilization techniques will need to take into account topography, access, costs and issues with the environment. Environmental aspects involve the visual impact of the stabilization method and issues like acid drainage. Rock with a significant percentage of iron sulfides will produce highly acidic runoff, which can damage metal items such as culverts or drainage facilities, and degrade stream quality.

Materials Rock Slope Stability 641.00
2015
Typical reinforcement techniques are shown in Figure 641.02.01.1. Each of these techniques must be designed appropriately for the specific problem.
The various types of anchors and installation techniques are presented in Munfakh et. al.,(1998). Allowable bond stress for grouted anchors related to rock strength are presented in Wylie,(1991). Tensioned anchors are typically used to provide normal stress to discontinuities in order to increase shear strength. Where preconstruction reinforcement is installed prior to making a cut in rock, fully grouted, un-tensioned rock anchors are often used. The stress in the anchor is applied due to the excavation.
Figure 641.02.01.1: Rock Slope Reinforcement Methods (Landslide Investigation and Mitigation, TRB Special Report 247, 1996).
641.2.1 Tied Back Walls. Tiebacks are another anchoring system. Here, the anchors are tensioned to provide support to a rock cut. The wall is typically constructed as the cut is excavated. Anchors are installed as the cut progresses. Soldier piles or drilled piers are typically installed prior to making the cut. Typically, timber lagging is installed between the soldier piles as the cut progresses. The wall is intended to distribute the anchor loads into the rock face. Drainage of the rock behind the wall is of utmost importance.
Materials Rock Slope Stability 641.00
2015
641.2.2 Shotcrete. Shotcrete or gunnite can be used to prevent raveling of closely fractured or degradable rock zones, but will provide little support against sliding. Shotcrete is typically applied in a 3 or 4 inch-thick lift and may be reinforced with welded wire mesh or steel fibers. The effectiveness of shotcrete depends largely on the condition of the rock surface. The surface should be damp, free of loose rocks, soil, vegetation and ice. Drain holes should be drilled 18 inches to 2 feet deep through the shotcrete into the rock, at about 3 to 6 foot spacing.
641.2.3 Buttresses. Overhanging rock layers can be effectively supported by buttresses, and they can prevent further erosion of weaker rock. Buttresses should be designed so that the thrust from the rock supports the buttress in compression. In some instances, the buttress can be anchored with steel pins to prevent sliding. Non-shrink additives should be used to maintain contact with the overhanging rock. To maintain contact with the overhang, the top of the buttress may need to be placed through a hole drilled through the overhang or pressure grouted. As with other support schemes, drain holes are needed to prevent hydrostatic pressure on the buttress.
641.2.4 Drainage. Positive drainage is a necessity in almost all rock support schemes. Ground water in rock slopes is often a contributory cause of instability. Drains are usually drilled into the rock at the toe of the slope. It is important that the drain holes intersect the discontinuities that are carrying water. The holes are drilled on an upward slope to facilitate gravity drainage. The angle, depth and spacing of drain holes are dependent on the specific site geology. As a rule of thumb, drain holes should extend to a depth at least one-third the height of the cut, and should be spaced 10 to 30 feet apart. Perforated casing is often installed in the drain holes to maintain an open hole. The discharge from several individual drains is often collected in a manifold and directed away from the cut.
Other methods of reducing water pressures in rock slopes include diversion ditches behind the crest of the slope and sealing surface cracks above the slope with clay or plastic sheeting. Piezometers installed in the slope can be used to monitor the ground water levels and indicate the effectiveness of drainage.
641.2.5 Re-sloping and Unloading. This process can take the form of excavation of material from the top of the slope or flattening the slope where weaker or more weathered rock occurs at the top of a slope. The effect of long term weathering must also be taken into account. Slopes in granite will often degrade with time. The slope should account for the weathered condition, through flatter slopes, periodic benches and wide ditches to facilitate clean up of debris.

Materials Rock Slope Stability 641.00
2015
641.2.6 Trimming and Scaling. Removing overhanging rock and loose blocks in shattered zones is accomplished by trimming and scaling. Trimming is usually done by presplit blasting techniques with closely spaced, lightly loaded holes. Scaling removes loose rock, soil and vegetation on the face of a slope using hand tools. On steep slopes, scaling personnel are usually supported by ropes anchored at the crest of the slope.
641.2.7 Rock fall. Protection from rock fall is usually provided by controlling the distance and direction in which the rocks travel. Wide ditches with side slopes designed to reduce the rock travel distance, wire mesh fences, wire mesh slope facing, energy absorbing walls and mid-slope benches. Rigid structures such as concrete walls or fences with stiff attachments to fixed supports are rarely effective in reducing rock fall damage. The Colorado Rock Fall Simulation Program shows the trajectory and ending location for a single falling rock or the distribution of a number of falling rocks. The inputs to the program are slope height, slope and ditch geometry, the irregularity (roughness) of the slope, slope attenuation characteristics and the size and shape of the falling block. The program can be used to evaluate ditch geometry, the effect of slope and mid-slope benches, and rock shape and size. In general, the program supports Richie’s criteria for ditches. For slopes steeper than 75 degrees, (measured from horizontal), rocks tend to stay close to the slope face and land near the toe of the slope unless launched by bouncing off a bench. For slope angles between about 55 and 75 degrees, the rocks tend to bounce and spin which can project them a considerable distance from the toe. For slope angles between 40 and 55 degrees, rocks will tend to roll down the slope face and into the ditch.
641.2.8 Benches. Benches should be constructed at the top of less resistant beds in horizontally bedded rock. The primary purpose of benches is to place more resistant rock away from the face of the slope to minimize undermining of the more resistant beds. The purpose is not to stop falling material, and benches often increase the rock fall hazard as rocks tend to bounce off the benches and away from the slope face; landing considerably further from the toe. Bench widths vary considerably depending on their purpose. Bench widths are greater when lifts exceed 30 feet in height, or where weathering of the weaker strata will be rapid.
641.2.9 Barriers. Barriers can be used to either enhance the performance of excavated ditches or to form catchment areas at the toes of slopes. Typical barriers are gabions, concrete blocks or concrete Jersey rails and are effective protection for falling rock up to about 18 inches in diameter. Larger mass barriers constructed of soil wrapped in geotextile and faced with rubber tires or railroad ties, have been shown to withstand high energy impacts without significant damage. Back-to-back Mechanically Stabilized Earth (MSE) walls can also be used as barriers.
641.2.10 Rock Slope Ratings. The rock slope rating system can be accessed by the following ITD Intranet link: http://intranetapps/apps/hisims/.

Materials Rock Slope Stability 641.00
2015
641.03 References.
Hoek, E. and Bray, J.W., 1977. Rock Slope Engineering. Institution of Mining and Metallurg, London U.K.
Konya, C.J. Personal Communication
Munfakh, G., Wyllie, D. and Mah, C.W., 1998. Rock Slopes Reference Manual, Federal Highway Administration, FHWA-HI-99-007
Turner A.K. and Schuster, R.,L., 1996. Landslides: Investigation and Mitigation. Transportation Research Board, TRB Special Report 247.

Materials Sign and Signal Structures 645.00
2015
SECTION 645.00 – LANDSLIDES
Investigation requirements for landslide analysis and stabilization are presented in Section 430. An extensive treatment of landslide analysis and stabilization is presented in Transportation Research Board, Special Report 247, Landslide Investigation and Mitigation, (1996), Turner and Schuster, editors, and in Cornforth, Landslides in Practice (2005). Determination of the type and location of the failure surface is critical in the analysis of landslides. The presence of water is a major factor in nearly all landslides. Drainage is a part of nearly every slide repair or prevention option. Section 640 and Section 641 apply to landslide analysis and stabilization as well as to slope design.
645.01 References.
Cornforth, D.H., 2005. Landslides in Practice. John Wiley & Sons, Hoboken, NJ.
Turner, A.K., and Schuster, R. L. 1996. Landslides: Investigation and Mitigation, Transportation Research Board, TRB Special Report 247.

Materials Embankment Design 648.00
2015
SECTION 648.00 - FILTRATION AND INFILTRATION
This section includes the design of filtration for drainage facilities, pavement structures, retaining structures and the design of ponds, dry wells, and other Best Management Practices intended to encourage infiltration of storm water back into the ground. Geotechnical design of these facilities includes assessment of the groundwater regime, soil stratigraphy, permeability or hydraulic conductivity of the soil being drained, protected from erosion, or as it affects the hydraulic functioning of an infiltration facility, the geotechnical stability of the facility, roadway or structure or of adjacent structures or slopes. Section 550.00 provides the criteria for designing or evaluating filter characteristics. The ITD Erosion and Sediment Control (Best Management Practices) Manual includes the design of infiltration facilities.
Filtration is designed to eliminate piping of soil through drainage systems and plugging of drains. For geotechnical stability, the information presented in Section 640.00, Section 641.00, Section 650.00 and Section 655.00 is appropriate. Cornforth (2005) and TRB Special Report 247(1986) provide descriptions and design requirements for drainage features appropriate to slope design and landslide mitigation.
648.1 References.
Idaho Transportation Department, 2008 edition. Erosion and Sediment Control Manual
Cornforth, D.H., 2005. Landslides in Practice. John Wiley & Sons, Hoboken, NJ.

Materials Embankment Design 650.00
2015
SECTION 650.00 - EMBANKMENT DESIGN
This section addresses the design and construction of soil and rock embankments, bridge abutment embankments and light weight fills. Static as well as seismic loading conditions are covered. However, Section 630.00 provides a more detailed assessment of seismic loading on embankment design and performance. The primary geotechnical issues that impact embankment performance are overall stability, internal stability, settlement, materials and construction. For the purposes of this section, embankments are defined as follows:
• Rock embankments are defined as fills in which the material in all or any part of theembankment contains 25% or more, by volume, gravel or stone 4 inches or more indiameter. The ITD Standard Specifications for Highway Construction, Section 205.03defines rock fill as material that is “to granular to test” as having more than 30% byweight retained on the ¾ inch sieve or at least 10% retained on the 3 inch sieve. Materialmeeting the “too granular to test” criteria may still qualify as soil embankment. Thecriteria for rock embankment require sufficiently large particles to have point topoint contact probably resulting in a higher void ratio. Rock fills are often subject topost construction settlement upon wetting.
• Bridge approach embankments, defined as fill beneath a bridge structure and extendingbeyond the structure’s end a distance equal to greater than half the height of theembankment (but not less than 15 ft.) and extending back from the base of theembankment at a slope of 1-1/2 horizontal to 1 vertical to the pavement subgrade.
• Soil embankments are fills that are not classified as rock or bridge approachembankments, but that are constructed of soil, including some materials meeting thedefinition of “too granular to test”
• Lightweight fills contain lightweight or recycled materials as a significant portion of theembankment volume. Lightweight fills are most often used to mitigate settlement or inlandslide repairs. Lightweight materials include, but are not limited to, sawdust, woodfiber, pumice, geofoam and ground rubber.

Materials Embankment Design 650.00
2015
650.1 Field Exploration and Laboratory Testing. Field exploration and testing requirements for cuts and embankments are presented in Section 425.00. Guidelines for sampling and field testing are presented in Section 445.00. Laboratory testing should include the evaluation of strength and consolidation characteristics of the foundation soil, and proposed embankment material where feasible. Strength characteristics of rock or gravel embankments are usually estimated from correlations with physical characteristics or published data. Consolidation characteristics of rock and gravel fills are dependent on construction methods as well as embankment height. The soil characteristics or parameters generally required include total and effective stress strength parameters, unit weight, compression indices and coefficient of consolidation for time rate estimates. Section 620.00, Engineering Properties of Soil and Rock, presents correlation data and methods of developing the design parameters.
In the investigative phase it is necessary to identify performance criteria (e.g., allowable settlement, time available for construction, seismic design requirements etc.), potential geologic hazards, engineering analyses required, and the engineering properties required for the analyses. It is necessary to determine the methods to obtain the needed characteristics and the validity of the methods for the materials involved. A summary of site characterization needs and field and laboratory testing considerations for embankment design is presented in FHWA-IF- 02-034, Geotechnical Engineering Circular No. 5: Evaluation of Soil and Rock Properties, Sabatini et al. (2002), and in Section 425.00.
650.2 Design Considerations. General instructions for embankment construction are contained in ITD Contract Administration Manual, Section 205.00. Specifications for embankment construction are contained in the ITD Standard Specifications, Section 205.00.
650.02.01 Rock Embankments. The ITD Standard Specifications defines rock embankment as material with more than 30% by weight retained on the ¾ inch sieve, or more than 10% by weight retained on the 3 inch sieve. This definition relates to the inability to develop a representative density standard when the material contains the referenced quantity of coarse material. In many cases this definition includes embankment with larger particles surrounded by fines. These cases will act like soil fill and not exhibit point to point contact.Most embankments in Idaho, that meet the criteria for rock embankments are constructed of ripped or shot rock and contain considerably more than 25% of particles larger than 4 inches. The performance of the rock embankment will be very dependent on the quality of the rock. Rock embankments settle primarily due to water softening of the points of contact between rocks and/or degradation of the rock in the presence of water. It is imperative that rock material be placed in the embankment visibly wet and compacted with vibration. Grid rollers, extensively used over the years, produce a smooth surface, but do not compact the rock at depth.
The point to point rock contact in rock embankments can produce very high pressures at the point of contact. Even the harder rocks like basalt will degrade due to corner breakage. Compression of rock fills constructed of thin, rolled and wetted lifts of hard durable rock are likely to be less compressible than the least compressible rolled earth embankment, and that

Materials Embankment Design 650.00
2015
the most compressible rock fills are many times more compressible than any well-constructed rolled-earth fill (Earth and Earth-Rock Dams, Sherard et al., 1963. Depending on the height, embankments constructed of properly compacted coarse granular soils can be expected to compress between 0.3% and 1.4%. Based on limited data in Idaho, compression of rock fills constructed dry could be in excess of 2% of the height upon subsequent wetting.
Special compaction requirements are needed for rock fill. ITD Standard Specifications Section 205.03 contains the compaction requirements for material that is too granular to test. Rock which fails the Idaho degradation test or the Micro Duval should not be placed as rock fill. It should be broken down and compacted as soil fill.
650.2.2 Soil Embankments and Bridge Approach Embankments. Two types of material are commonly used in soil embankments in Idaho. Unspecified from excavation or from borrow and granular borrow. Unspecified material can include broken rock, and/or granular material. These materials are separated according to appropriate compaction standard for the maximum particle size in accordance with Standard Specifications, Section 205.03.F.
Where granular material is needed it may be Granular Borrow, material by special provision or a specification material such as Granular Subbase, or concrete aggregate for drainage. Procedures for compacting embankment and classes of compaction are described in Standard Specifications, Section 205.03 F. Where compaction class is not specified, Class A will be used. Class A compaction requires adherence to a minimum percentage of the appropriate standard listed above. Unless otherwise specified by Special Provision, material outside 2H:1V slopes are compacted only by routing earthmoving equipment for one complete coverage of the embankment outside the above limits (Class D). The surface 8 inches of embankment foundation beneath the projection of the pavement section is typically given Class A compaction (Class C).
The actual degree and limits of foundation soil compaction should be carefully evaluated. The foundation soil beneath the embankment slopes may be susceptible to failure, particularly on sloping ground. Excavation of keyways at the toes of sloping embankments, benches in the embankment foundation and drainage are typical methods of improving embankment stability. Where embankments are placed on very soft foundation material, it may be necessary to control the rate of embankment material placement, or make other provisions to improve the foundation support. Wick drains, stone columns, deep soil mixing are a few of the available options. Geogrid reinforcement at the base or within the embankment may be needed. Monitoring of pore pressures and vertical and lateral deformation of the embankment should be considered in all soft ground construction.

Materials Embankment Design 650.00
2015
650.2.3 Placement of Fill Below Water. If material will be placed below the water table, material that does not require compaction such as coarse Concrete Aggregate, Rock Cap or other uniformly graded material should be used. Evaluate filter requirements between the material below the water and the material placed above in accordance with the criteria in Section 550.00. If infiltration will be a problem, a heavy duty separation geotextile could be placed over the open graded material.
650.03 Embankments for Water Detention / Retention. Descriptions, limitations, and design parameters for temporary sediment control basins and permanent retention basins are presented in ITD Sediment and Erosion Control Manual (BMP) Sections 3.8 and 4.10 respectively. Embankments for retention basins which exceed the limitations in drainage area, embankment height and water depth will come under the jurisdiction of the Idaho Department of Water Resources as earth dams. Even those meeting the limitations in the BMP should be designed as small dams in accordance with Department of Water Resources’ guidelines. Design of all sediment control and retention basins shall evaluate the potential geologic hazards including stability and settlement of the embankment under static and earthquake loads. Construction specifications are contained in Standard Specifications, Sections 205.00 and 212.00. Subsurface investigation requirements for embankment are presented in Section 425.00 of this manual.
Unlined drainage facilities shall be analyzed for seepage and piping through the embankment fill and underlying soils. Stability of the fill and underlying soils subject to seepage forces shall have a minimum safety factor of 1.5. The minimum factor of safety for piping stability shall also be 1.5.
650.4 Stability Assessment. In general, for embankments 20 feet in height on firm and relatively level ground and not retaining water, will not require investigation beyond that typical for soils profile development (Section 230.00). Large embankments, embankments on soft foundations, side hill embankments and retention basin embankments will require site specific investigation in accordance with Section 425.00. Proper attention must be given to the embankment materials and slope geometry even on the low embankments to prevent instability and erosion.
Embankments 10 feet or less in height with 2H:1V or flatter side slopes may typically be designed using engineering judgment and past performance of the materials and foundation conditions provided there are no know problem soil conditions such as liquefiable sands or soft or potentially unstable foundation soils. Embankments over 10 feet in height or any embankment on soft or potentially unstable soil, and light weight fills will require more in depth stability analyses. Any fill placed near or against a bridge abutment or foundation, or that can impact a nearby buried or above-ground structure will also require stability analyses. Slope stability analysis shall be conducted in accordance with Section 640.00.

Materials Embankment Design 650.00
2015
Prior to the start of the stability analysis, the designer should determine which key issues need to be addressed. These include:
• Is the site underlain by soft soils or peat? If so a staged stability analysis may be needed.• Are site constraints such that the side slope ratios are limited?• Is the embankment permanent or temporary? This affects the minimum factor of safety• Will the new embankment impact nearby structures or facilities such as railroads or
roadways?• Are there potentially liquefiable soils at the site? See Section 630.00.
Several methodologies for analyzing the stability of slopes are described or identified in Section 640.00 and are directly applicable to earth embankments and to rock-fill embankments. In addition finite element programs are available to evaluate deformation within the embankment and foundation.
650.4.1 Safety Factors. Embankments that support structure foundations or walls or that could potentially impact such structures, should be designed in accordance with the AASHTO SLRFD Bridge Design Specifications and Section 630.00, Section 640.00, Section 641.00, and Section 645.00 of this manual. The safety factors for overall stability under static conditions are as follows:
• All embankments not supporting or potentially impacting structures shall have aminimum factor of safety of 1.25.
• Embankments supporting or potentially impacting non-critical structures shall have asafety factor of 1.3.
• All Bridge Approach Embankments and embankments supporting critical structures shallhave a safety factor of 1.5. Critical structures are those for which failure would result ina life threatening safety hazard for the public, of for which failure and subsequentreplacement or repair would be an intolerable financial burden to the citizens of Idaho.
• Under seismic conditions, only those portions of the new embankment that couldimpact an adjacent structure such as bridge abutments and foundations or nearbybuildings require seismic analyses and a minimum safety factor of 1.1. See Section630.00 of this manual for specific requirements regarding seismic design ofembankments.
650.4.2 Strength Parameters. Strength parameters are required for any stability analysis. Strength parameters appropriate for the different types of stability analyses shall be determined based on Section 425.00, Section 620.00, and Section 630.00, and by reference to FHWA Geotechnical Engineering Circular No. 5, FHWA-IF-02-034, (Sabatini et. al., 2002).
If the critical stability is under drained conditions, such as in sand or gravel, then effective stress analysis using peak friction angle is appropriate and should be used for stability assessment. In the case of over-consolidated, stiff fissured clays, clay shales and other soils that exhibit strain softening or are potentially liquefiable, a friction angle based on residual strength may be more appropriate.

Materials Embankment Design 650.00
2015
If the critical stability is under undrained conditions (end-of-construction case), such as in most clays and silts, a total stress analysis using the undrained cohesion and no (or very low) friction angle is appropriate. Unconsolidated-undrained (UU) and unconfined compression tests often show an increase in strength with depth in normally consolidated fine-grained soils. This increase is essentially an internal angle of friction.
For staged construction, both short (undrained) and long term (drained) stability need to be assessed. At the start of a stage the input strength parameter is the undrained value. The total shear strength of the fine-grained soil increases with time as the excess pore water pressure dissipates and friction contributes more to the strength. A more detailed discussion regarding strength gain is presented in Section 650.05.
650.4.3 Embankment Settlement Assessment. New embankments will add load to the underlying soils and cause those soils to settle or compress. As discussed in Section 660.00 and Section 680.00, the total settlement has up to three potential components: (1) immediate or elastic settlement, (2) consolidation settlement, and (3) secondary compression. Settlement shall be assessed for all embankments. Even if the embankment has a adequate overall factor of safety, the performance of a highway embankment can be adversely affected by excessive differential settlement at the road surface.
Settlement analyses for embankments over soft soils require the compression index parameters for input. These parameters are typically obtained from standard one-dimensional consolidation tests of the fine grained soil (see Section 620.00 and Section 680.00) for additional information. For granular soils these parameters can be estimated empirically See Section 660.00 and Section 680.00. Consolidation tests should be extended to at least twice the pre- consolidation pressure, with at least 3 or 4 points on the virgin compression curve. The coefficient of consolidation for the portion of the curve below preconsolidation pressure can be 10 times higher than that above preconsolidation.
650.4.3.1 Settlement Impacts. Because primary consolidation and secondary compression can continue to occur long after the embankment is constructed, they represent the major settlement concerns for embankment design and construction. Post construction settlement can damage structures and utilities located within the embankment, especially if those facilities are also supported by adjacent soils or foundations that do not settle appreciably, leading to differential settlements. Embankment settlement adjacent to or near an abutment could create an unwanted dip in the roadway surface or down-drag and lateral squeeze forces on the foundations. See Section 660.00 for more information on down- drag.
If the primary consolidation is allowed to occur prior to placing utilities or building structures that would otherwise be impacted by the settlement, the impact is essentially mitigated. However it can take weeks to years for primary settlement to be complete, and significant secondary settlement of organic soils can continue for decades. Many construction projects cannot absorb the scheduling impacts associated with waiting for primary consolidation or

Materials Embankment Design 650.00
2015
secondary compression to occur. Therefore the effects of anticipated settlement on the structure may have to be taken into account during the design of the structure.
650.4.3.2 Settlement Analysis. Initial compression is essentially elastic and occurs instantaneously as the load is applied. Primary consolidation and secondary settlement can have post-construction impacts.
Primary Consolidation requires knowledge of: • The subsurface profile including soil types, layering, groundwater level and unit weights.• The compression indices for primary, rebound and secondary compression from lab test
data, correlations from index properties, and results from on-site settlementmonitoring. See Section 425.00 and Section 620.00 for additional information regardingselecting design parameters.
• The geometry of the proposed embankment, including the unit weight of fill materialsand any surcharge loads.
The detailed methodology to estimate primary consolidation settlement is provided in Section 680.00, except that the stress distribution below the embankment should be as calculated in Section 650.04.03.03. The soil profile is typically divided into layers for analysis, with each layer reflecting changes in soil properties. In addition, thick layers are often subdivided for refinement of the stress levels in each layer. The total settlement is the sum of the settlement from each of the compressible layers.
If the preconsolidation pressure of any of the soil layers being evaluated is greater than its current initial effective vertical stress, the settlement will follow its rebound compression curve rather than its virgin compression curve (represented by Cc). In this case, the recompression index (Cr), should be used instead of Cc in the analysis, up to the point where the initial effective stress plus the change in effective stress imposed by the embankment surpasses the pre- consolidation pressure. Pre-consolidation pressures in excess of the current vertical effective stress occur in soils that have been over-consolidated, such as from glacial loading, preloading or desiccation.
Secondary Compression should be determined as described in Section 680.00. Organic soils and highly plastic soils often have a secondary settlement component. The secondary compression is typically independent of the stress state and theoretically is a function only of the secondary compression index and time. Secondary compression can result in significant long term settlement. The secondary compression index is usually determined in the consolidation test. In the absence of consolidation test data, the coefficient of secondary compression can be estimated using Figure 650.04.01 and the methods in FHWA NHI-00-045, Soils and Foundations Workshop, Reference Manual. The Secondary Compression Index can also be estimated as follows:
Cα = (0.032)Cc

Materials Embankment Design 650.00
2015
0.04
0.03
0.02
0.01
0 0 50 100 150 200 250 300 350 400
NATURAL WATER CONTENT - (ω%)
Figure 650.04.03.1 Coefficient of Secondary Compression vs Water Content (Modified from FHWA NHI-00-045 Figure 6.9)
The contributions from the individual layers are summed to estimate the total secondary compression. Since secondary compression is a function of how the soil breaks down rather than the stress state of the soil, techniques such as surcharging to pre-induce the secondary settlement are often on partially effective. If the cost/benefit analysis indicates that mitigation techniques such as lightweight fill or over-excavation are too costly, the maintenance and risks resulting from secondary compression must be accepted.
650.4.3.3 Stress Distribution. One of the primary inputs for settlement analysis is the increase in vertical stress at the midpoint of the layer being evaluated. Assuming the increase in stress at depth due to an embankment or other imposed load is equal to the bearing pressure exerted at the ground surface is overly conservative. In addition to the surface pressure, other factors influencing the stress distribution at depth are the geometry or dimensions of the embankment, the inclination of the side slopes, depth below the ground surface to the layer being evaluated and the horizontal distance from the center of the load to the point in question. Several methods are available to estimate the stress distribution.
The simplest approach is to estimate the stress distribution at depth using the 2V:1H (vertical to horizontal) or 60 degree approximation. This approach is based on the assumption that the area the load acts over increases geometrically with depth. The load is assumed to spread out on a plane oriented at an angle of 60 degrees from the horizontal, as shown in Figure 650.04.03.03.2 below:
Cα = Ratio of Decrease in Sample Height To Initial Sample Height for One Cycle
Of Time on Log Scale Following Completion Of Primary
Consolidation
Average
Range
Undisturbed Samples: Cα in Range of Virgin Compression
Cα in Range of Recompression Lies Below This Upper Limit
Cα For Completely Remolded Samples Falls in This Zone CO
EF
FIC
IEN
T O
F S
EC
ON
DA
RY
CO
MP
RE
SS
ION
- C
α

Materials Embankment Design 650.00
2015
B
Stress σo = P / B
60o
z 2 SSttrreessssσizs=pPer/ l(iBn+eaz)r
1
z / 2 B z /2
Figure 650.04.03.03.2: 2V:1H or 60 º Approximation Method to estimate Vertical Stresses as a Function of Depths Below Ground for a Strip Footing
The above described method is appropriate for a long strip load. Stresses at the ends of embankments such as bridge abutment embankments can be distributed ahead using the same relationship. Where embankments have side slopes, the stress distribution is more complex and methods based on the theory of elasticity are more appropriate.
In 1885, Boussinesq developed equations for evaluating the stress state in a homogeneous, isotropic, linearly elastic half-space for a point load acting perpendicular to the surface. Elasticity based methods should be used to estimate the vertical stress in subsurface strata due to an embankment loading or embankment loading in combination with other surcharge loads. Most soils are not linearly elastic materials, but the theory of elasticity is the most widely used methodology to estimate the stress distribution in a soil stratum due to a surface load. Most simplifying charts and the subroutines in programs such as EMBANK are based on the theory of elasticity. In 1938, Westergaard developed equations for stress on subsurface strata which include Poisson’s ratio ( Relationship between vertical and lateral strain) In addition, the FHWA embankment design program FoSSA can be used to compute lateral and vertical foundation stresses, and magnitude and time rate of settlement resulting from a wide range of highway loading (both permanent and temporary). These programs are available from the Construction/Materials Section.
Equations for a number of loading conditions and stress distribution charts for embankment loads, triangular loads strip loads and irregular loads are presented in NAVFAC, DM-7.1, Chapter 4. The charts are based on both Boussinesq and Westergaard’s equation. Stress distributionsare also presented for buried conduits and tunnels in the fill. Stress distribution charts for a number of embankment configurations are also presented in the Foundation Engineering Handbook, Winterkorn and Fang (1975).
LOAD - P

Materials Embankment Design 650.00
2015
650.4.3.4 Rate of Settlement. The time rate of primary consolidation is typically estimated using equations based on Terzaghi’s one-dimensional consolidation theory. The process for estimating time rate of settlement is described in Section 680.00.
The value of CV should be determined from laboratory consolidation test data, piezocone testing and /or back calculation from settlement monitoring data obtained at the site or from a nearby site with similar geologic and soil conditions.
The length of the drainage path is probably the most critical parameter because the time to achieve a certain percentage of consolidation is a function of the square of the length of the drainage path. Incorporating CPTs into the exploration program can be beneficial because a nearly continuous soil profile is developed; including thin sand layers that can be easily missed in conventional drilling and sampling programs. These thin lenses can significantly reduce the length of the drainage path.
Some of the assumptions used by Terzaghi’s theory have limitations. It is important to understand these limitations. The theory assumes small strains such that the coefficient of compressibility of the soil and the coefficient of permeability are essentially constant. The theory also assumes no secondary compression. Both of these assumptions are not completely valid for extremely compressible soils (organic soils and some clays). Considerable judgment is needed to evaluate the time rate of settlement for these types of soil. In these instances or when the consolidation process is very long, it may be helpful to complete a preload at the site, or install prefabricated wick drains, with sufficient monitoring to assess both magnitude and time rate of settlement.
650.5 Stability Mitigation. There are a variety of techniques to mitigate inadequate slope stability for new embankments or embankment widening, including stage construction, which allows the underlying soil to gain strength. Additional techniques include base reinforcement, ground improvement, light weight fills, and toe berms and shear keys. A summary of these mitigation techniques is presented below along with key design considerations.
650.5.1 Staged Construction. Where soft compressible soils underlie a new embankment location and over-excavation and replacement is not economical, the embankment can be constructed in stages to allow the compressible soils to gain strength between periods of embankment construction. Construction of the second and subsequent stages is delayed until the strength of the compressible soil is sufficient to maintain stability. A detailed geotechnical analysis is needed to determine the timing of the individual stages.
This analysis usually requires consolidated undrained (CU), consolidated drained (CD) or consolidated undrained with pore pressure measurements (CUp), and unconsolidated undrained (UU) shear strength parameters for the foundation soils plus the at-rest earth pressure coefficient (Ko), soil unit weights and the coefficient of consolidation (Cv).

Materials Embankment Design 650.00
2015
The analysis to define the height of fill during each stage and the rate at which the fill is placed is typically completed using a limit equilibrium slope stability program along with time rate of settlement analysis to estimate the percent consolidation required for stability. There are two general approaches to evaluating the criteria used to control the rate of fill placement; total stress analysis and effective stress analysis.
For the Total Stress approach the rate of embankment construction is controlled through development of a schedule of maximum fill lift heights and intermediate delay periods. During the delays, the fill lift that was placed is allowed to settle until an adequate amount of consolidation has occurred. Once the desired amount of consolidation has occurred, the next lift is placed. The maximum lift thicknesses and delay periods are established during design. In this approach, field measurements such as the rate of settlement or rate of pore pressure decrease should be obtained to confirm the design assumptions are correct, or to allow modifications to the sequence.
For the Effective Stress approach, the pore pressure increase beneath the embankment in the soft subsoil is monitored and used to control the rate of embankment placement. During construction, pore pressures are not allowed to exceed a critical amount to ensure embankment stability. The critical amount is generally controlled in the contract by the use of the pore pressure ratio (ru), which is the ratio of the pore pressure to total overburden stress. Pore pressure transducers are typically placed in key locations beneath the embankment to monitor the pore pressure increase caused by the fill placement. Again some judgment is needed to interpret the data and determine if modifications to the delay periods or lift thicknesses are needed. If the soil contains a high proportion of organic material and or trapped gasses, the measured pore pressure may be too high and the rate of dissipation too slow.
Since both approaches have limitations and uncertainties, it is generally desirable to analyze the embankment using both approaches, and to have available a backup plan to control the rate of fill placement. An example of the total stress approach is provided in FHWA, NHI-00-045 Soils and Foundations Workshop, Chapter 6. Descriptions of both approaches are presented in a number of geotechnical references and are presented in detail in WSDOT Geotechnical Design Manual, Chapter 9, Section 9.3.1 and Appendix 9-A.

Materials Embankment Design 650.00
2015
650.5.2 Base Reinforcement. Base reinforcement may be used to increase the factor of safety against slope failure. Base reinforcement typically consists of placing a geogrid or geotextile (or both) at the base of an embankment prior to constructing the embankment. A base reinforcement geosynthetic can be very effective in the placement of the first lifts of an embankment over very soft ground. Once the embankment is high enough that the equipment does not overstress the soft subsoil, the geosynthetic’s usefulness is over. Base reinforcement can also be part of a permanent installation. Additional layers of geosynthetic placed in the embankment during construction can also allow steeper fill slopes to be constructed because of the stronger embankment section. Temporary installations can allow less stringent requirements for geosynthetic properties such as creep and chemical resistance to degradation. Only design deformation, strength and installations damage would need to be addressed. Permanent installations should be designed for a 75 year life. Where base reinforcement used, granular borrow may be appropriate to increase the strength of the embankment. Detailed design procedures are provided in Publication No. FHWA NHI-07-092, Geosynthetic Design and Construction Guidelines, August 2008. Contact the Geotechnical Engineer for design assistance.
650.5.3 Ground Improvement. Ground improvement can be used to mitigate inadequate slope stability for both new and existing embankments, as well as reduce settlement. The primary ground improvement techniques fall into two general categories; densification and altering the soil composition. Section 655.00 contains a more detailed discussion of ground improvement including wick drains.
These techniques may be used in combination with staged embankment construction to accelerate strength gain and improve stability. Wick drains, (or stone columns) in addition to accelerating long term settlement, also drastically reduce the drainage patch length which accelerates the rate of strength gain.

Materials Embankment Design 650.00
2015
650.5.4 Lightweight Fills. Lightweight embankment fill is another means of improving embankment stability. Lightweight fills are typically used for two conditions: the reduction of driving forces contributing to instability, and reduction of potential settlement resulting from consolidation of foundation soils. Lightweight fills may be appropriate in conditions where the construction schedule does not allow the use of staged construction, where existing utilities or adjacent structures are present that cannot tolerate the magnitude of settlement induced by conventional fill placement, and at locations where post-construction settlements may be excessive. Lightweight fill can consist of a variety of materials including polystyrene blocks (geofoam), light weight aggregates (expanded shale, pumice, fly ash), foamed concrete, wood fiber and sawdust, shredded rubber tires and other materials. The relatively high cost and other disadvantages can limit the use of these materials.
650.5.4.1 Geofoam. Geofoam is approximately one percent of the weight of conventional soil fill and is particularly effective in reducing driving forces or reducing settlement. Geofoam is soluble in gasoline and other organic solvents and vapors. It must be encapsulated where such fluids can reach the geofoam. Other considerations include creep, flammability, buoyancy, moisture absorption, degradation in sunlight, and differential icing of pavements. Due to buoyancy, geofoam should not be used where the water table could rise into the fill. Design guidelines for geofoam embankments are contained in NCHRP document “Guideline and Recommended Standard for Geofoam Applicationsin Highway Embankments” NCHRP Report, 529, and “Geofoam Applications in the Design and Construction of Highway Embankments” NCHRP Web Document 65, (Stark et.al., 2004).
650.5.4.2 Lightweight Aggregate. Lightweight aggregate includes mineral aggregates such as expanded shales, pumice, fly ash or blast furnace slag. Expanded shales and pumice are inert mineral aggregates that have shear strengths similar to that of conventional aggregates, but weigh half as much. The disadvantage is cost and availability. Fly ash can be used as a light weight fill, but is difficult to place and control moisture content. In addition fly ash has a pH of over 12, or highly alkaline. Due to potential durability and chemical issues, the use of lightweight aggregates should be used in consultation with the Geotechnical Engineer.
650.5.4.3 Wood Fiber. Wood fiber or sawdust, hog fuel, etc. may be used for lightweight fill. For permanent installations only fresh wood fiber should be used to prolong the life of the fill. Wood fiber typically weighs between 35 and 55 pcf. Due to the probability of leachate, the amount of water allowed to enter the wood fiber fill should be minimized and a drainage system provided. Wood fiber fill will deform under wheel loads and may be subject to creep settlement for several years after construction. Adequate cover, on the order of 2-3 ft. thick, should be placed on top of wood fiber fill prior to placing pavement. Some pavement distress may be expected. Typically, the exposed faces of wood fiber fill are sealed with asphalt emulsion to exclude air and water or covered with top soil.

Materials Embankment Design 650.00
2015
650.5.4.4 Scrap Rubber Tires. Scrap rubber tires used as lightweight fill caught fire in several locations due to some type of exothermic reaction which has not been fully defined to date. Scrap rubber tires have not been used to date in Idaho, and their use is not recommended.
650.5.4.5 Light Weight Cellular Concrete. Lightweight cellular concrete is a porous concrete containing large quantities of entrained air which can be poured in place of soil to reduce driving forces. Typical unit weights range from 20 to 80 pcf, and the shear strength is relatively high. However, it is brittle and will crack when subjected to differential settlement, and it is the most expensive of the light weight fill materials described herein.
650.5.5 Toe Berms and Shear Keys. Toe berms and shear keys are not typically constructed of lightweight materials. They are used to increase resistance along potential failure surfaces. The material used is typical a granular borrow or shot rock that does not require heavy compaction, but has relatively high shear strength. The resistance is increased by 1) lengthening the failure surface, 2) adding weight to the toe area and increasing the shear strength of the material outside the toe, and 3) adding high strength material for additional shearing resistance.
Toe berms are placed at the toe of an embankment to increase the resisting forces. The size and thickness of toe berms should be established with the limit equilibrium stability analyses.
Shear keys are excavated below the toe or embankment slope to intersect the potential failure surface and increase the resisting shear strength. They are best suited to conditions where they can extend into a stronger underlying formation. Shear keys are typically backfilled with relatively clean free draining granular material such as shot rock that is easy to place below the water table. Shear keys typically range up to 25 feet in width and extend up to 20 feet below the ground surface. The extent of the shear key should be established with the limit equilibrium stability analysis.

Materials Embankment Design 650.00
2015
650.6 Settlement Mitigation. Methods available to reduce or accelerate settlement of embankments include wick or sand drains, surcharges, light weight fill, and over-excavation and ground improvement.
650.6.1 Settlement Acceleration Using Wick Drains. Wick drains or prefabricated drains are vertical drainage paths that can be installed into compressible soils to decrease the distance pore water must travel to dissipate. The reduced drainage path decreases the time required for primary consolidation to occur. Wick drains normally consist of a long plastic core surrounded by a geotextile. The geotextile functions as a filter to prevent plugging of the holes in the plastic core. The plastic core functions to allow dissipation of the excess pore pressure. A drainage blanket is usually placed across the ground surface prior to installing the wick drains and acts as a conduit beneath the embankment for the water flowing from the wick drains. Wick drains are attached to a mandrel and driven/pushed or vibrated into place. After installing wick drains the embankment and possibly a surcharge is placed above the drain blanket. Site conditions are a primary concern in the use of wick drains. Predrilling may be needed to penetrate a harder stratum above the compressible material. Depths of over 60 feet may require special equipment.
A significant design consideration is the spacing of the wick drains since the length of the drainage path controls the time rate of consolidation. The time required for a percentage of primary consolidation is related to the square of the drainage path length. Cutting the drainage path length in half would theoretically reduce the consolidation time to one fourth the initial time. However, the installation of the wick drain creates a smear zone which retards the drainage. The smear zone thickness for closed end mandrels is usually about one third to one half of the diameter of the drain minimizing the smear zone is a primary construction concern.
Sand drains preceded the use of prefabricated or wick drains. Design of wick drains or sand drains is essentially the same. To design wick drains, establishing an equivalent diameter of sand drain is necessary. In FHWA-RD-86-168, Prefabricated Vertical Drains Vol. 1, (Rixner et al. 1986) the equivalent diameter of prefabricated drains is calculated as half of the sum of the length and width of the prefabricated drain. Information for the design of vertical drains is presented in NAVFAC DM 7.1 Chapter 5, FHWA, NHI-00-045, Chapter 6 (Cheney et. al., 2000), and FHWA-RD-86-168 (Rixner et al., 1986).

Materials Embankment Design 650.00
2015
650.6.2 Settlement Acceleration Using Surcharges. Surcharge loads are additional loads place on an embankment over and above the design height. The purpose of the surcharge is to speed up the consolidation process. Once consolidation under the surcharged load reaches the anticipated consolidation under the design load, the surcharge can be removed and further consolidation would be minimal. For example it takes less than one fourth the time required for 50% consolidation to occur than for 90% consolidation. If a surcharge is sufficiently large for 50% consolidation under the surcharge to equal the anticipated 90% consolidation under the design load, the time required for the 90% consolidation would be less than one fourth that without surcharge. Based on experience, a surcharge would have to be at least one third of the design embankment height to provide any significant time savings.
Surcharges can also be used to reduce the impact of secondary settlement. If the surcharge is designed to achieve the total primary settlement plus a major part of the secondary settlement of the design embankment in primary consolidation, the long term settlement can be significantly reduced. Using a surcharge typically will not completely eliminate secondary settlement, but can be successful in reducing long term settlement. For highly organic soils or peat, secondary settlements can be very large. Surcharges would have limited success in reducing long term settlement in these soils. Other methods, such as removal, may be needed.
Two significant design and construction considerations for using surcharges are stability and the re-use of the surcharge materials. Surcharges may increase stability problems for embankments over soft soils. A stability analysis should be made to ensure that the placement of a surcharge does not result in slope failure. Once the surcharge has achieved the intended purpose, it must be removed. Unless the material can be used on the project, the cost of bringing in and removing material may outweigh the benefits of the surcharge.
650.6.3 Lightweight Fill. Lightweight fills can also be used to mitigate settlement issues by reducing the weight on the underlying compressible soil. Section 650.05.04 contains information regarding the use of lightweight fill materials.
650.6.4 Over-excavation. Over-excavation simply refers to excavating soft compressible soils from below the embankment foot print and replacing these materials with higher quality materials. Because of the high cost of excavating and disposing of the unsuitable soils as well as the difficulties associated with excavating below the water table, over-excavation and replacement is economically feasible only under certain conditions. Some of these conditions include but, are not limited to:
• The area requiring over-excavation is limited;• The unsuitable soils are near the ground surface and do not extend very deep (typically,
even in the most favorable construction conditions, over excavation depths greater thanabout 10 feet are generally not economical);
• Temporary shoring and dewatering are not required to support or facilitate theexcavation;

Materials Embankment Design 650.00
2015
• The unsuitable soils can be wasted on site; and• Suitable excess fill material or borrow material are readily available to replace the over-
excavated material.
650.7 Construction Considerations. Consideration should be given to the time of year that construction will likely occur. If unsuitable soils are encountered during the field exploration, the depth and lateral extent for removal should be shown on the plans. Section 511 of this manual provides information and guidance for the use of geosynthetics for separation or stabilization. For extremely soft and wet soil, a site specific design should be performed for geosynthetics.
Hillside benching or terracing is required in ITD Standard Specifications Section 205.03 E, for all slopes steeper than 5 horizontal to 1 vertical (5H:1V). Where embankments are constructed on existing hillsides or on existing embankment slopes, the existing soil surface may form a plane of weakness unless the slope is terraced or benched. However, there are specific cases where terracing or benching may be waived during design, such as when existing slopes are steeper than 1H:1V and benching would cause instability in the existing slope. Slope terracing or benching is required as shown on ITD Standard Drawing A-6 is required on new embankment and cut slopes to retard erosion and aide in establishing vegetation.
650.7.1 Settlement and Pore Pressure Monitoring. If settlement is expected to continue after embankment construction, some type of monitoring program should be provided. Settlement should be monitored if post construction settlements will affect pavements or settlement sensitive structures. Delaying pavement construction or bridge foundation construction until post construction settlement is within tolerable limits will require a monitoring program. Estimates of the time required for settlement should be conservative so that completing construction will not be delayed longer than anticipated.
As discussed in Section 650.05.01, embankments constructed over soft ground may require the use of staged construction to ensure stability. A geotechnical monitoring program is essential during staged construction to provide information on the timing of subsequent stages. The monitoring program should include settlement and pore pressure measurements to assess the rate of strength gain. In relatively soft, saturated soil, the applied load from an embankment increases the pore water pressure. With time the excess pore water pressure dissipates and shear strength will increase as consolidation occurs. So measurement of pore water pressure is important in assessing the allowable rate of embankment construction.

Materials Embankment Design 650.00
2015
650.7.2 Instrumentation. Following is an overview of the geotechnical monitoring equipment typically used in embankment construction. A more comprehensive discussion is presented in FHWA-HI-98-034, “Geotechnical Instrumentation Reference Manual” NHI course 13241(Dunnicliff, 1998).
650.7.2.1 Piezometers. Three types of piezometers are commonly used to monitor embankment construction: open standpipe, pneumatic and vibrating wire. Each type has advantages and disadvantages. These are further described below.
Open standpipe piezometers are installed in a drilled hole. A porous zone or screen is installed in the soil layer of interest. To measure pore water pressure and dissipation in the zone of interest, it is necessary to seal the porous zone to prevent inflow of water from shallower zones. They are relatively simple to install and measurements are easily made. Unless the diameter of the standpipe is relatively small, less than an inch, the response may be very slow in low permeability soils. Even with small diameters, the response is slow. The standpipe piezometers are easily damaged during construction. Therefore, they are not a good choice for measuring pore water pressure dissipation during stage construction. Measurements can be made at only one location in an individual boring. To measure the pore water pressure at different depths, multiple borings are needed.
Pneumatic piezometers are usually installed in drilled holes, but they can be sealed so that changes in pore water pressure result in smaller volume changes and a more rapid response. The pneumatic piezometers do not need an open stand pipe. However, the tubes may be damaged during construction or due to the embankment settlement. Depending on the distance from the piezometer to the toe of the embankment, pneumatic piezometers can be installed prior to embankment placement and the tubes brought out at the foundation level. Not more than two piezometers should be installed in one boring and they should be separated by about 18 to 20 feet vertically.
Vibrating wire piezometers are also usually installed in drilled holes, but some models can be pushed into soft soils. The cables can be extended relatively long distances so monitoring of several piezometers can be combined at one location outside the embankment. They can be easily connected to automatic data acquisition systems. As with pneumatic piezometers, no more than two piezometers should be installed in the same boring.
650.7.2.2 Instrumentation for Settlement. Measurement of embankment settlement can be as simple as surveyed surface monuments to multi-sensor subsurface installations and horizontal inclinometers. Following is an overview of the more common systems used.
Settlement plates may consist of surface monuments or settlement plates with extendable pipes brought up through the embankment. Steel settlement plates are usually installed at the surface of the foundation soil. As the embankment is constructed, a steel pipe, welded to the plate, is extended up through the embankment as the fill is placed. An outer steel or PVC pipe is placed around the inner pipe to isolate it from the embankment, eliminating any frictional
Materials Embankment Design 650.00
2015
resistance that could reduce the settlement measurement. Both pipes are brought up with the fill. Survey monitoring is necessary to record the elevations of the top of the inner pipe or on surface monuments. While these devices are simple, each plate provides information at only one point and the pipe extensions are subject to construction damage.
Pneumatic settlement cells are usually placed at the interface between the embankment and the native ground. A flexible tube is laid along the ground surface or in a shallow trench to a reservoir which must be located well away from the embankment area subject to settlement. The reservoir must be kept at a constant elevation. The settlement or relative elevation change is determined either by the change in water level in a manometer or from the pressure transmitted by the liquid. In single point sensors, the reservoir can be higher in elevation than the sensor.
The Sondex system or multi-position probe extensometer is installed in a boring and consists of a telescoping casing with stainless steel rings located at intervals along the length of the casing. The induction coil sensor is passed down through the casing and the location (elevation) of each of the stainless steel rings is measured. The casing is grouted in place so there is a positive connection between the casing and the foundation soil. If the grout mix is stronger than the surrounding soil, the measured settlement will be less than the actual.
Horizontal inclinometers can be used to measure the settlement profile beneath the entire width of an embankment. The horizontal inclinometer is essentially the same casing as used for vertical inclinometers, but the grooves must be aligned vertically. The probe must be pulled through the horizontal casing and because it is 2 feet long, abrupt or large settlements may stop passage of the probe. With this system, the continuous profile of settlement beneath and adjacent to an embankment can be monitored. The elevations of the ends of the casing must be measured and the casing must be extended outside the settlement area.

Materials Embankment Design 650.00
2015
650.8 References.
Boussinesq, J., 1885. “Application des Potentiels a L’Etude de L’Equilibre et due Mouvement des Solides Elastiques,” Gauthier – Villars, Paris.
Cheney, R. and Chassie, R. 2000. Soils and Foundations Reference Manual, National Highway Institute Publication NHI-00-045, Federal Highway Administration.
Dunnicliff, J., 1998. Geotechnical Instrumentation Reference Manual, NHI Course No. 13241, Module 11, FHWA-HI-98-034, Federal Highway Administration, USDOT.
Holtz, R. D., Christopher, B.R. and Berg, R.R., Revised 1998, Geosynthetic Design and Construction Guidelines, Federal Highway Administration , FHWA HI-95-038.
Idaho Transportation Department, Sediment and Erosion Control Manual, 2008 Edition.
NAVFAC DM7.1 Design Manual – Soil Mechanics, 1982, U.S. Navy Facilities Command.
Rixner, J.J., Kraemer, S.R. and Smith, A.D., 1986. Prefabricated Vertical Drains – Vol. I, Engineering Guidelines, Federal Highway Administration Report FHWA-RD-86-168.
Sabatini, P.J., Bachus, R.C., Mayne, P.W., Schneider, J.A. and Zettler, T.E., 2002. Geotechnical Engineering Circular 5 – Evaluation of Soil and Rock Properties. Report No. FHWA-IF-02-034.
Sherard, J.L., Woodward, R.J., Gizienski, S.F. and Clevenger, W.A.,1963. Earth and Earth – Rock Dams, John Wiley and Sons.
Stark, T., Arellano, D., Horvath, J. and Leshchinsky, D., “Guideline and Recommended Standard for Geofoam Applications in Highway Embankments” NCHRP Report, 529, Transportation Research Board.
Stark, T., Arellano, D., Horvath, J. and Leshchinsky, D., “Geofoam Applications in the Design and Construction of Highway Embankments,” NCHRP Web Document 65, Transportation Research Board.
Washington State Department of Transportation, 2006, Geotechnical Design Manual.
Westergaard, H., 1938. “ A Problem of Elasticity Suggested by a Problem in Soil Mechanics: A soft Material Reinforced by Numerous Strong Horizontal Sheets,” in Contributions to the Mechanics of Solids, Stephen Timoshenko 60th Anniversary Volume, McMillan, New York, NY.
Winterkorn, H.F. and Fang, H., 1975. Foundation Engineering Handbook, Van Nostrand.

Materials Structure Foundation 655.00
2015
SECTION 655.00 - GROUND IMPROVEMENT
Ground improvement is used to mitigate a wide range of geotechnical problems including the following:
• Improvement or densification of soft or loose soil to reduce settlement and/or toincrease bearing capacity for foundations or embankments.
• To decrease liquefaction potential.• To improve slope stability for landslide mitigation.• To make use of typically unstable soils.• To improve workability of fill materials.• To accelerate settlement and strength gain.
Following is a list of commonly used ground improvement techniques. • Vibrocompaction techniques such as stone columns, vibroreplacement and
vibrofloatation and other methods that use a vibratory probe and that may or may notintroduce additional material in the hole created.
• Deep dynamic compaction, typically with a falling weight.• Blasting for densification.• Reinforcement of embankments with geogrid or geotextile.• Wick drains, sand drains, and similar methods that improve the drainage of the subsoil
and help by removing excess pore water pressure.• Injection grouting.• Lime and/or cement treatment of soils to improve strength and workability.
Each of these methods has limitations regarding applicability and the degree of improvement possible.
Ground improvement techniques for stabilizing rock masses, such as rock bolting, shotcreting, doweling etc. are presented in Section 641.02.

Materials Structure Foundation 655.00
2015
655.1 Development of Design Parameters for Ground Improvement Analysis. The geotechnical investigation for design of the cut, fill, structure foundation or retaining structures that will be supported by the improved ground must be adequate for design of the ground improvement proposed. The improvement method selected may require emphasis of different specific soil information. For vibro-compaction, deep dynamic compaction or blast densification, detailed gradation information is needed as small changes in the gradation could affect the feasibility of the method. It is important that the same method (SPT, CPT) is used in assessing the density of the treated soil before and after treatment. The data developed in the site exploration will be the base line for determining the effectiveness of the ground improvement. The impact of the proposed treatment on adjacent structures or utilities may require more extensive exploration of the foundation soils for these adjacent facilities. Pre- condition surveys should be conducted to enable determination of the effect the treatment has on adjacent facilities. This is necessary for essentially any construction activities such as driving piles, adjacent excavation etc.
For wick drains, the ability of the mandrel to penetrate the subsoil to the required depth is of primary importance. Any data which provides information on penetrability, as well as over- consolidation and permeability is of utmost importance. Information on the design of wick drains is contained in Section 650.06.01.
Soil density and the presence of material that could stop the penetration of the grouting equipment are of primary importance in assessing the feasibility of compaction grouting or grout injection.
Permeation grouting, such as lime injection, is dependent characteristics which affect the ability for the grout to penetrate the soil matrix. Detailed gradation information is necessary as is the effect of ground water. Specialized technical assistance is mandatory in permeation grouting.
655.2 Design Requirements. Design requirements for the various ground improvement techniques are contained in the following sources.
FHWA-NHI-06-019-020 “Ground Improvement Technical Summaries” (Elias etal., 2006)
FHWA-RD-83-026 “Design and Construction of Stone Columns, Vol. 1” (Barksdale and Bachus, 1983)
FHWA-RD-83-027 “Design and Construction of Stone Columns, Vol. 2” (Barksdale and Bachus, 1983)
FHWA-SA-95-037 Geotechnical Circular No.1 “Dynamic Compaction” (Lukas, 1995)
FHWA-RD-86-168 “Prefabricated Vertical Drains – A Design and Construction Guidelines Manual” (Rixner, et al., 1986)
FHWA-AK-RD-01-6B “Alaska Soil Stabilization Design Guide” (Hicks, 2002)
FHWA-HI-95-038 “Geosynthetic Design and Construction Guidelines” (Holtz, et al,. 1998)

Materials Structure Foundation 660.00
2015
SECTION 660.00 - STRUCTURE FOUNDATIONS
This section covers the geotechnical design of foundations for bridges, walls, buildings and hydraulic structures. Geotechnical design of foundations for sign and signal structures is contained in Section 685.00. The geotechnical design of retaining structures is contained in Section 670.00. Proprietary wall acceptance procedures are contained in Section 675.00.
Both shallow spread footing and deep foundations (piles, drilled shafts, micro-piles etc.) are included in this section. In general, the load and resistance factor design approach (LRFD) as presented in the AASHTO LRFD Bridge Design Specifications shall be used, unless a LRFD methodology has not been developed for the specific foundation type under consideration. The structural design of the foundation elements is not addressed in this manual.
All structure foundations within the ITD Right of Way or on which the construction contract is administered by ITD shall be designed in accordance with this manual and AASHTO LRFD Bridge Design Specifications. The most current versions of these manuals shall be used, including all modifying interims or design memoranda. When a conflict occurs between these documents, the more stringent requirement will apply.
660.1 Design Process for Structure Foundations. The overall process for geotechnical investigation and design is outlined in Section 601.00. The ITD geotechnical design process for structure foundations begins with the field exploration by the ITD District or a consultant. The geotechnical recommendations and design parameters are contained in the Phase IV Materials Report (Foundation Investigation Report). The requirements for the foundation investigation are presented in Section 400.00, Guidelines for Subsurface Investigations. Detailed guidelines for the production and submittal of Materials Reports are presented in Section 210.00. A brief outline of the process for geotechnical design of structure foundations is presented below.
The Phase IV reports by ITD District Materials are submitted to the Geotechnical Engineer in the Construction/Materials Section for review. Consultant-produced Phase IV reports are submitted for review to District Materials by the design consultant, and are in turn submitted to the Construction/Materials Section for review. The approved Phase IV reports for bridge foundations, retaining walls and drainage structures are submitted to the Bridge Design Section. Most building foundation investigations are for maintenance structures or rest areas and the reports will be reviewed by the Geotechnical Engineer, and approved by the District Engineer, before submitting to ITDs Facilities Manager. Office Building foundation investigation reports are submitted to the Department of Administration and the project architect. Phase IV reports for signs and signal structures will be reviewed by the Geotechnical Engineer and approved by the District, before submitting to the Traffic Safety Section.
Based on the Transportation Board’s approved Transportation Improvement Projects, the Bridge Design Section develops the site data and a preliminary Situation and Layout of the proposed

Materials Structure Foundation 660.00
2015
structure. Using this Situation and Layout, the District (or Consultant) plans the investigation. Close cooperation between the structural designer and the geotechnical designer (and the ITD Geotechnical Engineer) is needed as changes in the preliminary design concept can require revisions to the investigation or the completed report. On more complex structures, a preliminary investigation is needed to allow the structural designer to develop the structure concept. The preliminary investigation would provide general site characteristics based on limited exploration.
Prior to initiating the final investigation, the structural designer provides feedback on the preliminary information. The feedback may include anticipated foundation loads (including load factors and load groups used), probable foundation type and dimensions required structurally, foundation details that could affect geotechnical design and anticipated length, type and number of piers or piles. The final investigation would include any exploration and testing needed as a result of the preliminary structural data, modification of recommendations as necessary and publication of the final report.
660.2 Data Needed for Foundation Design. The data needed for foundation design shall be as described in the AASHTO LRFD Bridge Design Specifications, Section 10 Foundations (most current version). The expected project requirements and site conditions should be analyzed to determine the scope of the geotechnical investigation. These include design and constructability requirements, performance criteria (e.g. settlement limitations, time constraints), areas of concern on site and of local geology, construction phases and sequences, types of engineering analysis needed and necessary properties, exploration methods and scope.
The requirements for geotechnical investigations for bridge structures are contained in Manual Section 405.00; for buildings in Manual Section 410.00; for retaining walls in Manual Section 415.00: and for drainage structures in Manual Section 420.00.
660.3 Considerations for Foundation Selection. Factors which must be considered in selecting the appropriate foundation include:
• The ability of the selected foundation to meet performance requirements for all limitstates given the subsurface conditions encountered.
• Constructability• Impact of construction on right-of-way and on traffic• Physical constraints, such as overhead clearance or utilities• The impact on adjacent structures or utilities• Cost, considering the issues above.
Spread footings are typically very cost effective if the conditions are appropriate. Footings work best in soils that have adequate bearing resistance and exhibit tolerable settlement. Footings can get very large if eccentrically loaded, and if subjected to uplift can exhibit differential settlement or tilt. Footings are not effective where soil liquefaction can occur at or below footing level. If the liquefiable soil is thin, confined or well below the footing, or if ground

Materials Structure Foundation 660.00
2015
improvement techniques are cost effective, spread footings may still be cost effective. Other factors affecting the suitability of spread footings include the need for a coffer dam and dewatering if footings will be below the water table or water surface, the possibility of scour, the need for shoring to protect adjacent structures or the need for removal and disposal of contaminated materials. Footings may not be feasible on expansive or collapsible soils. The potential for deformation often controls the feasibility of spread footings. Footings on slopes may be subject to instability of the slope and will require reduced bearing pressures.
Deep foundations are a better choice when spread footings cannot be founded on competent materials. At locations where the potential exists for deep scour, liquefaction, lateral spreading or unacceptable settlement, deep foundations can mitigate these problems. Right-of-way or space limitations may also favor deep foundations.
Two general types of deep foundations are commonly used; driven piles and drilled shafts. Drilled shaft foundations are most advantageous where dense strata must be penetrated to develop bearing, uplift or lateral resistance, or where there are obstructions which must be penetrated. Shafts can also be advantageous where large loads would require a large number of driven piles. Drilled shafts may be the better choice when adjacent facilities are sensitive to the vibration from pile driving. However, disposal of the drill cuttings can be a problem, particularly where contaminated soils are present, and especially over water. Belled caissons, can support very heavy loads by gaining support from deeper dense layers, and are an attractive alternative to resist large uplift loads. However, it is usually necessary for the bearing surfaces to be cleaned by hand, and the safety regulations have diminished their cost effectiveness.
Piles may be more cost effective where pile cap construction is easy and when the depth to gain adequate bearing is very large (e.g. over 100 ft.). Conditions requiring casing for drilled shafts, or artesian pressures at the bearing layer may also favor driven pile foundations. Artesian pressures can make keeping a positive head in the boring difficult to impossible, thereby increasing the probability of heaving or caving of the hole.
Micro-piles may be the best choice for underpinning or retrofitting existing structures and where head-room is limited or where small, light-weight equipment is required. Micro piles are small concrete piles, with diameters from 8 to 12 inches, and are normally installed by drilling and filling the drilled holes with concrete and steel reinforcement.
In certain situations, auger-cast piles can be very cost effective in certain situations. Where the bearing stratum is relatively shallow (under about 50 ft.) and the drilling of the overburden presents little difficulty, auger-cast piles can be installed very rapidly. Developing lateral load capacity is difficult. Typically, reinforcement consists of one or two bars placed in the upper 10 or 12 feet of pile for connection to the superstructure. Pressure must be applied to the concrete while withdrawing the casing to minimize the possibility of creating voids in the pile. Quality assurance of auger-cast piles needs further development.

Materials Structure Foundation 660.00
2015
660.4 Overview of LRFD for Foundations. The basic equation for load and resistance factor design (LRFD) states that the loads multiplied by factors to account for uncertainty, ductility, importance and redundancy must be less than or equal to the available resistance multiplied by factors to account for Variability and uncertainty in the resistance per the AASHTO LRFD Bridge Design Specifications. The basic equation is as follows:
ΣηtγiQi ≤ φRn Where: ηt = Factor for ductility, redundancy, and importance of structure γi = Load factor applicable to the i’th load Qi Qi = Load φ = Resistance Factor Rn = Nominal (predicted) resistance
Foundations shall be proportioned so that the factored resistance is not less than the factored loads.
660.5 Loads, Load Groups and Limit States. The specific loads and load factors to be used for foundation design are as contained in AASHTO LRFD Bridge Design Specifications.
660.5.1 Foundation Analysis to Establish Load Distribution. When the appropriate load factors and load groups for each limit state have been established by the structural designer, the loads are distributed to the various parts of the structure in accordance with Sections 3 and 4 of the AASHTO LRFD Bridge Design Specifications. The distribution of loads considers the deformation characteristics of the supporting soil or rock and the foundation elements as well as the superstructure.
To accomplish the load distribution, stiffness values must be developed for the soil surrounding and supporting foundations and behind abutments. For deep foundations, P-y curves or strain wedge theory for short shafts should be used to develop soil stiffness (springs) in the service or strength states. The geotechnical investigation provides the soil/rock input parameters to the structural designer to develop the foundation springs and to determine the load distribution in accordance with AASHTO LRFD Bridge Design Specifications. Maximum (un-degraded) strength parameters and those degraded by repetitive loading are provided to develop the soil stiffness in the strength and service states respectively.
For the extreme limit state (seismic) on deep foundations, soil strength parameters degraded by liquefaction are provided in addition to maximum and in-service values.
Throughout all of the analysis procedures, the soil parameters and stiffness values are unfactored. The geotechnical designer must develop a best estimate for these parameters. Using conservative values could result in unconservative estimates of structure loads or inaccurate deflection estimates. See the AASHTO LRFD Bridge Design Specifications, Article 10.6 for elastic settlement / bearing resistance of footings for static analysis. See Section 630.00 of this manual for soil / rock stiffness determination for seismic design of spread footings. See

Materials Structure Foundation 660.00
2015
Section 660.00 and related AASHTO LRFD Bridge Design Specifications for developing lateral soil stiffness for deep foundations.
660.5.2 Downdrag Loads. Possible development of downdrag loads on deep foundations shall be evaluated where the following conditions are present.
• Sites are underlain by compressible materials such as clays, silts, organic soils and peat,• Fill will be or has been recently placed adjacent to the piles or shafts.• Groundwater levels have been or will be lowered.• Liquefaction can occur
Downdrag loads shall be developed and applied in accordance with AASHTO LRFD Bridge Design Specifications, Section 3, Loads and Factors.
660.5.3 Uplift Loads Due to Expansive Soils. If removal of expansive soil is not possible, deep foundations such as driven piles or drilled shafts shall be extended into stable soil. Spread footings are not recommended on expansive soils. Isolating the deep foundation from the expansive soil is a possibility if the expansive layer is relatively thin. Without isolation, deep foundations should extend to a depth into stable soils sufficient to resist the uplift. Grade beams and pile or pier caps should be constructed with enough clearance above the ground surface to accommodate the potential swell without application of load to the beams or caps. Evaluation of the potential uplift on deep foundations extending through an expansive soil layer requires evaluation of the swell potential and the extent or thickness of the layer. Swell potential can be large if montmorillinite minerals are present and / or the saturation moisture content in-situ is considerably lower than the Liquid Limit. Quantitative estimates of swell potential can be determined in an oedometer test such as ASTM D4829, Expansion Index Test. Estimates of swell pressure can also be determined from oedometer tests.
The thickness of potentially expansive material can be determined by examining the soil samples for presence of jointing, slickensides or blocky structure and color change. Laboratory testing to determine soil moisture content profiles and plasticity provides quantitative identification.
660.5.4 Soil Loads on Buried Structures. The soil loads to be used for the design of buried structures (e.g. cut-and-cover tunnels, culverts and pipe arches) shall be as specified in Sections 3 and 12 of the AASHTO LRFD Bridge Design Specifications.
660.5.5 Service Limit States. Foundation design at the service limit state shall include: • Settlement• Horizontal movement• Overall or global stability• Scour at the design flood

Materials Structure Foundation 660.00
2015
Consideration of settlement, horizontal movements and rotation shall be based on the structure’s tolerance to total and differential movements, rideability and economy. Where the bridge superstructure is not integral with the abutment or pier foundations, corrections for settlement can be made by jacking and shimming the bearings.
The design flood for scour, as applicable to the service limit state, is defined in Article 2.6.4.4.2 and specified in Article 3.7.5 of the 2008 AASHTO LRFD Bridge Design Specifications.
660.05.05.01 Foundation Movement. Foundation settlement, horizontal movement, and rotation of foundations shall be investigated using all applicable loads in the Service 1 Load Combination specified in AASHTO LRFD Bridge Design Specifications. Short duration live loads or transient loads may be omitted from settlement analyses where foundation soils are cohesive and are subject to time dependent consolidation. Tolerable movement criteria for a structure shall be provided to the geotechnical designer by the structural designer.
Experience has shown that bridges can and often do accommodate more movement than typically allowed or anticipated in design. Creep, relaxation, and redistribution of forces allow the structure to accommodate the additional movement. Studies indicate that angular settlement distortions should not be permitted between adjacent foundations that are greater than 0.005 (ft/ft) in simple spans and 0.004 (ft/ft) in continuous spans (Moulton, et al., 1985). Design tolerances are typically much lower. The following tables show acceptable settlement criteria.
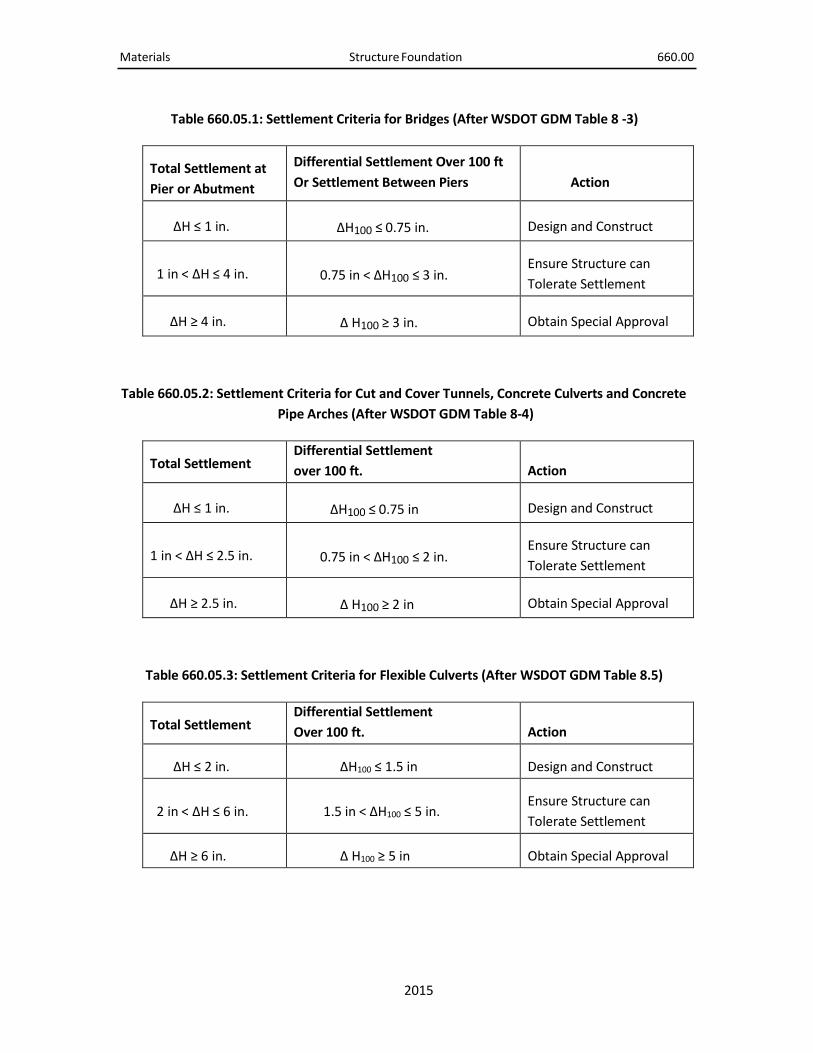
Materials Structure Foundation 660.00
2015
Table 660.05.1: Settlement Criteria for Bridges (After WSDOT GDM Table 8 -3)
Total Settlement at Pier or Abutment
Differential Settlement Over 100 ft Or Settlement Between Piers Action
ΔH ≤ 1 in. ΔH100 ≤ 0.75 in. Design and Construct
1 in < ΔH ≤ 4 in. 0.75 in < ΔH100 ≤ 3 in. Ensure Structure can Tolerate Settlement
ΔH ≥ 4 in. Δ H100 ≥ 3 in. Obtain Special Approval
Table 660.05.2: Settlement Criteria for Cut and Cover Tunnels, Concrete Culverts and Concrete Pipe Arches (After WSDOT GDM Table 8-4)
Total Settlement Differential Settlement over 100 ft. Action
ΔH ≤ 1 in. ΔH100 ≤ 0.75 in Design and Construct
1 in < ΔH ≤ 2.5 in. 0.75 in < ΔH100 ≤ 2 in. Ensure Structure can Tolerate Settlement
ΔH ≥ 2.5 in. Δ H100 ≥ 2 in Obtain Special Approval
Table 660.05.3: Settlement Criteria for Flexible Culverts (After WSDOT GDM Table 8.5)
Total Settlement Differential Settlement Over 100 ft. Action
ΔH ≤ 2 in. ΔH100 ≤ 1.5 in Design and Construct
2 in < ΔH ≤ 6 in. 1.5 in < ΔH100 ≤ 5 in. Ensure Structure can Tolerate Settlement
ΔH ≥ 6 in. Δ H100 ≥ 5 in Obtain Special Approval

Materials Structure Foundation 660.00
2015
660.5.5.2. Overall Stability Evaluation of Earth Slopes. Overall stability evaluation of earth slopes, with or without a foundation unit, shall be investigated at the service limit state as specified in Article 11.6.2.3 of the AASHTO LRFD Bridge Design Specifications. Overall stability should be evaluated using limit equilibrium methods as outlined in Section 640.00 and Section 650.00 of this manual. As stated, Article 11.6.2.3 recommends that overall stability be evaluated at the Service limit state (i.e. load factor =1.0 and resistance factor, φos of 0.65 for slopes which support a structural element. See Section 640.00 of this manual for additional information and requirements regarding slope stability analysis.
Current slope stability programs produce only a single safety factor, FS. Overall slope stability shall be checked to ensure that foundations designed for a maximum bearing stress equal to the specified service limit state bearing resistance will not result in a slope stability safety factor to be below 1.5. The foundation loads should be as specified for the Service 1 limit state for this analysis. If the foundation is located on the slope such that the foundation load contributes to slope instability, the designer shall establish the maximum footing load that is acceptable for maintaining overall slope stability for Service and Extreme Event limit states. If the foundation is located on the slope in a location that increases stability, the footing load shall be ignored in the overall stability analysis or the foundation load may be included as a resisting element and the foundation designed to resist the lateral loads applied by the slope.
660.5.5.3. Abutment Transitions. Abutment transitions such as approach slabs, may be used to mitigate the settlement of foundation soils caused by embankment loads. These settlements can result in excessive movements of abutments and piers. Both short and long term settlement potential should be considered. Lateral earth pressure behind abutments or lateral squeeze below abutments can also contribute to lateral movement of abutments.
The bump at the end of the bridge can be caused by settlement of poorly placed or compacted backfill behind abutments. This can be minimized by placing high quality material behind abutments and as a pad beneath spread footings.
In addition to considerations of material placement for minimizing settlement behind abutments, approach slabs are recommended at the ends of each bridge on ITD projects. The decision to include or delete approach slabs shall be made in the District with concurrence of the Bridge Design Engineer. Approach slabs may be deleted for the following geotechnical considerations.
• Excessive settlement, resulting in angular distortion of the slab sufficient to cause ahazard to motorists. Excessive settlement is defined as 8 inches differential betweenthe bridge and approach fill.
• Creep settlement of the approach fill will be less than 0.5 inch, and less than 20 feet offill will be placed in the approach.
• Approach fill heights are less than 10 feet.• Differential settlement between centerline and shoulder could exceed 2 inches.

Materials Structure Foundation 660.00
2015
Other issues such as design speed, average daily traffic or accommodation of structural details may over-ride the geotechnical reasons for deletion of approach slabs. Approach slabs shall be used on all stub abutment bridges to accommodate expansion and contraction. ITD policy is to use approach slabs as often as possible.
660.5.6 Strength Limit States. Design of foundations at strength limit states shall include evaluation of the nominal geotechnical and structural resistance of the foundation elements as specified in the AASHTO LRFD Bridge Design Specifications.
660.5.7 Extreme Limit States. Foundations shall be designed for extreme events (e.g. floods, earthquakes) where applicable as specified in the AASHTO LRFD Bridge Design Specifications.
660.6 Resistance Factors for Foundation Design, Design Parameters. Load and resistance factors are the result of uncertainties in the design model and soil / rock properties, and unknown uncertainty assumed by the allowable stress design and load factor design included in previous AASHTO Bridge Design Specifications.
It should be assumed that the characteristic soil / rock properties to be used in conjunction with the load and resistance factors herein are average values obtained from laboratory test results or from correlated field in-situ test results. The use of lower bound soil / rock properties could result in overly conservative foundation designs. Depending on the availability of soil and rock property data and the geologic variability of the site, it may not be possible to reliably estimate the average values of the properties needed for design. The geotechnical designer may have little choice but to use conservative values in these cases.
Section 400.00 and Section 620.00 of this manual discuss the exploration and testing needed to justify the use of load and resistance factors provided herein.
660.7 Resistance Factors for Foundation Design, Service Limit States. Resistance factors for the service limit states shall be as specified in the AASHTO LRFD Bridge Design Specifications, Article 10.5 (most current version).
660.8 Resistance Factors for Foundation Design – Strength Limit States. Resistance factors for the strength limit states for foundations shall be as specified in the AASHTO LRFD Bridge Design Specifications, Article 10.5 (most current version). Locally, higher specific values may be used in lieu of the specified factors, but should be determined based on statistical data in combination with calibration or successful prior experience. Smaller factors should be used if the variability of the site or material properties is expected to be unusually high or if assumptions are required that increase uncertainty in design that have not been compensated by use of conservative design parameters.
All other resistance factor considerations and limitations provided in the AASHTO LRFD Bridge Design Specifications Article 10.5 shall be applicable to ITD design practice.

Materials Structure Foundation 660.00
2015
660.9 Resistance Factors for Foundation Design – Extreme Limit States. Design of foundations at extreme limit states shall be consistent with the expectation that structure collapse will be prevented and that safety of the public will be protected.
660.9.1 Scour. The resistance factors and application shall be as specified in the AASHTO LRFD Bridge Design Specifications Article 10.5 (latest version).
660.9.2 Other Extreme Events Limit States. Resistance factors for other extreme event limit states including earthquake, ice impact or vehicle impact loads shall be 1.0, with the exception of sliding and bearing resistance of spread footing foundations. The load factor used for the seismic lateral earth pressure is currently 1.0. To obtain the same level of safety resulting from use of the AASHTO Standard Specification design for sliding and bearing, a resistance factor of slightly less than 1.0 is required. A resistance factor of 0.90 should be used for sliding and bearing resistance during seismic loading. The resistance factor of 0.80 or less shall be used for uplift resistance of deep foundations to account for the difference in skin friction between compression and tension.
660.10 Spread Footing Design. The following lists the sequence of steps normally required for geotechnical analysis and recommendations for spread footing design.
1. Structural designer provides the Situation and Layout for the structure and approximatepier and abutment loads.
2. Perform the geotechnical investigation, including field exploration, testing and sampling.3. Determine depth of footing based on geometry and bearing material.4. Determine depth of footing for scour (with assistance from Hydraulic Engineer).5. Determine soil /rock properties for foundation design, and resistance factors
appropriate for the degree of soil property uncertainty and methods used for calculatingnominal resistance.
6. Determine active, passive, at rest and seismic earth pressure parameters as needed forabutments and piers if appropriate.
7. Determine nominal footing resistance at the strength and extreme limit states.8. Determine nominal footing resistance at the service limit state.9. Check overall stability and determine maximum feasible bearing load to maintain
adequate stability.10. Present recommendations in Phase IV report.11. Structural designer designs the footing at the service limit state.12. When design footing dimensions are significantly different from the preliminary
dimensions, the geotechnical designer, at the request of the structural designer, maycheck nominal footing resistances in all limit states and overall stability in light of newfooting dimensions, depth and loads. The footing dimensions may influence settlementwhich may in turn influence the nominal footing resistances.

Materials Structure Foundation 660.00
2015
660.10.1 Loads and Load Factor Application to Footing Design. Definitions and locations of the forces and moments that act on structural footings are shown in Figure 660.10.01.1. This figure illustrates forces on a typical simple span abutment with an approach slab. The forces on an integral abutment will be similar except that the superstructure force will be directly applied to the abutment rather than as a frictional force on the bearing pad. Forces on interior or pier footings will be similar to those shown except for the approach slab force.

Materials Structure Foundation 660.00
2015
DLSL LLSL
LLS
0.5KaeγH
Figure 660.10.01.1: Definitions and Locations of Forces for L-Shaped Abutments and Interior Footings (modified from WSDOT, GDM)
The variables shown above in Figure 660.10.01.1 are defined as follows:
DL LL EQ = Vertical structural loads applied to footing wall (dead load, live load, and Earthquake load respectively). DLSL & LLSL from approach slab DLA = Dead load -weight of abutment EQA = Inertial force on abutment due to earthquake loading VH = Soil load on heel of wall VT = Soil load on toe of wall DLS = Dead load- lateral force due to active or at-rest earth pressure behind abutment LLS = Live load – lateral earth pressure EQS = Lateral load to combined effect of active or at rest earth pressure plus earth pressure from seismic loading behind abutment RP = Ultimate soil passive resistance – height of triangular pressure distribution is project specific and determined by geotechnical designer. RSH = Shear resistance along footing base at soil concrete interface σV = Resultant vertical bearing stress at base of footing R = Resultant force at base of footing eO = Eccentricity calculated about point “O” at toe of footing XO = Distance to Resultant R from toe of wall B = Footing Width H = Total height of abutment plus superstructure thickness
RSH
VH
DL LL EQ
Superstructure Forces (Parallel to Abutment)
Superstructure Forces (Normal to Abutment)
EQA
VTDLA
RP
σV
B/2 POINT "O"
eO XO
R
B CL Footing
DLS
EQS
H
Sub
stru
ctur
e F
orce
s
0.5H
0.3
D

Materials Structure Foundation 660.00
2015
Load factors applied to all of the above forces are assigned by the structural designer in accordance with the AASHTO LRFD Bridge Design Specifications. Lateral earth pressures and bearing resistances for the various limit states shall be developed by the geotechnical designer.
660.10.2 Foundation Design, Spread Footings. Geotechnical design of spread footings and all related considerations shall be conducted as specified in the AASHTO LRFD Bridge Design Specifications Article 10.6 (most current version), except as specified below. The Geotechnical Engineer in the Construction/Materials Section has available the FHWA computer program CBEAR “Bearing Capacity Analysis of Shallow Foundations”. This program determines bearing capacities of shallow strip, rectangular and square foundations, following methods of Meyerhof and Vesic.
660.10.2.1 Nearby Structures. Where foundations are placed adjacent to existing structures, the influence of the existing structure on the new foundation and the effect of the new foundation on the existing structure shall be included in the investigation. Issues to be investigated include, but are not limited to, settlement of the existing structure due to the stress increase caused by the new footing, decreased overall stability due to the increased load from the new footing, and effect on the existing structure of excavation, shoring and /or dewatering to allow construction of the new footings.
660.10.2.2 Service Limit State Design of Footings. Spread footings shall be designed at the service limit state to meet the tolerable movements for the structure in accordance with Section 660.05.05.01 of this manual. The nominal unit bearing resistance at the service limit state shall be equal or less than the maximum bearing stress that results in settlement that meets the tolerable movement criteria in Section 660.05.05.01, calculated in accordance with the AASHTO LRFD Bridge Design Specifications, and shall also be less than the maximum bearing stress that meets overall stability requirements.
Other factors may affect settlement, such as embankment loading and eccentric loading, and for footings on granular soils, vibration loading should also be considered where appropriate. For Guidance regarding settlement due to vibrations see Kavazanjian, et al. (1997).
Settlement of footings on cohesionless soils calculated by the Hough method was reported by Kimmerling (2002) to be overestimated in dense sands and underestimated in very loose silty sands and silts. WSDOT experience indicates a reduction in settlement estimated by the Hough method by a factor of up to 1.5 may be considered in sands and gravels with an N60 of 20 or more or in sands and gravels that are known to have been subjected to preloading or deep compaction, provided soil parameters have not been used that offset the apparent conservatism of the Hough method. Settlement characteristics of cohesive soils should be investigated using undisturbed sample in laboratory consolidation tests as prescribed in AASHTO LRFD Bridge Design Specifications.
Resistance factors for the service limit states shall be taken as 1.0 except as provided for overall stability in the AASHT0 LRFD Bridge Design Specifications.

Materials Structure Foundation 660.00
2015
Stress distribution in the analysis of settlement of spread footings presented in Article 10.6.2.4 of the 2012 AASHTO LRFD Bridge Design Specifications uses the Boussinesq stress contours. Layered soils, particularly cohesive soils with interbedded sands or silts may attenuate the stress quicker and the Westergaard distribution contours would be appropriate. The Boussinesq and Westergaard stress distributions are shown in Figure 660.10.02.02.1 and Figure 660.10.02.02.2.
660.10.2.3 Strength Limit State Design of Footings. The design of spread footings at the strength limit state shall address the considerations presented in the AASHTO LRFD Bridge Design Specifications, Section 10.5.3.
Spread footings should not be inclined on soil slopes. Horizontal stepped footings should be used instead. Inclined footings on competent rock shall be anchored in accordance with Article 10.6.1.5 of the 2012 AASHTO LRFD Bridge Design Specifications.
Bearing resistance equations for footings, as provided in the AASHTO LRFD Bridge Design Specifications, have no theoretical limit of the bearing resistance predicted. However, ITD limits the nominal bearing resistance for strength and extreme limit states to 50 ksf on soil. Values above 50 ksf should not be used for spread footing design in soil.
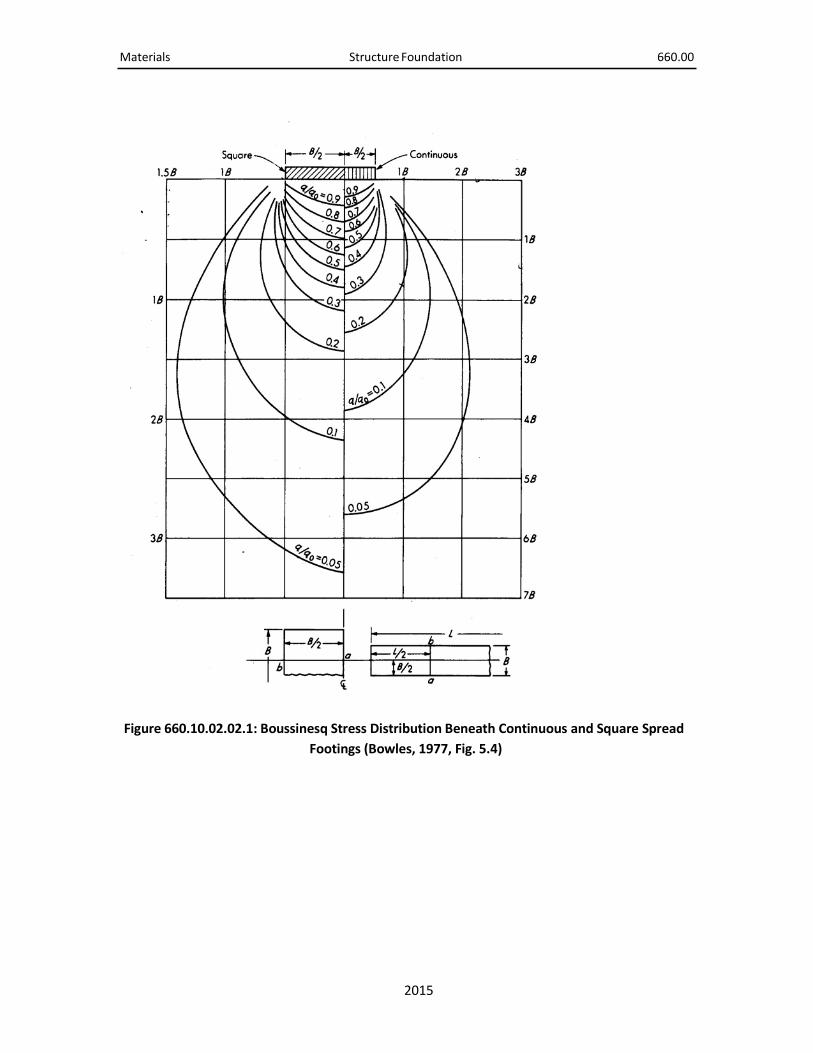
Materials Structure Foundation 660.00
2015
Figure 660.10.02.02.1: Boussinesq Stress Distribution Beneath Continuous and Square Spread Footings (Bowles, 1977, Fig. 5.4)
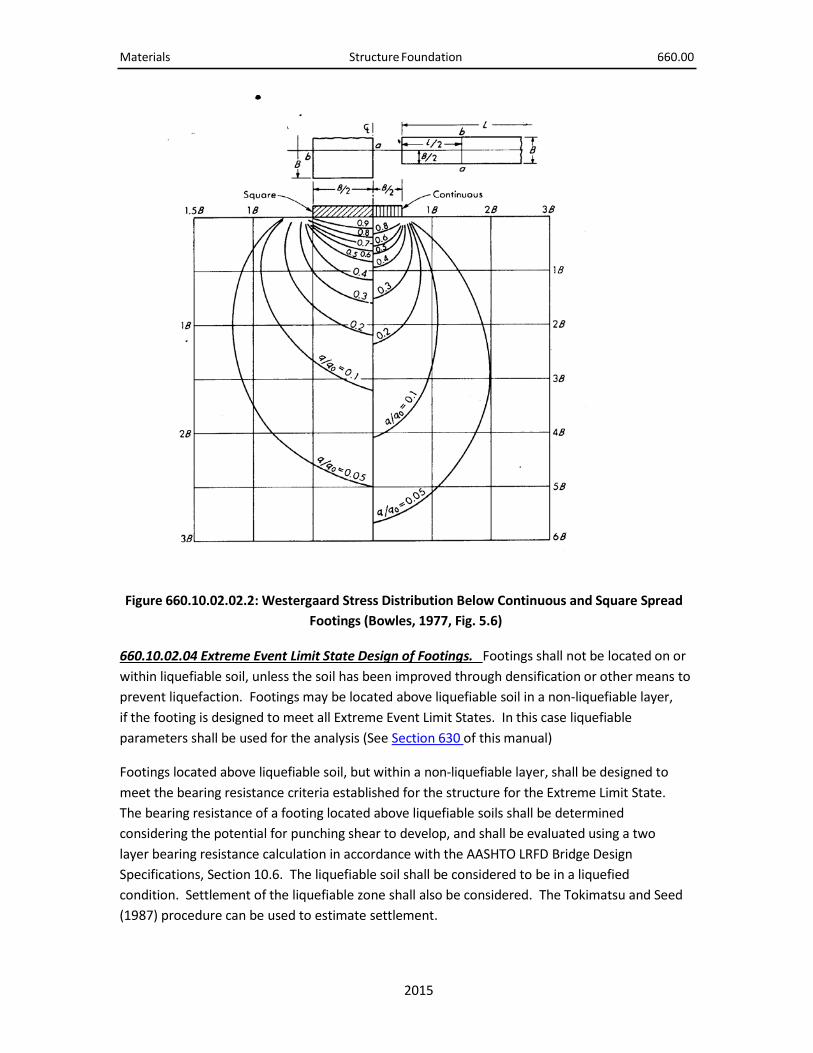
Materials Structure Foundation 660.00
2015
Figure 660.10.02.02.2: Westergaard Stress Distribution Below Continuous and Square Spread Footings (Bowles, 1977, Fig. 5.6)
660.10.02.04 Extreme Event Limit State Design of Footings. Footings shall not be located on or within liquefiable soil, unless the soil has been improved through densification or other means to prevent liquefaction. Footings may be located above liquefiable soil in a non-liquefiable layer, if the footing is designed to meet all Extreme Event Limit States. In this case liquefiable parameters shall be used for the analysis (See Section 630 of this manual)
Footings located above liquefiable soil, but within a non-liquefiable layer, shall be designed to meet the bearing resistance criteria established for the structure for the Extreme Limit State. The bearing resistance of a footing located above liquefiable soils shall be determined considering the potential for punching shear to develop, and shall be evaluated using a two layer bearing resistance calculation in accordance with the AASHTO LRFD Bridge Design Specifications, Section 10.6. The liquefiable soil shall be considered to be in a liquefied condition. Settlement of the liquefiable zone shall also be considered. The Tokimatsu and Seed (1987) procedure can be used to estimate settlement.

Materials Structure Foundation 660.00
2015
660.11 Driven Pile Foundation Design. The following is a list of steps in the geotechnical design process for a pile foundation design. The initial step in the process is preparation of the situation and layout sheet by the bridge section, following which the field exploration is planned and executed.
• Bridge Design Section submits Situation and Layout showing bridge location,topography, abutment and pier locations, approximate top of foundation elevations.
• Geotechnical designer determines scour depth, if present, from hydraulic report.• Perform field exploration, field testing and sampling.• Determine soil properties for foundation design, liquefaction potential, and resistance
factors in consideration of the uncertainty in the soil properties and the methodselected for calculating the nominal soil resistances.
• Determine active, passive, at-rest and seismic earth pressure parameters as needed forabutments.
• Select best pile types and determine nominal single pile resistance at the strength andextreme limit states as a function of depth. Estimate down drag loads if present.
• Provide estimate of settlement for pile / pile group, or foundation depth to mitigateunacceptable settlement. Determine nominal uplift resistance as a function of depth.
• Determine p-y curve parameters and soil properties for pile lateral load analysis.• Once the structural designer develops the size and depth of the pile group needed,
evaluate the pile group for nominal resistance at the strength and extreme limit statesand the settlement and resistance at the service limit state.
• Confirm the estimated tip elevations and pile nominal resistance from step 7, as well asthe minimum tip elevation from the greatest depth needed to meet uplift, lateral loadand serviceability requirements. Determine need for pre-drilling to achieve minimumtip elevation.
660.11.1 Loads and Load Factor Application to Driven Pile Design. Figure 660.11.01.1 provides definitions and typical locations of the forces and moments that act on driven pile foundations.
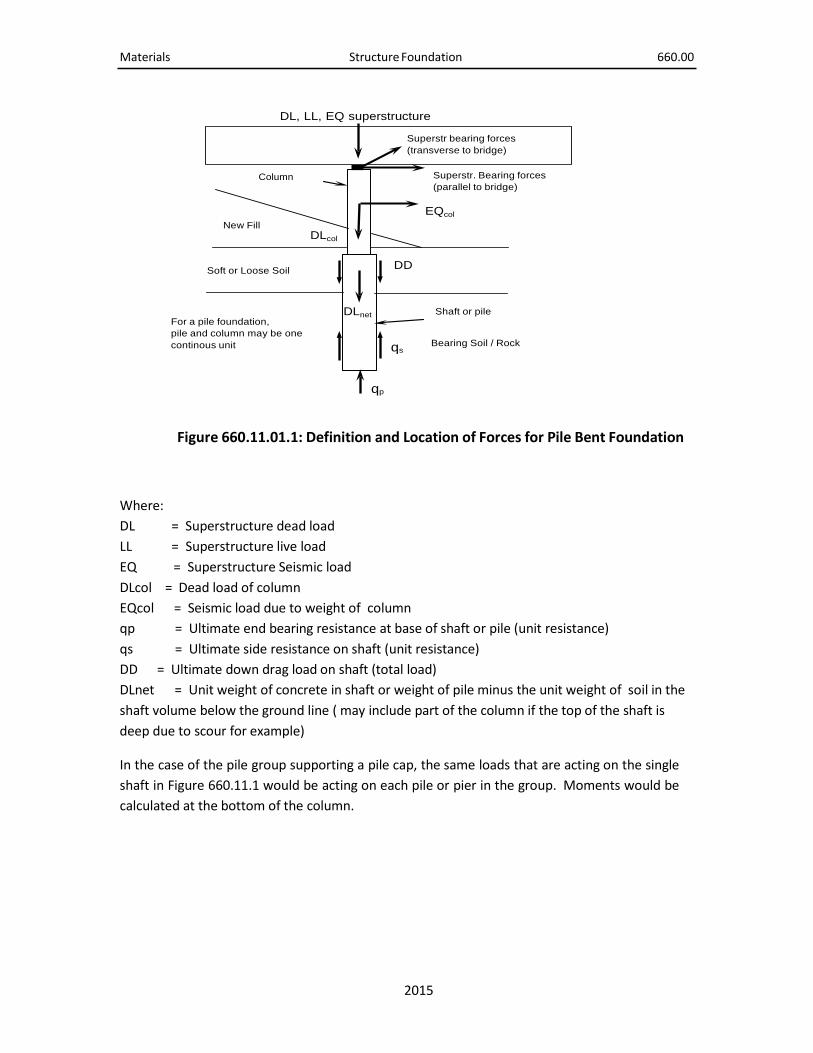
Materials Structure Foundation 660.00
2015
DL, LL, EQ superstructure
Superstr bearing forces (transverse to bridge)
Column Superstr. Bearing forces (parallel to bridge)
New Fill
Soft or Loose Soil
DLcol
EQcol
DD
For a pile foundation, pile and column may be one continous unit
DLnet
qs
Shaft or pile
Bearing Soil / Rock
qp
Figure 660.11.01.1: Definition and Location of Forces for Pile Bent Foundation
Where: DL = Superstructure dead load LL = Superstructure live load EQ = Superstructure Seismic load DLcol = Dead load of column EQcol = Seismic load due to weight of column qp = Ultimate end bearing resistance at base of shaft or pile (unit resistance) qs = Ultimate side resistance on shaft (unit resistance) DD = Ultimate down drag load on shaft (total load) DLnet = Unit weight of concrete in shaft or weight of pile minus the unit weight of soil in the shaft volume below the ground line ( may include part of the column if the top of the shaft is deep due to scour for example)
In the case of the pile group supporting a pile cap, the same loads that are acting on the single shaft in Figure 660.11.1 would be acting on each pile or pier in the group. Moments would be calculated at the bottom of the column.

Materials Structure Foundation 660.00
2015
660.11.2 Driven Pile Foundation, Geotechnical Design. Geotechnical design of driven pile foundations shall be conducted as specified in the AASHTO LRFD Bridge Design Specifications Article 10.7(most current version) except as specified in the following paragraphs and sections. Computer programs for pile foundation design, available in the Construction/Materials Section, include:
DRIVEN: To determine static vertical pile capacities using methods of Nordlund, Thurman, Meyerhof and Tomlinson.
ALLPILE: To determine vertical pile capacity and settlement, lateral capacity and deflection, plus pile group vertical and lateral analysis
LPILE: To analyze piles and drilled shafts subjected to lateral loading.
STRAIN- WEDGE: To analyze single piles or pile groups under lateral loads.
660.11.2.1 Driven Pile, Maximum Resistance. Maximum resistance in the strength limit state is usually limited by the structural capacity of the pile. Based on experience with local soil and rock characteristics, the maximum vertical capacity of the pile may be reduced to reflect the local conditions. For instance, in loose to medium dense sands and gravels, the capacity of the pile may not achieve an increase in capacity for penetrations deeper than 60 feet. Experiences indicated that the DRIVEN program has a tendency to overestimate pile capacity in dense saturated sand and rounded gravel.
660.11.2.2 Minimum Pile Spacing. A center to center spacing of the minimum 30 inches or 2.5 diameters, whichever is larger, is recommended. Lesser spacing may be considered on a case by case basis, subject to the approval of the Geotechnical Engineer and the Bridge Design Engineer.
660.11.2.3 Lateral Pile Resistance. Pile foundations are subjected to horizontal or lateral loads due to wind, traffic loads, bridge curvature, vehicle impact and earthquake. The nominal resistance of pile foundations to lateral loads shall be evaluated based on both soil/rock properties and structural properties, considering soil-structure interaction. Determination of the soil/rock properties required as input for design is presented in Section 620.00 of this Manual.
Methods of manual analysis were developed by Broms (1964) and discussed in detail by Hannigan et al (2005) “Design and Construction of Driven Pile Foundations” Vol. 1 and 2, Federal Highway Administration Report No. FHWA-NHI-05-042 Vol. 1 and FHWA-NHI-05-042 Vol. 2 respectively. Horizontal movement of pile foundations may be analyzed using computer applications such as LPILE and STRAIN-WEDGE listed above.
Reese (1984) developed analysis methods that model the horizontal soil resistance using P-y curves. This analysis is now commonly used and software is available for analyzing single piles or pile groups. The program LPILE is most often used by ITD to estimate lateral resistance. The

Materials Structure Foundation 660.00
2015
P-y curves for use in the program can be developed from lateral pile load tests, pressuremeter tests, or from published values for typical soil types. The program contains typical values for several basic soil types. The development of P-y curves depends on the ability of a pile to bend and deflect. In the case of short piles or piers that act as a rigid element and tilt rather than bend, Strain-wedge theory is more applicable. Broms’ method includes design curves for short stiff piles.
Lateral resistance of single piles may be determined by static load test, performed in accordance with the procedure specified in ASTM D 3966. To determine the profile of the deflected pile it is necessary to provide for inclinometer measurements the length of the pile.
The lateral response of the piles shall be modified to account for group effects. For P-y curves the P-multipliers (Pm), as in Table 10.7.2.4-1 of the AASHTO LRFD Bridge Design Specifications (2012), used to modify the single pile curves are applied usually by the structural designer. If the Geotechnical Engineer is given the opportunity to check the lateral resistance of the group, the pile load modifiers presented in Hannigan, et.al., (2005) shall be used. These modifiers are not applicable if Strain-wedge theory is used. In applying the modifiers, Row 1 is defined as the row in the pile group furthest from the applied load.
The use of batter piles for lateral resistance should be avoided unless no other option is available. Settlement of abutment embankments or abutments can induce very high loads along batter piles, occasionally pulling the piles out of the pile caps.
660.11.2.4 Service Limit State Design of Pile Foundations. Driven Pile foundations shall be designed at the service limit state to meet the tolerable movements for the structure in accordance with Section 660.05.05.01 of this manual.
Service limit state design of driven piles includes the evaluation of settlement due to static loads, downdrag loads (if applicable), overall stability, lateral deformation and lateral squeeze. Overall stability of a pile foundation shall be evaluated when the foundation is placed through an embankment, located on or near a slope, subject to scour and the bearing strata are inclined into the roadway at an abutment.
660.11.2.4.1 Overall Stability. The overall stability analysis shall be in accordance with Section 660.05.05.02 of this manual.
660.11.2.4.2 Horizontal Movement. The horizontal movement of pile foundations shall be estimated using procedures as specified in Section 660.11.02.03 of this manual.
660.11.2.5 Strength Limit State Design of Pile Foundations. The nominal axial resistance of piles shall include analysis of scour and downdrag where applicable.

Materials Structure Foundation 660.00
2015
660.11.2.5.1 Scour. Scour shall be considered in static analysis of pile nominal axial resistance. If a static analysis method is used to determine the final pile bearing resistance, the available bearing resistance and the required pile tip penetration shall be determined by assuming the material subject to scour is completely removed. There would be no overburden stress at the scour depth and no lateral support above the bottom of the scour zone.
If dynamic measurements (wave equation or pile analyzer) or dynamic formula are used to determine final pile bearing resistance during construction, the total driving resistance needed to obtain the nominal axial resistance must include the skin friction in the scour zone that does not contribute to the design pile resistance. The static skin friction contributed by the material in the scour zone must be added to the nominal pile resistance to determine the required driving resistance. The static skin friction in the scour zone is unfactored.
660.11.2.5.2 Downdrag. Downdrag shall be included in the total loads to be resisted by the pile foundation. The total factored geotechnical resistance must be greater than the factored loads applied to the pile, including the downdrag, at the strength limit state. Only the positive skin and tip resistance, below the lowest layer contributing to the down drag, shall be considered in developing the nominal pile resistance available to support the structure loads. The piles must be designed to structurally resist the structure and downdrag loads. The total nominal driving resistance needed to obtain the nominal pile resistance includes the static skin friction that must be overcome during driving that does not contribute to the design resistance of the pile.
Where it is not possible to obtain adequate resistance for friction piles, below the lowest layer contributing to down drag, to fully resist downdrag, or if significant deformation will be required to mobilize the frictional resistance needed to resist the factored structure loads including downdrag, the structure should be designed to tolerate the anticipated settlement in accordance with Section 10 of AASHTO LRFD Bridge Design Specifications. For the purposes of this static analysis procedure, the soil layers subject to downdrag are assumed to contribute overburden stress to the bearing layers. Resistance estimated using a dynamic method in accordance with AASHTO LRFD Bridge Design Specifications, Section 10, must subtract the skin friction within the downdrag zone from the resistance determined from the dynamic method used during pile driving.

Materials Structure Foundation 660.00
2015
660.11.2.5.3 Determination Of Nominal Axial Pile Resistance In Compression. Determination of nominal axial pile resistance in compression during pile driving shall be made using the results of the preconstruction wave equation analysis or from pile analyzer data during driving. The wave equation analysis is performed for each project by the Geotechnical Engineer in the Construction/Materials Section. In the instance that a wave equation analysis cannot be provided, nominal axial pile resistance shall be determined by the dynamic formula in Section 505.03-G of the Idaho Transportation Department Standard Specifications for Highway Construction. Notify the Engineer who designed the bridge before using the dynamic formula to determine the nominal axial pile resistance so that he/she can change the nominal axial resistance if necessary. Nominal axial pile resistance may also be determined by static loading tests in accordance with ASTM D 1143, although pile load tests are seldom used due to high cost.
The dynamic formula in the Standard Specifications may not be valid where a follower is used. The pile top must not be damaged, the penetration must occur at a reasonably quick and uniform rate and the hammer must be in good condition and operating normally.
Pile drivability analysis is made as a part of the preconstruction wave equation analysis. If the dynamic formula is used drivability is not checked and the pile design stresses must be limited to levels that will assure that the pile can be driven without damage. For steel piles, guidance is provided in the AASHTO LRFD Bridge Design Specifications.

Materials Structure Foundation 660.00
2015
660.11.02.05.04. Nominal Horizontal Resistance of Pile Foundations. Nominal Horizontal Resistance of Pile Foundations shall be evaluated based on both geotechnical and structural properties. The horizontal soil resistance should be modeled using the p-y curves applicable to the soils at the site or by strain wedge theory. The analysis may be performed on a representative single pile with the appropriate pile head boundary condition (degree of fixity). If p-y curves are used, they shall be modified for group effects in accordance with Section 660.11.02.03 of this manual. P-multipliers ,(Pm)shall not be used if strain wedge theory is used. Group effects shall be addressed through evaluation of the overlap of stresses between shear zones formed by the passive wedge developed in front of each pile in the group. The horizontal resistance of the soil on the face of the pile cap may be included if the cap will always be embedded.
660.11.02.06 Extreme Event Limit State Design of Pile Foundations. See the latest AASHTO LRFD Bridge Design Specifications, Section 3 for applicable factored loads for each extreme event limit state. Factored axial and lateral resistance shall exceed the factored loads applied to the pile. For seismic design, all soil within and above liquefiable zones shall not contribute to axial compressive resistance. Downdrag resulting from liquefaction induced settlement shall be determined as specified in Section 630.05.02.03 and Section 660.11.02.05 of this manual and The AASHTO LRFD Bridge Design Specifications, and included in the loads applied to the foundation. Static downdrag loads should not be combined with seismic downdrag loads.
As in static downdrag analysis, the total driving resistance needed to obtain the axial resistance, must account for the skin friction that must be overcome in driving but does not contribute to the design resistance of the pile. Where it is not possible to obtain adequate geotechnical resistance to the liquefaction induced down drag, or if significant settlement is anticipated to develop the resistance needed to resist the loads including the downdrag, the structure must be designed to tolerate the settlement from the downdrag and other applied loads in accordance with the AASHTO LRFD Bridge Design Specifications.
The static analysis procedures in the AASHTO LRFD Bridge Design Specifications, Section 10 may be used to estimate the available pile resistance and to estimate the pile lengths required to support the downdrag plus structure loads. The soil subject to downdrag may still be assumed to contribute to the overburden stress on the bearing zone.
The available pile resistance may also be estimated using a dynamic method per AASHTO LRFD Bridge Design Specification. The skin friction resistance with the zone contributing liquefaction induced downdrag is subtracted from the resistance estimated from the dynamic method. The skin friction in the downdrag zone can be estimated using the static analysis specified in the AASHTO LRFD Bridge Design Specifications, Section 10 or from the pile dynamic analysis or from pile load tests.
The pile foundation shall also be designed to resist the horizontal force from lateral spreading or the soil improved to prevent liquefaction and lateral spreading. If the P-y curves are used to

Materials Structure Foundation 660.00
2015
estimate lateral pile resistance, the soil input parameters should be reduced to account for liquefaction. The duration of strong shaking and the ability of the soil to fully liquefy during the period of strong shaking should be considered in determining the amount of reduction.
Fully liquefied soil can be treated as soft clay, using residual strength parameters from Seed and Harder (1990), assuming the strain required to mobilize 50% of the ultimate resistance to be 0.02, or alternatively the soil can be treated as a very loose sand. Research at University of Nevada- Reno, (Ashour and Norris, 1999 and 2003) indicated both the sand and clay P-y models are inaccurate and a strain hardening response is more correct. Initially the stiffness is low, but increases with increasing strain. Computer programs that predict the liquefaction induced pore pressures can calculate the stiffness of liquefied soils directly.
Lateral spreading force should be calculated as described in Section 630.00 of this manual. For earthquake magnitudes anticipated in Idaho, the lateral spreading forces should not be combined with the seismic forces.
The timing of the development of full liquefaction and full seismic forces is not certain. It depends on the duration of the strong shaking. Load distributions can be determined using full seismic forces and both un-liquefied and fully liquefied soil parameters. Both loads and parameters are unfactored. Factoring is applied once the loads have been distributed. The design resistance factor applied to the soil stiffness is 1.0 for evaluation of pile fixity.
Designing for scour in the extreme limit state shall be in accordance with the 22012 AASHTO LRFD Bridge Design Specifications, Article 10.7.3.6.
660.12 Construction of Driven Pile Foundations. Most of the piles used in Idaho’s transportation projects are steel piles, either pipe or H piles. Pile sizes typically range from 12 to 42 inches in diameter for pipe piles and 12 to 14 inches for H piles.
660.12.1 Pile Capacity. Pile capacities are determined during driving by using pile driving criteria developed with the Wave Equation (WE) Analysis. Before piles are driven, the Resident Engineer must request information on the hammer from the contractor, which is given to the Construction/Materials Section Geotechnical Engineer with a request for pile driving criteria. The Geotechnical Engineer then enters this information and other information on the pile and soils encountered into the WE analysis program to develop the pile driving criteria for the project. A typical pile driving criteria, developed with WE analysis includes a graph showing the relationship between pile capacities and the hammer blow count per foot of driving. The graph includes capacity curves developed for a range of hammer strokes; typically in 0.5 foot increments. An example of the pile driving criteria developed from the WE analysis is shown in Figure 660.12.01.1.
When piles are to be driven to refusal in hard or very dense soils or in rock, definitions of refusal must be developed. Pile driving refusal is typically defined as blows per inch of penetration, and is mostly dependent on the type and size of the pile and hammer. To define refusal using the

Materials Structure Foundation 660.00
2015
WE analysis, the following criteria should be considered: 1) At refusal, the pile capacity will exceed the ultimate capacity, 2) The stresses induced in the pile during driving must be kept below the allowable limits, 3) The required blow count is reasonable (say, no more than about 25 blows/inch), and 4) The pile capacity curve indicates that increasing blow counts, beyond the defined refusal, will not significantly increase the pile capacity.
Hammers used for driving piles typically have a rated energy from about 25,000 ft-lbs to over 100,000 ft-lb. Most of the pile driving hammers used on Idaho transportation projects are open ended diesel hammers. However, hydraulic hammers have been used recently and closed end diesel and steam hammers have been used in the past.
660.12.2 Pile Points. When piles must penetrate hard or dense soils, soils containing cobbles or boulders, or when piles must be driven to refusal into rock, pile tip protectors should be used to help in achieving the required depth and to reduce the potential for damage to the pile tip. Pre approved prefabricated splicers can be used to join pile sections. Tables 660.12.02.1 and 660.12.02.2 list all the pre-approved pile tip protectors and pile splicers. These tip protectors and splicers are shown graphically in Figure 660.12.02.1 and Figure 660.12.02.2. Refer to ITD’s Qualified Product List (QPL) website for the most updated lists of pre-approved pile accessories.
660.12.3 Pre-Drilling. Pre-drilling can be necessary to allow piles to penetrate hard or dense soil layers and to achieve minimum required penetration. According to ITD Standard Specifications, all piles must penetrate a minimum of 10 ft. in hard or dense soils and at least 20 ft. in loose or soft soils. Piles extending through embankment fill shall penetrate a minimum of 10 feet into original ground. Greater minimum penetration is sometimes needed due to expected scour, potential liquefaction or settlement in soil layers or when deep pile embedment is needed to develop adequate resistance to lateral loads. Pre-drilling typically extends to the minimum penetration depth and the pile is driven in the drilled hole to the desired capacity or refusal.
For steel pipe piles, an oversize hole is normally drilled and the pile driven in the hole to desired capacity or refusal. Casing may be needed to prevent caving of the drilled hole. The annular space between the soil and pile is typically filled with sand or pea gravel. An undersized hole is normally drilled for H piles to enhance the contact between the pile section and the supporting soil. If an oversized hole is drilled for H piles, the hole filled with sand or pea gravel and the pile driven through the filled hole.

Materials Structure Foundation 660.00
2015
450
400
350
300
250
200
150
100
50
0 50 100 150 200 250 300 350 400
ULTIMATE PILE CAPACITY, TONS
Figure 660.12.01.1: Results of Wave Equation Analysis – Pile Driving Criteria
ULTIMATE PILE CAPACITY vs BLOW COUNT FOR PILES AT ABUTMENTS SNAKE RIVER BRIDGE at WEISER
6.0' STROKE
6.5' STROKE
7.0' STROKE
7.5' STROKE
8.0' STROKE
8.5' STROKE
9.0' STROKE
9.5' STROKE
10' STROKE
Design Pile Capacity,
HAMMER: DELMAG D 19-42 PILE:
NUM
BER
OF
BLO
W/L
AST
FOO
T O
F DR
IVIN
G

Materials Structure Foundation 660.00
2015
Table 660.12.02.1: Approved Tip Protectors and Splicers for H Piles
APPROVED TIP PROTECTORS FOR STEEL H PILES
POINT TYPE &USE APF DFP ICE VERSA STEEL
CONSTRUCTION SUPPLY CO.
Square tip end bearing in gravel, level rock
1) 755002) VB-300
Series
Common point for gravels
1) 77750-B2) 7780-B*3) PAR Series
H-777 HPH Series
Common point with teeth for rock or gravel with boulders
1) 77600-B2) PAR Series4) VB-300P
Series
H-776 HPH-RB Series
VS-300 Series HT 3300
Rock point, slim section with teeth
1) 77750-B2) 7780-B*3) PAR Series
H-777 HPH-RB Series
* Point 7780B is available for 12” H piles only
APPROVED SPLICERS FOR STEEL H PILES
PILE TYPE APF DFP ICE VERSA
STEEL CONSTRUCTION
SUPPLY CO. H Piles HP-30000 HP-300 HSA
SERIES VS400 HS 1000

Materials Structure Foundation 660.00
2015
Table 660.12.02.2 Approved Tip Protectors and Splicers for Pipe Piles APPROVED POINTS, SHOES, BOOTS FOR STEEL PIPE PILES
POINT,SHOE, BOOT TYPE
APF DFP ICE VERSA STEEL
CONSTR- UCTION SUPPLY CO.
60 Degree Conical Point –
Inside Fit
1) P-13006
2) VB-900
Series
60HD Series VS-900 Series
CP 9900
60 Degree Conical Point – Inside Fit(bullet nose)
P-14006 P-77R CP 9900 B
Open End Cutting Shoe -
Inside Fit
1) O-14001
2) VB 700
Series
0140 ICE Inside Cutting Shoe
VS-700 Series
CS 7700
Closure Boot PB-20000 PB-170 ICE Round Tite Boot
APPROVED SPLICERS FOR STEEL PIPE PILES
PILE TYPE
APF DFP ICE VERSA STEEL CONSTRUCTION
SUPPLY CO.
PIPE Piles
1) S-18000
2) S-20000
3) VB 800
Series
S-1800 Round Bite Coupler
VS800 PS 8800

Materials Structure Foundation 660.00
2015
APF: Associated Pile & Fitting – Phone: 800 526 9047
DFP: Dougherty Foundation Products – Phone: 201 337 5748 ICE: ICE products are manufactured by MID- AMERICA FOUNDATION SUPPLY
INC. Phone: 888 893 7453
VERSA STEEL: Versa Steel Inc. – Phone: 800 678 0814
CONSTRUCTION SUPPLY CO. Phone: 503 620 2971

Materials Structure Foundation 660.00
2015
Figure 660.12.02.1: Tip Protectors and Splicer for H Piles

Materials Structure Foundation 660.00
2015
Figure 660.12.02.2: Protective Points, Cutting Shoe and Splicer for Pipe Piles

Materials Structure Foundation 660.00
2015
660.13 Drilled Shaft Foundations. The following lists the steps required in the geotechnical design process for drilled shaft foundations:
1. Bridge Design submits the Situation and Layout for the structure2. Plan and initiate field exploration (drilling, geophysical testing etc.)3. Determine soil properties for foundation design, liquefaction potential, and resistance
factors, with consideration of the uncertainty of the properties and the analysismethods.
4. Determine depth of scour if applicable from Hydraulic reports.5. Develop active, passive, at-rest and seismic earth pressures as needed for abutments.6. Determine nominal single shaft resistance at the strength and extreme limit states as a
function of depth, for most probable shaft diameters. Consider constructability.7. Estimate downdrag loads if applicable.8. Provide settlement estimates and settlement limited resistance available (service state)
for single shaft and or group. Estimate foundation depth required to preventunacceptable settlement.
9. Determine nominal uplift resistance as a function of depth10. Estimate lateral load resistance of single shafts and or shaft group.11. Prepare and submit Phase IV Foundation Investigation Report to Structural Designer.12. If necessary evaluate shaft /group of shaft as structurally designed for nominal
resistance at the strength and extreme limit states and settlement and resistance at theservice limit state.
660.13.1 Loads and Load Factor Application to Drilled Shaft Design. Definitions and typical location of the forces and moments that act on drilled shafts are essentially the same as on driven piles as shown on Figure 660.11.1. Shafts with enlarged bases (belled caissons) will depend on end bearing for resistance to axial load rather than friction. Resistance to lateral load will be similar to that for driven piles. Uplift will depend on the total weight of shaft and soil overlying the bell, and shaft skin friction. See Section 10 of the latest AASHTO LRFD Bridge Design Specifications for the computation of uplift resistance of drilled shafts and belled caissons.
660.13.2 Drilled Shaft Geotechnical Design. The geotechnical design of drilled shaft foundations shall be as specified in the AASHTO LRFD Bridge Design Specifications Article 10.8(most current version) except as specified in the following paragraphs and sections.
Procedures for the design and construction of drilled shafts are thoroughly described in FHWA- NHI-10-016, Drilled Shafts: Construction Procedures and LRFD Design Methods, 2010.

Materials Structure Foundation 660.00
2015
660.13.2.1 Nearby Structures. Where shaft foundations are placed adjacent to existing structures, the influence of the existing structure on the behavior of the foundation, and the influence of the shaft foundation on the existing structure should be evaluated. Vibration from installation and caving of soils during shaft excavation are two major concerns. Caving of the sides of the shaft excavation could cause loss of support to the existing structure. If caving is of concern, casing should be advanced as the shaft excavation proceeds.
660.13.2.2 Service Limit State Design of Drilled Shafts. Drilled shaft foundations shall be designed at the service limit state to meet the tolerable movements for the structure in accordance with Section 660.05.05.01 of this manual. Design shall include evaluation of settlement from static or downdrag loads, overall stability and lateral squeeze and deformation as outlined in Section 660.11.02.04.
The effect of scour shall be considered in accordance with the AASHTO LRFD Bridge Design Specifications Section 10 (latest version).
Horizontal movement of shafts and shaft groups shall be evaluated in accordance with Section 660.11.02.03 of this manual.
Overall stability of shafts and shaft groups shall be evaluated in accordance with Section 660.05.05.03 of this manual.
660.13.2.3 Strength Limit State, Geotechnical Design of Drilled Shafts. The nominal shaft resistances that shall be evaluated at the strength limit state include; axial compression, axial uplift, punching of shafts into a weak layer, lateral resistance of the soil or rock strata. The effect of scour and downdrag on the axial resistance shall also be included in the strength limit state design.
Scour shall be considered in the estimate of shaft penetration based on applicable provisions of the AASHTO LRFD Bridge Design Specifications Section 10. The shaft foundation shall be designed so that the shaft penetration after the design scour event satisfies the nominal axial and lateral resistance. The soil lost to scour is not available to provide overburden pressure in the soil below the scour zone.
Downdrag loads shall be added to the axial structure loads on the shaft foundation. Only the positive skin friction and end bearing resistances below the lowest layer that contributes to the downdrag load shall be considered in estimating the nominal axial resistance to the shaft. The available factored geotechnical resistance should be greater than the factored applied loads including the downdrag.
Where adequate resistance cannot be obtained below the lowest layer contributing to the downdrag, to fully resist the downdrag, the structure should be designed to tolerate the settlement.

Materials Structure Foundation 660.00
2015
Nominal Horizontal Resistance of Shaft and Shaft Group Foundations shall be evaluated in accordance with Section 660.11.02.05. For shafts classified as long using the equation presented below, P-y methods may be used with computer programs such as LPILE. Short or intermediate shafts maintain a lateral deflected shape that is nearly a straight line. A shaft is defined as short if its Length to relative stiffness ratio (L/T) is less than or equal to 2. Intermediate shafts are defined as having a stiffness ratio greater than two but less than or equal to 4. Shafts with a stiffness ratio greater than 4 are considered long. The relative stiffness, T, is defined as:
T = (EI/f)0.2 where: E = Shaft modulus I = Moment of inertial for the shaft, and EI is the bending stiffness of the shaft and
f = Coefficient of subgrade reaction for the soil in which the shaft is embedded in accordance with Fig. 9 , Chapter 5, Section 7, NAVFAC DM 7.2 (1982).
LPILE is suitable for estimating the lateral resistance of drilled shafts, long or short, as well as driven piles.
660.13.2.4 Extreme Event Limit State Design of Drilled Shafts. The provisions of Section 660.11.02.06 shall apply, except for liquefaction induced downdrag. The nominal shaft resistance available to support loads plus the downdrag shall be estimated by including only the positive skin friction and tip resistance below the lowest layer contributing to the downdrag.
660.14 Micropiles. Micropiles are small diameter piles, typically less than 1 foot, drilled and grouted replacement piles and typically are reinforced. Micropiles are classified by type, from A to E, based on their method of installation. Micropiles can support large axial loads but only moderate lateral loads. Micropiles are installed by small equipments that cause minimal disturbance to adjacent structures, soils or environment. Micropiles are often considered for the following conditions: At locations where difficult subsurface conditions, e.g. cobbles, boulders, etc would hinder installation of driven piles or drilled shafts; where there is limited headroom or difficult access; where vibration limits preclude conventional pile driving operations or access by drilled shaft equipments.
Design of micropiles shall be in accordance with Article 10.9 of the Most current AASHTO LRFD Design Specifications, FHWA publication No. FHWA-NHI-05-039 “Micropile Design and Construction Reference Manual” (Sabatini, et al., 2005), or FHWA publication No. FHWA-SA-97- 070 Micropile Design and Construction Guidelines (June 2000).
660.15 Proprietary Foundation Systems. Only proprietary foundation systems that have been reviewed and approved by the ITD Approved Products Committee and the Geotechnical Engineer may be used for structural foundation support.

Materials Structure Foundation 660.00
2015
660.16 References.
AASHTO, 2012 LRFD Bridge Design Specifications, American Association of State Highway and Transportation Officials, 6th Edition.
Sabatini, et al, 2005 “Micropile Design and Construction Reference Manual” FHWA publication No. FHWA-NHI-05-039 “
Amour, T., Groneck, T., Keeley, J. and Sharma, S., 2000. Micropile Design and Construction Guidelines, Implementation Manual, FHWA-SA-97-070.
Ashour, M. and Norris, G.M., 1999. “Liquefaction and Undrained Response Evaluation of Sands from Drained Formulation,” ASCE Journal of Geotechnical and Geoenvironmental Engineering, Vol 125, No. 8.
Ashour, M. and Norris, G.M., 2003. “Lateral Loaded Pile Response in Liquefiable Soil,” ASCE Journal of Geotechnical and Geoenvironmental Engineering. Vol. 126, No. 6.
Ashour, M., Norris, G.M. and Pilling, P. 1998. “Lateral Loading of a Pile in Layered Soil Using the Strain Wedge Model,” ASCE Journal of Geotechnical and Geoenvironmental Engineering,
Broms, B.B., 1964a. “Lateral Resistance of Piles in Cohesive Soil,” ASCE, Journal for Soil Mechanics and Foundation Engineering, Vol. 90, SM2.
Broms, B.B., 1964b. “Lateral Resistance of Piles in Cohesionless Soils,” ASCE Journal for Soil Mechanics and Foundation Engineering, Vol. 90, SM3.
Cheney, R. and Chassie, R., 2000. Soils and Foundations Workshop Reference Manual, National Highway Institute Publication NHI-00-045, Federal Highway Administration.
Hannigan, P.J., Goble, G.G., Likins, G.E. and Rousche, 2005. “Design and Construction of Driven Pile Foundations”, - Vol. I and Vol. II, Federal Highway Administration Report, FHWA-NHI-05-42 Vol. 1 and FHWA-NHI-05-42 Vol. 2.
Hough, B.K., 1959. “Compressibility as the Basis for Soil Bearing Value,” Journal of the Soil Mechanics and Foundations Division, ASCE, Vol. 85, Part 2.
Kavazanjian, E., Jaw-Nan, J.W., Martin, G.R., Shamsabadi, A, Lam, I. Dickenson, S.E., and Hung, C.J., 2011, “Geotechnical Engineering Circular No. 3, LRFD Seismic Analysis and Design of Transportation Geotechnical Features and Structural Foundations,” Federal Highway Administration Report, FHWA-NHI-11-032.
Kimmerling, R.E., 2002, Geotechnical Engineering Circular 6, Federal Highway Administration Report, FHWA-SA-02-054.
Moulton, L.K., GangaRao, H.V.S. and Halverson, G.T., 1985. “Tolerable Movement Criteria for Highway Bridges,” Federal Highway Administration Report, FHWA-RD-85-107.
Norris, G.M., 1986. “Theoretically Based BEF Laterally Loaded Pile Analysis, “ Proceedings, Third International Conference on Numerical Methods in Offshore Piling, Nantes, France.

Materials Structure Foundation 660.00
2015
Brown, D.A., Turner, J.P., and Castelli, P.E., 2010. Drilled Shafts: Construction Procedures and LRFD Design Methods, FHWA Report, FHWA-NHI-10-016.
Reese, L.C., 1984. Handbook on Design of Piles and Drilled Shafts under Lateral Load, Federal Highway Administration Report No. FHWA-IP-85/106.
Seed, R.B. and Harder, L.F. Jr., 1990. “SPT Based Analysis of Cyclic Pore Pressure Generation and Undrained Residual Strength,” Proceedings, H.B. Bolton Seed Memorial Symposium, J.M Duncan, Editor, BiTech, Vol. 2.
Tokimatsu, K. and Seed H.B., 1987. “Evaluation of Settlements in Sands de to Earthquake Shaking,” ASCE Journal of Geotechnical Engineering, Vol. 113, No. 8.
Washington State Department of Transportation, 2006. Geotechnical Design Manual.

Materials Retaining Structures and Reinforced Slopes 670.00
2015
SECTION 670.00 - RETAINING STRUCTURES AND REINFORCED SLOPES
Retaining structures include bridge abutments, wing walls, retaining walls and shoring. This section addresses the lateral earth pressures acting on these retaining structures and on reinforced slopes. Retaining structures and reinforced slopes are commonly used to reduce Right of Way requirements for new or reconstruction, minimize or prevent encroachment on wet lands or other sensitive areas and to widen existing facilities.
Except for bridge abutments, stiff legs, and box culverts, the appropriate location and type of retaining structure or reinforced slope is subject to some uncertainty. Roles and responsibilities overlap or change depending on the wall type and use. All retaining structures and reinforced slopes designed by ITD or its consultants and administered during construction by ITD shall be designed in accordance with this Manual and the AASHTO LRFD Bridge Design Specifications (most current edition).
The following publications provide additional design and construction guidance for retaining structures and reinforced slopes.
• Lazarte et al., (2003) Geotechnical Engineering Circular No. 7, Soil Nail walls, U.S.Department of Transportation, Federal Highway Administration, FHWA-IF-03-017.
• Cheney, R and Chassie, R .( 2000), Soils and Foundations Workshop Reference Manual,Washington D.C., Federal Highway Administration, National Highway InstitutePublication, NHI-00-045.
• Elias, V., Christopher, B.R., and Berg, R.R., (2001), Mechanically Stabilized Earth Wallsand Reinforced Soil Slopes – Design and Construction Guidelines, Federal HighwayAdministration, National Highway Institute Publication, FHWA-NHI-00-043.
• Sabatini, et al., (1999), Geotechnical Engineering Circular No. 4, Ground Anchors andAnchored Systems, FHWA-IF-99-015.

Materials Retaining Structures and Reinforced Slopes 670.00
2015
670.1 Wall Systems. ITD does not incorporate standard wall designs in the Standard Drawings. Wall systems used by ITD can be categorized non-standard and proprietary or non-proprietary. The proprietary systems are those which are patented or trademarked and for which the wall manufacturer is responsible for the internal and external stability, except bearing resistance, settlement and overall stability which are determined by the geotechnical designer at ITD or its consultants. Non-proprietary systems are not patented or trademarked systems, but may include proprietary products or elements, such as gabions. Gabion walls incorporate patented gabion baskets, but the design of the wall and the arrangement of the baskets is the responsibility of the user. Non-standard, non-proprietary walls are fully designed by the geotechnical designer and, if structural design is required, by the structural designer. Reinforced slopes are similar to non-standard, non-proprietary walls in that the geotechnical designer is responsible for the design, but the reinforcing may be a proprietary item.
A number of proprietary wall systems have been extensively reviewed by the Earth Retaining Wall Review Committee, and accepted for use on ITD projects. The ITD Geotechnical Engineer may be contacted to obtain a list of approved proprietary wall systems. These wall systems are also listed in the ITD Prequalified Product List QPL. Not all pre-qualified wall systems may be used for each specific project due to the limitations on the use of each system, aesthetic, or any other reasons that may precludes the use of a wall system. The specific details and system specific design requirements for proprietary wall systems is presented in Section 675.00 of this manual.
The procedure for development and construction of retaining walls for ITD transportation projects is shown in Figure 670.01.1.

Materials Retaining Structures and Reinforced Slopes 670.00
2015
Design by ITD Design by Contractor
Design Wall Prepare Concept Design for Wall
Prepare Bid Documents Prepare Bid Documents
Award Contract
Figure 670.01.1: Procedure for Development and Construction of Retaining Walls
(1) Walls less than 10 feet high may not need a specific subsurface investigation and report and may be handled as part of the overall project Phase II Report.
Accept Completed Wall
Wall Construction by Contractor
Provide Technical Assistance and Inspect Work
Perform Subsurface Investigation and Prepare Foundation Investigation Report (1)
Define Need for Wall System
Select Feasible Wall Systems
Award Contract
Review and Approve Wall Design Prepared by Contractor

Materials Retaining Structures and Reinforced Slopes 670.00
2015
670.2 Geotechnical Data Required for Retaining wall and Reinforced Slope Design. The project requirements, site and subsurface conditions should be analyzed to determine the type and quantity of information to be developed during the geotechnical investigation. The following are necessary areas of concern.
• Areas of potential variability in subsurface conditions, and higher risk.• Likely sequence of construction and phases of construction.
o Design and constructability issues such as:o Surcharge loads from adjacent structureso Backslope and toe slope geometryo Right of way restrictiono Materials Sourceso Temporary Supporto Easementso Excavation Limitso Wetlandso Construction staging
• Performance Criteria such as:o Tolerable Settlement for the retaining structure or slopeo Tolerable settlement of structures or property being retainedo Construction impact on adjacent structures or propertyo Long-term maintenance needs.
• Engineering analysis needed:o Bearing resistanceo Settlemento Global Stabilityo Internal Stability
• Engineering Properties needed for the analyses.• Number of tests or samples needed to estimate engineering properties
Exploration and testing requirements for Bridge abutments and retaining structures are contained in Section 400.00 of this manual. For all retaining walls and reinforced slopes greater than 10 ft. in exposed height, field exploration shall be completed in accordance with Manual, Section 415.00.

Materials Retaining Structures and Reinforced Slopes 670.00
2015
670.3 Walls and Slopes Requiring Additional Exploration. Soil nail wall, anchored walls and walls with steep back slopes and toe slopes will require additional exploration. Anchored walls include walls with tiebacks or deadman anchors.
670.3.1 Soil Nail Walls. Additional borings should be located to explore the soil nail zone behind the wall approximately 1.0 to 1.5 times the height of the wall. Borings should be spaced no more than 500 ft. apart in uniform dense soils and 100 to 200 ft. apart in most soil conditions. In highly variable or potentially unstable areas, the borings should be more closely spaced. Boring depth should be sufficient to explore the full depth of the soil nail zone and enough to address overall stability.
At least one test pit should be excavated to evaluate the stand-up time for the soils to be exposed at the face of the wall during construction. The test pit should be as close to the wall location as possible but outside the nail pattern. Observations of the stability of the test pit walls should be made routinely for at least 24 hours. In variable soil conditions, a test pit should be excavated in each soil type. The test pits should extend to a depth at least twice the nail spacing and the length should be at least 1-1/2 times the excavation depth to minimize soil arching effects.

Materials Retaining Structures and Reinforced Slopes 670.00
2015
670.3.2 Walls With Ground Anchors. Tied-back walls with ground anchors or deadman anchors should have additional borings drilled to explore the soil conditions within the anchor bond zone and at the deadman locations. The typical spacing of borings is 100 to 200 feet. In dense uniform soils, the spacing may be increased to 500 feet and in highly variable soils the spacing should be less than 100 ft. The depth of the borings should be sufficient to explore the full thickness of the soil in the anchor zone and address overall stability.
670.3.3 Walls With Steep Back and Toe Slopes. To define overall stability and bearing issues, at least one additional boring should be located in the back slope and toe slope areas where a wall or reinforced slope has a back slope and or toe slope steeper than 2H:1V and a slope length of at least 10 ft.
670.4 Field and Laboratory Testing for Retaining Walls and Reinforced Slopes. Guidelines for sampling and field testing are contained in Section 450 of this Manual. In soft soils, CPT or Vane Shear testing may be required. Laboratory testing for walls and reinforced slopes will typically include classification tests (Grain-size analysis, Atterberg Limits), moisture content, density, shear strength and consolidation. Additional tests may include Loss on Ignition, pH, Resistivity. Laboratory Tests methods are contained in Laboratory Operations manual.
670.5 Groundwater. The presence or absence of groundwater significantly affects the design and constructability of retaining structures. Characterization of the groundwater conditions at a wall site is a primary goal in the investigation. Piezometers or observation wells are usually necessary to investigate the groundwater conditions. Groundwater tests shall be conducted in accordance with Section 450.03.01 of this manual. At least one measurement point should be established at each wall or reinforced slope location. If groundwater can significantly affect the performance of the wall, additional measurement points should be installed.
670.6 General Design Requirements. The AASHTO LRFD Bridge Design Specifications shall be used for all abutments and retaining walls covered in the latest version of the specifications. Walls shall be designed to address all limit states (strength, service and extreme event). Gabion walls, soil nail walls, and reinforced slopes are not specifically covered in the AASHTO specifications and shall be designed in accordance with this manual, although gabion walls can be designed as semi-gravity walls using AASHTO. Allowable stress procedures in this manual or incorporated by reference shall be used in the design of wall types and reinforced slopes for which LRFD procedures are not available. Design will address all applicable limit states.
670.6.1 Special Requirements. All walls shall meet the requirements of the ITD Design Manual for layout and geometry. All walls shall be constructed in accordance with the ITD Standard Specifications, Supplemental and Special Provisions and Standard Drawings.

Materials Retaining Structures and Reinforced Slopes 670.00
2015
670.6.2 Tiered Walls. Special design is required for walls that retain other walls or have walls as surcharges, to account for the surcharge loads from the upper wall. Proprietary wall systems used as the lower walls, must also be designed for this surcharge. The use of proprietary wall systems on ITD projects is outlined in Section 675.00 of this manual.
670.6.3 Back-to-Back Walls. The face to face dimension shall be at least 1.1 times the average wall height for back-to-back MSE walls. Back-to-back MSE walls with a width to height ratio of less than 1.1 shall not be used unless approved by the Geotechnical Engineer and the Bridge Engineer. The soil reinforcement for back-to-back MSE walls may be connected to both faces, continuous from one wall to the other provided the reinforcement is designed for double the design loading. Reinforcement may overlap provided the reinforcement from one wall does not touch that from the other wall. Preapproved proprietary wall systems may be used for back-to-back MSE walls provided they meet the height/width ratio and overlap requirements specified herein.
670.6.4 Walls on Slopes. Walls on slopes shall have a four-foot wide nearly horizontal bench at the wall face to provide wall overall stability and access for maintenance. Bearing resistance and overall stability of walls, including proprietary MSE walls, shall meet the requirements of the AASHTO LRFD Bridge Design Specifications.
670.6.5 MSE Wall Supported Abutments. MSE walls can be used to directly support spread footing abutments. However this application must be carefully evaluated. In general the span should be about 100 ft. or less and the wall should be not more than 25 ft. in height and the abutment spread footing service loads should not exceed 2.0 tsf. The front edge of the abutment footing shall be at least 2 feet from the back of the MSE facing units. To provide access for bridge inspection, there shall be at least 5 feet vertical clearance between the MSE facing units and the bottom of the superstructure. Also, there shall be at least 5 feet horizontal clearance between the back of the MSE facing units and the face of the abutment wall. These MSE wall criteria are also applicable to proprietary wall systems.
670.6.6 Minimum Embedment. All walls and abutments shall meet the minimum embedment criteria in the AASHTO LRFD Bridge Design Specifications. The final embedment depth shall be based on frost protection and geotechnical bearing and stability requirements provided in the AASHTO LRFD Bridge Design Specifications, as determined by the geotechnical designer. Walls that have a sloping ground line at the wall face may need to have a stepped foundation. Sloped foundations (not stepped) are not recommended on soil unless approved by the Geotechnical Engineer and Bridge Design Engineer, and then may require anchoring. Sloping foundations on competent rock shall be anchored in accordance with Section 10 of the AASHTO LRFD Bridge Design Specifications. Stepped foundations shall be stepped at 1.5H:1V or flatter as determined by a line through the corners of the steps. MSE wall units are typically rectangular in shape. Therefore, stepped leveling pads are preferred. These embedment requirements are also applicable to proprietary wall systems designed by allowable stress methods.

Materials Retaining Structures and Reinforced Slopes 670.00
2015
670.6.7 Serviceability Requirements. Walls shall be designed to structurally withstand the total and differential settlements estimated at the site, as prescribed in the AASHTO LRFD Bridge Design Specifications. In addition, the criteria shown in Table 660.05.01 shall be used to establish acceptable settlement criteria for reinforced concrete walls including abutments), non gravity cantilever walls, anchored walls and MSE walls with full height pre-cast concrete panels. For MSE walls with block, segmented or flexible facings and reinforced slopes, the criteria in Tables 670.06.1 and 670.06.2 shall be used. More stringent tolerances may be necessary to meet aesthetic requirements.
Table 670.06.1: Settlement Criteria for MSE Walls with Modular Block Facings and Prefabricated Modular Walls
Total Settlement Differential Settlement
Over 100 Ft. Action
ΔH ≤ 2 in. ΔH100 ≤ 1.5 in. Design and Construct 2 in. < ΔH ≤ 4 in. 1.5 in. < ΔH100 ≤ 3 in. Ensure structure can tolerate settlement
ΔH > 4 in. ΔH100 > 3 in. Obtain special approval
Table 670.06.2: Settlement Criteria for MSE Walls with Flexible Facings, Gabions and Reinforced Slopes
Total Settlement Differential Settlement
Over 50 Ft. Action
ΔH ≤ 4 in. ΔH50 ≤ 3 in. Design and Construct 4 in. < ΔH ≤ 12 in. 3 in. < ΔH50 ≤ 9 in. Ensure structure can tolerate settlement
ΔH > 12 in. ΔH50 > 9 in. Obtain special approval
For MSE walls with precast panel facings up to 75 sq. ft. in area, differential settlement limiting criteria shall be as provided in the most current AASHTO LRFD Bridge Design Specifications.

Materials Retaining Structures and Reinforced Slopes 670.00
2015
670.6.8 Earth Pressures. The geotechnical designer shall develop active, passive and at-rest earth pressure diagrams, as applicable, for all walls in accordance with the AASHTO LRFD Bridge Design Specifications. Earth pressures may be based on either Coulomb or Rankine theories. For walls that are free to translate or rotate, i.e. flexible walls, active earth pressures shall be used for design. Standard concrete walls, MSE walls, soil nail walls, soldier pile walls and anchored walls are generally considered to be flexible walls. Flexible walls are those where wall faces are able to translate a distance of at least 0.1% of the wall height. Non-yielding walls, such as integral abutments, wall corners, cut and cover tunnel and box culvert walls and walls that are cross-braced to another wall or structure, shall be designed for at-rest earth pressures. Passive earth pressures may act on the face of footings and the embedded portions of non- gravity cantilever walls and anchored walls. Passive earth pressure will also act on the face of deadman anchors. Considerably more movement is required to develop passive pressures than to develop active pressures. See Table 670.06.3 for a relationship between wall movement and earth pressure.
Table 670.06.3: Relationship Between Wall Movement and Development of Active and Passive Lateral Earth Pressures (AASHTO LRFD Bridge Design Specifications)
Type of Backfill Ratio of Top of Wall Movement / Wall Height Active Passive
Dense Sand 0.001 0.01
Medium Dense Sand 0.002 0.02
Loose Sand 0.004 0.04
Compacted Silt 0.002 0.02
Compacted Lean Clay 0.01 0.05
Compacted Fat Clay 0.01 0.05
If external bracing is used, active earth pressures may be used for design. The earth pressure acting on walls used to stabilize landslides shall be estimated from the limit equilibrium stability analysis of the slide and wall. The earth pressure shall be that necessary to stabilize the slope, and it may exceed passive pressure.

Materials Retaining Structures and Reinforced Slopes 670.00
2015
670.6.9 Surcharge Loads. Section 3 of the most current AASHTO LRFD Bridge Design Specifications shall be used for surcharge loads acting on all walls and abutments. Walls with a back fill surface slope of 4H:1V or flatter shall be designed for a temporary live load surcharge of 250 psf on the ground surface immediately behind the wall to account for construction equipment loads.
670.6.10 Seismic Earth Pressures. The Mononobe-Okabe method as described in the AASHTO 2008 LRFD Bridge Design Specifications, Section 11 and Appendix A11.1.1.1 shall be used to estimate seismic earth pressures for all walls and abutments. The Mononobe-Okabe approach assumes that the backfill is cohesionless, drained and not susceptible to liquefaction.
A reduced horizontal acceleration of approximately one-half peak ground acceleration may be used on walls and abutments that are free to translate or move during an earthquake. The reduced horizontal pressure in the Mononobe-Okabe method may be specifically calculated as in the AASHTO LRFD Bridge Design Specifications. Vertical acceleration should be zero.
A horizontal acceleration of 1.5 times peak ground acceleration should be used for all walls and abutments that are not free to translate during earthquake. Here also, vertical acceleration should be zero.
In the Mononobe-Okabe seismic earth pressure analysis, the total static plus seismic earth pressure is calculated as one force and then separated into the static and seismic components. The seismic “component” of the Mononobe-Okabe earth pressure may be separated from the static earth pressure acting on a wall as shown in Section 11 in the most current AASHTO LRFD Bridge Design Specifications. The seismic component may be calculated by subtracting the active earth pressure from the total Mononobe-Okabe earth pressure for walls that are free to move, and by subtracting the at-rest earth pressure from the Mononobe-Okabe earth pressure for walls that are not free to move. To complete the seismic design of the wall the active or at- rest earth pressure must be added to the seismic component to obtain the total earth pressure acting on the wall in the extreme event limit state.
The resultant force of the Mononobe-Okabe earth pressure distribution should be applied 0.6H from the bottom of the pressure distribution. If the seismic earth pressure force is calculated and distributed as a single force as specified in Appendix A11 of the AASHTO LRFD Bridge Design Specifications, the combined earth pressure resultant force shall be applied at 0.5H from the bottom of the pressure distribution. This pressure distribution includes both static and seismic components of lateral earth pressure.
Except for cantilever walls, and anchored or braced walls, the pressure distribution should be applied from the bottom of the wall to the top of the wall. For the cantilever and anchored walls, the distribution extends from the top of the wall to the ground line in front of the wall.
For most gravity walls, the Mononobe-Okabe assumption of a single layer, drained, cohesionless backfill is applicable. For non-gravity cantilever or anchored walls, these assumptions may not

Materials Retaining Structures and Reinforced Slopes 670.00
2015
be applicable. In such cases, a weighted average of the soil properties, based on the thickness of each layer, should be used to calculate the lateral pressure. Only the soil above the dredge line or finished grade should be included in the weighted average. Any water remaining in the backfill should be included in the weighted average, either as additional soil mass or as a hydrostatic head. The residual drained friction angle should be used to determine the seismic lateral earth pressure for cohesive backfill.
The slope of the active failure plane flattens as the seismic acceleration increases, requiring longer anchors for anchored walls to extend behind the failure plane. The methodology in FHWA Geotechnical Engineering Circular No. 4, FHWA-IF-99-015 (Sabatini et al., 1999) should be used to locate the active failure plane for anchored walls.
The seismic design criteria provided in this section are applicable to proprietary wall systems designed using allowable stress methodology.
670.6.11 Liquefaction. Liquefaction and lateral spreading may occur under extreme event loading. The potential for liquefaction and lateral spreading shall be assessed and identified as geologic hazards for the site if applicable. Design to assess and to mitigate these hazards shall be conducted in accordance with the provisions in Section 630.00 of this manual.
670.6.12 Overall Stability. All retraining walls and reinforced slopes shall have a minimum safety factor of 1.3. All abutments and retaining walls and slopes considered critical shall have a safety factor of 1.5. Critical walls and slopes are those that support important structures like bridges, buildings and other walls. Walls and slopes whose failure would result in a life threatening safety hazard to the public or whose failure and reconstruction cost would be prohibitive would also be considered critical.
Stability shall be assessed using limit equilibrium methods in accordance with Section 640.00 of this manual.
670.6.13 Wall Drainage. Drainage should be provided for all walls. If wall drainage cannot be provided, the hydrostatic pressure shall be included in the design of the wall. In general, the provisions of 3.11.1, 11.6.6 and 11.8.8 of the AASHTO LRFD Bridge Design Specifications will apply. See also Sections 501.03 d, 618 and 703 of the ITD Standard Specifications. Specific drainage provisions are as follows: Gabion Walls are generally considered to be permeable and
do not require wall drainage systems. A drainage geotextile should be placed against the native soil or backfill to minimize erosion and piping.
• Soil nail walls shall use composite drainage material centered between each column ofnails. The drainage material shall be connected to weep holes or shall be wrappedaround an underdrain.
• Cantilever and anchored wall systems which use lagging shall have composite drainagematerial attached to the lagging prior to casting the permanent facing. If no facing will

Materials Retaining Structures and Reinforced Slopes 670.00
2015
be placed, or if precast panels are used similar to Reinforced Earth or VSL walls, composite panels are not required provided water can freely pass through the lagging.
670.6.14 Utilities. MSE, soil nail and anchored walls commonly have conflicts with utilities located behind the wall, and should not be used when utilities are or may be located in the reinforced soil zone, unless there is no other option. Utilities that are placed in the reinforced soil zone and are encapsulated by the reinforcement may not be accessible for replacement or repair. Utility agreements should specifically address future access, such as sleeves, if wall reinforcing will restrict future access.
670.6.15 Guardrail and Barriers. Guardrail and barriers shall meet the requirements in the ITD Standard Drawings, appropriate portions of the Design Manual, Bridge Design Manual, the ITD Standard Specifications, and the AASHTO LRFD Bridge Design Specifications. Guardrail shall not be placed closer than 3 ft. from the back of the wall facing elements where guardrails will be placed through an MSE wall or other reinforcement zone. If guardrail posts must be installed through the soil reinforcement, they shall be installed in a manner that prevents ripping and distortion of the reinforcement. The soil reinforcement shall be designed to account for the reduced cross section due to the guard rail post holes.
670.7 Specific Design Requirements.
670.7.1 Abutments and Conventional Retaining Walls. Abutment foundations shall be designed in accordance with Section 660.00 of this manual. Abutments, wing walls and curtain walls shall be designed in accordance with the most current AASHTO LRFD Bridge Design Specifications. Abutments that are backfilled prior to constructing the superstructure shall be designed using active earth pressure. Active earth pressure can also be used for abutments that are backfilled after construction of the superstructure, if the abutment can move sufficiently to develop active pressure. At-rest pressures shall be used for restrained abutments. “U” shaped abutments or those with curtain/wing walls, should be designed to resist at-rest pressures in the corners, as the walls are restrained at the corners.
The internal stability design and external stability design, overall stability, bearing resistance and settlement for abutments and conventional retaining walls shall be in accordance with the most current AASHTO LRFD Bridge Design Specifications.

Materials Retaining Structures and Reinforced Slopes 670.00
2015
670.7.2 Non-gravity Cantilever and Anchored Walls. Permanent soldier piles for soldier pile and anchored walls are often installed in drilled holes to maintain accurate alignment. Impact or vibratory methods may be used to install soldier piles, but drilled holes are preferred. Geotechnical design requirements for non-gravity and anchored walls are contained in the AASHTO LRFD Bridge Design Specifications (latest version).
670.7.2.1 Non-Gravity Ccantilever Walls. Non-gravity cantilever walls are generally not more than 20 feet in height in competent, compact soils. The exposed height is usually controlled by the acceptability of deflection at the top of the wall. Using a larger section modulus pile or secant/tangent piles and shorter pile spacing can increase the allowable exposed height. If even a single row of dead man anchors is used to support a non-gravity cantilever wall, it is considered an anchored wall.
Drilled holes for soldier piles are typically backfilled with lean concrete, flowable backfill or grout in dry holes and tremied concrete if groundwater is present. The design assumption is that the full width of the drilled hole governs the development of passive resistance, as long as the backfill develops adequate strength. The stability of the wall depends on the development of passive resistance available in front of the wall.
Where shearing resistance is needed to help with overall stability, such as in a deep seated landslide, full strength concrete should be used to backfill soldier pile holes from bottom to cut line.
670.7.2.2 Anchored/Braced Walls. Anchored/braced walls generally consist of vertical structural elements such as soldier piles or drilled shafts and lateral anchorage elements placed through or beside the vertical elements. Design of these walls shall be in accordance with the most current AASHTO LRFD Bridge Design Specifications.
In general, the drilled hole for soldier piles for a anchored/braced wall should be filled with a relatively lean concrete, flowable or controlled density fill. The passive resistance in front of the anchored/braced wall is not as critical to overall stability as it is in non-gravity cantilevered walls. Although not necessary from a strength standpoint, it may be expedient to use full strength concrete to backfill soldier pile walls in wet areas. If shearing strength is needed to resist large kick out loads on the soldier piles or the anchors are steeply dipping, which imparts a vertical load on the piles, full strength concrete backfill should be placed in the soldier pile holes from the bottom to the cut line.

Materials Retaining Structures and Reinforced Slopes 670.00
2015
670.7.2.3 Permanent Ground Anchors. Permanent Ground Anchors are those which will provide long term support to an anchored wall. Anchors derive their resistance to pull out in a zone of the material behind the wall, beyond the “active” zone. The active zone consists of the portion of the soil behind the wall that is in the active wedge or is unstable. Where the anchors are installed through landslide material, they should extend beyond the entire unstable zone plus at least 5 ft. The geotechnical designer shall define the active zone for permanent ground anchors in accordance with AASHTO LRFD Bridge Design Specifications.
The drill hole in the active zone should be backfilled with non-structural filler. Grout may be used providing bond breakers are installed on the bars or strands, the un-bonded length is increased by at least 8 ft. and the grout in the active zone is not placed by pressure grouting. The minimum unbonded length is 15 feet for strand and 10 feet for bar tendons.
The geotechnical designer shall determine the factored anchor pullout resistance that can reasonably be used in the structural design with the site soil conditions, and shall estimate the nominal anchor bond stress for the soil conditions and common anchor grouting methods. AASHTO LRFD Bridge Design Specifications and FHWA publications such as Sabatini et al, (1999) provide guidance on the acceptable bond stress values for various types of soil or rock. The geotechnical designer shall then apply a resistance factor to the nominal bond stress to determine a feasible factored pullout resistance. When estimating the feasible anchor resistance, a 5-inch diameter low pressure grouted anchor with a bonded length of 15 to 40 ft. can be assumed. FHWA research indicates that bond lengths greater than 40 ft. are not fully effective. Using anchor lengths greater than 40 ft. must be consulted with the Geotechnical Engineer in the Construction/Materials Section.
The factored anchor pullout resistance will be used to determine the number of anchors and will be the required anchor resistance in the contract documents. The anchors will typically be designed by the contractor. Compression anchors may be acceptable, but conventional grouted anchors are preferred by ITD. The contractor will typically design the anchor bond zone to provide the resistance specified, and will be responsible for determining the actual length of the bonded and un-bonded zone, hole diameter, drilling methods, and grouting methods used for the anchors.
All ground anchors shall be proof tested except for the minimum 5% that shall be subjected to performance tests. The AASHTO LRFD Bridge Design Specifications provides guidance and requirements for anchor stressing and testing. FHWA Geotechnical Engineering Circular No. 4, Ground Anchors and Anchored Systems, FHWA-IF-99-015 (Sabatini, et al. 1999) provides detailed recommendations for load levels and durations for testing ground anchors. Anchor tests include proof tests on every anchor, performance tests on about 5 %, extended creep tests, lift-off tests and pull-out tests.

Materials Retaining Structures and Reinforced Slopes 670.00
2015
Pullout tests are typically used if anticipated soil or rock conditions are significantly different than those assumed in developing the presumptive values, or if preliminary anchor design using the published bond stresses, indicate that the wall is marginally infeasible.
Anchor test loads for proof tests, performance tests and extended creep tests shall be increased in increments to a maximum of at least 1.33 times the design load for permanent anchors and 1.2 times the design load for temporary anchors.
Proof tests are the most common and shall be performed on the majority of the ground anchors for a project (essentially all anchors not subjected to more stringent tests) Performance tests shall be performed on at least the first two production anchors and on a minimum or 5 % of the remaining production anchors. Additional performance tests may be necessary where creep susceptible soils may be present and in variable ground conditions.
Extended creep tests shall be performed for anchors installed in cohesive soil (typically with a Plasticity Index of 20 or greater or Liquid Limit greater than 50). A minimum of two anchors shall be tested in these ground conditions. Where performance tests indicate significantly extended load holding time, additional extended creep tests shall be performed.
Proof testing involves a single load cycle and a load hold at the maximum test load. An unload cycle may be included to allow calculation of residual and elastic movements. Elastic movement results from elongation of the tendon and elastic movement of the ground anchor through the ground. Residual movement includes elongation of the anchor grout and movement of the entire anchor through the ground. Residual movement is the net non-recoverable movement that occurs upon application of a load and relaxation or the load. Elastic movement is the arithmetic difference between the total movement at the maximum load for the cycle and the movement remaining upon returning to the alignment load (recoverable movement). Typically the applied load is measured using the pressure gauge on the jack.
Lock-off loads of less than 100 % of Design Load will allow movement of the wall.
The AASHTO LRFD Bridge Design Specifications provides detailed information on loading increments and duration of loading.
Performance testing involves incremental loading and unloading of a production anchor. In addition to confirming anchor capacity, performance testing is used to establish load- deformation behavior and to confirm that the actual un-bonded length is equal or greater than that assumed in design.
See the AASHTO LRFD Bridge Design Specifications for information on loading increments and duration of loading. Sabatini, et al (1999) also provides detailed testing procedure.
Extended Creep Testing is a long duration procedure used to evaluate the creep deformation of anchors. Extended creep testing is required in cohesive soils (PI >20 or LL >50) and in soil/rock materials where performance or proof tests require extended load holds. A load cell shall be

Materials Retaining Structures and Reinforced Slopes 670.00
2015
used to measure the loads in the extended creep test to be sure that the load is held constant. The load is assumed to remain reasonably constant if the deviation from the desired test pressure does not exceed 50 psi.
Sabatini, et al (1999) and AASHTO LRFD Bridge Design Specifications provide detailed information on the test procedure.
Lock-off Loads are typically on the order of 80 to 100 % of the design anchor load for unfactored loads. The structural designer should specify the lock-off load in the contract plans and specifications.
The following requirements be placed in the contract where the contractor is responsible for the design and installation of anchors.
1. Factored design load shall not exceed 60% of the specified minimum tensile strength forthe anchor.
2. Lock-off loads shall not exceed 70% of the specified minimum tensile strength for theanchor.
3. Test loads shall not exceed 80% of the specified minimum tensile strength for theanchor.
4. All anchors shall be double corrosion protected (encapsulated). Epoxy coated or barestrands shall not be used unless the wall is temporary..
5. Ground anchor installation angle should be 15 to 30 degrees from horizontal, but maybe as steep as 45 degrees to install anchors in competent materials or below failureplanes.
670.07.02.04 Deadmen. Deadmen shall be located as shown in Figure 20 from NAVFAC DM- 7.2, Foundations and Earth Structures, May 1982. The geotechnical designer shall develop earth pressures and passive resistance for deadmen in accordance with AASHTO LRFD Bridge Design Specifications.
670.7.3 Mechanically Stabilized Earth (MSE) Walls. The maximum height of pre-approved wall systems including proprietary walls shall be as contained in the MSE wall special provision specification maintained by the Geotechnical Engineer in the Construction/Materials Section. Wall design (including proprietary walls) shall be in accordance with the AASHTO LRFD Bridge Design Specifications. ADAMA Engineering, under contract to FHWA, developed a computer program MSEW in 1998 for the Design of MSE walls utilizing either conventional or LRFD methods. This computer program is often used for designing MSE Walls.
For walls with a traffic barrier, design of the traffic barrier and distribution of the applied impact load to the wall top shall be as described in the AASHTO LRFD Bridge Design Specifications.
Proprietary wall acceptance procedures are presented in Section 675.00 of this manual.

Materials Retaining Structures and Reinforced Slopes 670.00
2015
670.7.4 Prefabricated Modular Walls. Modular block walls without reinforcement, gabion, bin and crib walls shall be considered as prefabricated modular walls.
Modular block walls without soil reinforcement often have heights (including embedment depth) no greater five times the depth of the block into the soil perpendicular to the face of the wall. These walls shall be stable for all modes of internal and external stability failure mechanisms.
Gabion walls shall be designed in accordance with Section 11.6 of the current AASHTO LRFD Bridge Design Specifications. Detailed descriptions of materials and construction requirements are contained in Section 512 of the Standard Specifications for Highway Construction. Gabion walls shall be stable for all modes of internal and external stability failure mechanisms.
670.7.5 Reinforced Slopes. Reinforced slopes do not have a height limit. Reinforced slopes with a face slope steeper than 1.25H:1V shall have a wrapped geogrid, geotextile or wire face to minimize erosion of the material between reinforcement layers. A turf or vegetated slope face may only be used where annual rainfall is adequate to support the vegetation. In drier areas, a wrapped face is required regardless of slope.
The primary reinforcing layers shall be spaced at vertical intervals of three feet or less. Primary reinforcement shall be steel, geogrid or geotextile. Primary reinforcement shall be designed in accordance with Elias et al. (2001) Mechanically Stabilized Earth Walls and Reinforced Slopes – Design and Construction Guidelines, FHWA-NHI-00-043. ADAMA Engineering also developed a computer program for the design of reinforced slopes, ReSSA, for the FHWA in 2001. The program is an interactive program to analyze both rotational and translational stability. Materials and construction requirements for geogrid slope reinforcement are contained in a Special Provision maintained by the Geotechnical Engineer in the Construction/Materials Section.
The durability and corrosion requirements specified for reinforcement and backfill for MSE walls in the AASHTO LRFD Bridge Design Specifications shall be used for reinforced slopes.
670.7.6 Soil Nail Walls. A soil nail wall is typically used to stabilize existing slope or in supporting vertical or near vertical excavations where top to bottom construction is more advantageous than other retaining wall systems. Soil types that are well suited for soil nail walls are stiff or hard fine grained soils, dense to very dense granular soils, weathered rocks with no weak planes, and glacial soils. Detailed design, material and construction requirements for Soil Nail Walls are contained in a Special Provision available in the Construction/Materials Section. Design may be by LRFD or allowable stress methods. The following manuals provide additional information for design and construction of Soil Nail Walls.
• Lazarte, et, al.,(2003) Geotechnical Circular No. 7, Soil Nail Walls, U.S. Department ofTransportation, Federal Highway Administration, FHWA-IF-03-017.

Materials Retaining Structures and Reinforced Slopes 670.00
2015
• Byrne, R.J, et, al., (1996) Demonstration Project 103, Manual for Design andConstruction Monitoring of Soil Nail Walls, Federal Highway Administration, FHWA-SA-96-069R.
• Singla, S., (1996) Demonstration Project 103, Design and Construction Monitoring of SoilNail Walls, Project Summary Report, Federal Highway Administration, FHWA-IF-99-026.
• Porterfield, J. A., et, al. (1994), Soil Nail Walls-Demonstration Project 103, Soil NailingField Inspector’s Manual, Federal Highway Administration, FHWA-SA-93-068.
The geotechnical designer shall design the wall at critical sections. Each critical wall section shall be evaluated during construction of each nail lift. The wall shall be analyzed for the case where excavation has occurred for that lift, but the nails have not been installed. For the allowable stress method, the minimum construction safety factor shall be 1.2 for noncritical walls and 1.35 for critical walls such as those underpinning abutments.
Permanent soil nails shall be installed in predrilled holes. Self- drilling nails that are installed concurrently with drilling may be used in temporary walls. Using of this type of nails for permanent walls must be approved by the Geotechnical Engineer and the Bridge Design Engineer.
The nail spacing should be not less than 3 feet vertically and 3 feet horizontally. In general nail spacing should be 6 feet or less in both directions. In dense, over-consolidated soils such as glacial deposits, nail spacing may be increased if approved by the Geotechnical Engineer.
Walls underpinning structures shall have double corrosion protected (encapsulated) nails within the zone of influence of the structure being supported. All other nails in permanent walls shall be epoxy coated.
Nail testing shall be in accordance with the ITD Standard Specifications and special provisions.

Materials Retaining Structures and Reinforced Slopes 670.00
2015
670.08 References.
AASHTO, 2012. Standard Specifications for Highway Bridges, American Association of State Highway and Transportation Officials, 17th Edition.
AASHTO, 2008. LRFD Bridge Design Specifications, , American Association of State Highway and Transportation Officials, 6th Edition.
Byrne, R. J., Cotton, D., Porterfield, J., Woschlag, C. and Ueblacker, G., 1996. Demonstration Project 103, Manual for Design and Construction Monitoring of Soil Nail Walls, Federal Highway Administration Report No. FHWA-SA-96-069R.
Singla, S., (1996) Demonstration Project 103, Design and Construction Monitoring of Soil Nail Walls, Project Summary Report, Federal Highway Administration, FHWA-IF-99-026
Cheney, R. and Chassie, R., 2000. Soils and Foundations Workshop Reference Manual, National Highway Institute Publication NHI-00-045. Federal Highway Administration.
Elias, V., Christopher, B. R. and Berg, R.R., 2001. Mechanically Stabilized Earth Walls and Reinforced Slopes – Design and Construction Guidelines, National Highway Institute Publication FHWA-NHI-00-043, Federal Highway Administration.
Lazarte, C.A., Elias, V., Espinoza, R.D. and Sabatini, P.J., 2003. Geotechnical Engineering Circular No. 7, Soil Nail Walls, Federal Highway Administration Report No. FHWA-IF-03-017.
NAFAC DM-7.2, Design Manual: Foundation and Earth Structures, Chapter 3, Naval Facilities Engineering Command.
Sabatini , P.J., Pass, D.G. and Bachus, R.C., 1999. Geotechnical Engineering Circular No. 4, Ground Anchors and Anchored Systems , Federal Highway Administration Manual No. FHWA-IF- 99-015.
Washington Department of Transportation, 2006. Geotechnical Design Manual.

Materials Review and Acceptance Procedures for Earth Retaining Systems 675.00
2015
SECTION 675.00 - REVIEW AND ACCEPTANCE PROCEDURES FOR EARTH- RETAINING SYSTEMS
The purpose of these reviews and acceptance procedures are to provide: (1) a formal review and acceptance procedure for an earth-retaining system, and (2) a review procedure for use of approved retaining systems and for plans submitted by contractors/suppliers on specific projects.
675.1 Background. Since 1982, bids on alternate earth-retaining systems have been required by the Federal Highway Administration (FHWA) on federal-aid projects. Until April 1987, FHWA provided technical assistance in reviewing the numerous proprietary earth-retaining systems available. This review responsibility now rests with the individual state transportation departments.
A formal review and acceptance procedure is necessary to minimize the potential for design and construction problems. Therefore, the Idaho Transportation Department (ITD) has developed these procedures to:
• Provide statewide uniformity.• Establish standard policies and procedures for technical review and acceptance of earth-
retaining systems.• Establish responsibility for the acceptance of new proprietary earth-retaining systems.• Establish standard procedures and responsibility for preparation of retaining system plans,
design review, and construction control.
Approval of any new earth-retaining system will require a rigorous engineering evaluation by ITD or a consultant selected by the supplier and approved by ITD. Appropriate alternative retaining systems will be evaluated base on project-specific constraints and criteria.
675.2 General Requirements. Information from the FHWA regarding the acceptability of earth- retaining systems should be used as reference material only.
All proprietary retaining systems, bid as alternates, must have been previously approved by ITD as outlined in Section 675.03.
Prefabricated or Mechanically Stabilized Earth (MSE) retaining systems may be bid as alternates in competition with conventional reinforced concrete walls where conventional walls are competitive. However, alternatives to conventional walls are not required for all projects.
A proprietary retaining system bid without alternates must be considered experimental, unless it can be established that no other system is cost effective or technically feasible.
The same opportunity (degree of involvement) should be offered to all suppliers of proprietary earth-retaining systems which are approved and can accomplish the project objectives.

Materials Review and Acceptance Procedures for Earth Retaining Systems 675.00
2015
A conceptual plan approach to alternative earth-retaining systems is included in these procedures. Where conventional, nonproprietary retaining systems (cast-in-place concrete, metal bin walls, gabions, and tied-back walls) are viable alternatives, plans may be incorporated into the final contract documents.
675.3 Initial System Approval. The recent growth of many different types of earth-retaining systems requires consideration of different alternates prior to preparation of contract documents so that contractors are given an opportunity to bid using a feasible, cost-effective system. Any proprietary system must undergo ITD evaluation and be approved prior to inclusion as an alternate system during the design phase. The criteria for selection and placement on the approved list are as follows:
• A wall manufacturer or their representative requests in writing to be placed on this list.• ITD approves the system and the wall manufacturer, based on the following considerations:
o The wall manufacturer has a large enough operation to supply the necessary wallcomponents and documentation on time.
o The system has a sound theoretical and practical basis for the engineers to evaluateits claimed performance.
o Past experience in building and performance of the proposed system.
For this purpose, the wall manufacturer or their representative must submit a package that satisfactorily addresses the following items:
• System theory and the year it was proposed.• Where and how the theory was developed.• Laboratory and field experiments which support the theory:
o Practical applications with descriptions and photos.o Limitations and disadvantages of the system.o List of users including names, addresses, and telephone numbers.o Details of wall elements, analysis of structural elements, design calculations for both
static and dynamic (earthquake) loading, estimated life, corrosion design procedurefor soil reinforcement elements, procedures for field and laboratory evaluationincluding instrumentation, and special requirements, if any. The design procedureshall be in accordance with AASHTO LRFD Bridge Design Specifications, latestversion.
o Sample material and construction control specifications showing material type,quality, certifications, field testing, acceptance and rejection criteria, and placementprocedures.
o A well-documented field construction manual describing in detail, with illustrationswhere necessary, the step-by-step construction sequence. Copies of this manualshould also be provided to the contractor and the project engineer at the beginningof wall construction.
o Typical unit costs, supported by data from actual projects.

Materials Review and Acceptance Procedures for Earth Retaining Systems 675.00
2015
o List of government agencies that have approved or used the wall system, includingnames and phone numbers of persons that can be contacted for reference.
This submittal will be given a thorough review by the ITD Earth-Retaining Systems Review Committee or consultant with regard to the design/construction practicality and anticipated performance of the system. The committee will consist of representatives of the Construction/Materials Section (Geotechnical) and Bridge Design Section. ITD's position on the submittal (i.e., acceptance or rejection), with technical comments and limitations, will be provided by a written notification from QPL Engineer after review of the committee recommendations.
Up to1 year should be allowed for ITD review of initial supplier submittals. Review by ITD should be considered a courtesy, and will be performed as time allows. Delineation of responsibilities within ITD is outlined in Section 675.10. If ITD, for any reason, believes that they will not be able to complete the review of the submittal within a reasonable period of time, ITD will request the wall manufacturer or supplier to retain a consultant to perform the review and evaluation for their wall system. This consultant must have a minimum of 10 years of experience in designing earth retaining systems and be registered as a Professional Engineer in the state of Idaho. The supplier shall submit the qualifications of the consultant to ITD for approval. Once the consultant has completed the review and evaluation, the wall manufacturer shall send the report of the consultant’s review and recommendations to ITD for consideration. ITD will consider the recommendations in this report in making decision on the approval of the wall system.
Systems that have been successfully constructed on ITD projects will be accepted without a complete initial submittal, but the supplier or their representative will be asked to submit the above information to see if limitations regarding height or application are appropriate.
675.4 Wall Selection Procedure. All previously approved walls currently on the QPL, that are feasible, innovative, and cost-effective alternates must be seriously considered:
• Alternate systems during the design phase - Consultants and ITD should consider all feasiblealternates and provide at least two alternates whenever possible. It is not necessary toprovide for alternatives to conventional or tied-back systems if they are clearly the mostfeasible system.
• Experimental use - Any new system which has either previously not been used or is beingused in an untried application by ITD, and/or which meets the FHWA guidelines (singlealternate) as an experimental feature, will require performance documentation.Performance documentation shall include the data on wall performance for at least threeyears after completion of the wall.
• Alternates will not be permitted on earth-retaining systems that have been designated asexperimental features during a project's design phase.

Materials Review and Acceptance Procedures for Earth Retaining Systems 675.00
2015
675.5 Economic Considerations for Wall Selection. The decision to select a particular earth- retaining system for a specific project requires a determination of both technical feasibility and comparative economy. With respect to economy, the factors which should be considered are:
• Cut or fill earthwork situation.• Size of wall.• Average wall height.• Foundation conditions (i.e., would a deep or shallow foundation be appropriate for a cast-
in-place concrete retaining wall?).• Maintenance of traffic during construction.• Future maintenance costs.• Aesthetics.• Availability and cost of select backfill material.• Cost and availability of right-of-way needed.• Complicated horizontal and vertical alignment changes.• Need for temporary excavation support systems.
Evaluation and selection of proposed alternative retaining system(s) will be made by the districts or consultants with assistance from the Construction/Materials Section, and Bridge Sections, as appropriate. Design criteria for the proposed system(s) will be included in the materials phase reports. Materials investigation results may alter the feasibility of initially proposed systems. Additional or different systems and design criteria may be proposed in the phase reports.
675.6 Conceptual Plan Preparation. For the majority of projects containing proprietary earth- retaining structure alternates, ITD will use a conceptual plan approach, i.e., a fully detailed set of retaining wall plans will not be contained in the contract documents. However, when proprietary systems are allowed as alternates to a conventional reinforced concrete wall or other nonproprietary retaining structure, the detailed plans for the conventional wall may be included in the contract documents.
The conceptual plan, prepared by ITD or consultant in the bidding documents, will contain the following project-specific information:
• Geometrico Beginning and end of wall stations.o Elevation on top of wall at beginning and end of wall and all profile break points and
roadway profile data at wall line.o Original and proposed profiles in front of and behind the retaining wall.o Cross sections at the retaining wall location at 50 to 100 foot intervals.o Horizontal wall alignment.o Details of wall appurtenances such as traffic barriers, coping, drainage outlets,
location and configurations of signs, and lighting including conduit locations.o Right-of-way limits.

Materials Review and Acceptance Procedures for Earth Retaining Systems 675.00
2015
o Construction sequence requirements, if applicable, including traffic control, access,and stage construction sequences.
o Elevation of highest permissible level for foundation construction. Location, depth,and extent of any unsuitable material to be removed and replaced.
o Quantities table showing estimated square feet of wall area and quantity ofappurtenances and traffic barriers.
o At abutments, elevation of bearing pads, location of bridge seats, skew angle, andall horizontal and vertical survey control data including clearances and details ofabutments.
o At stream locations, extreme high water, and normal water levels.
• Reports
o A copy of the Phase II Soils Report and Phase IV Foundation Investigation Report,which contain specific design criteria for the geotechnical parameters applicable tothe proposed project, should be made available the wall designer.
• Structural and Geotechnical Design Requirementso Design life of the structure (e.g., permanent mechanically stabilized earth walls are
commonly designed, based on corrosion, for minimum service lives of 75 years). Ananalysis for overall external slope stability is project-specific and will be performedby ITD or its consultant.
o Nominal and presumptive foundation bearing pressure, minimum wall footingembedment depth, and maximum tolerable total and differential settlements.
o Internal design requirements for MSE system products in accordance with the mostcurrent AASHTO LRFD Bridge Design Specifications.
o Magnitude, location, and direction of external loads due to bridges, overhead signsand lights, traffic surcharge, and rapid groundwater drawn down.
o Limits and requirements for drainage features beneath, behind, or through theretaining structure.
o Backfill requirements for both within and behind the retaining structure. (Bothmaterial and placement requirements should be specified, i.e., gradation, plasticityindex, electrochemical, soundness, maximum loose lift thickness, minimum density,and allowable moisture content.)
o Special facing panel and module finishes or colors.o Governing sections of the ITD Design Manual, Materials Manual, and Construction
Specifications and Special Provisions.
The preparation of the conceptual plan is a coordinated activity among the Construction/Materials Section, the Bridge Design Section where structures are involved, and the District. Geometric, geotechnical, and structural considerations must be complementary for the conceptual plan to convey the desired end product to the bidders.
Materials Review and Acceptance Procedures for Earth Retaining Systems 675.00
2015
675.7 Bidding Instructions. In order to give suppliers of proprietary walls sufficient time to prepare bids, the presence of these items in forthcoming projects should be included in the project description of the bid proposal. The wall types permitted at each location should be shown and basic information such as wall length, square footage, etc., described. This is especially important for proprietary walls because these designs must be prepared in sufficient depth to enable reliable pricing by the suppliers during the advertising period. The successful bidder will be required to indicate the type of preapproved proprietary wall he intends to construct on or before the date of the preconstruction conference. Prior to the beginning of wall construction, the selected wall supplier will be required to submit a detailed design and detailed plans for approval according to Subsection 105.02 of the Standard Specifications and the contract special provisions.
675.8 Requirements for Supplier-Prepared Design and Plans. The final design to be submitted subsequent to contract award shall include detailed design computations, limits of design responsibility, if any, and all details, dimensions, quantities, and cross sections necessary to construct the wall. The fully detailed plans shall be prepared to ITD standards and shall include, but not be limited to, the following items:
• A plan and elevation sheet or sheets of each wall, containing the following:o An elevation view of the wall which shall indicate the elevation at the top of the
wall, at all horizontal and vertical break points, and at least every 50 feet along thewall; elevations at the top of leveling pads and footings; the distance along the faceof the wall to all steps in the footings and leveling pads; the designation as to thetype of panel or module; the length, size, and number of backfill reinforcingelements and the distance along the face of the wall to where changes in length ofthe backfill reinforcing elements occur; and the location of the original and finalground line.
o A plan view of the wall which shall indicate the offset from the constructioncenterline to the face of the wall at all changes in horizontal alignment; the limit ofthe widest module, or reinforcement and the centerline of any drainage structure ordrainage pipe which is behind or passes under or through the wall.
o Any general notes required for design and construction of the wall.o All horizontal and vertical curve data affecting wall construction.o A listing of the summary of quantities provided on the elevation sheet of each wall
for all items, including incidental items.o Cross section showing limits of construction and, in fill sections, limits and extent of
select granular backfill material placed above original ground.o Limits and extent of reinforced soil volume.
All details, including reinforcing steel bending details. Bending details shall be in accordance with ITD standards.
All details for foundations and leveling pads, including details for steps in the footings or leveling pads, as well as allowable and actual maximum bearing pressures.

Materials Review and Acceptance Procedures for Earth Retaining Systems 675.00
2015
• All modules and facing elements shall be detailed. The details shall show all dimensionsnecessary to construct the element, all reinforcing steel in the element, and the location ofreinforcement element attachment devices embedded in the facing.
• All details for construction of the wall around drainage facilities, overhead sign footings, andabutment piles or shafts shall be clearly shown.
• All details for connections to traffic barriers, coping, parapets, noise walls, and attachedlighting shall be shown.
• MSE wall end treatment, consisting of burying the ends of the walls, or turning the wall endsinto the slope, or placing a riprap geotextile next to the wall and keying riprap into the slope,or other designs approved by the Engineer.
• The plans shall be prepared and signed by a professional engineer licensed in the state ofIdaho.
Five sets of design drawings and detailed design computations shall be submitted to the Resident Engineer. The computations shall include a detailed explanation of any symbols and computer programs used in design. The Resident Engineer shall retain three sets for district use.
The remaining design drawings and computations will be distributed as follows:
• One set to the Bridge Design Section
• One set to the Construction/Materials Section
All designs and construction details will be checked by the Construction/Materials Section and Bridge Design Sections against the preapproved design and procedures for that system. Design and construction details will be checked by all recipients for conformance with the conceptual design constraints and criteria. Results of the reviews and/or approvals will be forwarded to the Construction/Materials Section for transmittal to the District. Notification to the contractor will be made by the District.
675.9 Materials Approval. Prior to delivery of any material used in the retaining wall construction, the sources must be accepted in conformance with Section 106.01 of ITD Standard Specifications.
675.10 ITD Responsibility. The following sequence of tables outlines the organizational unit and necessary actions by that unit to select, coordinate, and review designs and monitor construction of earth-retaining structures.

Materials Review and Acceptance Procedures for Earth Retaining Systems 675.00
2015
675.10.1 Initial System Approval. See Table 675.10.01.1
Table 675.10.01.1: Initial System Approval.
Organization Unit* Responsibility and Action
Construction/Materials Section** (Geotechnical Engineer)
Reviews geotechnical and materials aspects of new earth-retaining system supplier submittal.
Acts as Chairman of Earth-Retaining System Evaluation Committee. Transmits committee recommendations to QPL Engineer.
Bridge Design Section**
Reviews structural aspects of new earth-retaining system supplier submittal and provides formal comments to the Committee Chairman.
QPL or Geotechnical Engineer
Reviews and approves committee action. Notify wall manufacturer of committee decision on wall approval
* Earth-retaining system evaluation committee composed of representatives of theConstruction/Materials Section, Bridge Design, the Geotechnical Engineer acts as chairman.
** Structural and geotechnical system reviews apply to all methods of retaining system selection, alternate bidding, and experimental.

Materials Review and Acceptance Procedures for Earth Retaining Systems 675.00
2015
675.10.2 Retaining System Selection. See Table 675.10.02.1
Table 675.10.02.1: Retaining System Selection.
Organization Unit Responsibility and Action
District Project Development
Determine need for a retaining structure or system at a specific location on a project.
Request subsurface investigation and retaining system selection recommendations from District Materials (or consultant).
Designers should advise District Materials (or consultant) of particular conditions, design constraints, environmental, or aesthetic requirements.
District Materials, Consultant
Perform subsurface investigation and prepare foundation Investigation report. Subsurface investigation may be a Phase IV structure foundation investigation (i.e., cast-in-place concrete walls and tied-back walls), but may be a special investigation addendum to or included in Phase II soil investigation. The report should include specific engineering design criteria for recommended retaining system(s) and alternates and supporting data for recommendations.
Transmit report along with investigation plat, if applicable, and/or boring logs to the Construction/Materials Section for review.
Construction/Materials Section Review and comment on the report and send it back to the District.
District, Bridge Design Section Consultant
Based on investigation report, cost estimates, and project constraints or aesthetic considerations, the designer selects retaining system alternates to be allowed.
If conventional reinforced concrete, steel bin, gabion, or tied-back walls are proposed, design and plans are prepared.
For proprietary systems, a conceptual design is prepared in accordance with Sections 675.04 through Section 675.07 of this procedure.
District, Bridge Design Section, Consultant
Prepare special provisions for contract documents, including "generic" specifications for supplier-designed retaining systems. Transmit special provisions to Construction/Materials Section Geotechnical Engineer.
Construction/Materials Section (Geotechnical Engineer)
Reviews special provisions. Transmits special provisions to District Materials and Bridge Design Section.
District Design & Materials, Bridge Design Section
Make final design review of retaining system design, plans or conceptual design, and special provisions.
Comments submitted to Construction/Materials Section.
Construction/Materials Section
Prepares final contract documents.
Makes PS&E review, advertises project, and publishes contract documents.

Materials Review and Acceptance Procedures for Earth Retaining Systems 675.00
2015
675.10.3 Post-Award Design and Plan Review. On projects bid on conceptual design, and where proprietary retaining systems are bid as alternates, the contractor shall designate the system to be constructed on or before the date of the preconstruction conference. Contractor submits eight sets of supplier-developed plans and design computations to the Resident Engineer.
Table 675.10.03.1: Post-Award Design and Plan Review
Organization Unit Responsibility and Action
Resident Engineer Transmits one set of supplier-prepared plans and design computations to District Materials, Bridge Design and Geotechnical Engineer. Retain two sets for review.
District Makes design review of supplier-prepared plans and design computations and transmits comments to the Construction/Materials Section.
Bridge Design Section
Reviews structural aspects of supplier-developed plans in accordance with Section 675.08, Requirements for Supplier- Prepared Design and Plans.
Comments are transmitted to the Construction/Materials Section.
FHWA and Consultant FHWA and consultants also transmit their comments to the Construction/Materials Section.
Construction/Materials Section
Reviews geotechnical considerations of supplier-prepared design and plans in accordance with Section 675.08, Requirements for Supplier-Prepared Design and Plans.
Transmits approval of supplier-prepared plans and computations to the district.
District
Notifies contractor and supplier of approval and/or comments and changes required.
The review of supplier-prepared plans is intended to be of the same scope as a final design review. If substantial changes, corrections, and/or revisions are needed, re-submittal of plans may be required.

Materials Review and Acceptance Procedures for Earth Retaining Systems 675.00
2015
675.10.4 Construction. See Table 675.10.04.1
Table 675.10.04.1: Construction.
Organization Unit Responsibility and Action
District, Bridge Design Section Construction/Materials Section
Provide technical assistance to project construction personnel prior to and during retaining wall construction (preconstruction problems and experimental evaluation of new or unusual systems).
Resident Engineer
Provides construction supervision and inspection.
Immediately notifies District Materials and Bridge and Construction/Materials Section of construction problems.
Supplier Provides technical assistance to Contractor and ITD during wall construction.

Materials Settlement Analysis 680.00
2015
SECTION 680.00 - SETTLEMENT ANALYSIS
Settlement of a structure or embankment occurs due to a change in volume of the underlying soil in response to load. Settlement is of two general types, immediate or elastic settlement and long term or consolidation settlement.
Immediate settlement occurs as fast as load is applied. In cohesionless soils, such as sands and gravels, immediate settlement occurs under dead and live load. Dead load settlement is typically complete by the time a structure or embankment is constructed. Post construction settlement is almost totally due to live load. In cohesive soils, such as clays, the immediate settlements are typically small. Immediate settlement in saturated cohesive soil is due to distortion under the load, without volume change. Estimating the amount of immediate settlement requires a measurement or estimate of the Modulus of Elasticity of the soil. This can be measured either in a consolidation test or undrained compression test. With immediate settlements, there is very little if any rebound upon unloading, except in very cohesive soils.
Long term or consolidation settlement occurs as water is dispelled from a cohesive soil. As the water is dispelled, the volume is compressed. The rate at which this occurs is a function of the permeability of the soil. The higher the clay content, the slower the water moves through the soil. As the water is dispelled the load is transferred to the soil particles. Upon unloading, there is typically a rebound as the soil reabsorbs water. The load to which a cohesive soil has been subjected in the past is the preconsolidation pressure. Reloading a soil below the preconsolidation pressure is essentially elastic. The amount of consolidation settlement is estimated based on consolidation tests. Consolidation takes two forms, primary consolidation and secondary compression. Primary consolidation is complete when the entire load is transferred to the soil skeleton. That is when the water in the soil pores is no longer supporting the load and the water pressure in the pores has dissipated. Secondary compression occurs as the soil structure breaks down. This can amount to a significant volume decrease over a very long time. Secondary compression is particularly severe in highly organic soils.
In highly plastic clays, particularly those containing the clay mineral montmorillinite, consolidation volume change of the saturated clay can be very high and rebound upon unloading can also be high due to the swelling from re-absorption of water into the clay mineral structure. Swell pressures can be very large, often larger than that due to the applied load from a structure or embankment.

Materials Settlement Analysis 680.00
680.01 Stress Analysis. Estimating settlement beneath a structure or embankment due either to immediate settlement or consolidation requires determination of the level of stress in the foundation materials prior to construction and the distribution of stress due to the new construction. The difference in these stress levels is the driving force causing settlement. Section 2, Chapter 5, Navfac DM 7.1 describes a range of profiles of preconstruction vertical stress and applied vertical stress. A complete discussion of stress distribution is presented in Navfac DM 7.1, Chapter 4. Both Boussinesq and Westergaard theories are presented. Boussinesq theory assumes a homogeneous, isotropic and semi-infinite soil mass. Actual soil deposits are seldom homogeneous or isotropic. The modulus of elasticity varies from layer to layer and soils are typically more rigid in the horizontal direction than in the vertical.
The Westergaard analysis assumes that the soil is reinforced by closely spaced horizontal layers which prevent horizontal displacement. The effect is a significantly more rapid dissipation of applied stress with depth. The Westergaard analysis is applicable to soil profiles with alternating layers of soft and stiff materials.
Stress distributions beneath spread footings for the Boussinesq and Westergaard theories are presented in Figure 660.10.2 and Figure 660.10.3 respectively.
When foundation soils consist of several layers of substantial thickness which have differing elastic properties, the distribution of stresses is considerably different from those obtained from Boussinesq theory. Influence values for circular loaded areas over a two layer foundation are shown in Figures 14 and 15, Chapter 4, Navfac DM-7.1. References are cited for rigid layer conditions and for multilayer systems.
Figure 17, Chapter 4, Navfac DM-7.1, presents influence values for both point and shaft resistance for a pile in a homogeneous, isotropic and semi-infinite elastic solid.
Backfill coefficients, embankment loads and load factors for three different loading conditions on rigid conduits are also presented in Chapter 4, Navfac DM-7.1.
680.02 Immediate Settlement. Total settlement consists of immediate and long term settlements. Immediate settlement of granular soils is essentially the total settlement. On unsaturated or over-consolidated cohesive soils, immediate settlement may be a substantial portion of the total. Immediate or elastic settlement of cohesive soil is estimated as:
Where: S = Immediate vertical settlement (feet) q = Applied uniform pressure (psf) B = Width of loaded area (feet) Iw = Influence Factor (Combined Shape and Rigidity factor) μ = Poisson’s Ratio Eu = Undrained elastic modulus (psf)
4/16
1 − 𝜇𝜇2𝑆𝑆 = 𝑞𝑞𝑞𝑞 � 𝐸𝐸𝑢𝑢
� 𝐼𝐼𝑤𝑤

Materials Settlement Analysis 680.00
2015
Representative values of Poisson’s Ratio are as shown in Table 680.02.1, and values of undrained Elastic Modulus are as shown in Table 680.02.3.
Table 680.02.1: Representative Values of Poisson’s Ratio (After Bowles, Table 2-4)
Type of Soil Poisson’s Ratio, μ
Clay (Saturated) 0.4 – 0.5
Clay (Unsaturated) 0.1 – 0.3
Sandy Clay 0.2 – 0.3
Silt 0.3 – 0.35
Sand (dense, coarse), void ratio 0.4 – 0.7
Fine grained, void ratio 0.4 – 0.7
0.15
0.25
Loess 0.1 – 0.3

Materials Settlement Analysis 680.00
Influence factors for calculating immediate settlement of foundations are as follows:
Table 680.02.2: Influence Factors for Immediate Settlement of Spread Footings (After Bowles, 1977, Table 5-4)
Shape
Flexible Footing Rigid Footing
Center Corner Average Iw Im**
Circle 1.00 0.64 (edge) 0.85 0.88* 6.0
Square 1.12 0.56 0.95 0.82 3.7
Rectangle
L/B = 0.2 2.29
0.5 3.33
1.5 1.36 0.68 1.15 1.06 4.12
2 1.53 0.77 1.30 1.20 4.38
5 2.10 1.05 1.83 1.70 4.82
10 2.54 1.27 2.25 2.10 4.93
100 4.01 2.00 3.69 3.40 5.06
*Others have used 0.79 (π/4) for the rigid footing influence factor for circular footings.
** Rotational influence factors by Lee (1962)
The influence factors for rotation of rigid footings proposed by Lee can be used in the following equation:
4/16
tan𝜃𝜃 = �𝑉𝑉𝑒𝑒𝑞𝑞𝐿𝐿2� �
1 − 𝜇𝜇2
𝐸𝐸𝑠𝑠� 𝐼𝐼𝑚𝑚

Materials Settlement Analysis 680.00
2015
Where: V = Vertical load on Foundation (kips)
e = eccentricity of loading (feet)
B = Footing width (feet)
L = Footing length (feet)
μ = Poisson’s Ratio
Es = Modulus of Elasticity of Soil (ksi)
tan θ = tangent of the angle of rotation from horizontal
The typical range of values for the static stress-strain modulus Es for selected soils is presented in
the following Table 680.02.03. Field values depend on stress history, water content, density, etc.

Materials Settlement Analysis 680.00
2015
Table 680.02.3 Representative Values of Elastic Modulus of Selected Soils (Modified from Bowles, 1977, Table 2-3)
Soil Type Es (ksi)
Soft Clay 0.2 – 0.6
Medium Clay 0.6 – 1.2
Hard Clay 1 – 3
Sandy Clay 4 – 6
Loess 2 – 8
Silt 0.3 – 3
Silty Sand 1 – 3
Loose Sand 1.5 – 3.5
Dense Sand 7 – 12
Loose Sand & Gravel 7 – 20
Dense Sand & Gravel 14 - 28
For cohesionless soils, immediate settlement is dependent not only on the unit load but also on the footing width, depth below ground surface and the modulus of vertical subgrade reaction. The modulus of elasticity of coarse grained or cohesionless soils increases linearly with depth. The modulus of subgrade reaction is a measure of the rate of that increase with depth. Figure 6, in Chapter 5 of Navfac DM-7.1 shows the relationship of immediate settlement with footing width and depth and the relationship of the Modulus of vertical Subgrade Reaction with relative density. The following Figure 680.02.1 can be used to modify immediate settlement estimates for depth of footing below ground surface.

Materials Settlement Analysis 680.00
Figure 680.02.1: Influence Factor For a Footing at Depth D. (After Bowles, 1977, Figure 5-8)
In Figure 680.02.1, use actual footing and depth dimensions to calculate D/B ratio. The settlement, corrected for depth of footing (Sf) is then:
Settlement of spread footings on cohesionless soil can also be estimated using the empirical Hough method as follows:
ΔHi = Elastic settlement of layer i, (ft.)
Hc = Thickness of layer i, (ft.)
C’ = Bearing capacity index from Figure 680.02.2
4/16
𝑆𝑆𝑓𝑓 = 𝑆𝑆(𝐹𝐹3)
𝑆𝑆 = �∆𝐻𝐻𝑖𝑖
Where:
∆𝐻𝐻𝑖𝑖 = �𝐻𝐻𝑐𝑐𝐶𝐶′� log �
(𝜎𝜎𝑜𝑜 + ∆𝜎𝜎𝑣𝑣)𝜎𝜎𝑜𝑜
�
(for each soil layer with the zone of stress influence of the footing)

Materials Settlement Analysis 680.00
2015
Figure 680.02.2: Bearing Capacity Index C’ Values for Granular Soils (After Hough 1959)

Materials Settlement Analysis 680.00
2015
680.3 Consolidation Settlement. Where excess pore water pressures are developed during load application and if preconsolidation stress or pressure can be reliably determined, total settlement can be predicted with reasonable accuracy. High quality undisturbed samples are needed for the best estimates. The consolidation test measures the rate of consolidation with time under a series of applied pressures. The time rate of consolidation depends on the permeability of the soil and on the length of the drainage path. The Consolidation Coefficient is a measure of the time for completion of primary consolidation. Consolidation tests should be completed to at least twice the preconsolidation pressure with at least three and preferably four points on the virgin consolidation curve. The coefficient of consolidation for the consolidation curve below preconsolidation pressure (i.e. in the recompression portion of the consolidation curve) can be ten times higher than that at stresses higher than preconsolidation pressure (i.e., on virgin curve, i.e. that portion of the curve never subjected to past loading).
Excavation for foundations can cause uplift and heave. Application of a structural load or embankment recompresses the uplifted soil and may extend consolidation into the virgin compression range. Volume changes from each individual pressure increment are plotted against the logarithm of pressure to form the Pressure-Void Ratio diagram. Settlement is computed from the change in void ratio corresponding to the change in stress from initial to final conditions. The Compression Index (CC ) is the slope of the virgin portion of the Pressure-Void Ratio diagram. Typical plots of the time rate of consolidation for a single stress level are shown in Figure 680.03.1(log of time) and Figure 680.03.2 (Square root of time). A typical Pressure-void ratio diagram (e – log P diagrams) is shown in Figure 680.03.3.
Figure 680.03.1: Consolidation versus Log of Time
soil Do = 182
Hav = 0.8448 for this increment of load
D50 = 144 cv = 0.197 (0.8448 / 2 )2 = 7.8 x 10⁻³ in2/min 4.5
D100 = 106
200
180
160
140
120
100
80
60 0.1 1.0 10
Time - Min. 100 1000
Dia
l Rea
ding
.001
in.
t 50 =
4.5
min
t 100=
35
min

Materials Settlement Analysis 680.00
2015
200
180
160
140
120
10
80
600 2.1 5 10 15
√ time - min
The time rate of consolidation is recorded to estimate the time required for consolidation to occur in the field. The Coefficient of Consolidation Cv is a function of the length of the drainage path, the time required for consolidation, and the time factor (T) for the degree of consolidation and type of drainage. For double drainage (drainage from top and bottom) and 50% consolidation, T is 0.197. For 90% consolidation, the accepted factor for double drainage is 0.848. To calculate the time for a percentage of consolidation to occur in the field, the same relationship shown on Figure 680.03.1 is used with the expected drainage path distance appropriate for the project and the Time Factor corresponding to the desired percent consolidation. Determining D0, D100, t0 and t100 is described in the consolidation test method.
Figure 680.03.2: Consolidation vs Square Root of Time
The Square Root of Time method to determine the time rate of consolidation makes use of the same relationship for Cv. The calculated time rate is often faster than the Log of Time method and may fit field conditions better; particularly in silts and other soils that consolidate relatively quickly. Cv is typically significantly higher in recompression than in virgin compression, except in badly disturbed samples where the stress history is destroyed.
D0 = 187
187-100 = 87 87 x 1.1= 96
D100 = 187-96 = 91
D50 t100 = 36 min
t50 = 4.4 min D90
D100
t50 t 100
Dia
l Rea
ding
- .0
01

Materials Settlement Analysis 680.00
2015
eo σo cr σpc
Rel. Undisturbed Sample Field Virgin
Consolidation Curve
cr cc
Laboratory Consolidation Test
Disturbed Sample
cv
0.42 eo0.42 eo
0.1 0.3 0.5 0.7 1.0 3.0 5.0 7.0 10 30 5 70 100Log Effective Pressure - tsf
Figure 680.03.3: Void Ratio – Log Pressure Diagram
The void ratio- log pressure diagram in Figure 680.03.3 shows the characteristics of an over- consolidated soil. Typical test data are shown for both high quality “undisturbed” specimens and disturbed specimens. Shelby or other thin-walled tube samplers generally recover higher quality samples than the standard ring sampler. The advantage in the ring sample is the ease of handling. In this figure, the pre-consolidation pressure is higher than the current overburden pressure, significantly reducing the amount of settlement under loads that produce effective stresses less than the pre-consolidation pressure. Determining the pre-consolidation pressure is described in the consolidation test procedure.
Even the highest quality tube samples will show some evidence of disturbance. Based on the illustration in Figure 3-12 of the U.S. Army C.O.E. Engineer Manual 1101-1-1904, Settlement Analysis, the virgin consolidation curve, applicable to the field conditions, can be developed using Schmertmann’s (1955) construction. The reconstructed field consolidation curve is shown on Figure 680.03.3. The field consolidation curve and the laboratory curve are presumed to coincide at 0.42 of the initial void ratio. The slope of the virgin consolidation curve over one log cycle is the Compression Index (CC). Compression from the initial void ratio is assumed to be negligible to the current overburden stress. From that point to the pre-consolidation pressure the compression diagram follows the slope of the recompression curve (Recompression Index – CR ). The recompression index is determined by unloading or rebounding the specimen from a point beyond the pre-consolidation pressure and reloading the specimen. The average slope of the rebound and reload line over one log cycle is the Recompression index. The straight line drawn from the point on the recompression curve corresponding to the pre-consolidation pressure to the intersection
Void
Rat
io (e
)
Coe
ffici
ent o
f Con
solid
atio
n (c
v)

Materials Settlement Analysis 680.00
with the test curve at 0.42 of the initial void ratio, is the field virgin consolidation curve. Settlement under loads that apply pressures beyond the pre-consolidation pressure follows the slope of the field settlement consolidation curve.
Estimates of consolidation settlement are made with the following relationship:
H = Thickness of compressible soil layer (ft.)
Δe = Change in void ratio
eo = Initial void ratio If the e-log p curve is available then eo and Δe can be selected from that curve and used in this equation.
For normally consolidated clay, the settlement in the virgin compression range is calculated as:
where: S = Settlement, change in height of compressible layer (ft)
H = Thickness of compressible layer (ft) CC = Compression Index e O = Initial void ratio in virgin compression PO = Effective vertical pressure at the initial void ratio at mid depth of the compressible
layer (psf) ΔP = Change in effective vertical pressure (psf)
Calculating the settlement in a thick compressible soil layer will be more accurate if the soil layer is divided into several sub-layers. The total settlement of the layer can then be calculated as:
Both Chapter 5, NAVFAC, DM-7.1, and USCOE Engineer Manual 1110-1-1904, have in-depth presentations on settlement beneath footings and embankments.
Table 3, Chapter 5, NAVFAC, DM 7.1 shows relationships for estimating the Compression Index, Cc (referred to as Coefficient of Consolidation in NAVFAC) for several different soils. These values can be useful in making preliminary settlement estimates, but should not be used in lieu of consolidation tests. As a rule, the amount of settlement is often less than calculated and the time required is frequently longer.
4/16
𝑆𝑆 = ���𝐻𝐻 × 𝐶𝐶𝑐𝑐1 + 𝑒𝑒0
� log �𝑃𝑃0 + ∆𝑃𝑃𝑃𝑃0
𝑛𝑛
𝑖𝑖=1
��
𝐻𝐻 × 𝐶𝐶𝑐𝑐𝑆𝑆 = ��1 + 𝑒𝑒0� log �
𝑃𝑃0 + ∆𝑃𝑃𝑃𝑃0
��
1 + 𝑒𝑒0Where: S = Settlement (ft.)
𝑆𝑆 = 𝐻𝐻 �∆𝑒𝑒
�

Materials Settlement Analysis 680.00
680.04 Secondary Compression. The example time / consolidation curves and the void ratio – log pressure curve contain some secondary compression. To isolate the primary and secondary consolidation characteristics, the primary void ratio – log pressure curve must plot the void ratios at t100. Void ratio changes beyond that point will be due to secondary compression. Plotting only the test data beyond t100 will produce a diagram with a slope over one log cycle of CS or the Secondary Compression Index. The secondary settlement would then be:
Where: SSEC = Settlement due to secondary compression (ft) CS = Secondary Compression index H = Thickness of compressible Layer (ft.) tSEC = Service life of the structure tP = Time of completion of primary consolidation
Note: Time of completion of primary consolidation and life of structure must be in the same time units.
Secondary compression can be a very large percentage of the total settlement and can occur over very long periods of time. In highly organic soils and peats, particularly, secondary compression can result in severe long term settlement.
680.05 References.
AASHTO LFRD Bridge Design Specifications, 6th Edition (2012
Bowles, J.E., 1977. Foundation Analysis and Design, McGraw-Hill.
Hough, B.K., 1959. “Compressibility as the Basis for Soil Bearing Value,” ASCE Proceedings, August 1959.
NAVFAC DM-7.1, 1982. Design Manual – Soil Mechanics, Naval Facilities Engineering Command.
Schmertmann, J.H., 1955. “The Undisturbed Consolidation Behavior of Clay,” ASCE Transactions, Vol. 120, American Society of Civil Engineers.
U.S. Army Corps of Engineers, 1990. Settlement Analysis, Engineer Manual 1110-1-1904, Department of the Army.
Washington Department of Transportation, 2006. Geotechnical Design Manual.
4/16
𝑆𝑆𝑆𝑆𝑆𝑆𝑆𝑆 = (𝐶𝐶𝑠𝑠𝐻𝐻) log �𝑡𝑡𝑆𝑆𝑆𝑆𝑆𝑆𝑡𝑡𝑃𝑃
�

Materials Sign and Signal Structures 685.00
2015
SECTION 685.00 - SIGN AND SIGNAL STRUCTURES
This section covers the geotechnical design of lightly loaded structures including sign bridges, cantilevered sign and signal structures and noise barriers. These structures, due to generally high lateral loading from wind and cantilevered loads, are typically supported on deep foundations or relatively large diameter, short shaft footings. The design of these structures, except where detailed in the Standard Drawings, is normally left to the Contractor. The designs of these structures should be in accordance with the latest version of the AASHTO Standard Specifications for Structural Supports for Highway Signs, Luminaires and Traffic Signals.
685.1 Geotechnical Investigation. Section 435.00 of this manual contains recommendations and requirements for subsurface investigations for Signal Poles, lighting and sign structures as well as miscellaneous small buildings.
685.2 Foundation Design. Details of foundations for light poles and signal poles with mast arms of less than 55 ft. are presented in ITD Standard Drawing I-7-C. Foundation requirements for electronic and signal cabinets are presented in ITD Standard Drawing I-7-A and I-7-B. Signal poles with mast arms of 55 ft. or more and all sign bridges require a Phase IV Foundation Investigation Repost, in accordance with Section 250.05.02 of this manual.
The foundation investigation report may be abbreviated, but it must contain all the necessary information for design. Due to the high torque and overturning loads on sign structures, information on rotational friction coefficient and passive resistance is needed for drilled shaft of pile foundations, and coefficient of subgrade reaction for mat foundations. The requirements for Phase IV recommendations are presented in Manual Section 250.05.02.01 and Section 250.05.02.02. Parameters necessary to design for lateral resistance include consistency (from SPT or CPT), unit weight, SPT (N-value), internal friction angle, initial lateral subgrade modulus and rotational frictional coefficient.
Foundation design parameters for sound walls should be similar to those required for sign bridges due to the high lateral wind load anticipated. Rotational friction data is not required for sound walls.