geotechnical and pavement geotechnical … use... · thorp prairie road evaluation and design...
TRANSCRIPT

GEOTECHNICAL REPORT Elliott Bridge No. 3166 Replacement
HWA Job No. 1996-143-21
Prepared for ABKJ, INC.
April 4, 2003
GEOTECHNICAL AND PAVEMENT ENGINEERING REPORT
Thorp Prairie Road Evaluation and Design Kittitas County, Washington HWA Project No. 2012-105-21
Prepared for PacifiClean Environmental LLC
February 1, 2013


TABLE OF CONTENTS 1.0 EXECUTIVE SUMMARY ..............................................................................................1 2.0 INTRODUCTION..........................................................................................................1
2.1 GENERAL.......................................................................................................1 2.2 PROJECT UNDERSTANDING............................................................................1
3.0 FIELD AND LABORATORY TESTING............................................................................2 3.1 FALLING WEIGHT DEFLECTOMETER TESTING ...............................................2 3.2 PAVEMENT CORE HOLES ...............................................................................3 3.3 LABORATORY TESTING .................................................................................3
4.0 SITE CONDITIONS ......................................................................................................4 4.1 SITE DESCRIPTION.........................................................................................4 4.2 GENERAL GEOLOGY ......................................................................................4 4.3 PAVEMENT STRUCTURAL LAYERS.................................................................5 4.4 FWD TESTING RESULTS................................................................................6
5.0 CONCLUSIONS AND RECOMMENDATIONS ..................................................................7 5.1 GENERAL.......................................................................................................7 5.2 DESIGN TRAFFIC............................................................................................7 5.3 OVERLAY DESIGN .........................................................................................9 5.4 NEW HOT MIX ASPHALT (HMA) PAVEMENT STRUCTURE ............................11
5.4.1 Pavement Design Considerations..................................................11 5.5 HOT- MIX ASPHALT (HMA) .........................................................................12
5.5.1 Binder Selection ............................................................................12 5.5.2 Placement of HMA........................................................................12
5.6 DRAINAGE.....................................................................................................13 5.7 EARTHWORK .................................................................................................13
5.7.1 Site Preparation .............................................................................13 5.7.2 Structural Fill and Compaction .....................................................13
6.0 LIMITATIONS .............................................................................................................14 REFERENCES .........................................................................................................16

Final Report.doc ii HWA GEOSCIENCES INC
LIST OF FIGURES (FOLLOWING TEXT)
Figure 1 Project Vicinity Map Figures 2A and 2B Site and Exploration Plans Figure 3 FWD Test Results
APPENDICES
Appendix A: Field Exploration
Figure A1 Legend of Terms and Symbols Used on Exploration Logs Figures A2 – A7 Logs of Cores Core-1 through Core-6
Appendix B: Laboratory Test Results
Figure B1 Particle-Size Analysis of Soils Figure B2 Percent of Material Passing #200 Sieve Figure B3 Liquid Limit, Plastic Limit and Plasticity Index of Soils
Appendix C: FWD Deflection Basins
Appendix D: Core Photographs

GEOTECHNICAL AND PAVEMENT ENGINEERING REPORT THORP PRAIRIE ROAD EVALUATION AND DESIGN
KITTITAS COUNTY, WASHINGTON
1.0 EXECUTIVE SUMMARY
HWA GeoSciences Inc (HWA) conducted a geotechnical and pavement engineering investigation along Thorp Prairie Road in Kittitas County, Washington. This objective of this investigation was to assess the existing pavement structure of the section of the road between the intersection with Elk Heights Road and the proposed location of the new Elk Heights Organics Processing Facility (EHOPF) at 8860 Thorp Prairie Road. HWA used Falling Weight Deflectometer and pavement coring exploration as part of its investigation. The results show that the existing pavement structure, which consists of approximately 2 inches of Bituminous Surface Treatment (BST) over approximately 2 inches of crushed aggregate base course, will not be able to accommodate the anticipated traffic loading generated by the new facility. Based on engineering analysis, the existing pavement requires a minimum of 1.5 inches of HMA overlay to support the projected additional traffic for a 20 year design life. We understand that currently PacifiClean Environmental is considering two separate scenarios. The first scenario assumes that the proposed facility will operate at 50% of maximum capacity for 5 years (initial phase) before starting operation at full capacity (build-up phase); and the second scenario assumes that the proposed facility will operate at 50% of maximum capacity for at least 20 years. Based on our analysis, the remaining life of the existing pavement under the increased loading is approximately 6 years and 7 years for the first and second scenarios, respectively.
2.0 INTRODUCTION
2.1 GENERAL
This report summarizes the results of a geotechnical and pavement engineering investigation undertaken by HWA GeoSciences Inc. (HWA) along Thorp Prairie Road, between the intersection with Elk Heights Road and the proposed location of the new Elk Heights Organics Processing Facility (EHOPF) at 8860 Thorp Prairie Road, in Kittitas County, Washington. Project location and general alignment are shown on the Project Vicinity Map, Figure 1. Project alignment and stationing are presented in Figures 2A and 2B.
2.2 PROJECT UNDERSTANDING
Based on conversations with PacifiClean Environmental, we understand that PacifiClean Environmental is proposing to build a compost facility to process organics collected mostly from western Washington and convert it into compost, to be used as fertilizer. The location of the

February 1, 2013 HWA Project No. 2012-105-21
Final Report.doc 2 HWA GEOSCIENCES INC
proposed facility is at 8860 Thorp Prairie Road, in Kittitas County, Washington. The new facility will be using Thorp Prairie Road as its main access route for incoming organics and outgoing compost. PacifiClean Environmental is interested in evaluating the capacity of the existing pavement structure, and to determine if it can handle the projected increase in truck traffic. Thorp Prairie Road is a collector that runs almost parallel to I-90 with one lane in each direction.
Authorization to proceed was provided by Mr. Larry Condon of PafiClean Environmental, in an email on October 19, 2012. Our work was in accordance with our proposal, dated October 4, 2012, and included field reconnaissance, Falling Weight Deflectometer (FWD) testing, pavement coring, engineering analyses, and preparation of the attached report summarizing the investigation results and our recommendations.
3.0 FIELD AND LABORATORY TESTING
3.1 FALLING WEIGHT DEFLECTOMETER TESTING
Falling Weight Deflectometer (FWD) testing was conducted on November 16, 2012, in both directions, at intervals of approximately 100 feet. The FWD testing was undertaken using a Dynatest Model 8081 Heavy Falling Weight Deflectometer. This FWD allows the pavement to be tested under a wide range of loading conditions (6,500 to 54,000 pounds) to simulate a variety of traffic loads. For this investigation, the FWD was programmed to apply controlled pulse loads of approximately 6,000, 9,000 and 12,000 pounds to the pavement surface. The corresponding pavement surface deflections were measured with velocity transducers located directly under the loaded area, and at 12, 24, 36, 48, 60 and 72 inches from the center of the loaded area. The measured deflections were normalized to a 9,000-pound load for comparison purposes. The load-deflection relationships were then used along with the measured thicknesses of each pavement layer to back-calculate the resilient modulus (Mr) of the subgrade soil.
FWD stationing commenced with Station 0+00 at the center of the intersection of Elk Height Road and extended to the proposed location of EHOPF (at 8860 Thorp Prairie Road) at Station 107+00.
Figure 3 presents the results of the FWD testing along Thorp Prairie Road. Plot a presents the normalized maximum deflections (deflections at center of loaded area) for each test location in both the northbound and southbound lanes. In general, maximum deflections of 0 to 15 mils are representative of good pavement response. Maximum deflections ranging from about 16 to 25 mils represent fair pavement response. Maximum deflections ranging from 26 mils to 45 mils represent fair to poor pavement response. Maximum deflections greater than about 45 mils are typical of poor pavement response. Plot b presents the resilient modulus of the soil below the

February 1, 2013 HWA Project No. 2012-105-21
Final Report.doc 3 HWA GEOSCIENCES INC
Bituminous Surface Treatment (BST) for each test location, as back-calculated by ELMOD computer software.
The deflection basins for each of the test locations, normalized to a 9,000-poud load, are presented in Appendix C. Deflection readings closest to the applied load reflect the strength of the near-surface layers, whereas, deflection readings further from the applied load reflect deeper soil conditions.
3.2 PAVEMENT CORE HOLES
Pavement layer thickness and shallow subgrade support conditions along the project alignments were investigated in six, 6-inch diameter pavement cores (designated Core-1 through Core-6). Shallow explorations using hand digging equipment were advanced through each pavement core. The coring and limited subsurface explorations were performed by a geologist from HWA on November 26, 2012, who also obtained disturbed samples of soils at selected depths in the explorations. Upon completion, all pavement cores were patched with EZ-Street cold asphalt concrete patch.
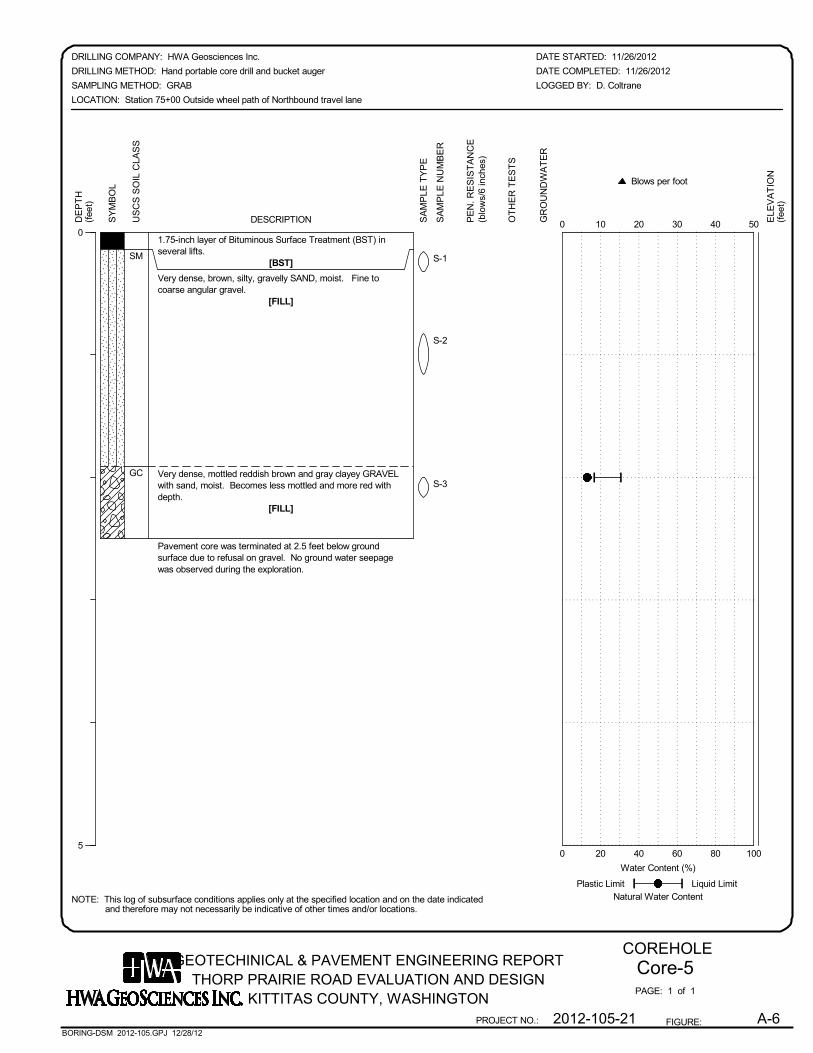
Appendix A contains summary logs of the explorations. Figure A-1 presents a legend of the terms and symbols used on the pavement core logs. Logs of the pavement cores are presented in Figures A-2 through A-7. The approximate pavement core locations are shown on the Site and Exploration Plans, Figures 2A and 2B, and approximate station locations are given on the core logs. Photographs of the cores, along with pertinent information, are presented in Appendix D of this report.
3.3 LABORATORY TESTING
Laboratory tests were conducted on selected soil samples obtained from the pavement core investigations to characterize relevant engineering properties. The laboratory testing program was performed in general accordance with appropriate ASTM Standards, as outlined below.
Moisture Content of Soil: The moisture content of selected soil samples (percent by dry mass) was determined in accordance with ASTM D 2216. The test results are shown at the sampled intervals on the appropriate summary pavement core logs in Appendix A.
Particle Size Analysis of Soils: Selected granular samples were tested to determine the particle size distribution of material in accordance with ASTM D 422. The results are summarized on the attached Particle-Size Analysis report (Figure B-1, in Appendix B), which also provides information regarding the classification of the samples and the moisture content at the time of testing.

February 1, 2013 HWA Project No. 2012-105-21
Final Report.doc 4 HWA GEOSCIENCES INC
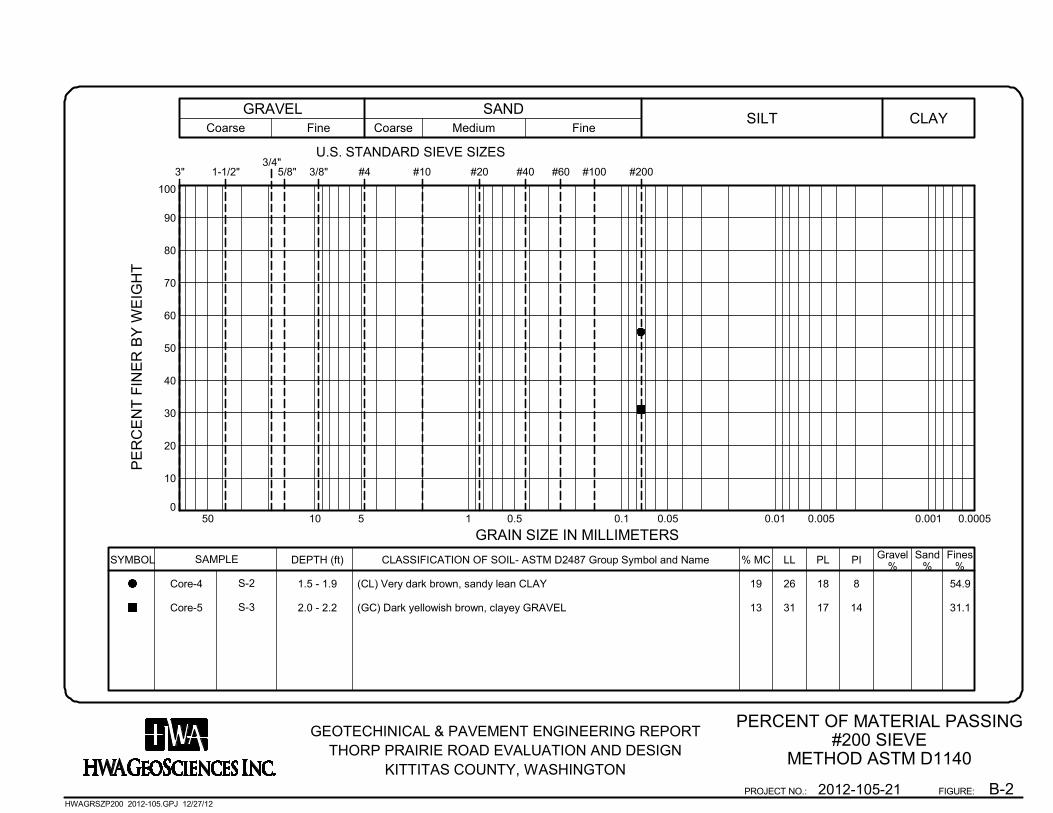
Amount of Material Finer Than the No. 200 Sieve: Selected samples were tested to determine the percent passing the No.200 sieve in general accordance with ASTM D1140. The results are presented in the attached Percent of Material Passing #200 Sieve Report, Figure B-2 in Appendix B.
Liquid Limit, Plastic Limit, and Plasticity Index of Soils (Atterberg Limits): Selected samples were tested using method ASTM D 4318, multi-point method. The results of the laboratory testing are presented in the attached Liquid Limit, Plastic Limit, and Plasticity Index of Soils report, Figure B-3 in Appendix B.
4.0 SITE CONDITIONS
4.1 SITE DESCRIPTION
Thorp Prairie Road is a north-south collector road located just south of Interstate I-90. The investigated segment of Thorp Prairie Road starts at the intersection with Elk Heights Road located at Exit 93 of I-90 and ends at the proposed location of the new EHOPF at 8860 Thorp Prairie Road. The approximate elevation at the intersection with Elk Heights Road is about 2,235 ft, then the roadway slopes down to approximately 2,175 ft at about 1,850 ft north of the intersection with Elk Heights Road, before climbing to an approximate elevation of 2,370 ft then slopes down to approximate elevation of 2,230 ft at the proposed location of EHOPF. The length of the studied segment of Thorp Prairie Road is approximately 2.03 miles. There are a few commercial and residential buildings located on this stretch of Thorp Prairie Road, which consists of one travel lane in each direction, and is surfaced with BST.
4.2 GENERAL GEOLOGY
Geologic information for the project area was obtained from the map titled Geologic Map of the Wenatchee 1:100,000 Quadrangle, Central Washington (Tabor, R.W. et. al., 1982). According to this map, the near-surface deposits in the project vicinity consist of early Pleistocene aged main stream deposits of the Yakima River. In the local area the deposits are terraced and generally consist of pebble to boulder gravel with interstitial silts and sands. Rock types are locally sourced and tend to consist of volcanic and dike rocks. Also mapped in the area are outcrops of the Yakima Basalt subgroup of the Columbia River Basalt group. In the project area deposits of the upper flows of normally magnetic polarity are mapped. These consist of columnar, basal and tabular basalts, with intermittent formations of pillow basalts and some areas of interstitial sand and gravel deposits. Locally sills and dikes will have intruded on the formation.

February 1, 2013 HWA Project No. 2012-105-21
Final Report.doc 5 HWA GEOSCIENCES INC
4.3 PAVEMENT STRUCTURAL LAYERS
The coring and FWD test results indicate that the subgrade soils typically consist of dense to very dense silty gravel with sand and will generally provide suitable support for the pavement, when an adequately thick Hot Mix Asphalt (HMA) and crushed gravel base course are provided.
Table 1 summarizes the results of all pavement core explorations. Appendix D presents photographs of the asphalt pavement cores. No ground water seepage was observed in any of the pavement cores, which extended to a maximum depth of 3.4 feet, at the time of exploration. Ground water seepage is not likely to be encountered in very shallow pavement explorations.
The BST wearing surface samples, obtained from the pavement cores along Thorp Prairie Road, had an approximate thickness of 2 inches and were generally in good to fair condition. Five cores were taken in the southbound lane and one pavement core (Core-5) was taken in the northbound lane. Crushed base course was encountered in pavement cores Core-1, Core-3, Core-4 and Core-6. The thickness of the crushed base layer was approximately 5 inches in Core-6, and it ranged from 1 inch to 1.5 in the other pavement cores. In the remaining pavement cores (Core-2 and Core-5), fill soils were encountered directly underneath the BST layer. The subgrade soils in all pavement cores were fill materials consisting of very dense silty gravel with sand or silty sand with gravel, and were likely placed as a subbase course during construction.
Table 1: Summary of Pavement Cores
Core Designation and Approximate Location
BST Thickness (inches)
Base Course Thickness (inches)
Fill Soil USCS Classification
Core-1 Sta 15+00, SB Lane 2 1.5 GM
Core-2 Sta 30+50 SB Lane 1.75 - GM
Core-3 Sta 45+00 SB Lane 2 1 GM
Core-4 Sta 60+50 SB Lane 1.75 1.25 GM
Core-5 Sta 75+00 NB Lane 1.75 - SM
Core-6 Sta 92+50 SB Lane 2 5 GC
SB = Southbound. NB = Northbound.

February 1, 2013 HWA Project No. 2012-105-21
Final Report.doc 6 HWA GEOSCIENCES INC
In Core-1 and Core-4, the explorations advanced through the silty gravel with sand layer and encountered fine grained layer of fill consisting of medium stiff silt or clay with sand and gravel. The thickness of the silty gravel with sand layer was approximately 15 inches in both pavement cores. More exploration results are presented in the pavement cores logs in Appendix A.
4.4 FWD TESTING RESULTS
The existing pavement surface is in good to fair condition and the major types of pavement distress observed are raveling and wear loss due to oxidization of the asphalt cement. Some rutting, longitudinal cracking and transverse or temperature cracking were also observed along both travel lanes.
Based on FWD results, bedrock or similarly very hard layers of soils are located within 3 feet of the existing roadway surface in few isolated areas along Thorp Prairie Road, and in particular between Sta 37+50 and Sta 45+50 in the southbound travel lane. The proximity of bedrock in these locations results in higher than normal back-calculated values of resilient modulus of subgrade soils. These outlier values have been omitted when calculating the average resilient modulus of subgrade soils.
As mentioned previously in this report, the FWD testing occurred on November 16, 2012 and coring and shallow subsurface explorations along Thorp Prairie Road occurred on November 26, 2012. The ground water conditions reported are for the specific date and locations indicated, and therefore may not necessarily be indicative of other times and/or locations. Seasonal variation in local ground water levels may affect the FWD measurements and thus the back-calculated resilient modulus results of subgrade soils.
The FWD test results reveal that the maximum deflections (normalized to a 9,000-pound load) along the northbound lane varied from 11.9 mils to 26.8 mils with an average of 20.8 mils and a standard deviation of 3.2. The average resilient modulus of the subgrade in the northbound lane is 18.3 ksi with a standard deviation of 4.7 ksi.
The maximum deflections (normalized to a 9,000-pound load) along the southbound lane varied from 9.6 mils to 26.8 mils with an average of 17.3 mils and a standard deviation of 4.0. The average resilient modulus of the subgrade in the southbound lane is 25.8 ksi with a standard deviation of 7.8 ksi.
These results indicate that the southbound travel lane typically has a stronger pavement structure.

February 1, 2013 HWA Project No. 2012-105-21
Final Report.doc 7 HWA GEOSCIENCES INC
5.0 CONCLUSIONS AND RECOMMENDATIONS
5.1 GENERAL
The investigation shows that the existing pavement along Thorp Prairie Road, within the project boundary, is in fair condition with most of the visible pavement distresses consisting of raveling and wear loss due to oxidization or aging of the asphalt cement. Some other distresses mainly due to long term loading and localized subgrade softening such as rutting, longitudinal cracking and transverse, or temperature cracking, were also observed along both travel lanes.
Currently, the pavement structure along Thorp Prairie Road typically consists of at least 12 inches of granular subbase overlain by 2 inches of crushed aggregate base course and 2 inches of BST. This pavement section appears to be adequate for the current traffic level. The construction of the proposed EHOPF will increase the traffic loading along Thorp Prairie Road by approximate factors of 3.5 and 4.5 times, in southbound and northbound directions, respectively. Therefore, the existing pavement structure needs to be strengthened in order to accommodate the anticipated traffic loading.
In our opinion, the pavement could be rehabilitated to support the anticipated traffic loading over a 20-year design life by overlaying the existing pavement surface with a new 1.5-inch thick HMA overlay bound to the layer below. In some isolated locations, full depth pavement reconstruction will be required given the severity of the surface distresses (mainly potholes and severe cracking) observed. The following sections provide our recommendations for overlay and reconstruction sections, for a 20-year design life, based on the traffic volumes provided, as presented below.
5.2 DESIGN TRAFFIC
Information about anticipated traffic generated by the proposed EHOPF was obtained from PacifiClean Environmental in a Trip Generation Analysis report prepared by William Popp Associates and an email message from Harold Rupert of O2Compost, dated January 11, 2012.
According to the traffic data obtained, two phases of operation are considered for the proposed EHOPF: an Initial Phase (operating at 50% capacity) and a Build-out Phase (operating at 100% capacity). PacifiClean Environmental asked us to evaluate two separate scenarios: The first scenario assumes that the proposed facility will operate at 50% of maximum capacity for 5 years before starting operation at full capacity; and the second scenario assumes that the proposed facility will operate at 50% of maximum capacity for at least 20 years.
The traffic during the initial phase is assumed to consist of 27 trucks per day for 350 days a year delivering organic material to the facility, and 24 trucks per day for 157 days a year hauling out

February 1, 2013 HWA Project No. 2012-105-21
Final Report.doc 8 HWA GEOSCIENCES INC
top soil from the facility. Once the construction of the facility is complete, EHOPF will be operating at full capacity. During this phase (Build-out Phase), 54 trucks per day for 350 days a year will be bringing into the facility organic material to be processed into top soil which will be hauled away by 48 trucks a day for 157 days a year. The organic material will be imported using 70,000-lbs truck and semi trailers with 5 permanent axles and two lift axles. We assumed that these trucks are equivalent to 1 ESAL per truck when loaded with the lift axles down, and 0.5 ESAL when empty. We assumed that the same type of trucks will be used to haul out the top soil and consequently we assumed same ESAL per truck values as stated above.
In addition to the traffic mentioned above, we assumed that the current Annual Average Daily Traffic (AADT) along this portion of Thorp Prairie Road consists of about 350 vehicles (in both directions). We estimated that the current heavy truck traffic on this segment of road amounts to approximately 4% of the AADT, we also assumed 1.4 ESAL per heavy truck.
We assumed that the traffic generated by the facility has no growth rate and that traffic from other sources (existing traffic) has an annual growth rate of 2 percent. We also disregarded the contribution of other vehicles (mostly passenger vehicles) as their contribution is assumed to be negligible. Based on all these assumptions and a design period of 20 years, we calculate a total of approximately 484,000 ESAL and 314,000 ESAL in the northbound travel lane for the first and the second scenarios, respectively; and 384,000 ESAL and 257,000 ESAL in the southbound travel lane for the first and the second scenarios, respectively. Tables 2 and 3 summarize the traffic calculations for each travel lane.
Table 2 – Summary of Traffic Calculation for the First Scenario
Trucks/Day ESAL/Phase Travel Lane Initial
Phase Build-out
Phase
ESAL/Truck Initial Phase
Build-out Phase
Total ESAL
27 54 1 47,250 283,500
24 48 0.5 9,420 56,520 NB
7 7.7* 1.4 18,615 68,044
483,349
27 54 0.5 23,625 141,750
24 48 1 18,840 113,040 SB
7 7.7* 1.4 18,615 68,044
383,914
*Heavy Truck Count projected for 2018
February 1, 2013 HWA Project No. 2012-105-21
Final Report.doc 9 HWA GEOSCIENCES INC
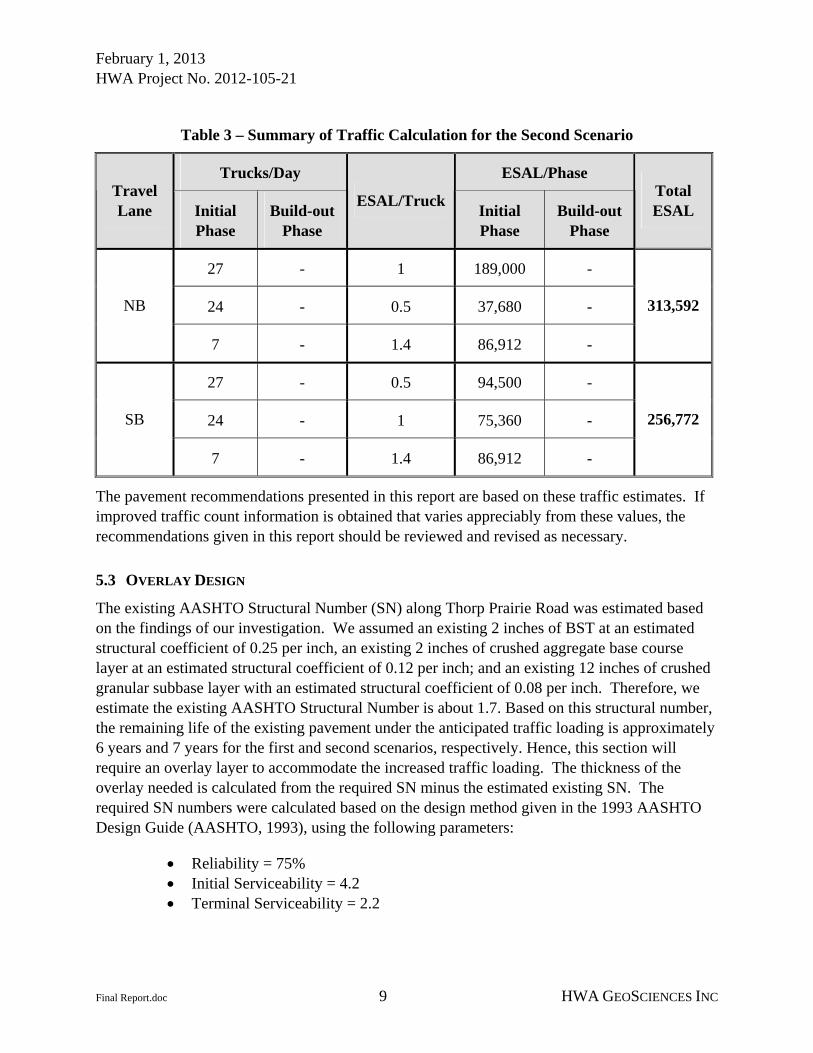
Table 3 – Summary of Traffic Calculation for the Second Scenario
Trucks/Day ESAL/Phase Travel Lane Initial
Phase Build-out
Phase
ESAL/Truck Initial Phase
Build-out Phase
Total ESAL
27 - 1 189,000 -
24 - 0.5 37,680 - NB
7 - 1.4 86,912 -
313,592
27 - 0.5 94,500 -
24 - 1 75,360 - SB
7 - 1.4 86,912 -
256,772
The pavement recommendations presented in this report are based on these traffic estimates. If improved traffic count information is obtained that varies appreciably from these values, the recommendations given in this report should be reviewed and revised as necessary.
5.3 OVERLAY DESIGN
The existing AASHTO Structural Number (SN) along Thorp Prairie Road was estimated based on the findings of our investigation. We assumed an existing 2 inches of BST at an estimated structural coefficient of 0.25 per inch, an existing 2 inches of crushed aggregate base course layer at an estimated structural coefficient of 0.12 per inch; and an existing 12 inches of crushed granular subbase layer with an estimated structural coefficient of 0.08 per inch. Therefore, we estimate the existing AASHTO Structural Number is about 1.7. Based on this structural number, the remaining life of the existing pavement under the anticipated traffic loading is approximately 6 years and 7 years for the first and second scenarios, respectively. Hence, this section will require an overlay layer to accommodate the increased traffic loading. The thickness of the overlay needed is calculated from the required SN minus the estimated existing SN. The required SN numbers were calculated based on the design method given in the 1993 AASHTO Design Guide (AASHTO, 1993), using the following parameters:
• Reliability = 75% • Initial Serviceability = 4.2 • Terminal Serviceability = 2.2

February 1, 2013 HWA Project No. 2012-105-21
Final Report.doc 10 HWA GEOSCIENCES INC
• Overall Standard Deviation = 0.45 • Design Subgrade Resilient Modulus in Northbound Travel Lane = 13,500 psi • Design Subgrade Resilient Modulus in Southbound Travel Lane = 18,000 psi
When applied to the first scenario, these assumptions result in a required structural number (SN) of 2.2 for the northbound travel lane and a required SN of 1.9 for the southbound travel lane, to accommodate the anticipated traffic loading. For the second scenario, the required SN numbers are 2.1 and 1.8 for the northbound lane and southbound lane, respectively.
Therefore, for the northbound lane, the required overlay thicknesses are 1.25 inches and 1 inch for the first and second scenarios, respectively. Whereas, for the southbound lane, the required overlay thicknesses are 0.5 inches and 0.25 inches for the first and second scenarios, respectively. For practical purposes, the minimum lift thickness of Class ½-inch HMA that can be placed is 1.5 inches. Therefore, we recommend overlaying both travel lanes with a minimum of 1.5 inches of HMA for either scenario.
It is imperative that the new overlay be adequately bonded to the existing HMA below. Adequate bonding can be achieved by applying a tack coat, per the manufacturer’s recommendations, to the existing BST layer. We further recommend that the entire pavement surface should be cleaned prior to placement of tack coat. The tack coat should not be applied in cold or wet weather, or when wet weather is forecasted prior to placement of the overlay. Before the application of the tack coat, all cracks greater than 1/4-inch in width should be cleaned and sealed prior to overlay construction.
We anticipate that isolated areas of the alignment will require total reconstruction prior to placement of the new overlay. Before the application of tack coat, the existing pavement surface should be assessed to delineate the areas requiring total reconstruction. Areas exhibiting potholing, or severe alligator cracking indicate poor subgrade support and should be reconstructed prior to overlaying. We recommend that in these areas, excavation extend through the pavement layers, exposing the subgrade soils below. A geotechnical engineer, or qualified earthworks inspector, should observe the excavations and assess the extent of over-excavation required. Excavations should be backfilled with Crushed Surfacing Base Course (CSBC) to an elevation below final grade that will allow for the recommended HMA thickness (given in Table 3, in the following section) to be placed. HMA should be placed to the level of the existing surface and the final overlay should be applied after all the pavement reconstruction is performed.

February 1, 2013 HWA Project No. 2012-105-21
Final Report.doc 11 HWA GEOSCIENCES INC
5.4 NEW HOT MIX ASPHALT (HMA) PAVEMENT STRUCTURE
Areas of pavement currently exhibiting moderate to severe distresses such as alligator cracking and/or rutting will likely deteriorate quickly under more frequent application of heavy truck traffic. Therefore, we recommend these areas be reconstructed prior to overlay construction.
This section provides our HMA design recommendations for reconstruction areas along Thorp Prairie Road. All HMA pavement designs are based on the design method given in the 1993 AASHTO Design Guide (AASHTO, 1993).
The pavement design of the areas requiring total reconstruction is presented in Table 4 based on the parameters stated in section 5.3.
To accommodate the anticipated traffic loading, the assumptions given in section 5.3 result in the following required structural numbers (SN):
• For the northbound travel lane, required SN of 2.2 and 2.1 for the first and the second scenarios respectively; and,
• For the southbound lane, required SN numbers of 1.9 and 1.8 for first and the second scenarios respectively.
Table 4. Structure Requirements for New HMA Pavement
Minimum Layer Thickness (inches) Material Description NB SB
WSDOT Standard Specification
HMA 3.5 3 5-04 & 9-02.1
CSBC 6 6 9-03.9(3)
Prepared Subgrade Compact/Proof-roll 2-06.3(2) HMA: Hot Mix Asphalt CSBC: Crushed Surfacing Base Course, compacted as specified.
5.4.1 Pavement Design Considerations
The following should be noted:
• The pavement will likely require a functional overlay after about 10 to 12 years because of non-structural associated distress caused by environmental factors such as degradation of the asphalt surface and rutting.
• HMA pavements are susceptible to shoving and rutting from heavy vehicles, such as buses and heavy delivery trucks, particularly at intersections and on steep slopes. In

February 1, 2013 HWA Project No. 2012-105-21
Final Report.doc 12 HWA GEOSCIENCES INC
these areas, more frequent maintenance and even premature reconstruction of the pavement may be required.
• The upper 2 to 3 inches of CSBC can be substituted by Crushed Surfacing Top Course (CSTC) as specified in Section 9-03.9(3) of WSDOT Standard Specifications (WSDOT 2012).
5.5 HOT- MIX ASPHALT (HMA)
5.5.1 Binder Selection
The selection of the optimum asphalt binder type for the climate is critical to ensure long-term pavement performance. Use of the wrong binder can result in low temperature cracking or permanent deformation at high temperatures.
Based on the climate in Kittitas County, Washington and WSDOT recommendations (WSDOT, 2003), SuperPave Performance Grade binder PG 64-28, or better, should be used.
5.5.2 Placement of HMA
Placement of HMA should be in accordance with Section 5-04 of the WSDOT Standard Specifications (WSDOT, 2012). Particular attention should be paid to the following:
• HMA should not be placed until the engineer has accepted the previously constructed pavement layers.
• HMA should not be placed on any frozen or wet surface.
• HMA should not be placed when precipitation is anticipated before the pavement can be compacted, or before any other weather conditions which could prevent proper handling and compacting of HMA.
• HMA should not be placed when the average surface temperatures are less than 45o F.
• HMA temperature behind the paver should be in excess of 240o F. Compaction should be completed before the mix temperature drops below 180o F. Comprehensive temperature records should be kept during the HMA placement.
• For cold joints, tack coat should be applied to the edge to be joined and the paver screed should be set to overlap the first mat by 1 to 2 inches.

February 1, 2013 HWA Project No. 2012-105-21
Final Report.doc 13 HWA GEOSCIENCES INC
5.6 DRAINAGE
It is essential to the satisfactory performance of the roadway that good drainage is provided to prevent water ponding alongside or under the pavement. Water ponding can cause saturation of the pavement and subgrade layers and premature failure. The base layers should be graded to prevent water being trapped within the layer. The surface of the pavement should be sloped to convey water from the pavement to appropriate drainage facilities.
5.7 EARTHWORK
5.7.1 Site Preparation
Site preparation for pavement reconstruction should begin with the excavation of all existing materials down to a depth sufficient to accommodate the new pavement structure. The excavation should be inspected by a geotechnical engineer, or qualified earthworks inspector, and the exposed subgrade thoroughly evaluated by probing and/or proof-rolling. Any areas exhibiting pumping, rutting or heaving should be over-excavated to a depth determined by the geotechnical engineer and backfilled with Crushed Surfacing Base Course (CSBC), placed and compacted as described in the following section.
The on-site native subgrade soils will not be suitable for re-use as structural fill given the high fines content and high moisture susceptibility. The existing crushed base and subbase courses may be used as structural fill provided that the material is within 2% of optimum moisture content as determined by ASTM D 1557, at the time of construction.
5.7.2 Structural Fill and Compaction
For the purposes of this report, material used to raise site grades, or placed directly under pavement structure, is classified as structural fill. Imported structural fill should consist of Crushed Surfacing Base Course (CSBC) as described in Section 9-03.9(3) of the WSDOT Standard Specifications (WSDOT, 2012).
Structural fill should be placed in loose, horizontal, lifts of not more than 8 inches in thickness and compacted to at least 95 % of the maximum dry density, as determined using test method ASTM D 1557 (Modified Proctor). At the time of placement, the moisture content of structural fill should be at or near optimum. The procedure required to achieve the specified minimum relative compaction depends on the size and type of compaction equipment, the number of passes, thickness of the layer being compacted, and the soil moisture-density properties.
When the first fill is placed in a given area, and/or anytime the fill material changes, the area should be considered a test section. The test section should be used to establish fill placement and compaction procedures required to achieve proper compaction. The geotechnical consultant,

February 1, 2013 HWA Project No. 2012-105-21
Final Report.doc 14 HWA GEOSCIENCES INC
or qualified earthworks inspector, should observe placement and compaction of the test section to assist in establishing an appropriate compaction procedure. Once a placement and compaction procedure is established, the contractor’s procedure should be monitored and periodic density tests performed to verify that proper compaction is being achieved.
Generally, loosely compacted soils are a result of poor construction technique or improper moisture content. Soils with a high percentage of silt or clay are particularly susceptible to becoming too wet and coarse-grained materials easily become too dry, for proper compaction. Silty or clayey soils with a moisture content too high for adequate compaction should be dried as necessary, or moisture conditioned by mixing with drier materials, or other methods. For coarse-grained structural fill soils, moisture conditioning by sprinkling before and during compaction is sometimes required to achieve the required relative compaction.
6.0 LIMITATIONS
We have prepared this report for the PacifiClean Environmental for use in design of this project. This report should be provided in its entirety to prospective contractors for bidding and estimating purposes; however, the conclusions and interpretations presented herein should not be construed as a warranty of the subsurface conditions. Experience shows that soil and ground water conditions can vary significantly over small distances. Seasonal variation in local ground water levels may affect the results obtained by non-destructive pavement evaluation method, such as those used for this project. Inconsistent conditions may occur between explorations that may not be detected by a geotechnical study. If, during future site operations, subsurface conditions are encountered which vary appreciably from those described herein, HWA should be notified to review the recommendations made in this report, and revise, if necessary. If there is a substantial lapse of time between submission of this report and the start of construction, or if conditions change due to construction operations, it is recommended that this report be reviewed to determine the applicability of the conclusions and recommendations considering the changed conditions and time lapse.
This report is issued with the understanding that it is the responsibility of the owner, or the owners’ representative, to ensure that the information and recommendations are brought to the attention of the appropriate design team personnel and incorporated into the project plans and specifications, and the necessary steps are taken to see that the contractor and subcontractors carry out such recommendations in the field.
We recommend HWA be retained to monitor construction, evaluate soil and ground water conditions as they are exposed, and verify that subgrade preparation, backfilling, and compaction are accomplished in accordance with the specifications.

Final Report.doc 16 HWA GEOSCIENCES INC
REFERENCES American Association of State Highway and Transportation Officials, 1993, AASHTO Guide for
Design of Pavement Structures, American Association of State Highway and Transportation Officials.
Tabor, R.W., Waitt, Jr., R.B., Frizzell, Jr., V.A., Swanson, D.A., Byerly, G.R., Bentley, R.D.; 1982, Geologic Map of the Wenatchee 1:100,000 Quadrangle, Central Washington: Department of the Interior, U.S. Geological Survey, Miscellaneous Investigations Series Map I-1311, 3 pl.
WSDOT, 2003, WSDOT Pavement Guide, Washington State Department of Transportation.
WSDOT, 2012, Standard Specifications for Road, Bridge and Municipal Construction, Washington State Department of Transportation.

PROJECT VICINITY MAP GEOTECHNICAL & PAVEMENT ENGINEERING REPORT
THORP PRAIRIE ROAD EVALUATION AND DESIGN KITTITAS COUNTY, WASHINGTON
1 2012-105
FIGURE NO.
PROJECT NO.
Approximate Project Location

PROJECT ALIGNMENT AND EXPLORATION MAPGEOTECHNICAL & PAVEMENT ENGINEERING REPORT
THORP PRAIRIE ROAD EVALUATION AND DESIGN KITTITAS COUNTY, WASHINGTON
2A 2012-105
FIGURE NO.
PROJECT NO.
Approximate Pavement Core Location and Designation
N
Core-1
Core-1
Core-2
Core-3
Core-4
Core-5
Sta 37+96
Sta 0+00
Sta 84+00

PROJECT ALIGNMENT AND EXPLORATION MAPGEOTECHNICAL & PAVEMENT ENGINEERING REPORT
THORP PRAIRIE ROAD EVALUATION AND DESIGN KITTITAS COUNTY, WASHINGTON
2B 2012-105
FIGURE NO.
PROJECT NO.
Approximate Pavement Core Location and DesignationCore-1
N
Core-5
Core-6
Sta 84+00
Sta 107+00

FWD TEST RESULTS
GEOTECHNICAL & PAVEMENT ENGINEERING REPORT THORP PRAIRIE ROAD EVALUATION AND DESIGN
KITTITAS COUNTY, WASHINGTON
3 2012-105
FIGURE NO.
PROJECT NO.
a. Maximum Deflection Normalized for 9,000 lb Load
0
10
20
30
40
50
0+00
10+0
0
20+0
0
30+0
0
40+0
0
50+0
0
60+0
0
70+0
0
80+0
0
90+0
0
100+
00
110+
00
Project Stationing
Defle
ctio
n - m
ilsNBSB
b. Resilient Modulus of Subgrade
0
10
20
30
40
50
60
70
0+00
10+0
0
20+0
0
30+0
0
40+0
0
50+0
0
60+0
0
70+0
0
80+0
0
90+0
0
100+
00
110+
00
Project Stationing
Resi
lient
Mod
ulus
- ks
i
NBSB

APPENDIX A
FIELD EXPLORATION

A-12012-105-21KITTITAS COUNTY, WASHINGTON
THORP PRAIRIE ROAD EVALUATION AND DESIGNGEOTECHINICAL & PAVEMENT ENGINEERING REPORT
SYMBOLS USED ONEXPLORATION LOGS
LEGEND OF TERMS AND
Coarse sand
Medium sand
SIZE RANGE
Larger than 12 in
Smaller than No. 200 (0.074mm)
Gravel
time of drilling)
Groundwater Level (measured in well or
AL
CBR
CN
Atterberg Limits:LL = Liquid Limit
California Bearing Ratio
Consolidation
Resilient Modulus
Photoionization Device Reading
Pocket Penetrometer
Specific Gravity
Triaxial Compression
Torvane
3 in to 12 in
3 in to No 4 (4.5mm)
No. 4 (4.5 mm) to No. 200 (0.074 mm)
COMPONENT
DRY Absence of moisture, dusty,
dry to the touch.
MOIST Damp but no visible water.
WET Visible free water, usually
soil is below water table.
Boulders
Cobbles
Coarse gravel
Fine gravel
Sand
MOISTURE CONTENT
COMPONENT PROPORTIONS
Fine sand
Silt and Clay
5 - 12%
PROPORTION RANGE DESCRIPTIVE TERMS
Clean
Slightly (Clayey, Silty, Sandy)
30 - 50%
Components are arranged in order of increasing quantities.
Very (Clayey, Silty, Sandy, Gravelly)
12 - 30% Clayey, Silty, Sandy, Gravelly
open hole after water level stabilized)
Groundwater Level (measured at
3 in to 3/4 in
3/4 in to No 4 (4.5mm)
No. 4 (4.5 mm) to No. 10 (2.0 mm)
No. 10 (2.0 mm) to No. 40 (0.42 mm)
No. 40 (0.42 mm) to No. 200 (0.074 mm)
PL = Plastic Limit
DD
DS
GS
K
MD
MR
PID
PP
SG
TC
TV
Dry Density (pcf)
Direct Shear
Grain Size Distribution
Permeability
Approx. Shear Strength (tsf)
Percent Fines%F
Moisture/Density Relationship (Proctor)
Approx. Compressive Strength (tsf)
Unconfined CompressionUC
(140 lb. hammer with 30 in. drop)
Shelby Tube
Small Bag Sample
Large Bag (Bulk) Sample
Core Run
Non-standard Penetration Test
2.0" OD Split Spoon (SPT)
NOTES: Soil classifications presented on exploration logs are based on visual and laboratory observation.
Density/consistency, color, modifier (if any) GROUP NAME, additions to group name (if any), moisturecontent. Proportion, gradation, and angularity of constituents, additional comments.(GEOLOGIC INTERPRETATION)
Please refer to the discussion in the report text as well as the exploration logs for a morecomplete description of subsurface conditions.
Soil descriptions are presented in the following general order:
< 5%
3-1/4" OD Split Spoon with Brass Rings
(3.0" OD split spoon)
TEST SYMBOLS
SAMPLE TYPE SYMBOLS
GROUNDWATER SYMBOLS
COMPONENT DEFINITIONS
to 30
over 30
ApproximateUndrained Shear
Strength (psf)
<250
250 -
No. 4 Sieve
Sand with
Fines (appreciable
amount of fines)
amount of fines)
More than
50% Retained
on No.
200 Sieve
Size
Sand and
Sandy Soils
Clean Gravel
(little or no fines)
More than
50% of Coarse
Fraction Retained
on No. 4 Sieve
Gravel with
SM
SC
ML
MH
CH
OH
RELATIVE DENSITY OR CONSISTENCY VERSUS SPT N-VALUE
Very Loose
Loose
Medium Dense
Very Dense
Dense
N (blows/ft)
0 to 4
4 to 10
10 to 30
30 to 50
over 50
ApproximateRelative Density(%)
0 - 15
15 - 35
35 - 65
65 - 85
85 - 100
COHESIVE SOILS
Consistency
Very Soft
Soft
Medium Stiff
Stiff
Very Stiff
Hard
N (blows/ft)
0 to 2
2 to 4
4 to 8
8 to 15
15
Clean Sand
(little or no fines)
50% or More
of Coarse
Fraction Passing
Fine
Grained
Soils
Silt
and
Clay
Liquid Limit
Less than 50%
50% or More
Passing
No. 200 Sieve
Size
Silt
and
Clay
Liquid Limit
50% or More
500
500 - 1000
1000 - 2000
2000 - 4000
>4000
DensityDensity
USCS SOIL CLASSIFICATION SYSTEM
Coarse
Grained
Soils
Gravel and
Gravelly Soils
Highly Organic Soils
GROUP DESCRIPTIONS
Well-graded GRAVEL
Poorly-graded GRAVEL
Silty GRAVEL
Clayey GRAVEL
Well-graded SAND
Poorly-graded SAND
Silty SAND
Clayey SAND
SILT
Lean CLAY
Organic SILT/Organic CLAY
Elastic SILT
Fat CLAY
Organic SILT/Organic CLAY
PEAT
MAJOR DIVISIONS
GW
SP
CL
OL
PT
GP
GM
GC
SW
COHESIONLESS SOILS
Fines (appreciable
LEGEND 2012-105.GPJ 12/26/12FIGURE:PROJECT NO.:

S-1
S-2
S-3
S-4
2-inch layer of Bituminous Surface Treatment (BST) inseveral lifts.
[BST]
1.5-inch thick layer of Crushed surfacing top course.[CSTC]
Very dense, reddish brown, silty GRAVEL with sand, moist.Fine to coarse angular gravel.
[FILL]
Medium stiff, reddish brown, slightly gravelly to gravelly, sandySILT, moist. Trace burnt wood bits, cobbles, and roundedgravels, less gravelly with depth.
[FILL]
Pavement core was terminated at 3.4 feet below groundsurface due to refusal on cobble. No ground water seepagewas observed during the exploration.
GM
ML
BORING-DSM 2012-105.GPJ 12/28/12FIGURE:PROJECT NO.: 2012-105-21
KITTITAS COUNTY, WASHINGTONTHORP PRAIRIE ROAD EVALUATION AND DESIGN
GEOTECHINICAL & PAVEMENT ENGINEERING REPORT
DE
PT
H(f
eet)
0
5
ELE
VA
TIO
N(f
eet)
Core-1PAGE: 1 of 1
(blo
ws/
6 in
ches
)
GR
OU
ND
WA
TE
R
PE
N. R
ES
IST
AN
CE
Liquid Limit
SY
MB
OL
0 10 20 30 40 50
0 20 40 60 80 100
SA
MP
LE T
YP
E
SA
MP
LE N
UM
BE
R
Natural Water Content
US
CS
SO
IL C
LAS
S
Water Content (%)
NOTE: This log of subsurface conditions applies only at the specified location and on the date indicated
DESCRIPTION OT
HE
R T
ES
TS
Plastic Limit
COREHOLE
and therefore may not necessarily be indicative of other times and/or locations.
Blows per foot
A-2
DATE COMPLETED: 11/26/2012
LOGGED BY: D. Coltrane
DRILLING COMPANY: HWA Geosciences Inc.
DRILLING METHOD: Hand portable core drill and bucket auger
SAMPLING METHOD: GRAB
LOCATION: Station 15+00 Center of Southbound travel lane
DATE STARTED: 11/26/2012

S-1
S-2
1.75-inch layer of Bituminous Surface Treatment (BST) inseveral lifts.
[BST]
Very dense, brown, silty GRAVEL with sand, moist. Fine tocoarse angular gravel.
[FILL]
Pavement core was terminated at 1.5 feet below groundsurface due to refusal on gravel. No ground water seepagewas observed during the exploration.
GM
BORING-DSM 2012-105.GPJ 12/28/12FIGURE:PROJECT NO.: 2012-105-21
KITTITAS COUNTY, WASHINGTONTHORP PRAIRIE ROAD EVALUATION AND DESIGN
GEOTECHINICAL & PAVEMENT ENGINEERING REPORT
DE
PT
H(f
eet)
0
5
ELE
VA
TIO
N(f
eet)
Core-2PAGE: 1 of 1
(blo
ws/
6 in
ches
)
GR
OU
ND
WA
TE
R
PE
N. R
ES
IST
AN
CE
Liquid Limit
SY
MB
OL
0 10 20 30 40 50
0 20 40 60 80 100
SA
MP
LE T
YP
E
SA
MP
LE N
UM
BE
R
Natural Water Content
US
CS
SO
IL C
LAS
S
Water Content (%)
NOTE: This log of subsurface conditions applies only at the specified location and on the date indicated
DESCRIPTION OT
HE
R T
ES
TS
Plastic Limit
COREHOLE
and therefore may not necessarily be indicative of other times and/or locations.
Blows per foot
A-3
DATE COMPLETED: 11/26/2012
LOGGED BY: D. Coltrane
DRILLING COMPANY: HWA Geosciences Inc.
DRILLING METHOD: Hand portable core drill and bucket auger
SAMPLING METHOD: GRAB
LOCATION: Station 30+50 Outside wheel path of Southbound travel lane
DATE STARTED: 11/26/2012

S-1
S-2
2-inch layer of Bituminous Surface Treatment (BST) inseveral lifts.
[BST]
1-inch thick layer of Crushed surfacing top course.[CSTC]
Very dense, brown, silty GRAVEL with sand, moist. Fine tocoarse angular gravel.
[FILL]
Pavement core was terminated at 1.25 feet below groundsurface due to refusal on gravel. No ground water seepagewas observed during the exploration.
GM
BORING-DSM 2012-105.GPJ 12/28/12FIGURE:PROJECT NO.: 2012-105-21
KITTITAS COUNTY, WASHINGTONTHORP PRAIRIE ROAD EVALUATION AND DESIGN
GEOTECHINICAL & PAVEMENT ENGINEERING REPORT
DE
PT
H(f
eet)
0
5
ELE
VA
TIO
N(f
eet)
Core-3PAGE: 1 of 1
(blo
ws/
6 in
ches
)
GR
OU
ND
WA
TE
R
PE
N. R
ES
IST
AN
CE
Liquid Limit
SY
MB
OL
0 10 20 30 40 50
0 20 40 60 80 100
SA
MP
LE T
YP
E
SA
MP
LE N
UM
BE
R
Natural Water Content
US
CS
SO
IL C
LAS
S
Water Content (%)
NOTE: This log of subsurface conditions applies only at the specified location and on the date indicated
DESCRIPTION OT
HE
R T
ES
TS
Plastic Limit
COREHOLE
and therefore may not necessarily be indicative of other times and/or locations.
Blows per foot
A-4
DATE COMPLETED: 11/26/2012
LOGGED BY: D. Coltrane
DRILLING COMPANY: HWA Geosciences Inc.
DRILLING METHOD: Hand portable core drill and bucket auger
SAMPLING METHOD: GRAB
LOCATION: Station 45+00 Center of Southbound travel lane
DATE STARTED: 11/26/2012

S-1
S-2
1.75-inch layer of Bituminous Surface Treatment (BST) inseveral lifts.
[BST]
1.25-inch thick layer of Crushed surfacing top course.[CSTC]
Very dense, dark grayish brown, silty GRAVEL with sand,moist. Fine to coarse angular gravel.
[FILL]
Medium stiff to stiff, gray to reddish brown, gravelly, leanCLAY with sand, moist.
[FILL]
Pavement core was terminated at 2 feet below ground surfacedue to refusal on gravel. No ground water seepage wasobserved during the exploration.
GM
CL
BORING-DSM 2012-105.GPJ 12/28/12FIGURE:PROJECT NO.: 2012-105-21
KITTITAS COUNTY, WASHINGTONTHORP PRAIRIE ROAD EVALUATION AND DESIGN
GEOTECHINICAL & PAVEMENT ENGINEERING REPORT
DE
PT
H(f
eet)
0
5
ELE
VA
TIO
N(f
eet)
Core-4PAGE: 1 of 1
(blo
ws/
6 in
ches
)
GR
OU
ND
WA
TE
R
PE
N. R
ES
IST
AN
CE
Liquid Limit
SY
MB
OL
0 10 20 30 40 50
0 20 40 60 80 100
SA
MP
LE T
YP
E
SA
MP
LE N
UM
BE
R
Natural Water Content
US
CS
SO
IL C
LAS
S
Water Content (%)
NOTE: This log of subsurface conditions applies only at the specified location and on the date indicated
DESCRIPTION OT
HE
R T
ES
TS
Plastic Limit
COREHOLE
and therefore may not necessarily be indicative of other times and/or locations.
Blows per foot
A-5
DATE COMPLETED: 11/26/2012
LOGGED BY: D. Coltrane
DRILLING COMPANY: HWA Geosciences Inc.
DRILLING METHOD: Hand portable core drill and bucket auger
SAMPLING METHOD: GRAB
LOCATION: Station 60+50 Outside wheel path of Southbound travel lane
DATE STARTED: 11/26/2012
S-1
S-2
S-3
1.75-inch layer of Bituminous Surface Treatment (BST) inseveral lifts.
[BST]
Very dense, brown, silty, gravelly SAND, moist. Fine tocoarse angular gravel.
[FILL]
Very dense, mottled reddish brown and gray clayey GRAVELwith sand, moist. Becomes less mottled and more red withdepth.
[FILL]
Pavement core was terminated at 2.5 feet below groundsurface due to refusal on gravel. No ground water seepagewas observed during the exploration.
SM
GC
BORING-DSM 2012-105.GPJ 12/28/12FIGURE:PROJECT NO.: 2012-105-21
KITTITAS COUNTY, WASHINGTONTHORP PRAIRIE ROAD EVALUATION AND DESIGN
GEOTECHINICAL & PAVEMENT ENGINEERING REPORT
DE
PT
H(f
eet)
0
5
ELE
VA
TIO
N(f
eet)
Core-5PAGE: 1 of 1
(blo
ws/
6 in
ches
)
GR
OU
ND
WA
TE
R
PE
N. R
ES
IST
AN
CE
Liquid Limit
SY
MB
OL
0 10 20 30 40 50
0 20 40 60 80 100
SA
MP
LE T
YP
E
SA
MP
LE N
UM
BE
R
Natural Water Content
US
CS
SO
IL C
LAS
S
Water Content (%)
NOTE: This log of subsurface conditions applies only at the specified location and on the date indicated
DESCRIPTION OT
HE
R T
ES
TS
Plastic Limit
COREHOLE
and therefore may not necessarily be indicative of other times and/or locations.
Blows per foot
A-6
DATE COMPLETED: 11/26/2012
LOGGED BY: D. Coltrane
DRILLING COMPANY: HWA Geosciences Inc.
DRILLING METHOD: Hand portable core drill and bucket auger
SAMPLING METHOD: GRAB
LOCATION: Station 75+00 Outside wheel path of Northbound travel lane
DATE STARTED: 11/26/2012

S-1
S-2
2-inch layer of Bituminous Surface Treatment (BST) inseveral lifts.
[BST]
2-inch thick layer of Crushed surfacing top course.[CSTC]
3-inch thick layer of Crushed surfacing base course.[CSBC]
Very dense, reddish brown, clayey GRAVEL with sand andcobbles, moist.
[FILL]
Pavement Core was terminated at 0.85 feet below groundsurface due to refusal on cobble. No ground water seepagewas observed during the exploration.
GC
BORING-DSM 2012-105.GPJ 12/28/12FIGURE:PROJECT NO.: 2012-105-21
KITTITAS COUNTY, WASHINGTONTHORP PRAIRIE ROAD EVALUATION AND DESIGN
GEOTECHINICAL & PAVEMENT ENGINEERING REPORT
DE
PT
H(f
eet)
0
5
ELE
VA
TIO
N(f
eet)
Core-6PAGE: 1 of 1
(blo
ws/
6 in
ches
)
GR
OU
ND
WA
TE
R
PE
N. R
ES
IST
AN
CE
Liquid Limit
SY
MB
OL
0 10 20 30 40 50
0 20 40 60 80 100
SA
MP
LE T
YP
E
SA
MP
LE N
UM
BE
R
Natural Water Content
US
CS
SO
IL C
LAS
S
Water Content (%)
NOTE: This log of subsurface conditions applies only at the specified location and on the date indicated
DESCRIPTION OT
HE
R T
ES
TS
Plastic Limit
COREHOLE
and therefore may not necessarily be indicative of other times and/or locations.
Blows per foot
A-7
DATE COMPLETED: 11/26/2012
LOGGED BY: D. Coltrane
DRILLING COMPANY: HWA Geosciences Inc.
DRILLING METHOD: Hand portable core drill and bucket auger
SAMPLING METHOD: GRAB
LOCATION: Station 92+50 Outside wheel path of Southbound travel lane
DATE STARTED: 11/26/2012

APPENDIX B
LABORATORY TEST RESULTS

0
10
20
30
40
50
60
70
80
90
100
0.0010.010.1110
GRAVEL
% MC LL PL PI
7
15
5
#10
30.4
38.1
44.3
(GM) Very dark brown, silty GRAVEL with sand
(ML) Dark brown, sandy SILT
(GM) Black, silty GRAVEL with sand
DEPTH (ft)
#20
Fine Coarse Medium Fine
13.3
50.8
12.7
3/8"
5
Coarse
#60#40
90
GRAIN SIZE IN MILLIMETERS0.05
5/8"
70
#4 #200
SYMBOL Gravel%
Sand%
Fines%
30
CLASSIFICATION OF SOIL- ASTM D2487 Group Symbol and Name
U.S. STANDARD SIEVE SIZES
SAND
10
3"
56.3
11.1
43.1
1-1/2"
PE
RC
EN
T F
INE
R B
Y W
EIG
HT
50
SAMPLE
S-2
S-4
S-1
B-1
0.00050.005
CLAY
#100
0.5
50
SILT
3/4"
PARTICLE-SIZE ANALYSISOF SOILS
METHOD ASTM D422
Core-1
Core-1
Core-4
0.3 - 0.7
1.5 - 1.8
0.3 - 0.5
2012-105-21PROJECT NO.:HWAGRSZ 2012-105.GPJ 12/27/12
FIGURE:
GEOTECHINICAL & PAVEMENT ENGINEERING REPORTTHORP PRAIRIE ROAD EVALUATION AND DESIGN
KITTITAS COUNTY, WASHINGTON
0
10
20
30
40
50
60
70
80
90
100
0.0010.010.1110
54.9
31.1
#200
U.S. STANDARD SIEVE SIZES
SAND
DEPTH (ft)SYMBOL Gravel%
Medium Fine
3/8"
CoarseCLAY
#100
SILT
3/4"#10 #20
Fine Coarse
Sand%
Fines%
3"
19
13
1-1/2"
PE
RC
EN
T F
INE
R B
Y W
EIG
HT
B-2
50 5
CLASSIFICATION OF SOIL- ASTM D2487 Group Symbol and NameSAMPLE % MC LL PL PI
5/8"
0.5 0.05 0.005 0.0005
GRAIN SIZE IN MILLIMETERS
1.5 - 1.9
2.0 - 2.2
26
31
18
17
8
14
Core-4
Core-5
S-2
S-3
(CL) Very dark brown, sandy lean CLAY
(GC) Dark yellowish brown, clayey GRAVEL
#60#40
GRAVEL
#4
PERCENT OF MATERIAL PASSING#200 SIEVE
METHOD ASTM D1140
2012-105-21PROJECT NO.:HWAGRSZP200 2012-105.GPJ 12/27/12
FIGURE:
GEOTECHINICAL & PAVEMENT ENGINEERING REPORTTHORP PRAIRIE ROAD EVALUATION AND DESIGN
KITTITAS COUNTY, WASHINGTON

0
10
20
30
40
50
60
0 20 40 60 80 100
% MC LL
CL-ML MH
SAMPLE
PLA
ST
ICIT
Y IN
DE
X (
PI)
SYMBOL PL PI
S-2
S-3
1.5 - 1.9
2.0 - 2.2
18
17
19
13
26
31
LIQUID LIMIT, PLASTIC LIMIT ANDPLASTICITY INDEX OF SOILS
METHOD ASTM D4318
54.9
31.1
CL
(CL) Very dark brown, sandy lean CLAY
(GC) Dark yellowish brown, clayey GRAVEL
B-3
8
14
CH
CLASSIFICATIONDEPTH (ft) % Fines
LIQUID LIMIT (LL)
Core-4
Core-5
ML
2012-105-21PROJECT NO.:HWAATTB 2012-105.GPJ 12/27/12
FIGURE:
GEOTECHINICAL & PAVEMENT ENGINEERING REPORTTHORP PRAIRIE ROAD EVALUATION AND DESIGN
KITTITAS COUNTY, WASHINGTON

APPENDIX C
FWD DEFLECTION BASINS

Thorp Prairie RoadFrom Exit 93 to EHIOCP FacilityNB Deflection Basins (1 of 14)
0
5
10
15
20
25
30
0 10 20 30 40 50 60 70 80
Distance from Plate Load, inches
Def
lect
ion,
mils
3+01
4+00
5+00
6+01
7+02
8+03
9+03
Stationing

Thorp Prairie RoadFrom Exit 93 to EHIOCP FacilityNB Deflection Basins (2 of 14)
0
5
10
15
20
25
30
0 10 20 30 40 50 60 70 80
Distance from Plate Load, inches
Def
lect
ion,
mils
10+00
10+99
12+01
13+00
14+01
15+00
16+00
Stationing

Thorp Prairie RoadFrom Exit 93 to EHIOCP FacilityNB Deflection Basins (3 of 14)
0
5
10
15
20
25
30
0 10 20 30 40 50 60 70 80
Distance from Plate Load, inches
Def
lect
ion,
mils
17+00
18+00
19+00
20+00
20+99
21+99
23+01
Stationing

Thorp Prairie RoadFrom Exit 93 to EHIOCP FacilityNB Deflection Basins (4 of 14)
0
5
10
15
20
25
30
0 10 20 30 40 50 60 70 80
Distance from Plate Load, inches
Def
lect
ion,
mils
23+99
24+99
26+00
27+00
28+01
29+01
30+04
Stationing

Thorp Prairie RoadFrom Exit 93 to EHIOCP FacilityNB Deflection Basins (5 of 14)
0
5
10
15
20
25
30
0 10 20 30 40 50 60 70 80
Distance from Plate Load, inches
Def
lect
ion,
mils
31+01
32+00
33+00
34+01
35+01
36+01
36+99
Stationing

Thorp Prairie RoadFrom Exit 93 to EHIOCP FacilityNB Deflection Basins (6 of 14)
0
5
10
15
20
25
30
0 10 20 30 40 50 60 70 80
Distance from Plate Load, inches
Def
lect
ion,
mils
37+96
39+00
40+01
41+02
41+99
43+01
44+05
Stationing

Thorp Prairie RoadFrom Exit 93 to EHIOCP FacilityNB Deflection Basins (7 of 14)
0
5
10
15
20
25
30
0 10 20 30 40 50 60 70 80
Distance from Plate Load, inches
Def
lect
ion,
mils
45+00
46+00
47+00
48+00
49+02
50+01
51+01
Stationing

Thorp Prairie RoadFrom Exit 93 to EHIOCP FacilityNB Deflection Basins (8 of 14)
0
5
10
15
20
25
0 10 20 30 40 50 60 70 80
Distance from Plate Load, inches
Def
lect
ion,
mils
52+0153+0054+0155+0056+0057+0258+0059+00
Stationing

Thorp Prairie RoadFrom Exit 93 to EHIOCP FacilityNB Deflection Basins (9 of 14)
0
5
10
15
20
25
30
0 10 20 30 40 50 60 70 80
Distance from Plate Load, inches
Def
lect
ion,
mils
60+0261+0262+0063+0064+0265+0066+0267+00
Stationing

Thorp Prairie RoadFrom Exit 93 to EHIOCP FacilityNB Deflection Basins (10 of 14)
0
5
10
15
20
25
0 10 20 30 40 50 60 70 80
Distance from Plate Load, inches
Def
lect
ion,
mils
68+0269+0270+0171+0272+0073+0474+0275+00
Stationing

Thorp Prairie RoadFrom Exit 93 to EHIOCP FacilityNB Deflection Basins (11 of 14)
0
5
10
15
20
0 10 20 30 40 50 60 70 80
Distance from Plate Load, inches
Def
lect
ion,
mils
76+0177+0278+0379+0080+0281+0182+0383+00
Stationing

Thorp Prairie RoadFrom Exit 93 to EHIOCP FacilityNB Deflection Basins (12 of 14)
0
5
10
15
20
25
0 10 20 30 40 50 60 70 80
Distance from Plate Load, inches
Def
lect
ion,
mils
84+0085+0286+0087+0388+0089+0090+0291+00
Stationing

Thorp Prairie RoadFrom Exit 93 to EHIOCP FacilityNB Deflection Basins (13 of 14)
0
5
10
15
20
25
30
0 10 20 30 40 50 60 70 80
Distance from Plate Load, inches
Def
lect
ion,
mils
92+0193+0394+0295+0096+0097+0198+0298+99
Stationing
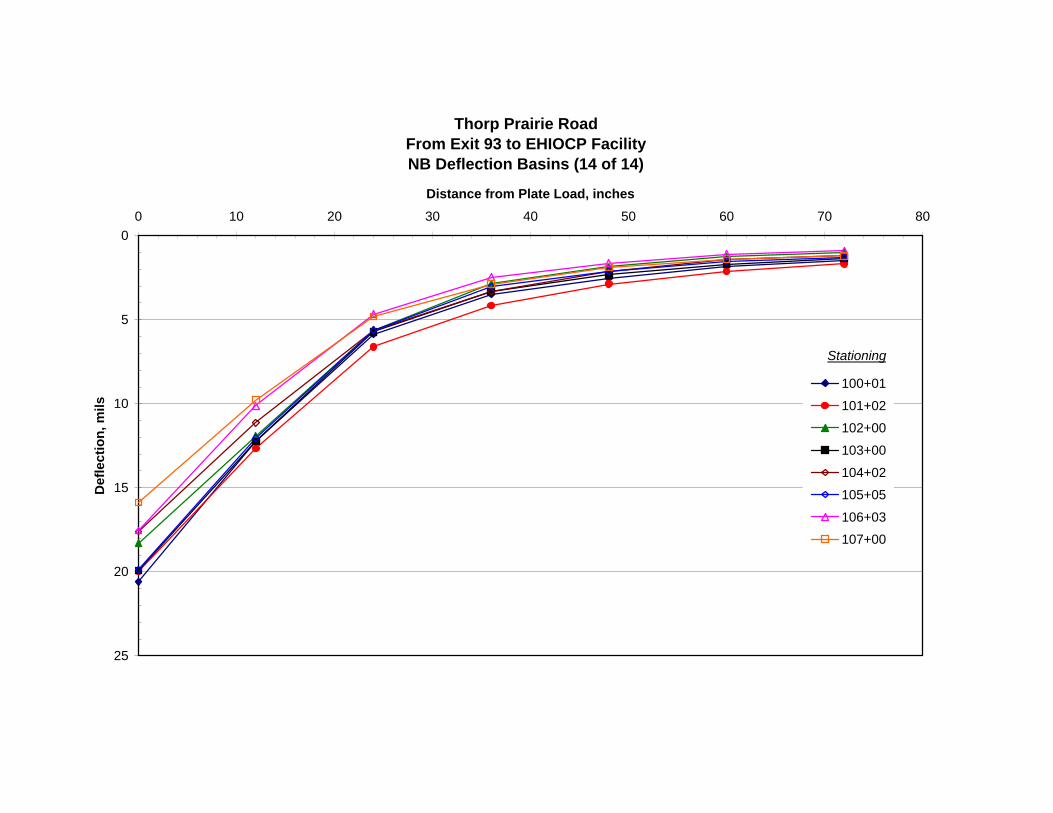
Thorp Prairie RoadFrom Exit 93 to EHIOCP FacilityNB Deflection Basins (14 of 14)
0
5
10
15
20
25
0 10 20 30 40 50 60 70 80
Distance from Plate Load, inches
Def
lect
ion,
mils
100+01
101+02
102+00
103+00
104+02
105+05
106+03
107+00
Stationing

Thorp Prairie RoadFrom Exit 93 to EHIOCP FacilitySB Deflection Basins (1 of 14)
0
5
10
15
20
25
0 10 20 30 40 50 60 70 80
Distance from Plate Load, inches
Def
lect
ion,
mils
3+45
4+50
5+49
6+44
7+50
8+51
9+51
Stationing

Thorp Prairie RoadFrom Exit 93 to EHIOCP FacilitySB Deflection Basins (2 of 14)
0
5
10
15
20
25
0 10 20 30 40 50 60 70 80
Distance from Plate Load, inches
Def
lect
ion,
mils
10+50
11+51
12+50
13+51
14+50
15+49
16+49
Stationing

Thorp Prairie RoadFrom Exit 93 to EHIOCP FacilitySB Deflection Basins (3 of 14)
0
5
10
15
20
0 10 20 30 40 50 60 70 80
Distance from Plate Load, inches
Def
lect
ion,
mils
17+49
18+46
19+49
20+49
21+49
22+50
23+44
Stationing

Thorp Prairie RoadFrom Exit 93 to EHIOCP FacilitySB Deflection Basins (4 of 14)
0
5
10
15
20
0 10 20 30 40 50 60 70 80
Distance from Plate Load, inches
Def
lect
ion,
mils
24+4925+4926+5127+5028+5029+4930+5031+48
Stationing

Thorp Prairie RoadFrom Exit 93 to EHIOCP FacilitySB Deflection Basins (5 of 14)
0
5
10
15
20
25
0 10 20 30 40 50 60 70 80
Distance from Plate Load, inches
Def
lect
ion,
mils
32+4833+4834+4935+4936+5037+4938+4939+50
Stationing

Thorp Prairie RoadFrom Exit 93 to EHIOCP FacilitySB Deflection Basins (6 of 14)
0
5
10
15
20
25
0 10 20 30 40 50 60 70 80
Distance from Plate Load, inches
Def
lect
ion,
mils
40+4941+4742+5043+5044+5045+5046+4547+49
Stationing

Thorp Prairie RoadFrom Exit 93 to EHIOCP FacilitySB Deflection Basins (7 of 14)
0
5
10
15
20
25
0 10 20 30 40 50 60 70 80
Distance from Plate Load, inches
Def
lect
ion,
mils
48+4749+4950+5051+5052+5053+5054+4555+50
Stationing

Thorp Prairie RoadFrom Exit 93 to EHIOCP FacilitySB Deflection Basins (8 of 14)
0
5
10
15
20
25
0 10 20 30 40 50 60 70 80
Distance from Plate Load, inches
Def
lect
ion,
mils
56+5057+5058+5059+4960+4661+5062+5063+50
Stationing

Thorp Prairie RoadFrom Exit 93 to EHIOCP FacilitySB Deflection Basins (9 of 14)
0
5
10
15
20
25
0 10 20 30 40 50 60 70 80
Distance from Plate Load, inches
Def
lect
ion,
mils
64+4965+5066+4967+5068+5069+5070+5071+50
Stationing

Thorp Prairie RoadFrom Exit 93 to EHIOCP FacilitySB Deflection Basins (10 of 14)
0
5
10
15
20
25
30
0 10 20 30 40 50 60 70 80
Distance from Plate Load, inches
Def
lect
ion,
mils
72+5073+5174+4975+5076+5177+5078+4979+48
Stationing
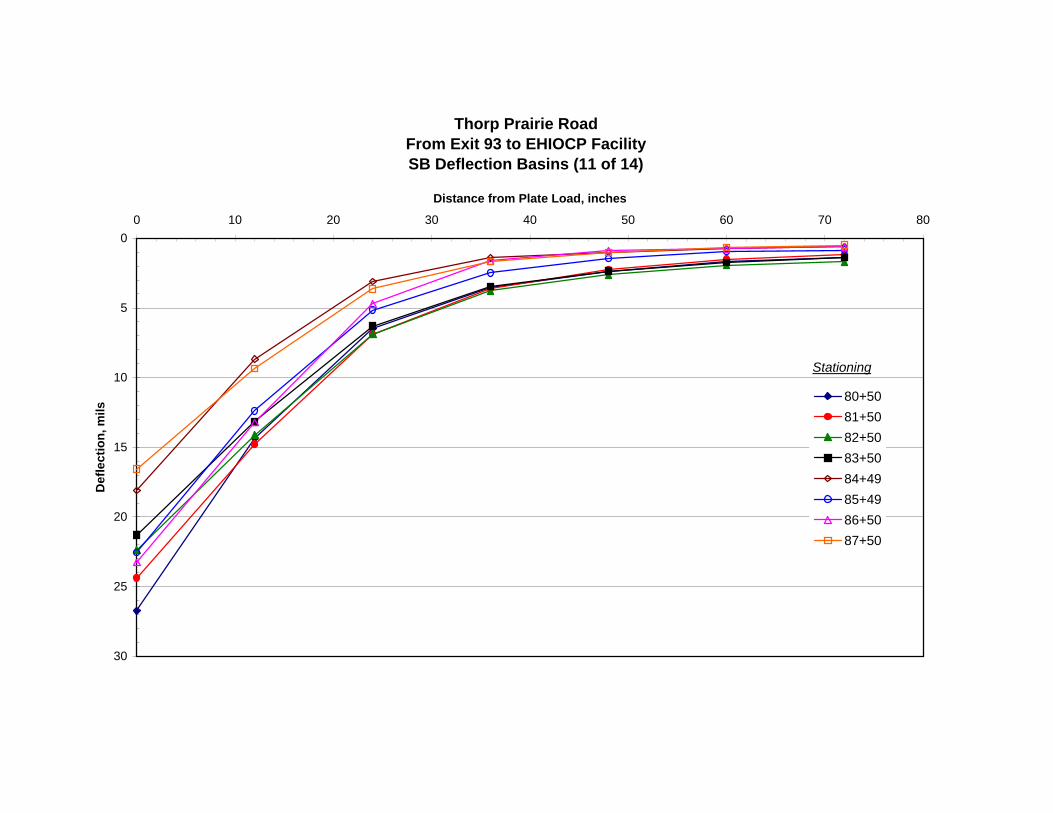
Thorp Prairie RoadFrom Exit 93 to EHIOCP FacilitySB Deflection Basins (11 of 14)
0
5
10
15
20
25
30
0 10 20 30 40 50 60 70 80
Distance from Plate Load, inches
Def
lect
ion,
mils
80+5081+5082+5083+5084+4985+4986+5087+50
Stationing

Thorp Prairie RoadFrom Exit 93 to EHIOCP FacilitySB Deflection Basins (12 of 14)
0
5
10
15
20
25
30
0 10 20 30 40 50 60 70 80
Distance from Plate Load, inches
Def
lect
ion,
mils
88+5089+5090+5091+5192+5093+4994+4995+48
Stationing

Thorp Prairie RoadFrom Exit 93 to EHIOCP FacilitySB Deflection Basins (13 of 14)
0
5
10
15
20
25
0 10 20 30 40 50 60 70 80
Distance from Plate Load, inches
Def
lect
ion,
mils
96+5097+5198+4599+49100+48101+50102+47103+50
Stationing

Thorp Prairie RoadFrom Exit 93 to EHIOCP FacilitySB Deflection Basins (14 of 14)
0
5
10
15
20
25
0 10 20 30 40 50 60 70 80
Distance from Plate Load, inches
Def
lect
ion,
mils 104+48
105+50
106+49
Stationing

APPENDIX D
CORE PHOTOGRAPHS
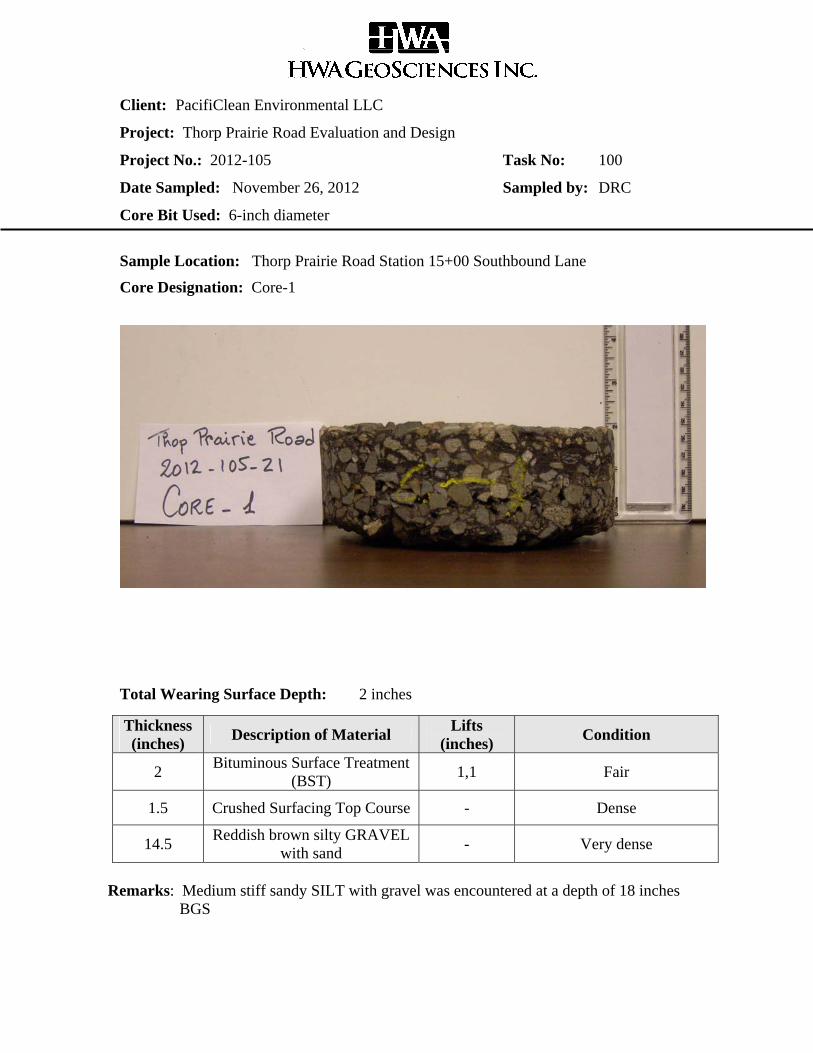
Client: PacifiClean Environmental LLC
Project: Thorp Prairie Road Evaluation and Design
Project No.: 2012-105 Task No: 100
Date Sampled: November 26, 2012 Sampled by: DRC
Core Bit Used: 6-inch diameter
Sample Location: Thorp Prairie Road Station 15+00 Southbound Lane
Core Designation: Core-1
Total Wearing Surface Depth: 2 inches
Thickness (inches) Description of Material Lifts
(inches) Condition
2 Bituminous Surface Treatment (BST) 1,1 Fair
1.5 Crushed Surfacing Top Course - Dense
14.5 Reddish brown silty GRAVEL with sand - Very dense
Remarks: Medium stiff sandy SILT with gravel was encountered at a depth of 18 inches
BGS
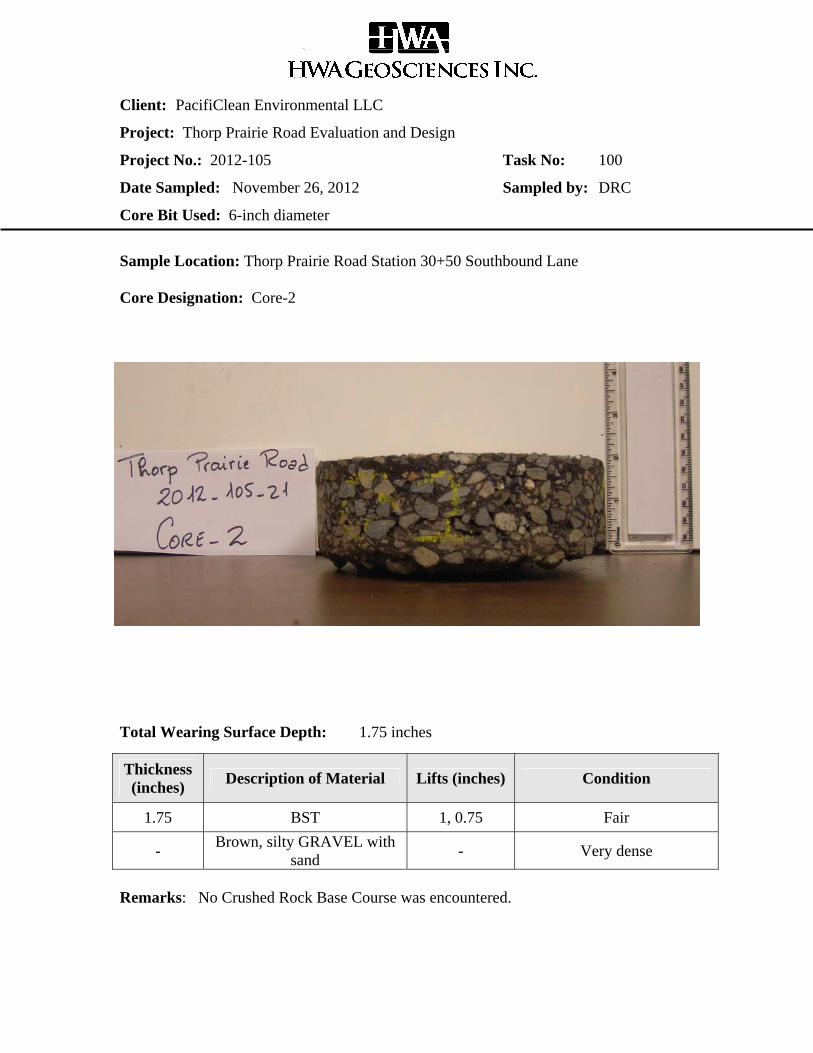
Client: PacifiClean Environmental LLC
Project: Thorp Prairie Road Evaluation and Design
Project No.: 2012-105 Task No: 100
Date Sampled: November 26, 2012 Sampled by: DRC
Core Bit Used: 6-inch diameter
Sample Location: Thorp Prairie Road Station 30+50 Southbound Lane Core Designation: Core-2
Total Wearing Surface Depth: 1.75 inches
Thickness (inches) Description of Material Lifts (inches) Condition
1.75 BST 1, 0.75 Fair
- Brown, silty GRAVEL with sand - Very dense
Remarks: No Crushed Rock Base Course was encountered.

Client: PacifiClean Environmental LLC
Project: Thorp Prairie Road Evaluation and Design
Project No.: 2012-105 Task No: 100
Date Sampled: November 26, 2012 Sampled by: DRC
Core Bit Used: 6-inch diameter
Sample Location: Thorp Prairie Road Station 45+00 Southbound Lane Core Designation: Core-3
Total Wearing Surface Depth: 2 inches
Thickness (inches) Description of Material Lifts
(inches) Condition
2 BST 0.5, 1.5 Fair
1 Crushed Surfacing Top Course - Dense
- Brown, silty GRAVEL with sand - Very dense
Remarks:

Client: PacifiClean Environmental LLC
Project: Thorp Prairie Road Evaluation and Design
Project No.: 2012-105 Task No: 100
Date Sampled: November 26, 2012 Sampled by: DRC
Core Bit Used: 6-inch diameter
Sample Location: Thorp Prairie Road Station 60+50 Southbound Lane
Core Designation: Core-4
Total Wearing Surface Depth: 1.75 inches
Thickness (inches) Description of Material Lifts
(inches) Condition
1.75 BST 0.75, 1 Fair
1.25 Crushed Surfacing Top Course - Dense
- Dark grayish brown silty Gravel with sand - Very dense
Remarks:

Client: PacifiClean Environmental LLC
Project: Thorp Prairie Road Evaluation and Design
Project No.: 2012-105 Task No: 100
Date Sampled: November 26, 2012 Sampled by: DRC
Core Bit Used: 6-inch diameter
Sample Location: Thorp Prairie Road Station 75+00 Northbound Lane Core Designation: Core-5
Total Wearing Surface Depth: 1.75 inches
Thickness (inches) Description of Material Lifts (inches) Condition
1.75 BST 1, 0.75 Fair
21 Silty SAND with gravel - Very dense Remarks: No Base Course was encountered Very dense clayey Gravel with sand was encountered at a depth of 23
inches.

Client: PacifiClean Environmental LLC
Project: Thorp Prairie Road Evaluation and Design
Project No.: 2012-105 Task No: 100
Date Sampled: November 26, 2012 Sampled by: DRC
Core Bit Used: 6-inch diameter Sample Location: Thorp Prairie Road Station 92+50 Southbound Lane
Core Designation: Core-6
Total Wearing Surface Depth: 2 inches
Thickness (inches) Description of Material Lifts (inches) Condition
2 BST 1, 1 Fair
5 Crushed Rock Base Course - Dense
- Reddish brown clayey GRAVEL with sand - Very dense
Remarks: