geotechnical characterization for seismic design: standard
TRANSCRIPT

Geotechnical Characterization for Seismic Design: Standard Penetration Testing and
Shear Wave Velocity ProfilesShear Wave Velocity Profiles
Brady R. Cox, Ph.D., P.E.Brady R. Cox, Ph.D., P.E.The University of Arkansas
Department of Civil Engineering
Geotechnical Earthquake Engineering for Seismic Design Workshop,
Department of Civil Engineering
Port-au-Prince, Haiti, November 18-19, 2010

Geotechnical Investigation: Standard Objectives • Determine the depth and thickness of soil layers (including depth
to bedrock if possible)
• Determine the location of the ground water table
• Obtain soil samples for testing
• Most common method used around the world is the Standard Penetration TestPenetration Test (SPT)
McCarthy

Standard Penetration Test (SPT): EquipmentDrill Rig
Coduto (2001)
S lit
Coduto (2001)
Split-spoon Sampler
5 OD
Coduto (2001)
5 cm OD3.5 cm ID

SPT: Procedure• Drill to the desired depth
• Drop a 63.5 kg mass on top of the drill rod from a height of 0.75 m
• Count the number of hammer blows to drive the split-spoon sampler 3 separate 15 cm intervals
• Sum of blows over the last 2 increments (i.e. the last 30 cm) is the “blow count” or N-value
C d t (2001)Coduto (2001)
• Stop if > 50 blows are needed for any 15 cm increment (refusal)
• Remove the split spoon and retrieve soil sample for characterization• Remove the split-spoon and retrieve soil sample for characterization
• Repeat the test at desired depth interval (typically every 1 – 1.5 m)

SPT: Example Boring Log
N = 11
N = 17
N = 16
N = 11

SPT: Example N-values

In-Situ Shear Wave Velocity (Vs) Measurements
• Earthquake damage is considered to be caused primarily by vertically propagating shear waves
• The velocity at which these shear waves travel through a given material (i e rock vs soil)through a given material (i.e. rock vs. soil) strongly influences the response of the material because V is directly related to shear modulusbecause Vs is directly related to shear modulus
• Therefore, a very important part of Geotechnical Earthquake Engineering is dynamic site characterization to obtain in-situ measurements of Vs
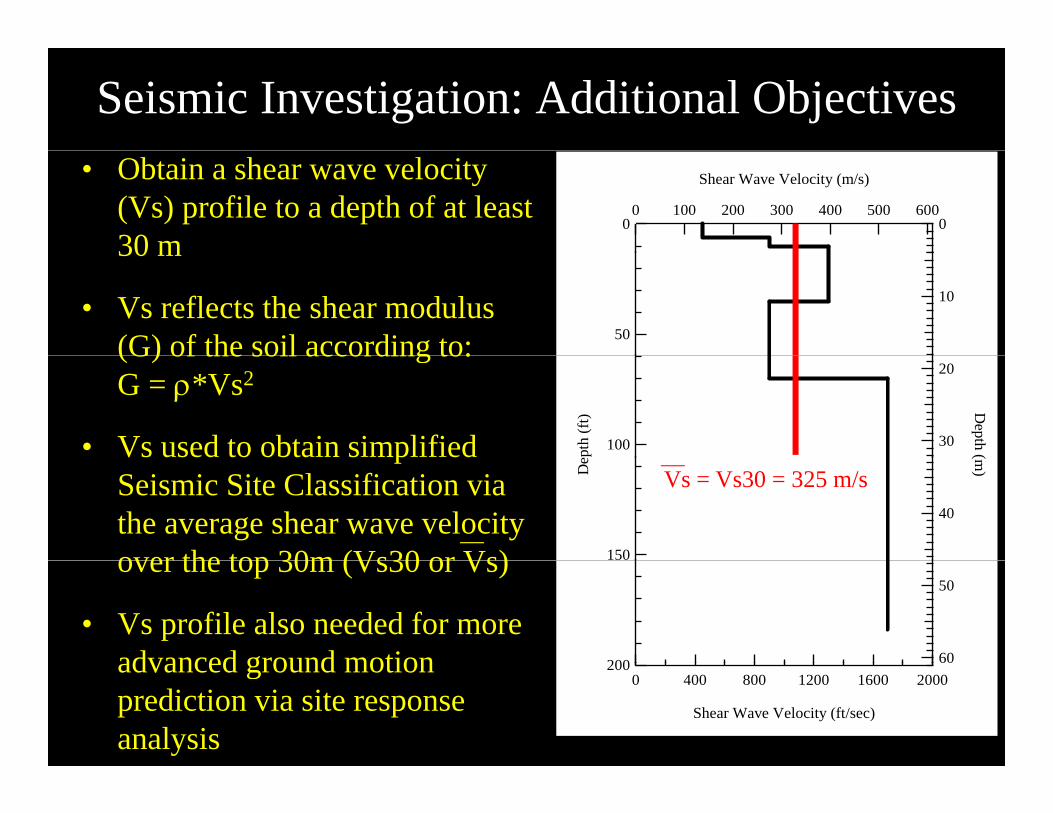
Seismic Investigation: Additional Objectives• Obtain a shear wave velocity
(Vs) profile to a depth of at least 30 m
0 06005004003002001000
Shear Wave Velocity (m/s)
30 m
• Vs reflects the shear modulus (G) of the soil according to: 50
10
(G) of the soil according to: G = *Vs2
• Vs used to obtain simplified 100
epth
(ft)
30
20
Depth (p
Seismic Site Classification via the average shear wave velocity over the top 30m (Vs30 or Vs) 150
De
40
(m)
Vs = Vs30 = 325 m/s
over the top 30m (Vs30 or Vs)
• Vs profile also needed for more advanced ground motion 200 60
50
advanced ground motion prediction via site response analysis
2002000160012008004000
Shear Wave Velocity (ft/sec)

In-Situ Shear Wave Velocity (Vs) Measurements
• Intrusive (Borehole Methods)C h l– Crosshole
– DownholeS i L i– Suspension Logging
• Non intr si e (S rface Wa e Methods)• Non-intrusive (Surface Wave Methods)– Spectral Analysis of Surface Waves (SASW)
Multi channel Analysis of Surface Waves (MASW)– Multi-channel Analysis of Surface Waves (MASW)– Refraction Microtremor (ReMi)

Crosshole: Setup and Equipment
Horizontal (H1)Geophone
H i t l (H2)
Horizontal (H1)Geophone
H i t l (H2)Horizontal (H2)Geophone
Vertical (V)Geophone
Horizontal (H2)Geophone
Vertical (V)Geophone
ReceiverCase
ReceiverCase
3D Receiver
Crosshole Hammer

Crosshole: Shear Wave Records2
Downward Impact Upward Impact
T i0
agni
tude
Trigger
Vertical Receiverin One Borehole
-2
orm
aliz
ed M
a in One Borehole
Vertical Receiverin Second Borehole
-4No
Denotes Arrival Time-6
0.0100.0080.0060.0040.0020.000-0.002
Time, sec
Denotes Arrival Time
t Vs = d / t = m/s

Crosshole: Vs Profile00
50
Thin Limestone
100
sure
men
t Dep
th, f
t Layer (?)
150
Mea
s
150
Site 2 Boreholes 41C-41A Crosshole 41C-41B Crosshole
2001000080006000400020000
SV-Wave Velocity, fps

Downhole: Setup and Equipment
BHG-3 Borehole Receiver
Borehole BH-4

Downhole: Setup and Equipment
Instrumented Sledgehammer
Shear WaveTraction Plank BHG-3
Control Box
LaptopDynamic
Si l A lSignal Analyzer

Downhole: Travel Time vs. Depth

Downhole: Vs Profile

Suspension Logging: Setup and Waveforms
Cable Head
7-Conductor cable
Diskette
OYO PS-160Logger/Recorder
Head Reducer
Upper Geophone
Winch
with Data
Lower Geophone
Filter Tube
Source
Source Driver
Weight
Overall Length ~ 25 ftOverall Length 25 ft
Depth Sequential Waveform ArrivalsCourtesy of GeoVision

Surface Wave MethodsVertically Oriented SourceVertically Oriented Source
SASW SetupReceiver 1 Receiver 2d d
(Impact, Random, or Steady-State Vibration) Receiver 1 Receiver 2d d
(Impact, Random, or Steady-State Vibration)
Vertically Oriented Velocity Transducers
Layer 1
Vertically Oriented Velocity Transducers
Layer 1
Multi-Layered SolidLayer 2
Multi-Layered SolidLayer 2
MASW Setup

SASW Equipment
Dynamic Signal Analyzer Geophones and Sledgehammer

MASW Equipment
12 – 60 Geophones
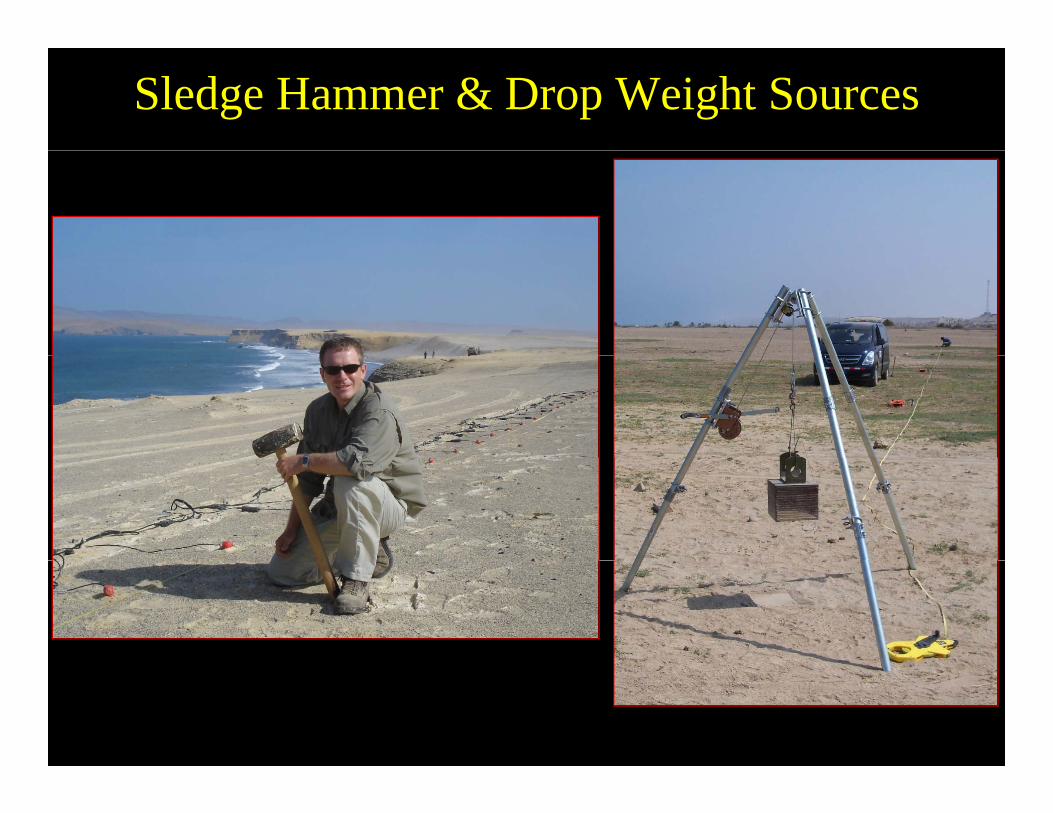
Sledge Hammer & Drop Weight Sources

Vibroseis Source

Surface Wave DispersionLow frequency
Layer 1Layer 1
VerticalParticle Motion
Vertical Particle Motion
1
Air
Layer 1Layer 1
VerticalParticle Motion
Vertical Particle Motion
1
Air
Layer 1Layer 1
VerticalParticle Motion
Vertical Particle Motion
1
Air
Low frequency surface waves have long wavelengths
Layer 2
Layer 1
Layer 2
Layer 12
1
Layer 2
Layer 1
Layer 2
Layer 12
1
Layer 2
Layer 1
Layer 2
Layer 12
1(), while high frequency waves have short
Depth Depth
Layer 3Layer 3
Depth Depth
Layer 3Layer 3
Depth Depth
Layer 3Layer 3wavelengths
W i h Depth Deptha. Material
Profilec. Longer
Wavelength, 2
b. Shorter Wavelength, 1
Depth Deptha. Material
Profilec. Longer
Wavelength, 2
b. Shorter Wavelength, 1
Depth Deptha. Material
Profilec. Longer
Wavelength, 2
b. Shorter Wavelength, 1
Waves with different frequencies/ qwavelengths sample different depths
Surface wave velocity (Vr) is close to shear wave velocity (Vs):Vs ~ 1.1*Vr

Example SASW Dispersion Curve
5000
Wavelength (m)1 10 100 1000
Experimental Disp. Curve
sec)
4000
/sec
)1200Receiver Spacings = 5, 10, 20, 25, 40, 50, 150, 300, 450, and 600 ft.
Velo
city
(ft/s
3000
Velo
city
(m/
800
Phas
e V
1000
2000
Phas
e V
400
1 10 100 1000 100000
1000
0
Wavelength (ft)1 10 100 1000 10000

Inversion to Obtain Vs ProfileWavelength (m)
c)
4000
50001 10 100 1000
c)
1200
Experimental Disp. CurveTheoretical Disp.Curve
Velo
city
(ft/s
ec
2000
3000
Velo
city
(m/s
ec
800 Shear Wave Velocity (ft/sec)0 2000 4000 6000 8000
Phas
e
1000
2000
Phas
e V
400
0
100
0
200
Wavelength (ft)1 10 100 1000 10000
0 0
epth
(m)
100
200
Dep
th (f
t)
400
600
D
300D
800
1000max/2
Shear Wave Velocity (m/sec)0 500 1000 1500 2000
1200

Seismic Site ClassificationRequired by Seismic Provisions in Building CodesRequired by Seismic Provisions in Building Codes
IBC (2009) ASCE 7-05
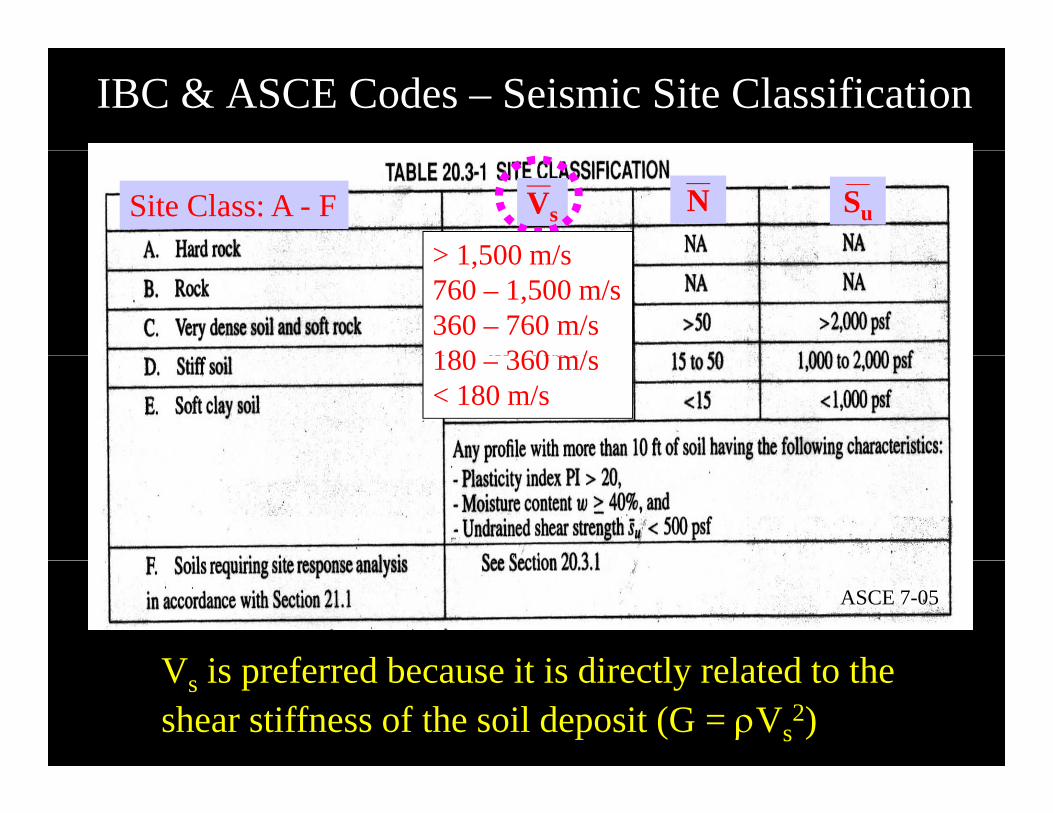
IBC & ASCE Codes – Seismic Site Classification
Vs N SuSite Class: A - F> 1 500 m/s> 1,500 m/s760 – 1,500 m/s360 – 760 m/s180 360 /180 – 360 m/s< 180 m/s
V i f d b it i di tl l t d t th
ASCE 7-05
Vs is preferred because it is directly related to the shear stiffness of the soil deposit (G = Vs
2)

Preview Importance of Seismic Site ClassificationIBC and ASCE Code – Design Response Spectra
Little Rock, Arkansas
Soft Soil (Site Class E)
AR
( )Horizontal Earthquake Force70% of the Structure Weight
Hard Rock (Site Class A)Horizontal Earthquake Force25% of the Structure Weight
0.2-sec(~ 2-story building)

Seismic Site Classification via Vs (i.e. Vs30)
ASCE 7-05

Example SitesShear Wave Velocity (m/s) Shear Wave Velocity (m/s)
0
5
02000150010005000
0
5
04003002001000
40
20
10
5
40
20
10
5
60
40
Dep
th (f
t)
20
15
Depth (m
) 60
0
Dep
th (f
t)
20
15
Depth (m
)
80 25
20
80 25
20
100
80006000400020000
30 100
160012008004000
30Vs = Vs30 = 1015 m/s Vs = Vs30 = 250 m/s
80006000400020000
Shear Wave Velocity (ft/sec)
160012008004000
Shear Wave Velocity (ft/sec)
Site Class B Site Class D

Seismic Site Classification via N
ASCE 7-05
Seismic site classification via blow count (N) is possible, but classification via Vs is preferred because Vs is a material property that stronglybecause Vs is a material property that strongly influences ground motions

Questions?Questions?