geotechnical engineering services · geotechnical engineering services ledgewood landslide...
TRANSCRIPT

Earth Science + Technology
Geotechnical Engineering Services
Ledgewood Landslide Evaluation Coupeville, Washington
for Island County Public Works
November 27, 2013

Geotechnical Engineering Services
Ledgewood Landslide Evaluation Coupeville, Washington
for Island County Public Works
November 27, 2013
600 Dupont Street Bellingham, Washington 98225
360.647.1510


November 27, 2013 | Page i File No. 0422-097-00
Table of Contents
EXECUTIVE SUMMARY ........................................................................................................................ ES-1
INTRODUCTION .......................................................................................................................................... 1
Background ............................................................................................................................................ 1
SCOPE OF SERVICES ................................................................................................................................. 3
Rapid Response Assessment ................................................................................................................ 3 Follow-Up Geologic Reconnaissance, Evaluation, and Preliminary Conclusions ............................... 3 Field Exploration and Laboratory Testing ............................................................................................. 4 Stability Analyses, Client Liaison and Public Meeting Attendance, Project Management, and Summary Report .................................................................................................................................... 6
2013 LEDGEWOOD LANDSLIDE DESCRIPTION AND CHRONOLOGY ...................................................... 6
Geologic Perspective ............................................................................................................................. 6 Ledgewood Landslide Chronology ........................................................................................................ 7 Observations and Response Actions .................................................................................................... 7
SITE CONDITIONS .................................................................................................................................... 11
General ................................................................................................................................................. 11 Surface Conditions ............................................................................................................................... 11
Topography .................................................................................................................................... 11 Vegetation ...................................................................................................................................... 12 Surface Hydrology ......................................................................................................................... 12
Geologic Setting ................................................................................................................................... 13 Subsurface Conditions ........................................................................................................................ 14
Subsurface Explorations and Laboratory Testing ....................................................................... 14 Subsurface Instrumentation ......................................................................................................... 14 Soil Conditions ............................................................................................................................... 14 Groundwater Conditions ............................................................................................................... 16
DISCUSSION AND ANALYSIS .................................................................................................................. 16
Ledgewood Landslide .......................................................................................................................... 17 North Driftwood Way Landslide ........................................................................................................... 18 LiDAR Survey Data ............................................................................................................................... 19 Inclinometer Data ................................................................................................................................ 19 Hydrology .............................................................................................................................................. 20 Slope Stability Modeling ...................................................................................................................... 20
Section E-E’: Ledgewood Landslide Mass .................................................................................. 22 Section C-C’: South of Ledgewood Landslide Mass ................................................................... 23 Section G-G’: North of Ledgewood Landslide Mass ................................................................... 23
CONCLUSIONS AND RECOMMENDATIONS ........................................................................................... 24
Factors Contributing to Ledgewood Landslide Slope Failure ............................................................ 24 Ledgewood Landslide Failure Sequence ............................................................................................ 25 Hazard Areas ........................................................................................................................................ 26
Ledgewood Landslide Mass and Slide Margins .......................................................................... 26

Page ii | November 27, 2013 | GeoEngineers, Inc. File No. 0422-097-00
Driftwood Way South of Ledgewood Landslide ........................................................................... 26 Driftwood Way North of Ledgewood Landslide ........................................................................... 27 North Driftwood Way Landslide Area ........................................................................................... 27 Fircrest Avenue above Driftwood Way ......................................................................................... 27
Recommendations ............................................................................................................................... 28
LIMITATIONS ............................................................................................................................................ 28
REFERENCES .......................................................................................................................................... 29
LIST OF FIGURES
Figure 1. Vicinity Map Figure 2. Generalized Geology and Landslide Map Figure 3. Site and Exploration Plan Figure 4. Referenced Residence Locations Figures 5 through 12. Subsurface Cross Sections Figure 13. LiDAR Image of Staged Failure Concept Figure 14. Island County Precipitation Data, Previous 113 Years Figure 15. Island County Precipitation Data, Previous 13 Years
APPENDICES
Appendix A. Field Explorations Figure A-1. Key to Exploration Logs Figure A-2 through A-9. Logs of Borings
Appendix B. Laboratory Testing Figure B-1 through B-14. Atterberg Limit Test Results Figure B-15 through B-24. Sieve Analysis Results
Appendix C. Field Instrumentation Figure C-1. Inclinometer Readings GEI-2 Figure C-2. Inclinometer Readings GEI-3 Fiugre C-3. Inclinometer Readings GEI-4
Appendix D. LiDAR Data Appendix E. Slope Stability Analyses Appendix F. Report Limitions and Guidelines for Use

LEDGEWOOD LANDSLIDE EVALUATION Whidbey Island, Washington
November 27, 2013 | Page ES-1 File No. 0422-097-00
EXECUTIVE SUMMARY
This report summarizes our preliminary geotechnical services related to a large landslide that occurred in March 2013 in the Ledgewood Beach area on the west shoreline area of Whidbey Island, south and east of Coupeville (Figure ES-1). The purpose of this report is to analyze the landslide, evaluate the risk of additional landslide movement, and recommend further monitoring of the slide area.
The recent landslide, referred to throughout this report as the “Ledgewood Landslide”, enlarged the limits of the previously active “Driftwood Way Landslide” that has been active intermittently for several decades. Another active slide area is located approximately 1,200 feet north of the Ledgewood Landslide and is referred to throughout this report as the “North Driftwood Way Landslide.” These landslides are part of a larger ancient landslide complex that approaches a mile in length, portions of which have been intermittently active for several thousand years. The generalized location and extent of the ancient landslide complex, the Ledgewood Landslide, the Driftwood Way Landslide, and the North Driftwood Way Landslide are shown in Figures ES-2 and ES-3.
This report presents background information on the Ledgewood Landslide and vicinity, a discussion of historical information and references, a description of the recent Ledgewood Landslide event, a discussion of surface and subsurface site conditions (including explorations and data obtained during the evaluation period), and our geotechnical conclusions to date. GeoEngineers completed eight exploratory borings in May and June 2013, ranging in depth from 111 to 281 feet below ground surface (bgs) and extending as deep as Elevation -90 feet. The general locations of the explorations are shown on Figure ES-3. Field instrumentation included installation of vibrating wire piezometers (VWPs) in all but one boring for measurement of groundwater conditions, inclinometers in three borings to measure future ground deformations, and one “poor boy” inclinometer that can be used to determine groundwater levels and ground deformations. New LiDAR data were also obtained and interpreted for this evaluation.
The ancient landslide in this area likely initiated in response to shoreline erosion following deglaciation, which occurred over 10,000 years ago. After land development within the landslide complex began in the 1960s, slides have occurred along the downset block that includes the Driftwood Way roadway and Ledgewood Beach Plat residences. In the late 1980s, two homes were destroyed or abandoned because of ground movement associated with the North Driftwood Way Landslide. No homes were located on the previously active Driftwood Way Landslide at the time of the Ledgewood Landslide event. The recent Ledgewood Landslide, which involved all of the historic Driftwood Way Landslide mass and expanded considerably to the east and south, displaced one residence approximately 150 feet horizontally toward Admiralty Bay with about 40 feet of vertical drop. Driftwood Way, which provided access to 14 homes south of the slide, was destroyed by the landslide. In addition, Island County restricted access to two Fircrest Avenue residences and three Driftwood Way residences along the margins of the slide because of life safety considerations.
The magnitude of the recent landslide event is unprecedented in recent history and represents one of the largest landslide events in the recorded history of the Puget Sound area. Although previous investigations and reports acknowledged the presence of the ancient landslide complex, and the
LEDGEWOOD LANDSLIDE EVALUATION Whidbey Island, Washington
Page ES-2 | November 27, 2013 | GeoEngineers, Inc. File No. 0422-097-00
possibility of future movement on the Driftwood Way Landslide, none of the previous studies concluded or predicted that a progression or expansion of the landslide was likely to occur on the scale observed.
Based on our evaluation of available information, interpretation of new subsurface data, and the results of our slope stability analyses, it is our opinion that the Ledgewood Landslide occurred as a multi-stage, compound slide. The slide likely began with reactivation of the Driftwood Way Landslide with a toe rotation, followed by lateral/translational slide movement toward the beach in the northern portion of the slide mass. The unusually large movement and reactivation of the Driftwood Way Landslide allowed the slide to progress upslope of the ancient landslide headscarp into yard areas of homes along Fircrest Way, with further expansion and progression to the south. The ground movements turned the saturated slide debris within at least the southern portion of the slide mass into a flow-type failure that completely destroyed Driftwood Way, displaced the only residence located within the slide mass, and overrode the initial rotated toe block.
Many different triggers contributed to instability of the Ledgewood Landslide, and it was likely the compound effects of multiple factors that ultimately triggered the slide. We determined the following most likely factors contributing to slope failure:
■ Presence of pre-existing slide planes with low strength and preferential failure surfaces.
■ Possible buildup of groundwater levels and hydrostatic pressure as a result of the accumulation of colluvium/slide debris on top of the older slide mass, which may have impeded groundwater seepage at the headscarp area. This potential buildup of groundwater levels upslope of the slide mass is supported by the observation of significant groundwater seepage in the headscarp area for several weeks following the slide.
■ Erosion at the toe of the slide area occurred regularly from winter storm events, particularly during combined high tide and storm events during the 2012/2013 winter.
■ High seasonal precipitation and cumulative precipitation that resulted in increased surface water infiltration, high volumes of surface runoff, unusually high groundwater levels, and increased seepage quantities into the overall slide mass. Most of the large slide events have been recorded in February and March suggesting groundwater is a significant factor.
■ Presence of high plasticity silt and clay units with blocky/sheared surfaces interpreted to be older (ancient) slide planes.
■ A localized drainage swale overlying with recessional outwash is located at the headscarp of the Ledgewood Slide. Perched groundwater would be expected within these outwash soils that overlie dense glacial soils.
The following summarizes our opinions and recommendations related to the relative hazard in various areas of the Ledgewood Beach Plat and future actions:
■ The Ledgewood Landslide mass is at high risk of saturation and future movement, especially during the 2013/2014 winter season. No development, including reconstruction of Driftwood Way, should be allowed in this area unless supported by monitoring results and

LEDGEWOOD LANDSLIDE EVALUATION Whidbey Island, Washington
November 27, 2013 | Page ES-3 File No. 0422-097-00
engineering analysis for adequate stability. Because of proximity to the edges of the new slide, areas at the margins of the Ledgewood Landslide are at increased risk of movement.
■ The residences along Driftwood Way are primarily at risk of slope movements associated with the over-steepened beach bluff, similar to conditions that existed before movement of the Ledgewood Landslide.
If significant slide movement is activated (triggered) along the beach bluff below Driftwood Way south of the Ledgewood Landslide, the results of our analyses indicate that the failure could extend to at least 40 feet back from the top of the beach bluff. The predicted failure surfaces do not include a large global failure of the entire Driftwood Way area.
If significant slide movement is activated (triggered) along the bluff below Driftwood Way north of the Ledgewood Landslide, the results of our analyses indicate that a failure similar to the Ledgewood Landslide could progress to the headscarp of the ancient landslide complex. It is possible that a more sudden movement or slide event could occur at this location because of the larger driving forces associated with the site geometry in this area. Access from Seaward Way could be at least partially inhibited from a larger slope failure.
We conclude that homes along Fircrest Avenue are not at an increased risk beyond what was present prior to the Ledgewood Slide, with the exception of those impacted by the recent slide.
■ We recommend that the results of this evaluation be made available to local residents. The homeowners along Driftwood Way should diligently monitor conditions for changes on their properties and along access roadways.
■ We recommend that ICPW implement a monitoring plan that includes regularly scheduled readings of the inclinometers installed during this evaluation, accompanied by visual surveys of the roads, and monitoring of the VWPS and poor boy inclinometer. This data should be used to evaluate future response actions related to life safety and maintenance.
This executive summary presents an overview of the March 2013 Ledgewood Landslide conditions and events, and our related services including preliminary evaluation, conclusions and recommendations. This summary is presented for introductory purposes only and should be used in conjunction with the complete text of this report.
LIST OF FIGURES
Figure ES-1. Vicinity Map Figure ES-2. Generalized Geology and Landslide Map Figure ES-3. Site and Exploration Plan

Fircrest Ave
Donahey Rd
Don
na
Dr
Ba
njo
Dr
Mitchell Dr
Virg
inia A
ve
Gramayre Rd
N Bluff Rd
Tero
nda
Dr
Bon Air Dr
Pin
ecr
est
Ave
Driftw
ood
Way
Puget Dr
Cox Dr
Houston Rd
Driftw
ood Ln
Inve
rne
ss Wa
yS
eac
rest
Ln
Ellwood Dr
Ced
arc
rest
Ave
Se
aview A
ve
Rovig
Pl
Hocker St
Nara Ln
Tero
nda
Be
ach
Rd
Glenmoore Ln
E Greenwood Pl
Seaward Way
UV525
µ
SITE
Vicinity Map
Figure ES-1
Ledgewood Landslide EvaluationWhidbey Island, Washington
!
Snohomish
IslandJeffersonClallam
Ebeys Landing Natl Hist ResEbeys Landing Natl Hist Res
2,000 2,0000
Feet
Data Sources: ESRI Data & Maps
Notes:1. The locations of all features shown are approximate.2. This drawing is for information purposes. It is intended to assist in
showing features discussed in an attached document. GeoEngineers, Inc. can not guarantee the accuracy and content of electronic files. The master file is stored by GeoEngineers, Inc. and will serve as the official record of this communication.
3. It is unlawful to copy or reproduce all or any part thereof, whether for personal use or resale, without permission.
Projection: NAD 1983 UTM Zone 10N
Pat
h: P
:\0\
04
2209
7\G
IS\M
XD
\042
2097
00_
Vic
inity
Ma
p.m
xd
Ma
p R
evis
ed:
25
Oct
obe
r 2
013
tn
ash

;
;
;
;
;
;
;
;
;
;
;
;
;
;
;
;
;
;
;
;
;
;
;
;
;
;
;
;
Ledgewood Beach Plat
Ancient Landslide Complex
North Driftwood Way Landslide Area
Ledgwood Landslide Area
Driftwood Way Landslide Area
Bon AirPlat
Qgtwtr
wtr
Qls
Qgo
Qb
Qgas
Qp
Qf
Qls
Qc
Qgpc
Qgpc
Qgpc
Copyright:© 2013 National Geographic Society, i-cubed
µ1,250 1,2500
Feet
Off
ice
: B
AM
P
ath
: P
:\0
\04
22
097
\GIS
\MX
D\G
eo
log
y.m
xd
M
ap
Re
vise
d: 1
0/2
5/2
01
3
m
tro
ost
Generalized Geology and Landslide Map 1:100,000
Ledgewood Landslide EvaluationWhidbey Island, Washington
Figure ES-2
Department of Natural ResourcesMapped Ledgwood Landslide -Per Quick Report dated March28, 2013
Notes:1. The locations of all features shown are approximate. 2. This drawing is for information purposes. It is intended to assist in showing features discussed in an attached document. GeoEngineers, Inc. cannot guaranteethe accuracy and content of electronic files. The master file is stored by GeoEngineers, Inc. and will serve as the official record of this communication. 3. It is unlawful to copy or reproduce all or any part thereof, whether for personal use or resale, without permission.Data Sources: Geology WADNR 1:100,000. State Plane Washington North FIPS 4601 (Feet), North American Datum 1983. North arrow oriented to grid north.
Southern Whidbey Island
Fault Zone
North Driftwood Way Slide Area
Previously Active Driftwood Way Slide Area
Qls - Landslide Deposits
Qgpc - Continental Glacial Drift
Qgo - Continental Glacial Outwash
Qc - Continental Sedimentary Deposits
Qp - Peat
Qgt - Glacial Till


LEDGEWOOD LANDSLIDE EVALUATION Whidbey Island, Washington
November 27, 2013 | Page 1 File No. 0422-097-00
INTRODUCTION
This report summarizes our preliminary geotechnical services related to a large landslide that occurred in March 2013 in the Ledgewood Beach area south and east of Coupeville on Whidbey Island, Washington. The generalized location of the landslide site is shown in the Vicinity Map, Figure 1. The purpose of this report is to analyze the landslide, evaluate the risk of additional landslide movement, and recommend further monitoring of the slide area.
The recent large landslide, referred throughout this report as the “Ledgewood Landslide”, occurred west of Fircrest Avenue and extended into Admiralty Inlet, displacing the residence located at 1968 Driftwood Way approximately 150 feet to the west. Several other residences on the margin of the slide were impacted or threatened by ground movements; evacuation notices were attached to these homes for safety purposes. The Ledgewood Landslide involved and encompasses a previous landslide area that had been active intermittently for several decades. The previous slide is referred to throughout this report as the “Driftwood Way Landslide.” Another active slide area is located 1,200 feet north of the Ledgewood Landslide and is referred to throughout this report as the “North Driftwood Way Landslide.”
The Ledgewood Landslide is part of a larger ancient landslide complex, portions of which have been intermittently active for several thousand years. The generalized location and extent of the mapped ancient landslide complex, the Ledgewood Landslide, Driftwood Way Landslide, and the North Driftwood Way Landslide are shown in Figures 2 and 3.
This report presents background information on the Ledgewood Landslide and vicinity, a discussion of historical information and references, description of the recent Ledgewood Landslide event, discussion of site conditions including explorations and data obtained during the evaluation period, and our geotechnical conclusions to date. The Ledgewood Landslide is expected to remain active, especially during the 2013/2014 winter months, as the toe of the slide is further eroded and the slide mass becomes saturated. Instrumentation installed during subsurface exploration of the Ledgewood Landslide will continue to be monitored so that additional data can be obtained and the level of activity of the landslide mass further evaluated. This data, along with local observations of site conditions within and near the Ledgewood Landslide, will help Island County Public Works (ICPW) and local residents respond as conditions change. Supplemental conclusions and recommendations may be developed as site conditions change and additional information becomes available.
Background
We understand that the Ledgewood Beach Plat was filed in the 1960s. The plat was approved prior to current land use practices and regulations that consider proximity and impacts of landslides. The western portions of the Ledgewood Beach Plat and the Bon Air Plat to the south are located within an ancient landslide complex, which extends significantly farther north and south of the plats, as shown in Figure 2. This landslide complex is shown in references (Ecology, 1977; Pessl et al., 1989; and Polenz et al., 2009) as a combination of older historic slides and some recent slide areas. The Lower Ledgewood portion of the Ledgewood Beach Plat, including Driftwood Way, is built within the ancient landslide complex, with homes and infrastructure supported on slide debris. The Upper Ledgewood portion of the Ledgewood Plat,

LEDGEWOOD LANDSLIDE EVALUATION Whidbey Island, Washington
Page 2 | November 27, 2013 | GeoEngineers, Inc. File No. 0422-097-00
including Fircrest Avenue residences and areas farther east, is outside and above (east of) the mapped ancient landslide area.
Our understanding of the landslide history in the Ledgewood area is based on review of communications and geotechnical reports as listed in the “References” section of this report. Landslides have been reported along the Lower Ledgewood Beach area since at least the 1970s and several homes have been lost from past slide events. Some of the slides were reported as relatively shallow, while two active slide areas have been much larger, as described below.
■ The recent Ledgewood Landslide involved the previously active Driftwood Way Landslide mass plus an additional area to the east and south (Figures 2 and 3). The previously active slide mass included Lots 1 through 6, Block 8, and the northern portion of Block 7, Division 2 of the Ledgewood Beach Plat (Thorsen, 1991; Golder, 1998). The previously active Driftwood Way Landslide mass involved approximately 250 to 300 feet of the Driftwood Way road alignment.
■ The North Driftwood Way Landslide (Figures 2 and 3) is approximately 1,200 feet north of the Ledgewood Landslide. The North Driftwood Way Landslide mass includes Lots 1 through 3, Block 1, Division 1 of the Ledgewood Beach Plat (Golder, 1991, 1996). This slide has involved approximately 110 feet of the North Driftwood Way (aka Driftwood Lane) roadway. Two homes located between the beach and North Driftwood Way were destroyed by the slide in the late 1980s/early 1990s. Based on our reconnaissance and research, we understand that this slide area was “quiet” for about 8 to 10 years, then some movement reinitiated last year as several episodic movements that required roadway repairs.
■ Both of these active slide areas extend down into the beach area of Admiralty Inlet, across Driftwood Way. ICPW crews have repaired Driftwood Way across these active slide areas numerous times to keep the roadway open. Previous geotechnical evaluations included deep borings with instrumentation and determined that the base of these two slides was on the order of 20 to 40 feet below the ground surface (bgs).
The recent Ledgewood Landslide enlarged the limits of the previously active Driftwood Way Landslide to include approximately 700 feet of Driftwood Way. GeoEngineers was engaged by ICPW on the morning of the slide to observe the landslide conditions and to assist in developing recommendations for emergency actions. We visited the Ledgewood Landslide area on multiple occasions as part of our rapid response assessment to this event. During our initial site visits we performed a preliminary reconnaissance of the limits of the landslide, monitored ongoing changes to affected areas, evaluated life-safety considerations for local residences, and assisted in developing short-term responses to the slide event. We prepared several documents for ICPW prior to issuing this current document: Preliminary Report dated March 29, 2013; Status Update Memorandum dated April 12, 2013; Memorandum for Reference Lines and Locations dated April 15, 2013; and two separate memoranda related to specific residences along Driftwood Way affected by the slide. Ledgewood Landslide Scarp March 27, 2013

LEDGEWOOD LANDSLIDE EVALUATION Whidbey Island, Washington
November 27, 2013 | Page 3 File No. 0422-097-00
Geologists representing the Washington State Department of Natural Resources (DNR) have visited the Ledgewood Landslide area for geologic reconnaissance. DNR also contributed significant funding to support subsurface exploration and mapping of the slide area. The Washington State Department of Ecology (Ecology) has developed offshore bathymetry of the landslide toe area. Several public meetings have been conducted during which the landslide conditions and the status of landslide investigations have been presented to the public.
SCOPE OF SERVICES
The purposes of GeoEngineers’ services include exploring surficial and subsurface conditions in the Ledgewood Landslide area and immediate vicinity as a basis for evaluating the slide geometry and failure mechanism(s), evaluating risks to life-safety and public property, and providing conclusions and recommendations for future response actions by ICPW. The individual tasks are broken out for ease of discussion. The approximate locations of the referenced borings are shown in the Site and Exploration Plan, Figure 3.
Rapid Response Assessment
This task included emergency response to the landslide and associated activities during the first three days following the landslide. The services in this task were completed between March 27 and March 29, 2013 and included the following:
■ At the request of Bill Oakes, performed an initial rapid response assessment site visit on March 27, 2013 and coordinated initial response actions with ICPW and emergency management agencies.
■ Reviewed available geologic references, topographic maps, historical aerial photographs and LiDAR images taken prior to the Ledgewood Landslide.
■ Participated in a site walkthrough with ICPW staff and attended a public meeting on March 29, 2013.
■ Provided a written letter report dated March 29, 2013 with our preliminary conclusions and recommendations for site safety based on our review of available information and site reconnaissance.
Follow-Up Geologic Reconnaissance, Evaluation, and Preliminary Conclusions
This task included follow-up review of available relevant historical information, client liaison, coordination and completion of supplemental site reconnaissance, and site monitoring. The specific residential properties identified in this discussion identified by addresses in Figure 4. The services in this task were completed between March 30 and April 14, 2013 and included the following:
■ Performed a detailed site reconnaissance on April 1, 2013 with a Senior Geotechnical Engineer and Senior Engineering Geologist to evaluate the slide mass and surrounding areas within the landslide complex.

LEDGEWOOD LANDSLIDE EVALUATION Whidbey Island, Washington
Page 4 | November 27, 2013 | GeoEngineers, Inc. File No. 0422-097-00
■ Reviewed previous documentation, geotechnical reports and other data relevant to the slide area and made available by ICPW. The list of materials reviewed is presented at the end of this report.
■ Completed conceptual slope stability analyses based on observed geometries and assumptions with regard to subsurface soil and groundwater conditions.
■ Completed a site reconnaissance by our lead Principal and ICPW staff on April 10, 2013 and prepared a Status Update Memorandum dated April 12, 2013
■ Completed a site reconnaissance of the beach at the toe of the landslide during a low tide on April 14, 2013, and established reference line locations for tracking the upper bluff retreat rate.
■ Reviewed LiDAR data from a flight three days after the slide occurrence, and compared post-landslide LiDAR data to pre-slide LiDAR data made available by ICPW.
■ Completed internal (GeoEngineers) and external (ICPW) coordination, consultation and preliminary evaluation regarding landslide conditions and the potential for future landslide movements.
Field Exploration and Laboratory Testing
This multi-phase task included planning, coordination, and completion of all the subsurface explorations and testing for the landslide evaluation. DNR contributed significant funding toward the field investigation, instrumentation, laboratory testing, and supplemental LiDAR data. The approximate locations of the referenced borings are shown in Figure 3. All elevations presented in this report are NAVD 88 unless otherwise described. The services in this task were completed primarily between April 14, 2013 and June 30, 2013 and included the following:
■ Initially explored soil and groundwater conditions east of the headscarp of the Ledgewood Landslide by drilling a single Sonic boring (GEI-1) in the right-of-way (ROW) in front of the residence at 1934 Fircrest Avenue using a subcontracted, truck-mounted Sonic drill rig. The boring was advanced to a final depth of 281 feet bgs (approximately Elevation -53.5 feet).
Sonic drilling produced a continuous core of soil materials encountered in the borehole. The cores were field logged and sampled, labeled, photographed, placed in labeled wood boxes for internal review, and coordinated with DNR for transport and storage at the DNR warehouse.
Installed three vibrating wire piezometers (VWPs) at elevations where groundwater was encountered or of interest.
■ Because the Ledgewood Landslide mass was initially too unstable to access, we explored soil and groundwater conditions Sonic Drill setup on Fircrest Avenue.
LEDGEWOOD LANDSLIDE EVALUATION Whidbey Island, Washington
November 27, 2013 | Page 5 File No. 0422-097-00
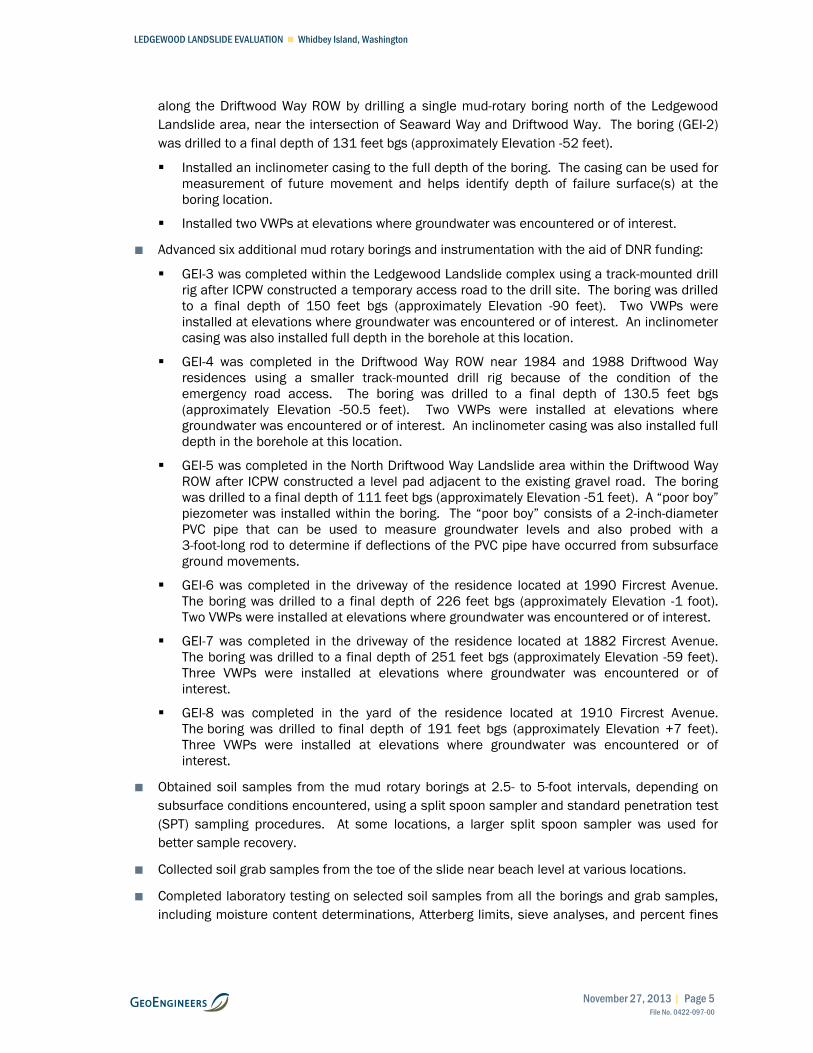
along the Driftwood Way ROW by drilling a single mud-rotary boring north of the Ledgewood Landslide area, near the intersection of Seaward Way and Driftwood Way. The boring (GEI-2) was drilled to a final depth of 131 feet bgs (approximately Elevation -52 feet).
Installed an inclinometer casing to the full depth of the boring. The casing can be used for measurement of future movement and helps identify depth of failure surface(s) at the boring location.
Installed two VWPs at elevations where groundwater was encountered or of interest.
■ Advanced six additional mud rotary borings and instrumentation with the aid of DNR funding:
GEI-3 was completed within the Ledgewood Landslide complex using a track-mounted drill rig after ICPW constructed a temporary access road to the drill site. The boring was drilled to a final depth of 150 feet bgs (approximately Elevation -90 feet). Two VWPs were installed at elevations where groundwater was encountered or of interest. An inclinometer casing was also installed full depth in the borehole at this location.
GEI-4 was completed in the Driftwood Way ROW near 1984 and 1988 Driftwood Way residences using a smaller track-mounted drill rig because of the condition of the emergency road access. The boring was drilled to a final depth of 130.5 feet bgs (approximately Elevation -50.5 feet). Two VWPs were installed at elevations where groundwater was encountered or of interest. An inclinometer casing was also installed full depth in the borehole at this location.
GEI-5 was completed in the North Driftwood Way Landslide area within the Driftwood Way ROW after ICPW constructed a level pad adjacent to the existing gravel road. The boring was drilled to a final depth of 111 feet bgs (approximately Elevation -51 feet). A “poor boy” piezometer was installed within the boring. The “poor boy” consists of a 2-inch-diameter PVC pipe that can be used to measure groundwater levels and also probed with a 3-foot-long rod to determine if deflections of the PVC pipe have occurred from subsurface ground movements.
GEI-6 was completed in the driveway of the residence located at 1990 Fircrest Avenue. The boring was drilled to a final depth of 226 feet bgs (approximately Elevation -1 foot). Two VWPs were installed at elevations where groundwater was encountered or of interest.
GEI-7 was completed in the driveway of the residence located at 1882 Fircrest Avenue. The boring was drilled to a final depth of 251 feet bgs (approximately Elevation -59 feet). Three VWPs were installed at elevations where groundwater was encountered or of interest.
GEI-8 was completed in the yard of the residence located at 1910 Fircrest Avenue. The boring was drilled to final depth of 191 feet bgs (approximately Elevation +7 feet). Three VWPs were installed at elevations where groundwater was encountered or of interest.
■ Obtained soil samples from the mud rotary borings at 2.5- to 5-foot intervals, depending on subsurface conditions encountered, using a split spoon sampler and standard penetration test (SPT) sampling procedures. At some locations, a larger split spoon sampler was used for better sample recovery.
■ Collected soil grab samples from the toe of the slide near beach level at various locations.
■ Completed laboratory testing on selected soil samples from all the borings and grab samples, including moisture content determinations, Atterberg limits, sieve analyses, and percent fines

LEDGEWOOD LANDSLIDE EVALUATION Whidbey Island, Washington
Page 6 | November 27, 2013 | GeoEngineers, Inc. File No. 0422-097-00
determinations. Soil strength testing was not possible because of the very high density of the soils and sample disturbance.
■ Prepared detailed geotechnical logs of the explorations.
■ Subcontracted LiDAR at low tide on June 22, 2013 along the shoreline of the Ledgewood Landslide area (DNR funded) for comparison with the LiDAR completed shortly after the slide.
■ Coordinated provenance interpretation for some of the sand units by DNR. Samples from several different sand units from different borings and elevations were submitted to DNR to assist with correlation of geologic units.
■ Coordinated clay mineralogy testing for some of the clay units by University of Washington. Results are not available at this time.
■ Reviewed bathymetry data developed by Ecology shortly after the slide.
ICPW provided access coordination and construction, traffic control, and installation of subsurface piping and vaults for all the explorations. ICPW also obtained data from the VWPs for our interpretation and inclusion into the analysis of subsurface conditions.
Stability Analyses, Client Liaison and Public Meeting Attendance, Project Management, and Summary Report
We evaluated the data as it became available during the project and provided conclusions and recommendations for life safety and response actions as information was developed. Once subsurface exploration started, we performed slope stability analyses based on the soil and groundwater conditions encountered and interpreted. We modeled existing site topography and geology and compared post-slide conditions to those observed and documented in previous reports completed along Driftwood Way. We communicated our findings frequently with Island County, attended follow-up meetings with ICPW, and participated in public meetings with local residents. We also provided conclusions and recommendations as requested regarding status of occupancy/access to the local residences that have been, or were concluded to be potentially at risk of damaged by landslide activity during the next wet season.
2013 LEDGEWOOD LANDSLIDE DESCRIPTION AND CHRONOLOGY
Geologic Perspective
Shorelines along Puget Sound that are exposed to significant wind waves (such as the west side of Whidbey Island) have been eroding continuously since sea level reached approximately its current level about 5,000 years ago. Steep shoreline bluffs are the physical expression of ongoing, long-term shoreline erosion in coastal areas of Puget Sound. In some shoreline areas of Whidbey Island (such as the bluff west of Ebey’s Landing), the local geology consists mainly of well drained sand and gravel deposits. Shoreline recession in this type of geologic setting is somewhat continuous and of small scale, resulting in relatively uniform bluff slopes at the angle of repose (approximately 34 degrees).
In other shoreline areas of Whidbey Island, such as the Ledgewood Landslide area, well-drained soil units are interbedded with fine-grained deposits like silt, clay and dense glacial till.

LEDGEWOOD LANDSLIDE EVALUATION Whidbey Island, Washington
November 27, 2013 | Page 7 File No. 0422-097-00
Groundwater tends to accumulate above the fine-grained soil units. Shoreline erosion in these areas of more complex geology results in over-steepened bluff slopes that fail episodically as translational or rotational landslide blocks.
The Ledgewood Landslide area likely has been eroding and experiencing intermittent landslides for several thousand years. Hundreds of years may pass between major landslide events, until shoreline erosion and groundwater conditions combine to create slope instability. The most recent landslides in the Ledgewood area represent continuation of a natural process that has been ongoing for centuries and will continue into the future.
Ledgewood Landslide Chronology
The following is a summary of the chronology of the slide and related events that have occurred up to the time of publishing this report (see Figure 4 for referenced residence locations):
■ As previously mentioned, movement of Driftwood Way Landslide at the north end of the Ledgewood Landslide area has occurred frequently, typically seasonally in February or March. The most recent movement of the Driftwood Way Landslide was noted on Friday, March 22, 2013 (five days before initiation of the much larger Ledgewood Landslide). The road surface of Driftwood Way is reported to have dropped about 2 feet over the weekend of March 23/24. ICPW roadway crews regraded the affected portion of Driftwood Way through this area, and also the North Driftwood Way Landslide area on Monday and Tuesday, March 25 and March 26, 2013.
■ The resident at 1968 Driftwood Way (the residence that was displaced 150 feet during the Ledgewood Landslide event) began hearing “cracking” noises in the late evening hours of March 26, then was awakened in the early morning hours (reportedly about 2:30 a.m.) on March 27 by additional noise related to the beginning of major slide movements. He attempted to leave the area by driving north on Driftwood Way, but the road to the north of his residence had disappeared. He backed his vehicle south from his residence along Driftwood Way to a safe area while trees and slope near his residence continued to move downslope. (Note: The residence at 1968 Driftwood Way was relocated on the lot and re-supported in October 2012 after an earlier episode of ground movement.)
■ Slightly more than an hour later (reportedly about 3:30 to 3:45 a.m.), the resident at 1934 Fircrest Avenue (Upper Ledgewood Area) was awakened by noise related to the slide. At this point, significant movement along Driftwood Way had likely occurred involving most of the lower portion of the slide mass. The resident reportedly went out in his yard, went back into his house to get new batteries for his flashlight, and part of his backyard was gone when he returned to investigate.
Observations and Response Actions
The following is a summary of observations and emergency response actions following the initial reporting of the slide on March 27.
■ GeoEngineers performed a brief reconnaissance of the affected area on March 27, 2013 accompanied with ICPW personnel to document and address life-safety considerations for local

LEDGEWOOD LANDSLIDE EVALUATION Whidbey Island, Washington
Page 8 | November 27, 2013 | GeoEngineers, Inc. File No. 0422-097-00
residences. The following is a summary of observations and actions resulting from that initial site visit:
The recent landslide produced a new approximately 600-foot-long scarp at the head of the slide mass (west of Fircrest Avenue and generally parallel to Driftwood Way). The slide resulted in about 150 feet of westward lateral movement along Driftwood Way, with approximately 40 feet of drop that included the residence located at 1968 Driftwood Way. The slide debris extended approximately 250 feet into Admiralty Inlet with an estimated 20 to 30 feet of debris/uplift at the toe of the slide. The residence located at 1968 Driftwood Way was “Red Tagged” by Island County because access to the slide mass and residence was deemed unsafe.
The slide resulted in an approximate 100-foot-high, near vertical scarp along the backyards of several residences along Fircrest Avenue. Based on comparison of photos before and after the slide, it is estimated that a maximum of about 30 to 40 feet of backyard area was lost at 1934 and 1944 Fircrest Avenue.
Anecdotal evidence collected after the landslide suggests that the water line located in the swale between 1934 and 1944 Fircrest Avenue broke and released a significant quantity of water near the time of the slide. It is uncertain as to the quantity of water (but may have been on the order of 60,000 gallons), and timing of the release (before, during, or after the Ledgewood Slide). The broken pipe appears to be evident in the above photograph.
Following slide movement, the setback from the back of residences to the headscarp of the slide was about 25 to 30 feet at 1944 Fircrest Avenue and 50 to 60 feet at 1934 Fircrest Avenue. It was our opinion that the proximity and height of the headscarp and continued movement at the slide represented a significant life-safety risk at these two residences. We recommended to Island County that these two houses be “Yellow Tagged” to limit entry to these properties to daylight hours for retrieval of belongings, and only with monitoring of the surrounding area. The Yellow Tags were placed the day of the slide, on March 27, 2013.
Headscarp exposing geology behind residence at 1944 Fircrest Avenue.

LEDGEWOOD LANDSLIDE EVALUATION Whidbey Island, Washington
November 27, 2013 | Page 9 File No. 0422-097-00
On the order of 10 to 20 feet or less of bluff was lost during this event along the west side of several other Fircrest Avenue properties. The post-landslide setback distances for other residences were on the order of 100 to 135 feet. No tension cracks, down-dropped blocks, offset, or other evidence of movement was readily apparent along Fircrest Avenue or in the backyards of the residences north and south of 1934/1944 Fircrest Avenue. At the time of the March 27 site reconnaissance, the headscarp continued to spall in small pieces (several cubic feet at a time). No additional emergency response actions were deemed appropriate for Fircrest residences at that time.
The lateral margins of the slide were generally well defined by the magnitude of soil movement and recent ground disturbance. We observed some shoving and high-angle splayed cracking in the landslide at the north and south margins of the slide area and in the toe area near the shoreline.
Two properties located south of the dislocated section of Driftwood Way were impacted by ground movements from the landslide. A large crack and downset block was observed immediately adjacent to the deck and approximately 12 feet from the northwest corner of the residence at 1984 Driftwood Way. The crack continued south and parallel to the shoreline below the 1984 Driftwood Way residence, and was traced below the 1988 Driftwood Way residence. We recommended to Island County that these two houses be Yellow Tagged to limit entry to these properties to daylight hours for retrieval of belongings, and only with monitoring of the surrounding area. The Yellow Tags were placed in the first days following the slide.
A property at 1914 Driftwood Way located north of the dislocated section of Driftwood Way was impacted by slide movements. Small splays of cracking were observed from the driveway to this residence, extending behind (upslope) of the shed and likely behind the residence itself. We recommended to Island County that this residence be Yellow Tagged to limit entry to the property during daylight hours for retrieval of belongings, and only with monitoring of the surrounding area. The Yellow Tag was placed in the first days following the slide.
It did not appear that any other properties north or south of those identified above, along Driftwood Way, were affected by the recent Ledgewood Landslide, and no additional emergency response actions were taken to limit occupation of homes located on unaffected properties.
Limited groundwater seepage was observed along the upper 50 feet of the newly exposed headscarp. Heavy groundwater seepage was observed to be emanating from the failure east of Driftwood Way near the base of the headscarp, particularly near the north and south ends of the headscarp. Access to these areas was not safe at the time of our earliest site visits; however, the seepage appeared to be intermittent and come in “bursts” at some locations.
The slide mass remained active in late March, and we recommended that all access to the slide mass be restricted for life-safety reasons.
■ The southern 18 residences (i.e. lots with site improvements) along Driftwood Way, south of the Ledgewood Landslide, were without utilities and access because the slide destroyed Driftwood Way and the slide mass was too unstable to access. Puget Sound Energy, the local power provider, was on site shortly after the slide to restore power to the lower residences. With permission of the Bon Air Homeowner’s Association, ICPW constructed an emergency access road (Figures 3 and 4) to access the southern margin of the Bon Air Plat along a pre-existing off-road vehicle pathway so that power could be installed and access provided for the 14 residences.

LEDGEWOOD LANDSLIDE EVALUATION Whidbey Island, Washington
Page 10 | November 27, 2013 | GeoEngineers, Inc. File No. 0422-097-00
■ GeoEngineers participated in a site visit with ICPW and attended a public meeting on March 29, 2013 that was focused primarily on observations and sharing life-safety considerations with local residents. GeoEngineers also performed a detailed reconnaissance of the area on April 1, 2013 and another walk through of the area with ICPW on April 10, 2013. The following is a summary of observations and resulting actions:
During our site reconnaissance we noted that many shoreline rockery and timber bulkheads north and south of the slide area were damaged from wave erosion and had been recently repaired at the time of Ledgewood Landslide. A timber pile bulkhead at the 1968 Driftwood Way residence within the slide area remained unrepaired at the time of the event. The landslide toe area did not have a continuous bulkhead protecting the slope from wave erosion.
Additional ground movement occurred along the North Driftwood Way Landslide after the Ledgewood Landslide and ICPW crews had accomplished some grading to keep the road open to the four residential properties north of the North Driftwood Way Landslide area.
Several strong localized storm events occurred between the April 1 and April 10 site visits. Compared to the April 1 reconnaissance, we estimate that the landslide headscarp receded on the order of an additional 30 to 40 feet eastward into the yard areas located at 1934 and 1944 Fircrest Avenue. The apex of the headscarp occurs at about the property line between these two residences. Some of this recession occurred as spalling during the days following the slide event, but a larger mass (or several large blocks) appeared to have dislodged from the scarp between April 1 and April 10. Additional failure debris, including discrete blocks, was evident at the base of the bluff while performing reconnaissance from the elevation of Driftwood Way. Because of the limited and actively decreasing setback between the bluff crest and the residence, we recommended that the 1944 Fircrest Avenue residence be Red Tagged by the beginning of the 2013/2014 winter season.
Groundwater was observed to be emanating from the northern and southern margin of the scarp. No evidence of significant groundwater seepage was observed from the uppermost portion of the exposed headscarp area.
Significant erosion was occurring at the toe of the slide mass, estimated to be in the range of 50 feet within the two week period after March 27, as a result of tides and storm waves acting on the loose slide debris. Based on review of time-lapse photography collected by a local resident, the erosion appears to occur rapidly during wind events that produce wave cut erosion of the exposed slide debris. (Significant additional toe erosion has occurred since this observation period.)
ICPW reported that an additional failure of about 20 to 30 feet of material calved off of the headscarp along the northern edge of the Ledgewood Landslide area during the late evening of April 10.
Erosion of toe. Wave action will continue to erode the toe. Toe of Landslide. The beach was straight prior to the Landslide.

LEDGEWOOD LANDSLIDE EVALUATION Whidbey Island, Washington
November 27, 2013 | Page 11 File No. 0422-097-00
■ On April 14, five “reference lines” were established at 1934 and 1944 Fircrest Avenue so that bluff regression could be monitored. Initial readings were taken and distances published in a memorandum to ICPW. Also, at 1984 Driftwood Way on the southern margin of the slide, a 0.5-inch separation was observed between the soil and northwest foundation wall of the residence. The crack indicated that additional stress relief was occurring behind the failure scarp that was approximately 12 feet away from the foundation for the structure. Based on this information, we recommended that the 1984 Driftwood Way residence be changed from Yellow Tag to Red Tag by the beginning of the 2013/2014 winter season. It was our opinion that 1988 Driftwood Way could remain as a Yellow Tag unless additional landslide movement was noted.
■ Additional funding was made available to ICPW by DNR to explore and evaluate the Ledgewood Landslide area on June 17, 2013. The additional field investigation work had to be completed by the end of the fiscal year, which was June 30, 2013. The scope of the DNR-funded studies was established during conversations with Bill Oakes of ICPW, and Tim Walsh and Dave Norman of DNR. The supplemental investigations included planning, coordination, and completion of additional field exploration, laboratory testing, preparation of boring logs, an additional LiDAR flight, and limited evaluation. The drilling was subcontracted to several different drilling contractors in order to complete the borings, laboratory testing and sample evaluation within the funding time-frame. The DNR-funded services were completed between June 14, 2013 and end of day June 30, 2013.
SITE CONDITIONS
General
The Ledgewood Landslide is located on the west-facing shoreline area of Whidbey Island, approximately midway between the communities of Coupeville and Greenbank. The active landslide area is shown relative to existing roadways and other features in Figure 2. The landslide includes developed and undeveloped residential properties, together with the infrastructure roadway and utility systems.
Surface Conditions
Topography
The upland topography east of the Ledgewood Landslide (the upper Ledgewood plat) has a gentle downward slope toward the west, with the ground surface ranging between at about Elevation 180 feet to 230 feet. A steep slope forms the existing headscarp of the ancient and historic landslide complex, which is roughly represented by the top of the steep topographic lines and the green vegetation in Figure 3. A series of arcuate, scalloped features of various widths are apparent at the top of the headscarp. The slope below the headscarp ranges from about 50 feet to 100 feet in height, with an average gradient ranging between about 60 percent to steeper than 120 percent (i.e., steeper than 1H:1V [horizontal:vertical]) in some areas. Below the headscarp and newly formed steep slopes, the ground surface flattens somewhat in gradient to on the order of 20 percent to 60 percent, and becomes hummocky, but with various relatively level benches along Driftwood Way. West of the residences on the west side of Driftwood Way, the ground

LEDGEWOOD LANDSLIDE EVALUATION Whidbey Island, Washington
Page 12 | November 27, 2013 | GeoEngineers, Inc. File No. 0422-097-00
surface dips steeply again to the shoreline, with a beach bluff height that ranges from 20 feet to 80 feet above sea level.
No residences are located upslope of Driftwood Way until near the southern terminus of the road. Residences are located along the relatively flat area between Driftwood Way and the top of the beach bluff. Terrain features on the lower slopes and benches have been modified by development activities to the extent that topography directly attributable to ancient landslide movement is now obscured in some places. Evidence of recent landslide movement includes hummocky terrain and tilted trees.
The Ledgewood Landslide is located mid-way within the length of the ancient landslide complex and is roughly rectangular in plan view, with an approximately equal dimension east-west and north-south. The slide feature measures approximately 700 to 800 feet maximum north-south length and ranges in width from about 650 to about 950 feet (Figure 3). Locally, the recent Ledgewood Landslide displacement has created near-vertical slopes to about 75 feet in height along the new headscarp area. The recent Ledgewood Landslide area is quite hummocky near the toe, which is actively being eroded by marine wave processes. The slide also created a flatter mid-slope area with flatter gradient and back-sloped areas.
An east-to-west sloping swale, likely an extension of a natural drainage channel that has been bisected by Fircrest Avenue, exists along the property line between 1934 and 1944 Fircrest Avenue. The western limit of this drainage is at the apex of the Ledgewood Landslide headscarp. A waterline for drinking water was located within the swale along the property line, and previously extended over the slope crest serving some residents on Driftwood Way.
Vegetation
Vegetation in undeveloped areas west of the ancient landslide complex headscarp consists of a second-growth forest of mature mixed deciduous and coniferous trees with an understory of dense brush. Aerial photos prior to the Ledgewood Landslide show areas of active beach bluff erosion without vegetation in the toe area of Ledgewood Landslide. The area east of the ancient landslide headscarp is generally developed as residential lots with landscaping.
Mature conifer trees within the ancient landslide mass include vertical, butt-bowed (concave upslope), and tilted trunks. Ground movements, including creep, cause bowing at the base of trees and tree tilting. Trees within the Ledgewood Landslide mass are jack-strawed at various angles, especially in the southern portion of the slide mass. Groups of back-tilted trees are located in the northern portion of the slide mass.
Vegetation in the slope area below the ancient landslide headscarp and throughout some of the gentler slopes in the Driftwood Way area includes hydric plants such as horsetails and water-tolerant grasses and reeds, indicative of long-term saturated conditions.
Surface Hydrology
Review of previous reports has indicated the presence of seepage below the ancient landslide headscarp and throughout the gentler slopes in the Driftwood Way area. During our review of past reports, we did not find discussion of significant seepage occurring along the beach bluff.

LEDGEWOOD LANDSLIDE EVALUATION Whidbey Island, Washington
November 27, 2013 | Page 13 File No. 0422-097-00
Seepage was observed emanating from the Ledgewood Landslide headscarp within a recessional outwash-filled swale that is located between the residences at 1934 and 1944 Fircrest Avenue immediately after the slide; however, no evidence of significant surface water flow was observed in this swale. Limited groundwater seepage has been observed along the upper 50 feet of the newly exposed Ledgewood Landslide headscarp. Heavy groundwater seepage was observed to be emanating east of Driftwood Way, near the bottom of the upper scarp/top of slide debris. Immediately after the slide the seepage appeared to be intermittent and come in “bursts” at some locations
Surface water within the Ledgewood Beach/Bon Air Plats is collected largely in open ditches in the upper Ledgewood Area. A stormwater pipe at the south end of the plat near East Bon Air Drive directs collected stormwater down the slope to the beach in a closed tight-line system. A similar pipe system is present along Fircrest Avenue north of Alderwood Street, directing water in a closed pipe between 1882 and 1886 Fircrest Avenue, down Seaward Way and Driftwood Way to an outfall at the County Park and beach access. We understand from discussions with ICPW personnel, that a shallow interceptor trench (a.k.a., interflow system) to collect near-surface perched groundwater is co-located within the stormwater trench present along Fircrest Avenue north of Alderwood Street and along South Seaview Avenue. The lower Ledgewood Beach/Driftwood Way area is also served by open ditches and half-round pipes for collection and conveyance of stormwater. Some stormwater generated from private residences above the ancient headscarp was observed to be directed over the upper slope into the lower Driftwood Way area. These pipes were not extended to the beach area or to any specific discharge point.
Geologic Setting
Our review of available geologic information indicates that subsurface conditions on Whidbey Island are the result of several episodes of interglacial erosion, scour by glaciers, deposition of glacial and non-glacial sediments, and post-glacial deposition and erosion. The Fraser Glaciation is the most recent glaciation of western Washington and includes two periods of glacial advance (the Sumas and Vashon Stades) separated by an interglacial period (the Everson Interstade). Erosion and deposition during and following the Fraser Glaciation have resulted in the modern topography of the Whidbey Island area.
Mapped geologic deposits in the vicinity of the site include Vashon and pre-Vashon glacial and interglacial deposits, glacial till, and post-glacial landslide debris. The Vashon Stade units mapped in the area consist of Vashon Till and Advance Outwash. Pre-Vashon glacial deposits also are mapped in the area. The pre-Vashon non-glacial deposits are locally known as the Whidbey Formation, although other units of pre-Vashon glacial and non-glacial deposits of various ages likely exist in the study area. The pre-Vashon deposits are typically hard/dense due to past glacial loading. Glacial till is generally a non-sorted, non-stratified mixture of sand, gravel, and silt that has been overridden by several thousand feet of ice. Till typically has high shear strength and low consolidation characteristics in the undisturbed state, and it often develops a “weathered” zone where seasonal groundwater perches on top of the relatively impermeable and unweathered till.
Landslide deposits are mapped on the west-facing slopes in the study area (Figure 2). The Coastal Zone Atlas (CZA) mapping of slope stability indicates that the bluff north and south of the Ledgewood Landslide is “unstable old landslide”. This mapping is a generalized evaluation of the

LEDGEWOOD LANDSLIDE EVALUATION Whidbey Island, Washington
Page 14 | November 27, 2013 | GeoEngineers, Inc. File No. 0422-097-00
slope stability. The “unstable old landslide” designation means that the slope is an area of post-glacial landslide activity. Geologic references also show the North Driftwood Way Landslide within the unstable old landslide.
Subsurface Conditions
Subsurface Explorations and Laboratory Testing
Subsurface conditions in some portions of the Ledgewood Landslide area have been previously explored, including explorations by Golder Associates in 1991, 1996, and 1998, and Aziz in 2004. GeoEngineers completed a series of eight borings in May and June 2013. GeoEngineers’ explorations extended between 111 and 281 feet bgs (to Elevation -90 feet). Samples of exposed soils were obtained at nine locations along the beach during low tide; the locations of the beach sample locations are identified as Stations 1 through 9 in Figure 3. Descriptions of our field explorations and explorations logs are presented in Appendix A. A site plan showing the approximate locations of our explorations, as well as previous geotechnical explorations, are presented in Figure 3. Interpreted subsurface cross sections A-A’ through H-H’ are presented in Figures 5 through 12. A table summarizing exploration locations, drilling methods and depths, ground surface elevations, and other information is presented in Appendix A, Table 1.
Laboratory testing completed on representative samples, including moisture content, Atterberg limits, and grain size analysis, are described and summarized in Appendix B, along with descriptions of the test procedures. The results of laboratory testing are shown on the logs of borings at the representative sample depth, and plots of laboratory data are presented in Figures B-1 through B-24.
Subsurface Instrumentation
Subsurface instrumentation included installation of VWPs for measurement of groundwater levels at selected elevations, and installation of inclinometer casings. Seven of the eight borings included VWP installations, typically with two or three instruments installed in each borehole. The locations of the VWPs and measured groundwater elevations are shown graphically in the subsurface cross sections.
Three of the explorations included installation of an inclinometer casing to the bottom of the borehole that can be used for measurement of possible future ground movements. A fourth boring included installation of a “poor boy” piezometer, which is an inexpensive PVC casing used to determine if an active shear plane has developed sufficient displacement to kink or offset the casing. The poor boy was installed in the North Driftwood Way Landslide location where the magnitude of recent ground movement is high and expected duration of possible reading events is low. Detailed descriptions of the subsurface instrumentation are provided in Appendix C. Included in Appendix C is a summary table of the instrumentation installation details (locations, depths, equipment identification numbers, etc.).
Soil Conditions
Subsurface soil conditions in the study area were evaluated by reviewing published geologic maps and references, reviewing referenced previous geotechnical reports, surficial geologic

LEDGEWOOD LANDSLIDE EVALUATION Whidbey Island, Washington
November 27, 2013 | Page 15 File No. 0422-097-00
reconnaissance, advancing eight boreholes (GEI-1 to GEI-8), and installing instrumentation as previously described.
Borings GEI-1, GEI-6, GEI-7, and GEI-8 are located upslope of the ancient and recent landslide headscarp areas. Borings GEI-2 and GEI-4 are located along Driftwood Way, north and south of the Ledgewood Landslide, respectively. Boring GEI-3 is centrally located within the Ledgewood Landslide mass near the former alignment of Driftwood Way. Boring GEI-5 is located within the North Driftwood Way Landslide area. Each of these areas is summarized separately below and generalized cross sections are presented in Figures 5 through 12.
UPLAND BORINGS (GEI-1, GEI-6, GEI-7, AND GEI-8)
All four upland borings encountered a profile of dense to very dense sand with some layers of hard silt and clay. A brown recessional outwash unit is located beneath the localized drainage previously discussed at the top of the Ledgewood Landslide headscarp. This material was not encountered in GEI-1. The upper 25 feet of GEI-1 was slightly less dense than the upper portions of the other three borings. Notably, GEI-7, which is the most northerly upland boring, encountered predominantly very dense granular materials consisting of moist sand with silt to trace silt; no fine-grained layers of significant thickness were encountered at this location. Boring GEI-1, GEI-6, and GEI-8 also encountered significant thicknesses of very dense sand, but also encountered units of low plasticity, hard silt and clay. Borings GEI-1, GEI-6 and GEI-8 also encountered a fine-grained hard silt/clay layer that contained a moderate organic content at an elevation of about 130 feet, suggesting a more uniform sediment sequence at and below this elevation. The lower 120 feet of borings GEI-6 and GEI-8 were predominantly very dense sand or silty sand with some gravel and intermittent layers or lenses of hard silt. The bottom 30 feet of GEI-1 encountered a deposit of hard low-plasticity silt and clay.
DRIFTWOOD WAY BORINGS (GEI-2, GEI-3, AND GEI-4)
The borings completed along Driftwood Way were somewhat more variable and contained a mix of landslide debris, intact blocks of landslide material, and undisturbed inter-glacial deposits. Borings GEI-2 and GEI-4 encountered loose to medium dense sand, likely slide debris from previous landslide events, to depths of 13 and 30 feet (or more) in the two borings respectively. At GEI-3, completed within the recent slide mass, loose sand landslide debris was encountered to a depth of 16 feet, and stiff clay, possibly older landslide debris, was encountered to a depth of 25 feet bgs. The recent landslide deposits and older landslide deposits were encountered overlying hard silt and clay, with some layers of sheared high plasticity silt/clay.
Evidence of an older sheared zone was observed in samples of the high plasticity soils generally between about Elevation 10 and 30 feet, but with one possible sheared sample at Elevation -10 feet. With one exception, samples collected in the older shear zones were typically very stiff or hard. The samples appeared intact and consolidated, but fractured in small blocky pieces. Because of the stiff, intact nature of these sheared zones, they were interpreted to be older slide surfaces not associated with the recent Ledgewood Landslide. It is possible, however, that either a highly disturbed and softened shear plane was present and was not encountered during drilling and sampling, or that the stiff sheared samples were in-fact included in the recent slide but did not significantly soften during shearing. Below the sheared zones encountered in all three borings, interbedded layers of very dense sand and hard silt/clay of variable plasticity were encountered to the termination depths of the explorations.

LEDGEWOOD LANDSLIDE EVALUATION Whidbey Island, Washington
Page 16 | November 27, 2013 | GeoEngineers, Inc. File No. 0422-097-00
NORTH DRIFTWOOD WAY LANDSLIDE (GEI-5)
Subsurface soil conditions encountered at GEI-5 are generally consistent with the previous boring conducted by Golder at approximately the same location (BH-3 [1996]) within the North Driftwood Way Landslide. A sequence of granular fill and slide debris was encountered to a depth of approximately 15 feet bgs, overlying very dense sand and gravel to a depth of about 67 feet, overlying low plasticity to non-plastic hard silt and clay to a depth a of 100 feet. The boring was terminated in very dense silty sand at a depth of 111 feet bgs.
Groundwater Conditions
Groundwater conditions could not be directly observed or measured during our exploration program because of the drilling fluid used for the borings. Based on our experience, perched groundwater often occurs above silty soil horizons within the sandy soils. Evidence of perched groundwater conditions was observed in soil samples to approximately 105 feet bgs while drilling GEI-1 using the Sonic drilling method. Vibrating wire piezometers were installed in all of our explorations with the exception of GEI-5 at depths indicated on the logs. Dataloggers were installed by ICPW and data from the VWPs will be collected on a quarterly basis.
One round of VWP data was obtained for interpretation during our study. Groundwater elevations indicated by the VWPs from August 29 through September 1, 2013 are presented adjacent to the appropriate boring logs on the cross sections with the associated elevation of the VWP installation. A discussion of VWP installation and table of data/serial numbers for the piezometers in presented in a table in Appendix C.
Based on our review of the data, we interpret that the regional groundwater table occurs at about Elevation 20 feet, with a slight slope in the water surface down and toward the west (toward Admiralty Bay). Additionally, many of the explorations encountered zones of perched groundwater at various depths. Perched groundwater was encountered at contacts between coarse-grained and finer-grained soils, and also within recent and ancient slide debris. At this time, insufficient long-term data has been collected to adequately characterize seasonal groundwater level fluctuations at the boring locations.
The measured regional groundwater elevations are consistent with many groundwater well elevations in the area. A large number of water wells are installed at or slightly above sea-level, with a lesser number at higher elevations that appear to capture more persistent zones of perched water. Based on email communication from the Ledgewood Beach Water District Commissioner (Ralph Young, July 11, 2013), water levels at three water wells near the Ledgewood Landslide have consistently fluctuated within about 3 feet.
DISCUSSION AND ANALYSIS
The Ledgewood Landslide represents the reactivation and expansion of a recent landslide located within an ancient landslide mass. The ancient landslide complex is approximately 0.7 to 1 mile long. Pre-historic landslide movements likely were initiated by shoreline erosion following deglaciation, which occurred slightly over 10,000 years ago. Landslide activity has continued intermittently to the present. Localized slides within the ancient landslide complex have occurred for hundreds to thousands of years based on visual evidence of hummocky terrain, temporary

LEDGEWOOD LANDSLIDE EVALUATION Whidbey Island, Washington
November 27, 2013 | Page 17 File No. 0422-097-00
ground cracks, rotated/leaning trees, toe uplift and other surface manifestations. After land use development began in the Ledgewood area in the 1960s, slides have occurred displacing the Driftwood Way roadway and impacting homes, including destroying two homes previously located within the North Driftwood Way Landslide. The magnitude of the recent Ledgewood Landslide event; however, is unprecedented since development began within the area, and represents one of the largest single landslide events in recorded history in the shoreline areas of Puget Sound.
The focus of GeoEngineers’ analysis is on the Ledgewood Landslide because of the scale of slide movement and the associated impacts to residential properties and infrastructure. However, we were also asked to perform subsurface exploration in a broader area to help assess the overall stability of the surrounding area with regard to safety for local residents. In this section of the report, we have summarized previous analyses of the Ledgewood Landslide and the North Driftwood Way Landslide performed by others, and then summarized our analyses of the recent data.
The types of slides observed in the Driftwood area have the capacity to be extremely destructive. Damage to residences, roadways, and utilities produced by such failures ranges from hairline cracks to total destruction and may occur suddenly, intermittently, over a period of years, or within a matter of weeks or days. Also, localized adjustments typically continue for months or years after an episode of major slide movement. The discussions below are based on our evaluation of the available information, judgment and experience.
Ledgewood Landslide
Thorsen (1991) reported that approximately 1,500 feet of waterfront along Driftwood Way experienced movement in three separate events. Thorsen’s 1991 report primarily addressed the Driftwood Way Landslide area and concluded that the constant loading at the head of the slide from mass wasting of the headscarp and erosion of the toe were contributing factors, but the association with abnormally wet periods and a lag time to substantial movement suggested that deep groundwater was the ultimate “trigger”. Additionally, Thorsen suggested that the accumulation of colluvium/slide debris at the base of the ancient slide scarp collecting on top of the older slide mass may have impeded groundwater seepage from areas uphill and east of the Driftwood Way Landslide. This situation would effectively dam or slow the flow of groundwater from zones of perched groundwater, resulting in a buildup of groundwater levels and attendant hydrostatic pressure behind the colluvium.
At the time of Thorsen’s report, ground cracks were apparent west of Driftwood Way all the way to the base of the beach bluff. Based on his observations of the overall deformation of the slide area and associated crack patterns, he further concluded that the likely landslide mechanisms included movement of a “Lower Slide” that destabilizes the “Upper Slide” which moved as a relatively shallow “lateral spread” above the road. He also concluded that while uplift at the beach had been suggested by residents, the deformation suggested that slide movement was not likely along the ancient deep-seated failure surface, but along a shallower plane parallel to the ground surface (20 feet deep suggested).
Golder performed additional analysis of the Driftwood Way Landslide (1998) and Aziz also performed analysis of the landslide (2004). During their studies, movement was documented

LEDGEWOOD LANDSLIDE EVALUATION Whidbey Island, Washington
Page 18 | November 27, 2013 | GeoEngineers, Inc. File No. 0422-097-00
(inclinometer data and poor boy deflections) at depths on the order of 30 to 40 feet bgs with the lowest elevation of the slide plane at or above sea-level. Golder performed staged slope stability analyses that show that the slope stability of the entire slide mass from beach to headscarp is about the same as a failure surface that extends to slightly east of Driftwood Way. The back-analysis geometry included a low-strength slide plane (16 to 18 degree phi angle) based on locations indicated by the inclinometer data and an assumed residual strength to the slide mass (34 degree phi angle). Similar to Thorsen, Golder concluded that the toe block likely moved first, thus allowing for some movement of the slide mass between the road and headscarp. In addition to these scenarios, Aziz suggested a continuous “translator slip plane” at about Elevation 0 near the beach and inclined at 7 degrees upward to the east. Uplift movement at the beach was suggested by Aziz to be associated with smaller rotational slides.
Although the previous investigations and reports acknowledged the presence of the ancient landslide complex, and the possibility of future movement of the Driftwood Way Landslide, none of the previous investigations concluded or predicted that a progression or expansion of slide activity was likely on the scale observed for the Ledgewood Landslide.
Based on the analysis of our 2013 explorations and additional information, the recent Ledgewood Landslide likely started with movements near the shoreline and spread progressively to the east and south. We postulate that a large amount of toe block movement likely occurred within the Driftwood Way Landslide late March26/very early March 27, 2013, which caused progression of the slide to both the east and to the south. We observed evidence in soil samples indicative of a possible ancient slide plane ranging in Elevation between +15 to +30 feet and as low as Elevation -10 feet at one location; however, we did not observe evidence of recent movement or deformation at these elevations. The results of our analysis are consistent with previous evaluations and support a multi-stage failure with some initial rotational movement with beach uplift at the toe, but in this case sufficient to allow large scale translational movement of the upper slide mass along an inclined failure plane that then expanded the slide mass to the east and south. It appears likely based on post-slide observations that the rotational toe failure south of the former Driftwood Way Landslide may have been overridden by a translational debris slide from the east.
Groundwater was included in our slope stability analyses and was a contributor to triggering the Ledgewood Landslide. It is not possible to accurately estimate the groundwater conditions that existed at the time of the slide within the headscarp area or the slide mass. However, the observations of large quantities of seepage along the north and south sides of the slide mass for several days after March 27 suggests that significant release of groundwater may have occurred. This condition would be consistent with the slope colluvium “damming” groundwater, possibly within several perched water zones, within the headscarp area of the ancient landslide complex.
North Driftwood Way Landslide
Golder (1991, 1996) concluded that the North Driftwood Way Landslide was a shallow slide about 20 to 30 feet deep, roughly following the slope of the ground surface. Golder evaluated several different failure geometries and the results of their back analyses indicated a residual strength of the slide debris at a 26 degree phi angle. Their analysis concluded that the entire slide mass has

LEDGEWOOD LANDSLIDE EVALUATION Whidbey Island, Washington
November 27, 2013 | Page 19 File No. 0422-097-00
about the same stability as more localized rotational slides that were modeled behind the beach bluff.
Progressive slope failures extending up from the beach (but not through the bulkheads at the beach) resulted in loss of two residences within the North Driftwood Way Landslide in the late 1980s. Continued toe movement has likely been responsible for movement of the slide mass that extends across Driftwood Way. The results of our 2013 analyses to date are consistent with Golder’s conclusions. Future readings of the poor boy inclinometer in GEI-5 will provide additional data for evaluation.
LiDAR Survey Data
Three LiDAR survey data sets were evaluated: older pre-slide LiDAR that the County has had available for several years; a LiDAR survey flown several days following the Ledgewood Landslide, and a supplemental LiDAR survey flown under subcontract to GeoEngineers as part of the DNR scope of services on June 23, 2013. The subcontracted June 23, 2013 LiDAR survey results are presented in Appendix D. Comparisons of surface contours and cross sections from before and after the Ledgewood Landslide are shown in Figures 5 through 12. Areas outside of the slide mass did not show measureable movement that can be detected with LiDAR-scale data. Minor differences between the two post-slide LiDAR-generated surface elevations are likely due to collection and processing accuracy between the two data sets.
Our review and evaluation of the post-landslide LiDAR data supports the anecdotal evidence that the slide occurred in phases with the northern portion, including the previously active Driftwood Way Landslide area, moving first. Figure 13 is a hillshade LiDAR image of the Ledgewood Landslide immediately following the slide. The hillshade map clearly shows the displaced Driftwood Way to be somewhat intact, yet relocated approximately 100 to 150 feet toward the west on the northern portion of the slide mass. The southern portion of the slide appears as a more jumbled mass, more indicative of a flow failure, with no evidence of the previous Driftwood Way. This difference in morphology between the northern and southern portions of the Ledgewood Landslide mass is consistent with reports from the resident at 1968 Driftwood Way; he initially tried to exit in his vehicle toward the north along Driftwood Way, discovered that the roadway was impassable, and then retreated to the south, followed by displacement of his residence to the west.
Inclinometer Data
We installed slope inclinometer casings in three borings to measure subsurface ground movements within and adjacent to the Ledgewood Landslide area. Future inclinometer surveys will be made to detect changes in alignment of the casings, as compared to the initial baseline readings. Changes in casing alignments are indicative of differential movement within the soil mass penetrated by the casings and are very useful in defining the depth(s) of landslide failure surfaces. If ground displacements are small or do not occur, the inclinometer casings may be surveyed successfully for months and years after their installation. However, large scale ground movements, or a rapidly moving slide mass, can shear an inclinometer casing and render it useless in a short time period.

LEDGEWOOD LANDSLIDE EVALUATION Whidbey Island, Washington
Page 20 | November 27, 2013 | GeoEngineers, Inc. File No. 0422-097-00
Preliminary review of the initial inclinometer data collected between June and November suggests very slight movements since installation. The inclinometer readings are presented in Appendix C. Additional readings will be required to confirm trends in the data, and if ground movement is ongoing at any of these locations. It should be noted that the inclinometer readings are only completed at periodic intervals and require time to process and analyze the data. Although this monitoring will capture large scale trends in slope movement, they may not capture sudden changes in slope movement and should not be considered an “early warning system” suitable for notification to residences of impending slope failure or life-safety hazards.
Hydrology
Our evaluation of hydrologic factors affecting the Ledgewood Landslide is based on our surface reconnaissance together with rainfall data and groundwater observations. We analyzed more than 100 years of precipitation data, from 1900 to October 2013, provided by ICPW. The precipitation data were collected from a rain gage located approximately 7 miles north of the site, near Coupeville. Plots of cumulative 12-month precipitation are presented in Figures 14 and 15 for the previous 113 years and 13 years, respectively. The 12-month cumulative precipitation leading up to the recent Ledgewood Landslide event was the highest recorded during the previous 100 years. The other two highest 12-month cumulative precipitation periods were 1971/1972 and 1997/1998. The data show a trend of increasing cumulative 12-month precipitation in both the short-term and long-term plots. It is worth noting that Thorsen evaluated the Driftwood Way Landslide in 1971 and Golder in 1998, after previous seasons of high precipitation.
Local residents noted that a late spring snowfall occurred in the week prior to the Ledgewood Landslide event, with about 4 inches of snow in the local vicinity. It is our opinion that this amount of snow was not likely significant to the initiation of this slide event.
Data from VWPs we installed in selected exploratory boreholes was collected at the end of August 2013. Because the data collected to date followed relatively dry summer months (July and August), the frequency and duration of the groundwater measurements is not sufficient at this time to evaluate seasonal fluctuations, define the overall relationship between precipitation and groundwater elevation, or the presence of localized perched groundwater. Information provided by the Ledgewood Beach Water District indicates that there was no noticeable change in the regional groundwater elevation in the time period immediately before or after the Ledgewood Landslide.
We concur with previous studies that seasonally high groundwater conditions are a significant contributor, if not the most significant contributor, to triggering landslides in the study area. The headscarp of the Ledgewood Landslide area has more interbedded silt and sand units than other upper Ledgewood Beach area borings. It is possible that perched groundwater conditions could have built up a hydrostatic condition against the colluvium (mass wasted material) along the ancient headscarp. This is also consistent with observations of high volumes of groundwater seepage from the headscarp area noted shortly after the Ledgewood Landslide.
Slope Stability Modeling
GeoEngineers conducted slope stability modeling of the Ledgewood Landslide and several other cross sections using a limit equilibrium slope stability program. Our analyses were performed using the computer program SLOPE/W distributed by Geo-Slope International. The program has the

LEDGEWOOD LANDSLIDE EVALUATION Whidbey Island, Washington
November 27, 2013 | Page 21 File No. 0422-097-00
capability of analyzing slope stability for two-dimensional profiles under a wide range of failure surface geometries, soil layers and groundwater conditions. The program was used to generate and evaluate circular and/or block (wedge) failures within the areas of interest. We constructed computer models to evaluate slope stability before and after the recent landslide, including a multi-stage (progressive) failure, and along various cross section profiles.
The program identifies the surface most likely to fail during a landslide based on the topography, subsurface conditions, soil properties, and water table elevations for a given set of input parameters. The stability of the most likely failure surface is reported as a factor of safety, which is the ratio of resistive forces to driving forces. A factor of safety of 1.0 indicates that the resistive forces are equal to the driving forces and the landslide is at equilibrium. Factors of safety less than one indicate that the resistive forces are smaller than the driving forces and the landslide will be active. A factor of safety greater than 1.0 indicates that the resistive forces are greater than the driving forces and the landslide will be stable. A minimum static factor of safety greater than 1.2 to 1.3 is typically considered desirable for slope stability, although 1.5 is preferred because this usually also achieves a reasonably reliable seismic stability.
We evaluated three representative cross sections: E-E’ through the middle of the Ledgewood Landslide mass; C-C’ south of the Ledgewood Landslide and G-G’ north of the Ledgewood Landslide, the locations of which are shown in Figure 3. The purposes of using these sections in the analyses include evaluating conditions that could have contributed to the recent Ledgewood Landslide and gaining an understanding of the relative risk of areas outside and adjacent to the recent slide. The results of our slope stability analyses are presented in Appendix E.
We did not evaluate Section H-H’ at the North Driftwood Way Landslide area because we concluded that the previous evaluation by Golder remains representative of existing conditions and risks in that area.
The surface topography used in our cross sections is based on the LiDAR results before and after the recent Ledgewood Landslide. Subsurface contacts were interpreted from those identified during drilling and previous interpretations. The groundwater surface elevations were interpreted from observations during drilling, preliminary VWP data, surface seep locations and previous interpretations. Measurements of the inclination of the headscarp and data from the previous slope inclinometers helped constrain the slide plane geometry and suggest possible failure mechanisms. Our analysis included evaluation of large global slope failure, and smaller failures on the upper and lower portions of the slopes. Our analyses also included evaluation at groundwater levels based on preliminary VWP data and assumed “representative high” groundwater elevations.
Soil input parameters were developed based on the logs of the explorations, blow count N-value data collected during the subsurface exploration program, correlation with soil index properties, and our experience. These values are reasonably consistent with previous evaluations. Table 1 below presents a summary of the soil parameters used in our slope stability modeling.

LEDGEWOOD LANDSLIDE EVALUATION Whidbey Island, Washington
Page 22 | November 27, 2013 | GeoEngineers, Inc. File No. 0422-097-00
TABLE 1. SOIL PARAMETERS FOR SLOPE STABILITY MODELING
Soil Unit Unit Weight
(pcf) Friction Angle
(deg) Cohesion
(psf)
Very Dense Sand 130 38 0
Hard Silt/Clay 115 0 3,000
Old Slide Deposits (Intact Blocks) 125 34 0
New and Old Slide Deposits (Residual Strength) 125 26 0
Sheared Silt/Clay (Residual Strength) 125 18 0
Medium Dense Sand 125 32 0
Section E-E’: Ledgewood Landslide Mass
Section E-E’ (Figures 3 and 9) is a representative cross section of the Ledgewood Landslide in the middle of the historic slide mass (and through boring GEI-3). We performed a multi-stage failure analysis of the slide event. We modeled the failure with the landslide toe located west of the pre-sliding beach bluff. The resultant failure surface geometry is similar to that previously postulated, analyzed and observed by others. The model included a layer representing an ancient sheared surface of high plasticity silt and clay, with a low residual strength. Because of recent episodic movement in years leading up to the Ledgewood Landslide, the slide mass itself was also initially analyzed with a residual strength appropriate for disturbed slide deposits.
Figure D-1 represents the potential slide initiation or Stage 1 condition. This slide initiation point is slightly east of the Driftwood Way location. A factor of safety of about 1.0 was obtained, which represents the unstable pre-March 2013 condition of the slide area. Once the landslide has moved as a largely rotational block, the soil along the slip plane surface moves (loses strength) and slide blocks occur such that the slide debris also loses strength. Slightly lower soil strength at the slide plane would decrease the factor of safety below 1.0, and the landslide would remain active.
Figure D-2 represents a larger failure, or Stage 2 condition, extending upslope to and even slightly beyond the head scarp of the ancient slide (west of the Fircrest Avenue properties). The failure surface models the condition immediately after the initial slope movement of the lower toe block (after Stage 1 failure movement), where the buttressing effect of the material at the toe has been removed, thus allowing the failure area to expand progressively upslope. The failure surface shown in Figure D-2 is computed to have a factor of safety well below 1.0, suggesting that the loss of buttressing effect from Stage 1 failure could have triggered this larger, Stage 2 slide movement.
Figure D-3 represents the failure of the steep scarp at the top of the bluff, or Stage 3 condition that occurred after Stage 2 exposed an over-steepened condition at the head of the Stage 2 slide area. Based on observations during and immediately following the slide, approximately 40 feet of the upper yard area was initially lost during the major slide event, which may correlate with a Stage 3 condition. Another approximately 30 to 40 feet of yard area was lost in the next two weeks following the initial slide event.
Our models shown in Figures D-1 through D-3 are consistent with previous evaluations and involve slide debris and slide movement that does not extend below sea level. It is very likely that historic rotational slide movements for the Ledgewood Landslide (and other active areas below Driftwood

LEDGEWOOD LANDSLIDE EVALUATION Whidbey Island, Washington
November 27, 2013 | Page 23 File No. 0422-097-00
Way) extend below sea level based on observations of raised and tilted clay beds, reported events of uplifted clay and erosion of the clay on the beach, and recent biological evidence. It is possible, if not likely, that the southern portion of the Ledgewood Landslide (the toe block south of the Driftwood Way Landslide) was more of a rotational slide, and may have occurred as part of the Stage 2 slide movement. We evaluated the geometry of a deep-seated rotational failure along Section E-E’ shown in Figure D-4, and concluded that the factor of safety is not statistically different than the Stage 1 slide. The D-4 analysis supports the possibility that a rotational toe block and a large translational slide/“flow failure” could have occurred in a staged failure or as one large concurrent event.
Section C-C’: South of Ledgewood Landslide Mass
Section C-C’ (Figures 3 and 7) is representative of the area south of the Ledgewood Landslide (and through GEI-4). This area has not undergone any apparent recent movement, although it is on the south margin of the recent slide and is within the limits of the ancient landslide complex. The surface topography in this area includes a relatively flat benched area that includes Driftwood Way and shallower slope gradients than the active Ledgewood Landslide area. Boring GEI-4 suggests relatively intact blocks of consolidated slide debris material above a potential relict slide plane. Accordingly, we initially modeled the old slide deposits with a moderate friction angle rather than using the residual strength. The relict slide plane was modeled with a residual strength.
The beach bluff area south of the Ledgewood Landslide is oversteepened. Figure D-5 presents the results of this slope stability analysis showing a factor of safety of about 1.35 at 40 feet from the top of the bluff using strength values associated with intact blocks of Older Slide deposits. When movement occurs, residual strength conditions are appropriate and results in a safety factor near 1.0 at the same 40 foot setback, as shown in Figure D-6.
We also evaluated the factor of safety associated with a slide extending upslope to the top of the head scarp of the ancient slide (west of the Fircrest Avenue properties). Because of the long flat bench area (flatter slope geometry), the factor of safety against a large slide similar to the Ledgewood Landslide is about 1.5 or higher, and the model indicates that this magnitude of slide is unlikely to occur as a single large event.
Section G-G’: North of Ledgewood Landslide Mass
Section G-G’ (Figures 3 and 11) is representative of the area north of the Ledgewood Landslide (and through GEI-2). This area has not undergone any apparent recent movement, although it is at the margin of the recent slide and is within the limits of the ancient landslide complex. Based on review of available information, some past slope repair has occurred along Seaward Way and possibly along Driftwood Way that is associated with surficial slope movements. The overall surface topography of this vicinity is steeper than the area south of the Ledgewood Landslide, with a series of slopes and benches. Boring GEI-2 suggests relatively intact blocks of consolidated material above a potential relict slide plane. We initially modeled the old slide deposits with a moderate friction angle rather than the residual strength. The relict slide plane was modeled with a residual strength.
Figure D-7 presents the results of this slope stability analysis, with a factor of safety of about 1.15. The critical failure surface is relatively large, encompassing most of the ancient slide mass.

LEDGEWOOD LANDSLIDE EVALUATION Whidbey Island, Washington
Page 24 | November 27, 2013 | GeoEngineers, Inc. File No. 0422-097-00
Smaller localized slides do not have a significantly greater factor of safety. If localized tension cracks/slides along the beach bluff were to occur similar to previous conditions at the Ledgewood and North Driftwood Way Landslides, then using a residual strength analysis would be more appropriate and results in a safety factor near 1.0, as shown in Figure D-8. It is our opinion that the results of our slope stability analyses indicate that toe block movement could initiate a progressive slide, or could initiate a larger initial slide that could extend upslope to the top of the ancient slide scarp. The very dense soils at the top of the upper bluff in this area suggest that it is unlikely that a future landslide would extend a significant distance back from the crest of the existing upper bluff.
CONCLUSIONS AND RECOMMENDATIONS
In our opinion, the Ledgewood Landslide resulted from a progression of recent landslide activity (Driftwood Way Landslide in Figure 3) located within a much larger ancient landslide feature consisting of intact material and various active and inactive slide planes. Many different triggers contributed to this instability, and it was likely the compound effects of multiple factors that ultimately triggered the slide. The timing of major slide events observed in this area, including the recent Ledgewood Landslide event, has consistently been late February or March, suggesting that seasonally elevated groundwater level is a major contributor. Because significant seepage was observed emanating from the headscarp area for many weeks after the slide, it is possible that some relief to the elevated groundwater condition and associated hydrostatic pressure has occurred, at least in the Ledgewood Landslide headscarp area.
The recent Ledgewood Landslide debris should be considered unstable and is susceptible to additional movement until a new equilibrium condition is achieved. It is our opinion that the landforms along the ancient Driftwood Way Landslide complex suggest that the Ledgewood Landslide is an example of previous pre-historic movements within this ancient landslide complex. Major episodes of landslide movements may be separated by decades or centuries.
Factors Contributing to Ledgewood Landslide Slope Failure
A summary of contributing factors is provided below:
■ Previous evaluations by Thorsen and Golder show relatively shallow (generally 20 to 30 feet deep) failure surfaces at or above existing sea-level. However, the toe block at the bluff likely has a deep-seated rotational component to it that extends below sea level. These pre-existing slide planes with previous movement result in a low-strength environment with preferential failure surfaces.
■ Thorsen (1991) suggested that the accumulation of colluvium/slide debris from the ancient slide scarp collecting on top of the older slide mass may have impeded groundwater seepage from areas uphill and east of the Driftwood Way Landslide. This situation would effectively dam or slow the flow of groundwater from zones of perched groundwater, resulting in a buildup of groundwater levels and attendant hydrostatic pressure behind the colluvium. The increased groundwater levels would also have continuity into the slide mass and contribute to destabilization of the slide mass.

LEDGEWOOD LANDSLIDE EVALUATION Whidbey Island, Washington
November 27, 2013 | Page 25 File No. 0422-097-00
■ Erosion at the toe of the slide area occurs regularly from winter storm events. During the 2012/2013 winter, a sequence of “king tide” events and a mid-December combined “king tide” and storm event removed considerable toe material and damaged bulkheads in the slide area. The loss of toe material and bulkheads reduced the resisting forces.
■ A high seasonal precipitation and 12-month cumulative precipitation likely resulted in increased surface water runoff and increased groundwater levels within and near the Ledgewood Landslide mass. Most of the large slide events have been recorded in February and March suggesting groundwater is a significant factor. The buildup of water within the slide mass would have a tendency to increase driving forces and lower resisting forces.
■ Many of the borings from the Driftwood Way ROW (GEI-2, GEI-3, and GEI-4 specifically) encountered stiff high plasticity silt and clay units with some blocky/sheared surfaces interpreted to be older (ancient) slide planes. We did not find evidence of recent deformation of these materials; however, they represent units with decreased shear strengths. It is possible that either a highly disturbed and softened shear plane was present at these deeper elevations and was not encountered during drilling and sampling, or that the stiff sheared samples were in-fact included in the recent slide but did not significantly soften during shearing. Some of the samples collected at the beach after the slide event were also determined to be high-plasticity silt and clay, similar to materials encountered at various depths between Elevation 0 feet and 35 feet in the lower Driftwood Way borings.
■ A localized swale underlain by recessional outwash is located at the headscarp of the Ledgewood Slide. Seasonal perched groundwater would be expected within these outwash soils that overlie the dense glacial soils. In addition, GEI-1 (located along Fircrest Avenue near this swale) encountered an interlayered sequence of glacial silt and sand layers with perched groundwater conditions in the upper soil profile above the Driftwood Way elevation. These soil and groundwater conditions appear to be unique to this location.
■ Anecdotal evidence collected after the landslide suggests that the water line located in the swale between 1934 and 1944 Fircrest Avenue broke and released a significant quantity of water near the time of the slide. It is uncertain as to the quantity of water (but may have been on the order of 60,000 gallons), and timing of the release (before, during or after the Ledgewood Slide). Without knowing the timing of the water release, it is impossible to evaluate if the waterline contributed to the initiation of the slide, but at a minimum this quantity of water would have contributed to the observed flow-type failure in portions of the slide mass.
Ledgewood Landslide Failure Sequence
The Ledgewood Landslide likely occurred in stages, beginning with reactivation of the previously active Driftwood Way Landslide with toe rotation, followed by a primarily lateral/translational movement toward the beach in the northern portion of the slide. This is evidenced by the displaced yet relatively intact Driftwood Way road surface in this portion of the slide and larger clumps of upright yet back-rotated trees all oriented in approximately the same direction. This translational type of movement is consistent with that postulated by Golder in their 1996/1998 reports.
The unusually large movement and reactivation of the Driftwood Way Landslide removed the buttress effect of this large soil mass and allowed the slide to progress upslope of the historic

LEDGEWOOD LANDSLIDE EVALUATION Whidbey Island, Washington
Page 26 | November 27, 2013 | GeoEngineers, Inc. File No. 0422-097-00
failure scarp and to the south. The movement turned the saturated slide debris into more of a flow-type failure. The flow failure is seen in the southern half of Figure 13, where Driftwood Way has been entirely destroyed and the trees are more randomly oriented and jack-strawed.
After the landslide moved down slope and removed the wedge of colluvium at the base of the ancient landslide headscarp, the built-up groundwater seepage and hydraulic pressure would have then been released. High volumes of groundwater were observed immediately following the slide, especially at the margins. Water continued to appear in bursts at various locations near the base of the slide scarp. The upper bluff could have been undermined from piping and blowout from the seepage forces, and then toppled onto the top of the slide mass.
Hazard Areas
The following sections present considerations for relative hazard in various areas of the Ledgewood Beach Plat.
Ledgewood Landslide Mass and Slide Margins
■ The loose slide mass is at risk of saturation from surface water and infiltration during the coming wet winter months. Additionally, winter storms will continue to erode natural buttress material from the toe of the slide mass. The Ledgewood Landslide mass will continue to be unstable until equilibrium is reached.
■ Besides the Red Tagged 1968 Driftwood Way residence, which has been destroyed, no existing residences or infrastructure remain within the slide mass. No development, including reconstruction of Driftwood Way, should be allowed in this area unless supported by monitoring results and engineering analysis for adequate stability.
■ Driftwood Way should not be reestablished through the slide area until monitoring suggests that movement has ceased. Even when monitoring shows little or no ongoing movement, the slide mass will only be marginally stable and movement could be reactivated if similar trigger points are reached and shoreline erosion continues. The slide area will not likely be seismically stable without significant mitigation efforts to increase resisting forces in the slide mass.
■ Over-steepened slopes, splayed cracks and other features were created at the north and south margin of the Ledgewood Landslide that extend beyond the obvious slide footprint. Because of proximity to the edges of the new slide, areas at the margins of the Ledgewood Landslide are at increased risk of movement.
Driftwood Way South of Ledgewood Landslide
■ The topography in the area south of the Ledgewood Landslide includes a steep beach bluff and relatively flat bench where homes are located. The ground slopes up steeply near the ancient landslide headscarp.
■ Based on our stability modeling, stability using strength values for intact block deposits of old slide debris result in factors of safety of about 1.35 at about 40 feet from the bluff. However, the factor of safety drops to about 1.0 using residual strength parameters that are associated with ground movement.

LEDGEWOOD LANDSLIDE EVALUATION Whidbey Island, Washington
November 27, 2013 | Page 27 File No. 0422-097-00
■ If slide movement is activated (triggered) in this area, it would most likely occur along the beach bluff. If significant movement starts to occur and residual (sheared) soil parameters are considered, the factor of safety drops to about 1.0, indicating that a toe block failure could extend at least 40 feet back from the top of the beach bluff. The predicted failure surfaces do not include a large global failure of the entire Driftwood Way area extending to the ancient landslide headscarp. However, if failures of the beach bluff occur, this could potentially lead to progressive failures further upslope.
■ The toe of the beach bluff is at risk to erosion during high tide/storm events. The toe of the slope is currently protected from major erosion by rockery bulkheads. Significant removal of material from the toe of the slope at the beach could trigger instability in the adjacent beach bluff.
Driftwood Way North of Ledgewood Landslide
■ The overall topography in the area north of the Ledgewood Landslide includes a series of steep slopes and narrow benches progressing to the upper bluff, with an overall gradient steeper than either the Ledgewood Landslide area or the area south of the Ledgewood Landslide. Homes are located nearer to beach level in this area.
■ Based on our stability modeling, the existing site conditions are marginally stable in areas extending well back from the beach, with a factor of safety of 1.1 to 1.2.
■ If slide movement is activated (triggered) in this area, and residual (sheared) soil parameters are considered, the factor of safety drops below 1.0 for toe failures as well as a larger failure similar to the Ledgewood Landslide. Although historical movement in the area is precipitated by surface expression and slow movement that would provide some indication of impending larger slope failure, the results of our analyses indicate that a larger and more sudden slide event could occur at this location because of the larger driving forces associated with the site geometry.
■ If the Ledgewood Landslide mass enlarges to the north, or a new slide occurs in the vicinity of the intersection between Driftwood Way and Seaward Way, it could inhibit or prevent egress/ingress from the residences to the north.
North Driftwood Way Landslide Area
■ Our site explorations generally confirmed the conditions interpreted by Golder during their previous site evaluation.
■ We agree with Golder’s assessment that sliding in this area is relatively shallow. Our assessment of this area does not provide conclusions that the conditions in this area have changed.
Fircrest Avenue above Driftwood Way
■ Soil borings from Fircrest Avenue and on properties near the crest of the bluff encountered a sequence of very dense/hard glacially consolidated soils, similar to many bluffs within Puget Sound.

LEDGEWOOD LANDSLIDE EVALUATION Whidbey Island, Washington
Page 28 | November 27, 2013 | GeoEngineers, Inc. File No. 0422-097-00
■ With the exception of the two residences at the Ledgewood Landslide headscarp (1934 and 1944 Fircrest Avenue), we conclude that the results of our study do not indicate that the homes along Fircrest Avenue are at an increased risk beyond what was present prior to the Ledgewood Landslide.
■ Typical bluff retreat should be expected, similar to other steep slope areas.
Recommendations
We recommend that the results of this evaluation be made available to the local residents of the Ledgewood Beach and Bon Air Plats. We recommend that the status of the two Red Tagged residences (1944 Fircrest Avenue and 1984 Driftwood Way) and the three Yellow Tagged residences (1934 Fircrest Avenue and 1914, 1988 Driftwood Way) remain throughout the 2013/2014 winter and spring seasons. The homeowners could perform more detailed, property-specific, studies and present conclusions to Island County to support changes in the future occupancy status. It is our opinion that no other specific actions are necessary for other residences in the area based on the present information available. However, all residents, especially those along Driftwood Way, should diligently monitor conditions in the area for changes in site conditions and along access roadways.
We recommend that ICPW implement a monitoring plan that includes, at a minimum, the following components:
■ INCLINOMETER READINGS: We recommend that the inclinometer casings and poor boy inclinometers be surveyed at least monthly during the wet season, roughly October through April for at least the next year. If movement is detected in the inclinometers or in the immediate vicinity based on visual surveys, we recommend more frequent intervals depending on life safety considerations. As previously stated, because of the periodic intervals of inclinometer readings and time required to process and analyze the data, the monitoring may not capture sudden changes in slope movement and should not be considered an “early warning system” suitable for notification to residences of impending slope failure or life safety hazards.
■ VISUAL SURVEY: We recommend that a drive-by visual survey of Driftwood Way, Seaward Way, and Fircrest Avenue paved surfaces be completed monthly during the wet season, possibly combined with the inclinometer readings. The visual survey should include monitoring for new surface cracks or displacement along the roadway surfaces, or changes in surface water flow patterns adjacent to the roadway. We recommend that residents in these same areas be encouraged to conduct periodic inspection to monitor for similar changes in their property.
■ PIEZOMETERS: We recommend that VWP data be collected and evaluated at least quarterly, or as necessary based on data storage capacity in the monitoring sensors.
LIMITATIONS
We have prepared this report for use by Island County Public Works and their authorized agents for the Ledgewood Landslide Evaluation located along Admiralty Inlet near Coupeville, Washington.

LEDGEWOOD LANDSLIDE EVALUATION Whidbey Island, Washington
November 27, 2013 | Page 29 File No. 0422-097-00
Within the limitations of scope, schedule and budget, our services have been executed in accordance with generally accepted practices in the field of geotechnical engineering in this area at the time this report was prepared. No warranty or other conditions, express or implied, should be understood.
Any electronic form, facsimile or hard copy of the original document (email, text, table, and/or figure), if provided, and any attachments are only a copy of the original document. The original document is stored by GeoEngineers, Inc. and will serve as the official document of record.
Please refer to Appendix F, Report Limitations and Guidelines for Use, for additional information pertaining to use of this report.
REFERENCES
Allen, Roy, March 26, 1991, “Report of Landslide Vicinity of Plat of Ledgewood Beach,” IC Engineer, Internal Memorandum.
Aziz Engineering Company, December 2004, “Driftwood Way Stabilization” drawing and boring logs (report unavailable).
David L. Nelson and Associates, Inc., August 20, 1990, “Engineering Geologic Consultation, Proposed Residence Drainfield, Ledgewood Beach, Block 8 Lot 4, Whidbey Island, Washington.”
Golder Associates, Inc., (Golder) March 15, 1991, “Geotechnical Study, Froman, Metri, and Caldwell Residences, Ledgewood Development, Whidbey Island, Washington.”
Golder, October 16, 1996, “Geotechnical Evaluation for the Driftwood Way Landslide Fronting Lots 1, 2, &3, Block 1 Division 1 and Adjacent Tract A, Sec 20 T31N, R2E, Plat of Ledgewood Beach.”
Golder, July 17, 1998, “Geotechnical Investigation of the Division 2 Landslide Downslope of Lots 1 through 6, Ledgewood Beach, Island County, Washington.” (Draft)
Golder, September 18, 1998, “Results of Landslide Evaluation, Seaward Way, Ledgewood Beach, Island County, Washington.”
Koloski, J.W., Schwarz, S.D., and Tubbs, D.W., 1989, Geotechnical Properties of Geologic Materials; Engineering Geology in Washington, Washington State Department of Natural Resources Bulletin 78.
Pessl, Fred, Dethier, D.P., Booth, D.B., and Minard, J.P., 1989, Surficial Geologic Map of the Port Townsend 30- by 60-Minute Quadrangle, Puget Sound Region, Washington.
Polenz, M., Schasse, H.W., Kalk, M.L., and Petersen, B.B., 2009. Geologic Map of the Camano 7.5-minute Quadrangle, Island County, Washington. Washington Division of Geology and Earth Resources. Geologic Map GM-68.

LEDGEWOOD LANDSLIDE EVALUATION Whidbey Island, Washington
Page 30 | November 27, 2013 | GeoEngineers, Inc. File No. 0422-097-00
Savage, W.Z., Morrissey, M.M., and Baum, R.L, 2000, Geotechnical Properties for Landslide-Prone Seattle-Area Glacial Deposits: United States Geologic Society Open-File Report 00-228.
Thorsen, Gerald, W., March 10, 1991, “The Driftwood Way Landslide, Analysis and Mitigation.”
Thorsen, Gerald, W., March 10, 1991, “Effects of Proposed Drainfield on Driftwood Way Slide.”
Thorsen, Gerald W., April 1991, “Geologic Review, Brandt Property, Ledgewood Beach, Division 1, G.L. 3, Lot 10.”
Thorsen, Gerald W., December 4, 2002, “Driftwood Way South Landslide”, to Pete Seybert and Randy Bracket at IC.
Washington State Department of Ecology, 1977, Coastal Zone Atlas of Washington: volume 1, Coupeville: Washington Department of Ecology, Publication DOE 77-21-1.

Earth Science + Technology
Type Name of Services HereName of Project Here
forType Client Name Here
Type Date of Report Here

Fircrest Ave
Donahey Rd
Don
na
Dr
Ba
njo
Dr
Mitchell Dr
Virg
inia A
ve
Gramayre Rd
N Bluff Rd
Tero
nda
Dr
Bon Air Dr
Pin
ecr
est
Ave
Driftw
ood
Way
Puget Dr
Cox Dr
Houston Rd
Driftw
ood Ln
Inve
rne
ss Wa
yS
eac
rest
Ln
Ellwood Dr
Ced
arc
rest
Ave
Se
aview A
ve
Rovig
Pl
Hocker St
Nara Ln
Tero
nda
Be
ach
Rd
Glenmoore Ln
E Greenwood Pl
Seaward Way
UV525
µ
SITE
Vicinity Map
Figure 1
Ledgewood Landslide EvaluationWhidbey Island, Washington
!
Snohomish
IslandJeffersonClallam
Ebeys Landing Natl Hist ResEbeys Landing Natl Hist Res
2,000 2,0000
Feet
Data Sources: ESRI Data & Maps
Notes:1. The locations of all features shown are approximate.2. This drawing is for information purposes. It is intended to assist in
showing features discussed in an attached document. GeoEngineers, Inc. can not guarantee the accuracy and content of electronic files. The master file is stored by GeoEngineers, Inc. and will serve as the official record of this communication.
3. It is unlawful to copy or reproduce all or any part thereof, whether for personal use or resale, without permission.
Projection: NAD 1983 UTM Zone 10N
Pat
h: P
:\0\
04
2209
7\G
IS\M
XD
\042
2097
00_
Vic
inity
Ma
p.m
xd
Ma
p R
evis
ed:
25
Oct
obe
r 2
013
tn
ash

;
;
;
;
;
;
;
;
;
;
;
;
;
;
;
;
;
;
;
;
;
;
;
;
;
;
;
;
Ledgewood Beach Plat
Ancient Landslide Complex
North Driftwood Way Landslide Area
Ledgwood Landslide Area
Driftwood Way Landslide Area
Bon AirPlat
Qgtwtr
wtr
Qls
Qgo
Qb
Qgas
Qp
Qf
Qls
Qc
Qgpc
Qgpc
Qgpc
Copyright:© 2013 National Geographic Society, i-cubed
µ1,250 1,2500
Feet
Off
ice
: B
AM
P
ath
: P
:\0
\04
22
097
\GIS
\MX
D\G
eo
log
y.m
xd
M
ap
Re
vise
d: 1
0/2
5/2
01
3
m
tro
ost
Generalized Geology and Landslide Map 1:100,000
Ledgewood Landslide EvaluationWhidbey Island, Washington
Figure 2
Department of Natural ResourcesMapped Ledgwood Landslide -Per Quick Report dated March28, 2013
Notes:1. The locations of all features shown are approximate. 2. This drawing is for information purposes. It is intended to assist in showing features discussed in an attached document. GeoEngineers, Inc. cannot guaranteethe accuracy and content of electronic files. The master file is stored by GeoEngineers, Inc. and will serve as the official record of this communication. 3. It is unlawful to copy or reproduce all or any part thereof, whether for personal use or resale, without permission.Data Sources: Geology WADNR 1:100,000. State Plane Washington North FIPS 4601 (Feet), North American Datum 1983. North arrow oriented to grid north.
Southern Whidbey Island
Fault Zone
North Driftwood Way Slide Area
Previously Active Driftwood Way Slide Area
Qls - Landslide Deposits
Qgpc - Continental Glacial Drift
Qgo - Continental Glacial Outwash
Qc - Continental Sedimentary Deposits
Qp - Peat
Qgt - Glacial Till


Figure 14
Cumulative 12-Month PrecipitationPrevious 113 Years
Ledgewood Landslide EvaluationWhidbey Island, Washington
SharePoint: 004220970/Working/Report Figures/Island County Precipitation Figures.ppt SWC:tln 09-23-13
Average Annual Precipitation = 20.2 inches
Data from http://www.wrcc.dr.edu/Coupeville 1S/ COOP ID: 451783
0
5
10
15
20
25
30
35
1900 1910 1920 1930 1940 1950 1960 1970 1980 1990 2000 2010 2020
Cum
ulat
ive
12-M
onth
Pre
cipi
tatio
n (in
)Island County Database of Monthly Precipitation Accumulation
Sum of Previous 12 Months of Precipitation Linear Trendline

Figure 15
Cumulative 12-Month PrecipitationPrevious 13 Years
Ledgewood Landslide EvaluationWhidbey Island, Washington
SharePoint: 004220970/Working/Report Figures/Island County Precipitation Figures.ppt SWC:tln 09-23-13
Average Annual Precipitation = 20.2 inches
Data from http://www.wrcc.dr.edu/Coupeville 1S/ COOP ID: 451783
0
5
10
15
20
25
30
35
1998 2001 2004 2006 2009 2012 2014
Cum
ulat
ive
12-M
onth
Pre
cipi
tatio
n (in
)Island County Database of Monthly Precipitation Accumulation
Sum of Previous 12 Months of Precipitation Linear Trendline

Earth Science + Technology
Type Name of Services HereName of Project Here
forType Client Name Here
Type Date of Report Here

APPENDIX A Field Explorations

LEDGEWOOD LANDSLIDE EVALUATION Whidbey Island, Washington
November 27, 2013 | Page A-1 File No. 0422-097-00
APPENDIX A FIELD EXPLORATIONS
Field Explorations
GeoEngineers completed eight borings (GEI-1 through GEI-8) at the site. The explorations were completed to depths ranging from 111 to 281 feet bgs. The borings were completed in three separate phases with the majority of the borings completed during the third phase in June 2013. The borings were completed with both truck and track-mounted drill rigs subcontracted to GeoEngineers, Inc. The locations of the explorations were determined using a handheld GPS and measuring from existing site features, and should be considered approximate. The elevations indicated on the logs were determined using Google Earth and LiDAR data and also should be considered approximate. GeoEngineers also reviewed previous explorations by others contained in the references identified at the end of the report. The approximate exploration locations of the GeoEngineers borings and others at the site are shown in Figure 3.
Boring GEI-1 was completed as a continuous core using a Sonic drill rig. Sonic drilling uses high frequency vibration and rotation of the core barrel and drill rods to advance the boring. Generally, continuous five-foot cores were obtained and put into specially constructed wooden core boxes for visual observation, detailed logging, and photographs. Some grab samples were obtained for laboratory testing. Since the core barrel is advanced using high frequency vibration, the cores are disturbed and the water content is oftentimes affected because of the heat associated with the friction from the drilling action. Disturbed samples are not available for specialty strength testing. The core samples and boxes were provided to Washington State Department of Natural Resources (DNR) at their request.
The other borings were completed using mud-rotary techniques. The soils encountered in the all borings were generally sampled at 2.5, 5 or 10-foot vertical intervals with a 2-inch or 3-inch outside diameter split-barrel standard penetration test (SPT) sampler. The samples were obtained by driving the sampler 18 inches into the soil with a 140 or 300-pound automatic hammer free-falling 30 inches. The number of blows required for each 6 inches of penetration was recorded. The blow count (“N-value”) of the soil was calculated as the number of blows required for the final 12 inches of penetration. This resistance, or N-value, provides a measure of the relative density of granular soils and the relative consistency of cohesive soils. Where very dense soil conditions preclude driving the full 18-inches, the penetration resistance for the partial penetration was entered on the logs. The blow counts are shown on the boring logs at the respective sample depths.
Sonic Cores logged and stored in labeled boxes.

LEDGEWOOD LANDSLIDE EVALUATION Whidbey Island, Washington
Page A-2 | November 27, 2013 | GeoEngineers, Inc. File No. 0422-097-00
The explorations were continuously monitored by geoscience or geotechnical engineering staff from our firm who examined and classified the soils encountered, obtained representative soil samples and returned them to our laboratory for further evaluation and laboratory testing, observed groundwater conditions and prepared a detailed log of each exploration. Specific samples were selected for laboratory testing; the laboratory testing program and results are presented in Appendix B and in the individual boring longs, as appropriate. Soils encountered were classified visually in general accordance with ASTM D-2488-90, which is described in Figure A-1. An explanation of our boring log symbols is also shown in Figure A-1.
The logs of the borings are presented in Figures A-2 through A-9. The exploration logs are based on our interpretation of the field and laboratory data and indicate the various types of soils encountered. They also indicate the depths at which these soils or their characteristics change, although the change might actually be gradual. If the change occurred between samples in the boring, it was interpreted.
Instrumentation was also installed in all of the borings, consisting of vibrating wire piezometers (VWPs) to record hydrostatic pressures interpreted as groundwater levels, slope inclinometers to be able to read ground displacement, and a “poor boy” in GEI-5. Details regarding the field instrumentation program are presented in Appendix C.
A summary of the field explorations, including approximate locations, surface elevations, depth drilled, termination depth elevation, and instrumentation is presented below in Table A-1.

LEDGEWOOD LANDSLIDE EVALUATION Whidbey Island, Washington
November 27, 2013 | Page A-3 File No. 0422-097-00
TABLE A-1 – FIELD EXPLORATION SUMMARY
Boring Name
Location/ Coordinates
Drilling Method
Surface Elev. (ft)
Boring Depth (ft)
Bottom of Boring Elev. (ft)
VWP Elev. (ft)
Inclinometer Installation
GEI-1 1934 Fircrest Ave. 48.139887,-122.6002
Sonic 227.5 281 -53.5
-26.5 74.5 160.5 193.5
No
GEI-2
Seaward Way and Driftwood Way 48.140668, 22.603034
Mud-Rotary
79 130.75 -51.75 -16 -51
Yes
GEI-3
Near previous 1968 Driftwood Way residence 48.139384, -122.602534
Mud-Rotary
60 150.25 -90.25 -57.5 15
Yes
GEI-4
1984/1988 Driftwood Way 48.138141, -122.601646
Mud-Rotary
80 130.5 -50.5 27.5 12.5
Yes
GEI-5
North Driftwood Way 48.143702, -122.60417
Mud-Rotary
60 111.25 -51.25 NA PVC “poor boy”
GEI-6 1990 Fircrest Ave. 48.137672, -122.599696
Mud-Rotary
225 225.75 -0.75 0 115 180
No
GEI-7 1882 Fircrest Ave. 48.142045, -122.601929
Mud-Rotary
191.5 250.5 -59 -18.5 81.5 141.5
No
GEI-8 1910 Fircrest Ave. 48.140581, -122.601433
Mud-Rotary
197.5 190.5 7 47.5 97.5 147.5
No

Sheen Classification
NOTE: The reader must refer to the discussion in the report text and the logs of explorations for a proper understanding of subsurfaceconditions. Descriptions on the logs apply only at the specific exploration locations and at the time the explorations were made; they arenot warranted to be representative of subsurface conditions at other locations or times.
CC
Asphalt Concrete
NSSSMSHSNT
Shelby tube
ADDITIONAL MATERIAL SYMBOLS
%FALCACPCSDSHAMCMDOCPMPIPPPPMSATXUCVS
Graphic Log Contact
Distinct contact between soil strata orgeologic units
Approximate location of soil stratachange within a geologic soil unit
Approximate location of soil stratachange within a geologic soil unit
Measured groundwater level inexploration, well, or piezometer
Measured free product in well orpiezometer
GRAPH
Topsoil/Forest Duff/Sod
Direct-Push
Crushed Rock/Quarry Spalls
Blowcount is recorded for driven samplers as the numberof blows required to advance sampler 12 inches (ordistance noted). See exploration log for hammer weightand drop.
A "P" indicates sampler pushed using the weight of thedrill rig.
FIGURE A-1
2.4-inch I.D. split barrel
SYMBOLS TYPICAL
KEY TO EXPLORATION LOGS
CR
Bulk or grab
Piston
Standard Penetration Test (SPT)
DESCRIPTIONSLETTER
Distinct contact between soil strata orgeologic units
TSGC
PT
OH
CH
MH
OL
GM
GP
GW
DESCRIPTIONSTYPICAL
LETTER
(APPRECIABLE AMOUNTOF FINES)
MAJOR DIVISIONS
POORLY-GRADED SANDS,GRAVELLY SAND
PEAT, HUMUS, SWAMP SOILSWITH HIGH ORGANICCONTENTS
CLEAN SANDS
GRAVELS WITHFINES
CLEANGRAVELS
HIGHLY ORGANIC SOILS
SILTSAND
CLAYS
SILTSAND
CLAYS
SANDAND
SANDYSOILS
GRAVELAND
GRAVELLYSOILS
(LITTLE OR NO FINES)
FINEGRAINED
SOILS
COARSEGRAINED
SOILS
SW
MORE THAN 50%OF COARSEFRACTION
RETAINED ON NO.4 SIEVE
CL
WELL-GRADED SANDS,GRAVELLY SANDS
SILTY GRAVELS, GRAVEL - SAND- SILT MIXTURES
LIQUID LIMITGREATER THAN 50
SILTY SANDS, SAND - SILTMIXTURES
(APPRECIABLE AMOUNTOF FINES)
SOIL CLASSIFICATION CHART
LIQUID LIMITLESS THAN 50
SANDS WITHFINES
SP(LITTLE OR NO FINES)
ML
SC
SM
NOTE: Multiple symbols are used to indicate borderline or dual soil classifications
MORE THAN 50%OF COARSEFRACTION
PASSING NO. 4SIEVE
CLAYEY GRAVELS, GRAVEL -SAND - CLAY MIXTURES
CLAYEY SANDS, SAND - CLAYMIXTURES
INORGANIC SILTS, ROCKFLOUR, CLAYEY SILTS WITHSLIGHT PLASTICITY
ORGANIC SILTS AND ORGANICSILTY CLAYS OF LOWPLASTICITY
INORGANIC SILTS, MICACEOUSOR DIATOMACEOUS SILTYSOILS
ORGANIC CLAYS AND SILTS OFMEDIUM TO HIGH PLASTICITY
INORGANIC CLAYS OF HIGHPLASTICITY
MORE THAN 50%PASSING NO. 200
SIEVE
MORE THAN 50%RETAINED ON NO.
200 SIEVE
WELL-GRADED GRAVELS,GRAVEL - SAND MIXTURES
POORLY-GRADED GRAVELS,GRAVEL - SAND MIXTURES
INORGANIC CLAYS OF LOW TOMEDIUM PLASTICITY, GRAVELLYCLAYS, SANDY CLAYS, SILTYCLAYS, LEAN CLAYS
GRAPH
SYMBOLS
AC
Cement Concrete
Sampler Symbol Descriptions
Groundwater Contact
Material Description Contact
No Visible SheenSlight SheenModerate SheenHeavy SheenNot Tested
Laboratory / Field TestsPercent finesAtterberg limitsChemical analysisLaboratory compaction testConsolidation testDirect shearHydrometer analysisMoisture contentMoisture content and dry densityOrganic contentPermeability or hydraulic conductivityPlasticity indexPocket penetrometerParts per millionSieve analysisTriaxial compressionUnconfined compressionVane shear

1
2
3
4
59
82
29
53
5 inches asphalt concreteBrown silty fine to coarse sand with gravel
(medium dense, moist) (fill)
Gray silty fine to coarse sand with gravel andoccasional cobble (very dense, moist)
Gray fine to medium sand with silt and tracegravel (very dense, moist)
Laminated silt lense observed
Silt lense observed
Gray silty fine to medium sand with gravel(medium dense, moist)
Light gray silt (medium stiff, moist to wet)
Gray silty fine to coarse sand with occasionalgravel (very dense, moist to wet)
Gray silt with gravel (hard, moist)
AC
SM
SM
SP-SM
SM
ML
SM
ML
Hand-augered core
Begin Sonic core at 1 foot
11
14
11
13
TotalDepth (ft)
HammerData
SystemDatum
Start EndChecked ByLogged By
SWCDrilled
Notes:
AJH
Surface Elevation (ft)Vertical Datum
Driller
GroundwaterDepth toWater (ft)Date Measured Elevation (ft)
LatitudeLongitude
48.139887-122.6002
600 T
Boart Longyear DrillingMethod
Sonic281
Autohammer140 (lbs) / 30 (in) Drop
DrillingEquipment
Geographic
4/25/20134/22/2013
227.5NAVD88
Note: See Figure A-1 for explanation of symbols.Grab samples referenced as G-#.
FIELD DATA
Dep
th (
feet
)
0
5
10
15
20
25
Inte
rval
Ele
vatio
n (f
eet)
225
220
215
210
205
Sam
ple
Nam
eT
estin
g
Rec
over
ed (
in)
Gra
phic
Log
Co
llec
ted
Sam
ple
Blo
ws/
foot
MATERIALDESCRIPTION
Gro
upC
lass
ifica
tion
Wat
er L
evel
Log of Boring GEI-1Ledgewood Landslide Evaluation
Island County, Washington
0422-097-00
Project:
Project Location:
Project Number:Figure A-2
Sheet 1 of 10Bel
lingh
am:
Dat
e:10
/25/
13 P
ath:
P:\
0\04
2209
7\00
\GIN
T\0
4220
9700
.GP
J D
BT
empl
ate/
LibT
empl
ate:
GE
OE
NG
INE
ER
S8.
GD
T/G
EI8
_GE
OT
EC
H_S
TA
ND
AR
D
REMARKS
Moi
stur
eC
onte
nt,
%
Dry
Den
sity
,(p
cf)

5
6
7
G-1
G-2
8
G-3
52
57
62
Gray sandy silt laminated with ½ inch layers ofsilty sand and occasional fine gravel (hard,moist)
Becomes wet
Gray fine to medium sand with silt andoccasional gravel with ½ inch thick layer ofsilty fine sand (very dense, wet)
Gray silt with sand (hard, moist)
Very thin sand lenses observed
Gray silt with faint trace fine sand laminations(hard, moist)
Gray clayey silt with faint lamination and finesand partings (hard, moist)
Sand grades out
With clayey lenses
ML
SP-SM
ML
ML
ML
Vibrating wire piezometer (ID 1300384),installed in bentonite/cement grout
No recovery, no blowcounts, SPT sampler ona 4-inch rock
16
13
27
21
21
Note: See Figure A-1 for explanation of symbols.Grab samples referenced as G-#.
FIELD DATA
Dep
th (
feet
)
25
30
35
40
45
50
Inte
rval
Ele
vatio
n (f
eet)
200
195
190
185
180
175
Sam
ple
Nam
eT
estin
g
Rec
over
ed (
in)
Gra
phic
Log
Co
llec
ted
Sam
ple
Blo
ws/
foot
MATERIALDESCRIPTION
Gro
upC
lass
ifica
tion
Wat
er L
evel
Log of Boring GEI-1 (continued)Ledgewood Landslide Evaluation
Island County, Washington
0422-097-00
Project:
Project Location:
Project Number:Figure A-2
Sheet 2 of 10Bel
lingh
am:
Dat
e:10
/25/
13 P
ath:
P:\
0\04
2209
7\00
\GIN
T\0
4220
9700
.GP
J D
BT
empl
ate/
LibT
empl
ate:
GE
OE
NG
INE
ER
S8.
GD
T/G
EI8
_GE
OT
EC
H_S
TA
ND
AR
D
REMARKS
Moi
stur
eC
onte
nt,
%
Dry
Den
sity
,(p
cf)

9
G-4
10a
10b
G-5
G-6AL
11
G-7
G-8
69
61
50/2"
Gray silt with trace fine sand and occasionalcobbles; dilatant (hard, wet)
Gray silt to clayey silt with trace fine sand andfine gravels, laminated with fine sand partings(very stiff to hard, moist)
Gray fine to medium sand with silt to trace silt(very dense, wet)
Gray clay with occasional fine gravel, withlaminations and sand partings (wet alongpartings) (hard, moist to wet)
Breaks blocky
Increased gravel content
Cobble encountered
Cobble encounteredGray fine sandy silt with occasional fine gravel
(hard, moist to wet)
Massive with gravel dropstones
ML
ML
SP-SM
CL
ML
Vibrating wire piezometer (ID12-7921),installed in bentonite/cement grout
AL (LL= 42, PI = 22)
No recovery, SPT bounced on rock
27
24
24
29
18
20
Note: See Figure A-1 for explanation of symbols.Grab samples referenced as G-#.
FIELD DATA
Dep
th (
feet
)
55
60
65
70
75
80
Inte
rval
Ele
vatio
n (f
eet)
170
165
160
155
150
145
Sam
ple
Nam
eT
estin
g
Rec
over
ed (
in)
Gra
phic
Log
Co
llec
ted
Sam
ple
Blo
ws/
foot
MATERIALDESCRIPTION
Gro
upC
lass
ifica
tion
Wat
er L
evel
Log of Boring GEI-1 (continued)Ledgewood Landslide Evaluation
Island County, Washington
0422-097-00
Project:
Project Location:
Project Number:Figure A-2
Sheet 3 of 10Bel
lingh
am:
Dat
e:10
/25/
13 P
ath:
P:\
0\04
2209
7\00
\GIN
T\0
4220
9700
.GP
J D
BT
empl
ate/
LibT
empl
ate:
GE
OE
NG
INE
ER
S8.
GD
T/G
EI8
_GE
OT
EC
H_S
TA
ND
AR
D
REMARKS
Moi
stur
eC
onte
nt,
%
Dry
Den
sity
,(p
cf)

G-9
G-10
G-11
12a
12b
G-12
G-13%F
13
G-14%F
50/4"
50/6"
Gray silt with fine sand and occasional finegravel; dilatant (hard, moist to wet)
Cobble encountered
Cobble encountered
Cobble encountered; with increased moisture
Increased sand and gravel content; distortedbedding
Gray silt (hard, moist to wet)
Gray sandy silt with occasional gravel to siltysand with gravel (stiff/dense, moist to wet)
Gray silt, massive with ¼ inch thick dark grayorganic layer (hard, moist)
Gray silt with fine sand, faint lamination, andlayer of sandy silt with clay and gravel (hard,moist)
Brown silt (hard, moist)Brown fine to medium sand with silt (very dense,
wet)
Brown silt (hard, moist)Brown fine to coarse sand with silt and gravel
(very dense, moist)
Brown-gray fine to coarse sand with gravel(dense, moist)
Brown fine to medium sand with silt andoccasional gravel (dense, moist)
ML
ML
ML/SM
ML
ML
ML
SP-SM
ML
SP-SM
SP
SP-SM
%F = 6
%F = 4
15
18
15
6
7
Note: See Figure A-1 for explanation of symbols.Grab samples referenced as G-#.
FIELD DATA
Dep
th (
feet
)
85
90
95
100
105
110
Inte
rval
Ele
vatio
n (f
eet)
140
135
130
125
120
115
Sam
ple
Nam
eT
estin
g
Rec
over
ed (
in)
Gra
phic
Log
Co
llec
ted
Sam
ple
Blo
ws/
foot
MATERIALDESCRIPTION
Gro
upC
lass
ifica
tion
Wat
er L
evel
Log of Boring GEI-1 (continued)Ledgewood Landslide Evaluation
Island County, Washington
0422-097-00
Project:
Project Location:
Project Number:Figure A-2
Sheet 4 of 10Bel
lingh
am:
Dat
e:10
/25/
13 P
ath:
P:\
0\04
2209
7\00
\GIN
T\0
4220
9700
.GP
J D
BT
empl
ate/
LibT
empl
ate:
GE
OE
NG
INE
ER
S8.
GD
T/G
EI8
_GE
OT
EC
H_S
TA
ND
AR
D
REMARKS
Moi
stur
eC
onte
nt,
%
Dry
Den
sity
,(p
cf)

G-15
G-16
G-17%F
14
G-18
G-19%F
G-20
50/4"
Brown fine to medium sand (very dense, moist)
With trace gravel
Grades with silt
With silt clasts
Brown fine to medium sand with gravel and silt(very dense, moist)
With layer of silty fine to medium sand
Silt fragments observed
Silt fragments observed
SP
SP-SM
%F = 6
%F = 15
11
9
Note: See Figure A-1 for explanation of symbols.Grab samples referenced as G-#.
FIELD DATA
Dep
th (
feet
)
115
120
125
130
135
140
Inte
rval
Ele
vatio
n (f
eet)
110
105
100
95
90
85
Sam
ple
Nam
eT
estin
g
Rec
over
ed (
in)
Gra
phic
Log
Co
llec
ted
Sam
ple
Blo
ws/
foot
MATERIALDESCRIPTION
Gro
upC
lass
ifica
tion
Wat
er L
evel
Log of Boring GEI-1 (continued)Ledgewood Landslide Evaluation
Island County, Washington
0422-097-00
Project:
Project Location:
Project Number:Figure A-2
Sheet 5 of 10Bel
lingh
am:
Dat
e:10
/25/
13 P
ath:
P:\
0\04
2209
7\00
\GIN
T\0
4220
9700
.GP
J D
BT
empl
ate/
LibT
empl
ate:
GE
OE
NG
INE
ER
S8.
GD
T/G
EI8
_GE
OT
EC
H_S
TA
ND
AR
D
REMARKS
Moi
stur
eC
onte
nt,
%
Dry
Den
sity
,(p
cf)
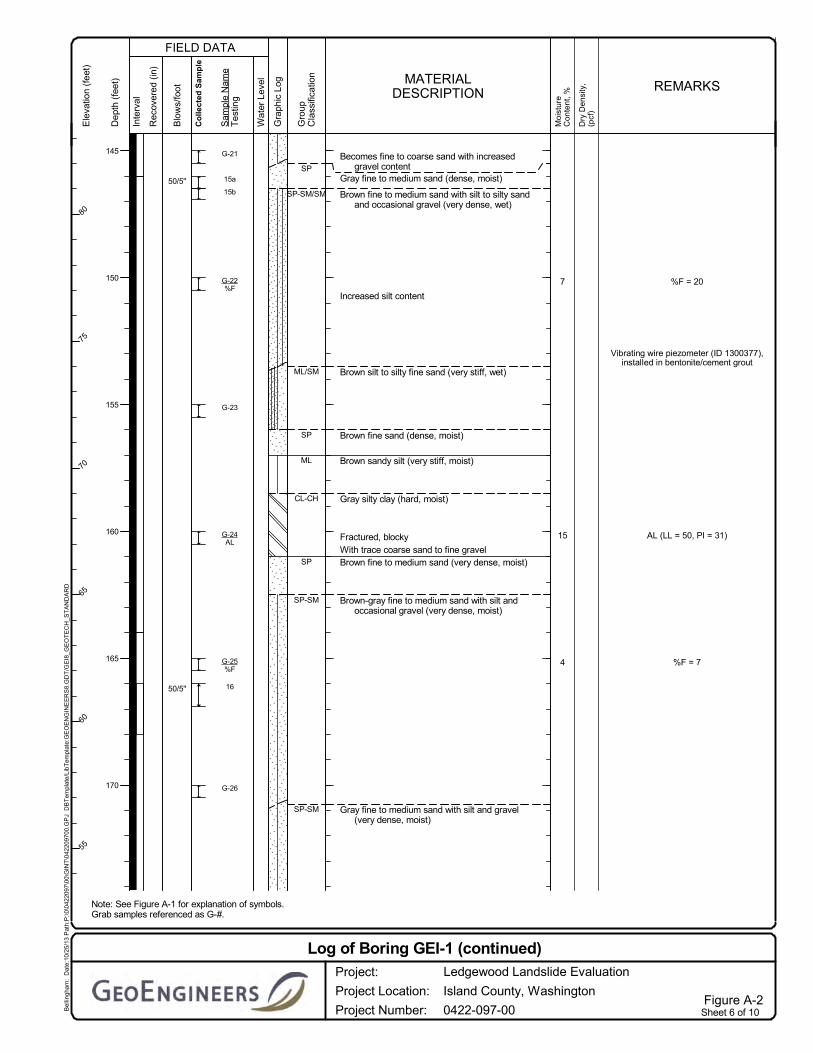
G-21
15a
15b
G-22%F
G-23
G-24AL
G-25%F
16
G-26
50/5"
50/5"
Becomes fine to coarse sand with increasedgravel content
Gray fine to medium sand (dense, moist)
Brown fine to medium sand with silt to silty sandand occasional gravel (very dense, wet)
Increased silt content
Brown silt to silty fine sand (very stiff, wet)
Brown fine sand (dense, moist)
Brown sandy silt (very stiff, moist)
Gray silty clay (hard, moist)
Fractured, blockyWith trace coarse sand to fine gravelBrown fine to medium sand (very dense, moist)
Brown-gray fine to medium sand with silt andoccasional gravel (very dense, moist)
Gray fine to medium sand with silt and gravel(very dense, moist)
SP
SP-SM/SM
ML/SM
SP
ML
CL-CH
SP
SP-SM
SP-SM
%F = 20
Vibrating wire piezometer (ID 1300377),installed in bentonite/cement grout
AL (LL = 50, PI = 31)
%F = 7
7
15
4
Note: See Figure A-1 for explanation of symbols.Grab samples referenced as G-#.
FIELD DATA
Dep
th (
feet
)
145
150
155
160
165
170
Inte
rval
Ele
vatio
n (f
eet)
80
75
70
65
60
55
Sam
ple
Nam
eT
estin
g
Rec
over
ed (
in)
Gra
phic
Log
Co
llec
ted
Sam
ple
Blo
ws/
foot
MATERIALDESCRIPTION
Gro
upC
lass
ifica
tion
Wat
er L
evel
Log of Boring GEI-1 (continued)Ledgewood Landslide Evaluation
Island County, Washington
0422-097-00
Project:
Project Location:
Project Number:Figure A-2
Sheet 6 of 10Bel
lingh
am:
Dat
e:10
/25/
13 P
ath:
P:\
0\04
2209
7\00
\GIN
T\0
4220
9700
.GP
J D
BT
empl
ate/
LibT
empl
ate:
GE
OE
NG
INE
ER
S8.
GD
T/G
EI8
_GE
OT
EC
H_S
TA
ND
AR
D
REMARKS
Moi
stur
eC
onte
nt,
%
Dry
Den
sity
,(p
cf)

G-27
G-28
G-29%F
17
G-30%F
G-31
G-32%F
50/6"
Increased coarse sand and gravel content
Brown-gray silty fine to medium sand withoccasional gravel (very dense, moist)
Gray fine sand (very dense, wet)
Grades with silt lenses
Light brown fine sand with silt and silt clasts (verydense, moist)
SM
SP
SP-SM
%F = 17
%F = 12
%F = 9
5
15
4
Note: See Figure A-1 for explanation of symbols.Grab samples referenced as G-#.
FIELD DATA
Dep
th (
feet
)
175
180
185
190
195
200
Inte
rval
Ele
vatio
n (f
eet)
50
45
40
35
30
25
Sam
ple
Nam
eT
estin
g
Rec
over
ed (
in)
Gra
phic
Log
Co
llec
ted
Sam
ple
Blo
ws/
foot
MATERIALDESCRIPTION
Gro
upC
lass
ifica
tion
Wat
er L
evel
Log of Boring GEI-1 (continued)Ledgewood Landslide Evaluation
Island County, Washington
0422-097-00
Project:
Project Location:
Project Number:Figure A-2
Sheet 7 of 10Bel
lingh
am:
Dat
e:10
/25/
13 P
ath:
P:\
0\04
2209
7\00
\GIN
T\0
4220
9700
.GP
J D
BT
empl
ate/
LibT
empl
ate:
GE
OE
NG
INE
ER
S8.
GD
T/G
EI8
_GE
OT
EC
H_S
TA
ND
AR
D
REMARKS
Moi
stur
eC
onte
nt,
%
Dry
Den
sity
,(p
cf)

G-33
G-34
G-35
G-36%F
G-37
Becomes gray-brown fine to medium sand withincreasing silt content
Light brown fine to medium sand with silt (dense,wet)
Becomes gray
Gray fine to medium sand with silt to trace silt(dense, wet)
With silt clasts
Gravel encountered
Silt lense less than 1 inch thick
SP-SM
SP-SM/SP
No recovery from 206 to 216 feet
%F = 1218
Note: See Figure A-1 for explanation of symbols.Grab samples referenced as G-#.
FIELD DATA
Dep
th (
feet
)
205
210
215
220
225
230
Inte
rval
Ele
vatio
n (f
eet)
20
15
10
5
0
-5
Sam
ple
Nam
eT
estin
g
Rec
over
ed (
in)
Gra
phic
Log
Co
llec
ted
Sam
ple
Blo
ws/
foot
MATERIALDESCRIPTION
Gro
upC
lass
ifica
tion
Wat
er L
evel
Log of Boring GEI-1 (continued)Ledgewood Landslide Evaluation
Island County, Washington
0422-097-00
Project:
Project Location:
Project Number:Figure A-2
Sheet 8 of 10Bel
lingh
am:
Dat
e:10
/25/
13 P
ath:
P:\
0\04
2209
7\00
\GIN
T\0
4220
9700
.GP
J D
BT
empl
ate/
LibT
empl
ate:
GE
OE
NG
INE
ER
S8.
GD
T/G
EI8
_GE
OT
EC
H_S
TA
ND
AR
D
REMARKS
Moi
stur
eC
onte
nt,
%
Dry
Den
sity
,(p
cf)

G-38
G-39%F
G-40
G-41
G-42
G-43
G-44AL
G-45
Discontinuous silt lense
Decreased silt content
Silt clast encountered
Gray silty clay to clayey silt with trace fine sand;some blockiness (hard, wet)
Gray silty clay; massive (hard, wet)
With occasional gravel
Becomes clayey
Gray clay (hard, wet)
CL/ML
CL
CL
Heave encountered
%F = 2
Vibrating wire piezometer (ID 1300378),installed in bentonite/cement grout
AL (LL = 29, PI = 9)
21
16
Note: See Figure A-1 for explanation of symbols.Grab samples referenced as G-#.
FIELD DATA
Dep
th (
feet
)
235
240
245
250
255
260
Inte
rval
Ele
vatio
n (f
eet)
-10
-15
-20
-25
-30
-35
Sam
ple
Nam
eT
estin
g
Rec
over
ed (
in)
Gra
phic
Log
Co
llec
ted
Sam
ple
Blo
ws/
foot
MATERIALDESCRIPTION
Gro
upC
lass
ifica
tion
Wat
er L
evel
Log of Boring GEI-1 (continued)Ledgewood Landslide Evaluation
Island County, Washington
0422-097-00
Project:
Project Location:
Project Number:Figure A-2
Sheet 9 of 10Bel
lingh
am:
Dat
e:10
/25/
13 P
ath:
P:\
0\04
2209
7\00
\GIN
T\0
4220
9700
.GP
J D
BT
empl
ate/
LibT
empl
ate:
GE
OE
NG
INE
ER
S8.
GD
T/G
EI8
_GE
OT
EC
H_S
TA
ND
AR
D
REMARKS
Moi
stur
eC
onte
nt,
%
Dry
Den
sity
,(p
cf)

G-46
G-47AL
G-48
G-49
G-50aAL
G-50bAL
G-51
With fine sand partingsGray silty clay with trace fine sand and
occasional fine gravel (hard, wet)
Gray clay with trace fine sand and occasionalgravel (hard, wet)
Increased gravel contentGray clayey fine sandy silt to silty fine sand with
clay (hard, wet)
Gray clay with occasional sand and gravel (hard,wet)
Wavy, irregular surfaces from 275 to 277 feet
Becomes fat clay
Massive with dropstones and zones of increasedsand and gravel content
CL-ML
CL
ML/SM
CL-CH
AL (LL = 25, PI = 5)
AL (LL = 42, PI = 20)
AL (LL = 54, PI = 36)
16
18
16
Note: See Figure A-1 for explanation of symbols.Grab samples referenced as G-#.
FIELD DATA
Dep
th (
feet
)
265
270
275
280
Inte
rval
Ele
vatio
n (f
eet)
-40
-45
-50
Sam
ple
Nam
eT
estin
g
Rec
over
ed (
in)
Gra
phic
Log
Co
llec
ted
Sam
ple
Blo
ws/
foot
MATERIALDESCRIPTION
Gro
upC
lass
ifica
tion
Wat
er L
evel
Log of Boring GEI-1 (continued)Ledgewood Landslide Evaluation
Island County, Washington
0422-097-00
Project:
Project Location:
Project Number:Figure A-2
Sheet 10 of 10Bel
lingh
am:
Dat
e:10
/25/
13 P
ath:
P:\
0\04
2209
7\00
\GIN
T\0
4220
9700
.GP
J D
BT
empl
ate/
LibT
empl
ate:
GE
OE
NG
INE
ER
S8.
GD
T/G
EI8
_GE
OT
EC
H_S
TA
ND
AR
D
REMARKS
Moi
stur
eC
onte
nt,
%
Dry
Den
sity
,(p
cf)

1
2
3
4
5
6a
6bSA
7
8
9
1
3
6
6
18
14
0
4
3
9
17
27
13
41
58
50/3"
50/6"
50/5"
2½ inches asphalt concreteBrown silty fine to coarse sand with gravel
(medium dense, moist) (old slide debris)
Decreasing gravel content
Light brown silt (hard, moist) (possible intact oldlandslide debris)
With fine sand and occasional gravelLight brown fine to coarse sand with silt to silty
fine to medium sand; with thin silt lenses(very dense, wet)
Gray fine to coarse sand with gravel (very dense,moist)
Gray-brown fine to coarse sand with gravel andsilt to trace silt (very dense, moist to wet)
AC
SM
ML
SP-SM/SM
SP
SP-SM
SA (%F = 31)
17
30
25
20
TotalDepth (ft)
HammerData
SystemDatum
Start EndChecked ByLogged By
SWCDrilled
Notes:
AJH
Surface Elevation (ft)Vertical Datum
Driller
GroundwaterDepth toWater (ft)Date Measured Elevation (ft)
LatitudeLongitude
48.140668-122.603034
BK-81
Holocene DrillingMethod
Mud Rotary130.75
Inclinometer installed
Autohammer140 (lbs) / 30 (in) Drop
DrillingEquipment
Geographic
5/31/20135/29/2013
79NAVD88
Note: See Figure A-1 for explanation of symbols.Grab samples referenced as G-#.
FIELD DATA
Dep
th (
feet
)
0
5
10
15
20
25
Inte
rval
Ele
vatio
n (f
eet)
75
70
65
60
55
Sam
ple
Nam
eT
estin
g
Rec
over
ed (
in)
Gra
phic
Log
Co
llec
ted
Sam
ple
Blo
ws/
foot
MATERIALDESCRIPTION
Gro
upC
lass
ifica
tion
Wat
er L
evel
Log of Boring GEI-2Ledgewood Landslide Evaluation
Island County, Washington
0422-097-00
Project:
Project Location:
Project Number:Figure A-3Sheet 1 of 5B
ellin
gham
: D
ate:
10/2
5/13
Pat
h:P
:\0\
0422
097\
00\G
INT
\042
2097
00.G
PJ
DB
Tem
plat
e/Li
bTem
plat
e:G
EO
EN
GIN
EE
RS
8.G
DT
/GE
I8_G
EO
TE
CH
_ST
AN
DA
RD
REMARKS
Moi
stur
eC
onte
nt,
%
Dry
Den
sity
,(p
cf)

10SA
11
12
13
14
15
16
17
18SA
19a
19b
20a20b
21a
21b
4
3
3
10
4
0
3
4
6
8
5.5
14
50/4"
50/3"
50/4"
50/4"
50/1"
50/5"
50/5"
50/2"
50/4"
50/3"
50/3½"
50/2"
Gray and brown mixed sand, silt, and occasionalgravel with ~½ inch sand lense (very hard,moist)
Gray fine to coarse sand with silt and gravel (verydense, wet)
Moist to wet
Gray fine to medium sand with silt (very dense,moist)
Gray silty clay mixed with fine gravel (hard,moist)
Gray-brown fine to medium sand with occasionalgravel (very dense, moist)
Light brown silt with sand and occasional gravel(hard, moist)
Gray-brown fine to medium sand (very dense,moist)
Gray fat silty clay to clayey silt (hard, moist)
Gray-brown fine to medium sand (very dense,moist)
SM/ML
SP-SM
SP-SM
CL
SP
ML
SP
CH/MH
SP
CH/MH
SA (%F = 5)
Possible shear zone/colluvium
SA (%F = 7)
Possible shear zone with shiny sufaces shearor potentially sheared during sampling
10
28
13
31
14
2610
29
Note: See Figure A-1 for explanation of symbols.Grab samples referenced as G-#.
FIELD DATA
Dep
th (
feet
)
25
30
35
40
45
50
Inte
rval
Ele
vatio
n (f
eet)
50
45
40
35
30
25
Sam
ple
Nam
eT
estin
g
Rec
over
ed (
in)
Gra
phic
Log
Co
llec
ted
Sam
ple
Blo
ws/
foot
MATERIALDESCRIPTION
Gro
upC
lass
ifica
tion
Wat
er L
evel
Log of Boring GEI-2 (continued)Ledgewood Landslide Evaluation
Island County, Washington
0422-097-00
Project:
Project Location:
Project Number:Figure A-3Sheet 2 of 5B
ellin
gham
: D
ate:
10/2
5/13
Pat
h:P
:\0\
0422
097\
00\G
INT
\042
2097
00.G
PJ
DB
Tem
plat
e/Li
bTem
plat
e:G
EO
EN
GIN
EE
RS
8.G
DT
/GE
I8_G
EO
TE
CH
_ST
AN
DA
RD
REMARKS
Moi
stur
eC
onte
nt,
%
Dry
Den
sity
,(p
cf)

22AL
23
24a
24b
25
26SA
27
28
29
30
31SA
32
33
11
8
4
8
2
4
0
4
6
2
0
50/5"
50/2"
50/2"
50/9"
50/3"
50/2"
50/4"
50/3"
50/1"
50/4"
50/5"
50/3"
Gray fat silty clay to clayey silt with faintlaminations (hard, moist)
With ½-inch sand layer
Brown fine to medium sand (very dense, moist)(pre-Vashon deposits)
Light brown silt with sand (hard, moist)Gray fine to medium sand with trace gravel (very
dense, moist)
Light brown silty fine to coarse sand withoccasional gravel (very dense, moist)
Gray-brown fine to coarse sand with gravel andsilt (very dense, moist)
Brown silty fine to coarse sand with gravel (verydense, wet)
Brown fine to coarse sand with silt and gravel(very dense, wet)
SP
ML
SP
SM
SP-SM
SM
SP-SM
SP
AL (LL = 71, PI = 38)
Shiny surfaces
SA (%F = 35)
SA (%F = 23)Almost till-like
35
29
19
12
Note: See Figure A-1 for explanation of symbols.Grab samples referenced as G-#.
FIELD DATA
Dep
th (
feet
)
55
60
65
70
75
80
Inte
rval
Ele
vatio
n (f
eet)
20
15
10
5
0
-5
Sam
ple
Nam
eT
estin
g
Rec
over
ed (
in)
Gra
phic
Log
Co
llec
ted
Sam
ple
Blo
ws/
foot
MATERIALDESCRIPTION
Gro
upC
lass
ifica
tion
Wat
er L
evel
Log of Boring GEI-2 (continued)Ledgewood Landslide Evaluation
Island County, Washington
0422-097-00
Project:
Project Location:
Project Number:Figure A-3Sheet 3 of 5B
ellin
gham
: D
ate:
10/2
5/13
Pat
h:P
:\0\
0422
097\
00\G
INT
\042
2097
00.G
PJ
DB
Tem
plat
e/Li
bTem
plat
e:G
EO
EN
GIN
EE
RS
8.G
DT
/GE
I8_G
EO
TE
CH
_ST
AN
DA
RD
REMARKS
Moi
stur
eC
onte
nt,
%
Dry
Den
sity
,(p
cf)

34SA
35
36
37
38
39
40AL
41
42
43
44
45
4
0
5
3
1
5
11
6
1
4
0
3
50/1"
50/5"
50/5"
50/1"
50/4"
50/5"
50/5"
50/4"
50/2"
50/4"
50/5"
50/3"
Gray-brown fine to coarse sand with occasionalgravel (very dense, wet)
Brown silty fine to coarse sand with gravel (verydense, wet)
Light brown silt with discontinuous sand and finegravel lenses (hard, wet)
Light brown fat clayey silt with sand andoccasional gravel (hard, wet)
Blue-gray fat clayey silt to clay with sand andgravel (hard, wet)
Light brown silty clayey sand with gravel (verydense, wet)
SM
ML
MH
MH/CL
SC/SM
SA (%F = 10)
Vibrating wire piezometer (ID 12-9813),installed in bentonite/cement grout
AL (LL = 65, PI = 26)
Sample feels soft/disturbed
15
13
28
26
Note: See Figure A-1 for explanation of symbols.Grab samples referenced as G-#.
FIELD DATA
Dep
th (
feet
)
85
90
95
100
105
110
Inte
rval
Ele
vatio
n (f
eet)
-10
-15
-20
-25
-30
-35
Sam
ple
Nam
eT
estin
g
Rec
over
ed (
in)
Gra
phic
Log
Co
llec
ted
Sam
ple
Blo
ws/
foot
MATERIALDESCRIPTION
Gro
upC
lass
ifica
tion
Wat
er L
evel
Log of Boring GEI-2 (continued)Ledgewood Landslide Evaluation
Island County, Washington
0422-097-00
Project:
Project Location:
Project Number:Figure A-3Sheet 4 of 5B
ellin
gham
: D
ate:
10/2
5/13
Pat
h:P
:\0\
0422
097\
00\G
INT
\042
2097
00.G
PJ
DB
Tem
plat
e/Li
bTem
plat
e:G
EO
EN
GIN
EE
RS
8.G
DT
/GE
I8_G
EO
TE
CH
_ST
AN
DA
RD
REMARKS
Moi
stur
eC
onte
nt,
%
Dry
Den
sity
,(p
cf)

46AL
47
48
49
50AL
51
52AL
10
10
9
18
9
8
9
50/4"
50/4"
50/3"
50/5"
50/3"
50/6"
50/3"
Gray fat silt with trace sand and gravel; massive(hard, wet)
Grades to slightly brown and increased sandcontent
Grades to gray with discontinuous sand lense
With discontinuous sand lense
With occasional gravel
Gray silt; massive (hard, wet)
With trace sand and gravel; non-plastic
MH
ML
AL (LL = 73, PI = 34)
AL (LL = 52, PI = 21)
AL (non-plastic)Vibrating wire piezometer (ID 1300879),
installed in bentonite/cement grout
32
33
36
36
31
27
16
Note: See Figure A-1 for explanation of symbols.Grab samples referenced as G-#.
FIELD DATA
Dep
th (
feet
)
115
120
125
130
Inte
rval
Ele
vatio
n (f
eet)
-40
-45
-50
Sam
ple
Nam
eT
estin
g
Rec
over
ed (
in)
Gra
phic
Log
Co
llec
ted
Sam
ple
Blo
ws/
foot
MATERIALDESCRIPTION
Gro
upC
lass
ifica
tion
Wat
er L
evel
Log of Boring GEI-2 (continued)Ledgewood Landslide Evaluation
Island County, Washington
0422-097-00
Project:
Project Location:
Project Number:Figure A-3Sheet 5 of 5B
ellin
gham
: D
ate:
10/2
5/13
Pat
h:P
:\0\
0422
097\
00\G
INT
\042
2097
00.G
PJ
DB
Tem
plat
e/Li
bTem
plat
e:G
EO
EN
GIN
EE
RS
8.G
DT
/GE
I8_G
EO
TE
CH
_ST
AN
DA
RD
REMARKS
Moi
stur
eC
onte
nt,
%
Dry
Den
sity
,(p
cf)

1
2
3SA
4
5
6a
6b
7aAL
7b
8aAL8b
8c%F
9SA
8
8
10
10
9
18
18
18
18
6
8
12
13
12
26
38
36
45
Brown silty fine sand (very loose, moist)(fill/reworked native "road fill")
Gray silty fine sand to sand with silt anddiscontinuous silt lenses (very loose to loose,moist) (recent landslide debris)
With faint laminations
No laminations/structure
Becomes wetFaint laminations (horizontal)
With silt to silty
Brown silty clay with sand (very stiff, moist)(recent intact slide debris)
With occasional dark brown organics andweathered faces
Gray silty fine sand with clay lenses (3 inchesthick) (medium dense/very stiff, moist)
Blocky, sheared clay lense
Gray clay (stiff, moist to wet)Gray silty fine sand to sandy silt; massive,
non-plastic (medium dense, moist to wet)
Gray silt with trace clay; massive, low plasticity tonon-plastic (very stiff, moist)
Gray fat silty clay; faint lamination (very stiff,
SM
SM/SP-SM
CL
SM/CL
CL
SM/ML
ML
CH
SA (%F = 18)
Blocky sheared zone with hard fragments
AL (LL = 48; PI = 22)
AL (LL = 42; PI = 19)
%F = 79
SA (%F = 99)
22
25
19
21
27
26
27
87
27
24
TotalDepth (ft)
HammerData
SystemDatum
Start EndChecked ByLogged By
SWCDrilled
Notes:
AF2/AJH
Surface Elevation (ft)Vertical Datum
Driller
GroundwaterDepth toWater (ft)Date Measured Elevation (ft)
LatitudeLongitude
48.139384-122.602534
CME Track Rig
Holocene DrillingMethod
Mud Rotary150.25
Inclinometer installed
Autohammer140 (lbs) / 30 (in) Drop
DrillingEquipment
Geographic
6/21/20136/20/2013
60NAVD88
Note: See Figure A-1 for explanation of symbols.Grab samples referenced as G-#.
FIELD DATA
Dep
th (
feet
)
0
5
10
15
20
25
Inte
rval
Ele
vatio
n (f
eet)
55
50
45
40
35
Sam
ple
Nam
eT
estin
g
Rec
over
ed (
in)
Gra
phic
Log
Co
llec
ted
Sam
ple
Blo
ws/
foot
MATERIALDESCRIPTION
Gro
upC
lass
ifica
tion
Wat
er L
evel
Log of Boring GEI-3Ledgewood Landslide Evaluation
Island County, Washington
0422-097-00
Project:
Project Location:
Project Number:Figure A-4Sheet 1 of 6B
ellin
gham
: D
ate:
10/2
5/13
Pat
h:P
:\0\
0422
097\
00\G
INT
\042
2097
00.G
PJ
DB
Tem
plat
e/Li
bTem
plat
e:G
EO
EN
GIN
EE
RS
8.G
DT
/GE
I8_G
EO
TE
CH
_ST
AN
DA
RD
REMARKS
Moi
stur
eC
onte
nt,
%
Dry
Den
sity
,(p
cf)

10
11AL
12
13
14
15
16AL
17
18a18b18c18d
19
20AL
21
18
18
18
18
18
18
18
18
12
8
18
12
48
44
77
74
49
49
32
34
98
64/6"
80
50/6"
moist)
Silt parting, possible blocky fracture (older?) withoccasional fine gravel
Sand lense
Becomes hard; massive
Fine sand lense in sampler shoes (less than¼ inch)
Faint silt partings; horizontal to sub-horizontal
Becomes stiff with horizontal laminations andpartings 0.1 to 0.3 inches
Fractures into blocky pieces
Increasing shearing; lamination beddingdestroyed small blocky pieces
With iron staining; sand pods and trace shellfragments, becomes moist to wet
Gray fine to medium sand with silt (very dense,moist to wet)
Gray silty sand with occasional gravelGray and brown silty fine sand and sandy clay
(very dense, moist)Gray silty clay to clay with thin sand lenses (hard,
moist)Dark gray, waxy, possible slickensidesGray fat silty clay; massive to faint silt partings
(hard, moist) (pre-Vashon deposits)
Distorted to inclined partings
SP-SM
SM
SM/CL
CL
CH
ML
AL (LL = 66; PI = 35)Likely shear zone
Blocky fractureTilted bedding
AL (LL = 74; PI = 44)Sheared zone
Vibrating wire piezometer (ID 1300325),installed in bentonite/cement grout
AL (LL = 63; PI = 35)Very hard, no indiciation of failure in sample
26
33
28
32
36
36
36
41
24181824
27
30
33
Note: See Figure A-1 for explanation of symbols.Grab samples referenced as G-#.
FIELD DATA
Dep
th (
feet
)
25
30
35
40
45
50
Inte
rval
Ele
vatio
n (f
eet)
30
25
20
15
10
Sam
ple
Nam
eT
estin
g
Rec
over
ed (
in)
Gra
phic
Log
Co
llec
ted
Sam
ple
Blo
ws/
foot
MATERIALDESCRIPTION
Gro
upC
lass
ifica
tion
Wat
er L
evel
Log of Boring GEI-3 (continued)Ledgewood Landslide Evaluation
Island County, Washington
0422-097-00
Project:
Project Location:
Project Number:Figure A-4Sheet 2 of 6B
ellin
gham
: D
ate:
10/2
5/13
Pat
h:P
:\0\
0422
097\
00\G
INT
\042
2097
00.G
PJ
DB
Tem
plat
e/Li
bTem
plat
e:G
EO
EN
GIN
EE
RS
8.G
DT
/GE
I8_G
EO
TE
CH
_ST
AN
DA
RD
REMARKS
Moi
stur
eC
onte
nt,
%
Dry
Den
sity
,(p
cf)

22AL
23
24
25AL
26
27SA
28
29
30
31
32
33
11
15
9
9
8
11
12
11
12
12
15
11
50/5"
50/3"
50/3"
50/3"
50/2"
50/5"
50/6"
50/5"
50/6"
50/6"
50/3"
50/5"
Gray clayey silt with mixed layer of light grayclayey silt (ashy?) with inclined bedding (hard,wet)
Gray silty clay; massive to faint silt partings(hard, wet)
Gray clay with silt, sand, and occasional gravel(hard, wet)
Becomes till-like
Gray clayey sand to silty sand with clay andgravel; diamicton (very dense, wet)
Clean sand lense approximately 1 inch thick, wet
Gray silty clay with trace gravel; massive (hard,wet)
Dark gray, possible sheared zone with blockytexture
No gravel observed
Light gray, inclined laminations
Gray clayey silt; massive (hard, wet)
ML
CL
SC/SM
CL
ML
AL (LL = 41; PI = 15)
AL (LL = 44; PI = 21)
SA (%F = 21)
32
29
17
18
24
15
32
33
31
Note: See Figure A-1 for explanation of symbols.Grab samples referenced as G-#.
FIELD DATA
Dep
th (
feet
)
55
60
65
70
75
80
Inte
rval
Ele
vatio
n (f
eet)
5
0
-5
-10
-15
-20
Sam
ple
Nam
eT
estin
g
Rec
over
ed (
in)
Gra
phic
Log
Co
llec
ted
Sam
ple
Blo
ws/
foot
MATERIALDESCRIPTION
Gro
upC
lass
ifica
tion
Wat
er L
evel
Log of Boring GEI-3 (continued)Ledgewood Landslide Evaluation
Island County, Washington
0422-097-00
Project:
Project Location:
Project Number:Figure A-4Sheet 3 of 6B
ellin
gham
: D
ate:
10/2
5/13
Pat
h:P
:\0\
0422
097\
00\G
INT
\042
2097
00.G
PJ
DB
Tem
plat
e/Li
bTem
plat
e:G
EO
EN
GIN
EE
RS
8.G
DT
/GE
I8_G
EO
TE
CH
_ST
AN
DA
RD
REMARKS
Moi
stur
eC
onte
nt,
%
Dry
Den
sity
,(p
cf)
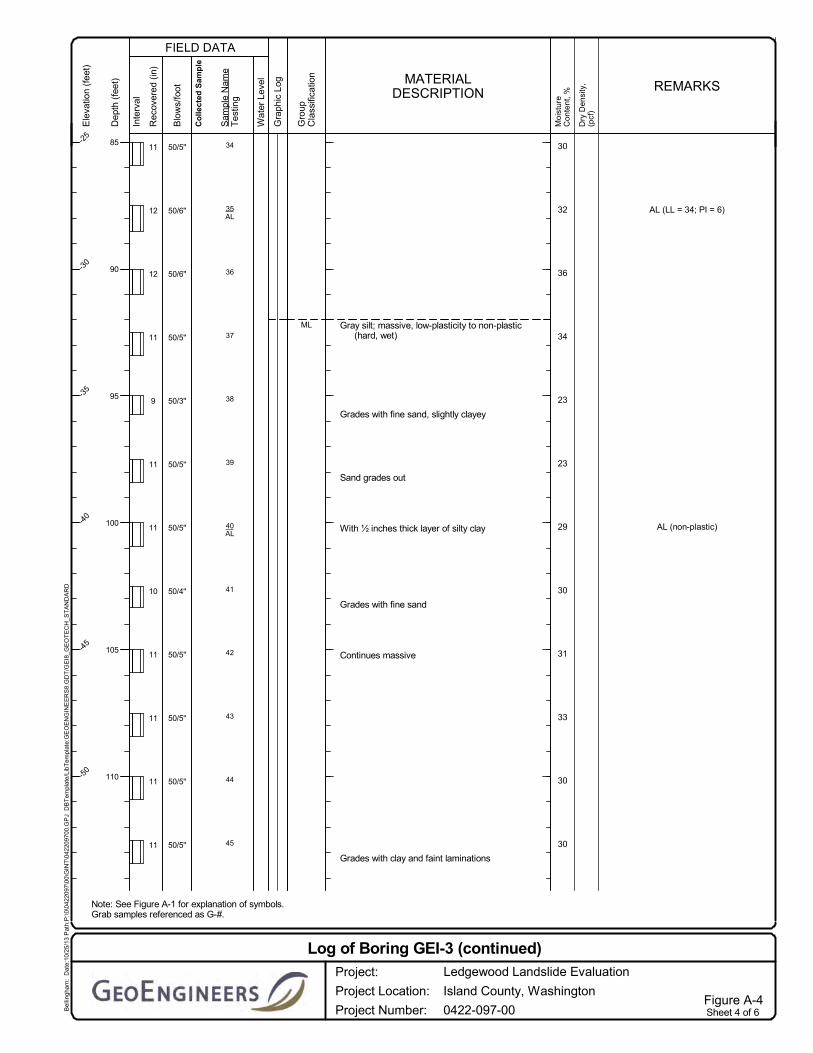
34
35AL
36
37
38
39
40AL
41
42
43
44
45
11
12
12
11
9
11
11
10
11
11
11
11
50/5"
50/6"
50/6"
50/5"
50/3"
50/5"
50/5"
50/4"
50/5"
50/5"
50/5"
50/5"
Gray silt; massive, low-plasticity to non-plastic(hard, wet)
Grades with fine sand, slightly clayey
Sand grades out
With ½ inches thick layer of silty clay
Grades with fine sand
Continues massive
Grades with clay and faint laminations
ML
AL (LL = 34; PI = 6)
AL (non-plastic)
30
32
36
34
23
23
29
30
31
33
30
30
Note: See Figure A-1 for explanation of symbols.Grab samples referenced as G-#.
FIELD DATA
Dep
th (
feet
)
85
90
95
100
105
110
Inte
rval
Ele
vatio
n (f
eet)
-25
-30
-35
-40
-45
-50
Sam
ple
Nam
eT
estin
g
Rec
over
ed (
in)
Gra
phic
Log
Co
llec
ted
Sam
ple
Blo
ws/
foot
MATERIALDESCRIPTION
Gro
upC
lass
ifica
tion
Wat
er L
evel
Log of Boring GEI-3 (continued)Ledgewood Landslide Evaluation
Island County, Washington
0422-097-00
Project:
Project Location:
Project Number:Figure A-4Sheet 4 of 6B
ellin
gham
: D
ate:
10/2
5/13
Pat
h:P
:\0\
0422
097\
00\G
INT
\042
2097
00.G
PJ
DB
Tem
plat
e/Li
bTem
plat
e:G
EO
EN
GIN
EE
RS
8.G
DT
/GE
I8_G
EO
TE
CH
_ST
AN
DA
RD
REMARKS
Moi
stur
eC
onte
nt,
%
Dry
Den
sity
,(p
cf)

46a46b
47a47b
48%F
49
50
51
52AL
53
54
55
56
57SA
3
4
6
11
9
11
11
16
3
4
3
3
50/3"
50/5"
50/6"
50/5"
50/3"
50/6"
50/5"
50/2"
50/3"
50/4"
100/5"
100/3"
Grades with gravelGray fine to medium sandy silt with gravel (hard,
wet)
Gray silty fine sand (dense, wet)
Gray fine sandy silt (hard, wet)
Gray silty fine sand to sandy silt with faintlaminations and trace iron staining in samplershoe (dense to very dense, wet)
Gray-brown silty fine sand to fine sandy silt (verydense/hard, wet)
Faint laminations (horizontal)Increased sand contentThin medium sand layer (less than ¼ inch thick)Gray silt with fine sand; massive (hard, wet)
Faint lamination
Laminated to massiveGray medium to coarse sand with gravel (very
dense, wet)
Brown fine to coarse sand with silt (very dense,wet)
Brown fine to coarse sand with silt to trace siltand occasional gravel (very dense, wet)
ML
SM
ML
SM/ML
SM/ML
ML
SP
SP-SM
SP-SM
SM
Vibrating wire piezometer (ID1300916),<<CR>installed in bentonite/cement
grout
%F = 63
AL (LL = 45; PI = 13)
SA (%F =9)
26
27
24
29
33
38
15
Note: See Figure A-1 for explanation of symbols.Grab samples referenced as G-#.
FIELD DATA
Dep
th (
feet
)
115
120
125
130
135
140
Inte
rval
Ele
vatio
n (f
eet)
-55
-60
-65
-70
-75
-80
Sam
ple
Nam
eT
estin
g
Rec
over
ed (
in)
Gra
phic
Log
Co
llec
ted
Sam
ple
Blo
ws/
foot
MATERIALDESCRIPTION
Gro
upC
lass
ifica
tion
Wat
er L
evel
Log of Boring GEI-3 (continued)Ledgewood Landslide Evaluation
Island County, Washington
0422-097-00
Project:
Project Location:
Project Number:Figure A-4Sheet 5 of 6B
ellin
gham
: D
ate:
10/2
5/13
Pat
h:P
:\0\
0422
097\
00\G
INT
\042
2097
00.G
PJ
DB
Tem
plat
e/Li
bTem
plat
e:G
EO
EN
GIN
EE
RS
8.G
DT
/GE
I8_G
EO
TE
CH
_ST
AN
DA
RD
REMARKS
Moi
stur
eC
onte
nt,
%
Dry
Den
sity
,(p
cf)

58
59
60
3
3
1
100/3"
100/3"
100/2"
Brown silty fine to coarse sand with occasionalgravel (very dense, wet)
Note: See Figure A-1 for explanation of symbols.Grab samples referenced as G-#.
FIELD DATA
Dep
th (
feet
)
145
150
Inte
rval
Ele
vatio
n (f
eet)
-85
-90
Sam
ple
Nam
eT
estin
g
Rec
over
ed (
in)
Gra
phic
Log
Co
llec
ted
Sam
ple
Blo
ws/
foot
MATERIALDESCRIPTION
Gro
upC
lass
ifica
tion
Wat
er L
evel
Log of Boring GEI-3 (continued)Ledgewood Landslide Evaluation
Island County, Washington
0422-097-00
Project:
Project Location:
Project Number:Figure A-4Sheet 6 of 6B
ellin
gham
: D
ate:
10/2
5/13
Pat
h:P
:\0\
0422
097\
00\G
INT
\042
2097
00.G
PJ
DB
Tem
plat
e/Li
bTem
plat
e:G
EO
EN
GIN
EE
RS
8.G
DT
/GE
I8_G
EO
TE
CH
_ST
AN
DA
RD
REMARKS
Moi
stur
eC
onte
nt,
%
Dry
Den
sity
,(p
cf)

1
2
3
4
5
6
7
8SA
9
6
3
6
8
3
0
0
6
6
12
5
5
18
6
3
2
10
15
Asphalt concreteGray sand with gravel (medium dense, damp)
(fill)
Gray and brown mixed silty fine to coarse sandwith trace gravel and organics (mediumdense, moist) (old landslide debris)
Grades to loose
Gray fine to medium sand with silt (loose, wet)
Gray silty fine to coarse sand with gravel;diamicton (medium dense, moist)
Becomes loose, wet
Becomes very loose
Becomes silty fine to medium sand with gravel;medium dense, moist
Decreasing silt content, becomes medium dense
Gray gravelly fine to medium sand with silt(medium dense, moist to wet)
AC
SP
SM
SP-SM
SM
SP-SM
No recovery
No recovery
SA (%F = 35)
12
9
11
14
TotalDepth (ft)
HammerData
SystemDatum
Start EndChecked ByLogged By
SWCDrilled
Notes:
SLG
Surface Elevation (ft)Vertical Datum
Driller
GroundwaterDepth toWater (ft)Date Measured Elevation (ft)
LatitudeLongitude
48.138141-122.601646
CME 850X
Boart Longyear DrillingMethod
Mud Rotary130.5
Inclinometer installed
Autohammer300 (lbs) / 30 (in) Drop
DrillingEquipment
Geographic
6/23/20136/21/2013
80NAVD88
Note: See Figure A-1 for explanation of symbols.Grab samples referenced as G-#.
FIELD DATA
Dep
th (
feet
)
0
5
10
15
20
25
Inte
rval
Ele
vatio
n (f
eet)
75
70
65
60
55
Sam
ple
Nam
eT
estin
g
Rec
over
ed (
in)
Gra
phic
Log
Co
llec
ted
Sam
ple
Blo
ws/
foot
MATERIALDESCRIPTION
Gro
upC
lass
ifica
tion
Wat
er L
evel
Log of Boring GEI-4Ledgewood Landslide Evaluation
Island County, Washington
0422-097-00
Project:
Project Location:
Project Number:Figure A-5Sheet 1 of 5B
ellin
gham
: D
ate:
10/2
5/13
Pat
h:P
:\0\
0422
097\
00\G
INT
\042
2097
00.G
PJ
DB
Tem
plat
e/Li
bTem
plat
e:G
EO
EN
GIN
EE
RS
8.G
DT
/GE
I8_G
EO
TE
CH
_ST
AN
DA
RD
REMARKS
Moi
stur
eC
onte
nt,
%
Dry
Den
sity
,(p
cf)

10
11
12
13SA
14
15
16
17
18
19
20SA
21
8
8
12
12
8
4
8
8
8
8
8
10
24
17
9
23
16
12
23
30
49
64
60
31
With silt to silty
Gray silty fine to coarse sand with gravel;diamicton (medium dense, moist)
Decreased silt content
With occasional layers of fine sand
Grades to dense
Grades to very denseGray silty fine sand (very dense, moist to wet)
With gravel interbeds; layered diamicton
SM
SM
MH
SA (%F = 37)
SA (%F = 38)
Vibrating wire piezometer (ID 1300324),installed in bentonite/cement grout
13
18
11
10
16
10
8
10
11
21
21
Note: See Figure A-1 for explanation of symbols.Grab samples referenced as G-#.
FIELD DATA
Dep
th (
feet
)
25
30
35
40
45
50
Inte
rval
Ele
vatio
n (f
eet)
50
45
40
35
30
Sam
ple
Nam
eT
estin
g
Rec
over
ed (
in)
Gra
phic
Log
Co
llec
ted
Sam
ple
Blo
ws/
foot
MATERIALDESCRIPTION
Gro
upC
lass
ifica
tion
Wat
er L
evel
Log of Boring GEI-4 (continued)Ledgewood Landslide Evaluation
Island County, Washington
0422-097-00
Project:
Project Location:
Project Number:Figure A-5Sheet 2 of 5B
ellin
gham
: D
ate:
10/2
5/13
Pat
h:P
:\0\
0422
097\
00\G
INT
\042
2097
00.G
PJ
DB
Tem
plat
e/Li
bTem
plat
e:G
EO
EN
GIN
EE
RS
8.G
DT
/GE
I8_G
EO
TE
CH
_ST
AN
DA
RD
REMARKS
Moi
stur
eC
onte
nt,
%
Dry
Den
sity
,(p
cf)

22AL
23AL
24
25
26
27
28
29
30AL
31
32
33
12
12
12
4
0
0
3
9
8
11
?
3
8
17
14
50/2"
50/4"
50/3"
50/6"
50/3"
50/2"
50/5"
50/2"
50/3"
Gray fat clayey silt with blocky sheared zonesand polished surfaces (medium stiff to stiff,moist)
Gay silt with fine sand and trace clay; massive(stiff, moist)
Gray clay with trace sand and shell fragments(stiff, moist)
Fine blocky texture, possibly disturbedGray fine to medium sand with silt, gravel, shell
fragments, and occasional cobbles (verydense, moist to wet) (pre-Vashon deposits)
Increased sand content; becomes wet
Gray fine to medium sand with trace silt and shellfragments (very dense, wet)
Irregular clay layers (½ inch thick)Gray fat clayey silt with silt partings (horizontal)
(hard, wet)
With light gray ashy inclusion (steeply inclined)Gray mixed silty clay with sand and silty sand
with gravel; diamicton (hard/very dense, wet)
Undisturbed diamicton
ML
CL
SP-SM
SP
MH
CL/SM
CL/ML
AL (LL = 55; PI = 24)
AL (LL = 34; PI = 10)
No recoveryDifficult drilling
No recoveryDifficult drilling
Vibrating wire piezometer (ID 1300918),installed in bentonite/cement grout
AL (LL = 54; PI = 24)
22
23
28
14
21
30
13
Note: See Figure A-1 for explanation of symbols.Grab samples referenced as G-#.
FIELD DATA
Dep
th (
feet
)
55
60
65
70
75
80
Inte
rval
Ele
vatio
n (f
eet)
25
20
15
10
5
0
Sam
ple
Nam
eT
estin
g
Rec
over
ed (
in)
Gra
phic
Log
Co
llec
ted
Sam
ple
Blo
ws/
foot
MATERIALDESCRIPTION
Gro
upC
lass
ifica
tion
Wat
er L
evel
Log of Boring GEI-4 (continued)Ledgewood Landslide Evaluation
Island County, Washington
0422-097-00
Project:
Project Location:
Project Number:Figure A-5Sheet 3 of 5B
ellin
gham
: D
ate:
10/2
5/13
Pat
h:P
:\0\
0422
097\
00\G
INT
\042
2097
00.G
PJ
DB
Tem
plat
e/Li
bTem
plat
e:G
EO
EN
GIN
EE
RS
8.G
DT
/GE
I8_G
EO
TE
CH
_ST
AN
DA
RD
REMARKS
Moi
stur
eC
onte
nt,
%
Dry
Den
sity
,(p
cf)

34
35
36
37
38
39
40
41
42
43
44
45
18
18
12
18
18
12
14
15
13
?
5
0
41
40
50/2"
50
50
50/3"
50/5"
50/3"
50/1"
50/3"
50/5"
50/3"
Gray silty clay to clayey silt with sand interbedsand partings; horizontal (less than ½ inchthick) (hard, wet)
With faint silt partings and laminations
Gray silt with trace fine sand and clay; massive tofaintly laminated; horizontal dilatent (hard,wet)
With gravel interbeds (3 to 4 inches thick);
Laminated (1/8 to 1/2 inch thick) with light grayashy layers inclined at approximately 30°; noshearing observed
With occasional gravel (possible dropstones)
With trace gravel and sand; weakly laminatedGray silty gravelly sand to sandy gravel with clay;
diamicton (very dense, wet)
With increased silt/clay content
ML
SM/GM
No recovery
28
33
31
33
32
29
30
30
28
17
Note: See Figure A-1 for explanation of symbols.Grab samples referenced as G-#.
FIELD DATA
Dep
th (
feet
)
85
90
95
100
105
110
Inte
rval
Ele
vatio
n (f
eet)
-5
-10
-15
-20
-25
-30
Sam
ple
Nam
eT
estin
g
Rec
over
ed (
in)
Gra
phic
Log
Co
llec
ted
Sam
ple
Blo
ws/
foot
MATERIALDESCRIPTION
Gro
upC
lass
ifica
tion
Wat
er L
evel
Log of Boring GEI-4 (continued)Ledgewood Landslide Evaluation
Island County, Washington
0422-097-00
Project:
Project Location:
Project Number:Figure A-5Sheet 4 of 5B
ellin
gham
: D
ate:
10/2
5/13
Pat
h:P
:\0\
0422
097\
00\G
INT
\042
2097
00.G
PJ
DB
Tem
plat
e/Li
bTem
plat
e:G
EO
EN
GIN
EE
RS
8.G
DT
/GE
I8_G
EO
TE
CH
_ST
AN
DA
RD
REMARKS
Moi
stur
eC
onte
nt,
%
Dry
Den
sity
,(p
cf)

46
47
48
49
50
51
52
3
5
6
4
6
6
50/3"
50/3"
50/5"
50/6"
50/5"
50/2"
50/6"
Gray gravelly fine to coarse sand with silt (verydense, wet)
Gray fine to medium sand (very dense, wet)
With occasional thin silt layers up to 1/8 inchthick
With occasional gravel
SP-SM
SP
19
19
Note: See Figure A-1 for explanation of symbols.Grab samples referenced as G-#.
FIELD DATA
Dep
th (
feet
)
115
120
125
130
Inte
rval
Ele
vatio
n (f
eet)
-35
-40
-45
-50
Sam
ple
Nam
eT
estin
g
Rec
over
ed (
in)
Gra
phic
Log
Co
llec
ted
Sam
ple
Blo
ws/
foot
MATERIALDESCRIPTION
Gro
upC
lass
ifica
tion
Wat
er L
evel
Log of Boring GEI-4 (continued)Ledgewood Landslide Evaluation
Island County, Washington
0422-097-00
Project:
Project Location:
Project Number:Figure A-5Sheet 5 of 5B
ellin
gham
: D
ate:
10/2
5/13
Pat
h:P
:\0\
0422
097\
00\G
INT
\042
2097
00.G
PJ
DB
Tem
plat
e/Li
bTem
plat
e:G
EO
EN
GIN
EE
RS
8.G
DT
/GE
I8_G
EO
TE
CH
_ST
AN
DA
RD
REMARKS
Moi
stur
eC
onte
nt,
%
Dry
Den
sity
,(p
cf)

1a
1b
2
3
4
5
6a
6b
7
8
9SA
9
6
6
18
18
18
9
11
10.5
2
3
5
39
45
50
50/3"
50/5"
50/4.5"
1½-inch minus crushed rock surfacing
Gray-brown fine to coarse gravel with sand (veryloose, wet) (fill)
Brown fine to coarse sand with silt and fine tocoarse gravel (very loose, moist) (fill)
Dark gray fine to coarse gravel with fine tocoarse sand (very loose, wet) (fill)
Gray fine to medium sand with silt and silt clasts(dense, moist) (recent landslide debris)
With occasional fine to coarse gravel; slightoxidation
Gray silt with occasional fine to coarse gravel andsilty fine to coarse sand with fine to coarsegravel; slightly contorted bedding (dense,moist)
Silty fine sand with laminated gray silt; oxidationzones (dense, moist)
Gray silty fine to coarse sand with gravel to graysilty fine to coarse gravel with sand; slightoxidation (very dense, wet) (pre-Vashondeposits)
Gray-brown fine to coarse sand with silt andoccasional gravel (very dense, moist to wet)
GP
GW
SP-SM
GW
SP-SM
ML/SM
SM/ML
SM/GM
SP-SM
19
9
13
9
11
16
12
12
13
TotalDepth (ft)
HammerData
SystemDatum
Start EndChecked ByLogged By
SWCDrilled
Notes:
CRW
Surface Elevation (ft)Vertical Datum
Driller
GroundwaterDepth toWater (ft)Date Measured Elevation (ft)
LatitudeLongitude
48.143702-122.60417
CME 50X
Boart Longyear DrillingMethod
Mud Rotary111.25
Autohammer300 (lbs) / 30 (in) Drop
DrillingEquipment
Geographic
6/27/20136/25/2013
60NAVD88
Note: See Figure A-1 for explanation of symbols.Grab samples referenced as G-#.
FIELD DATA
Dep
th (
feet
)
0
5
10
15
20
25
Inte
rval
Ele
vatio
n (f
eet)
55
50
45
40
35
Sam
ple
Nam
eT
estin
g
Rec
over
ed (
in)
Gra
phic
Log
Co
llec
ted
Sam
ple
Blo
ws/
foot
MATERIALDESCRIPTION
Gro
upC
lass
ifica
tion
Wat
er L
evel
Log of Boring GEI-5Ledgewood Landslide Evaluation
Island County, Washington
0422-097-00
Project:
Project Location:
Project Number:Figure A-6Sheet 1 of 4B
ellin
gham
: D
ate:
10/2
5/13
Pat
h:P
:\0\
0422
097\
00\G
INT
\042
2097
00.G
PJ
DB
Tem
plat
e/Li
bTem
plat
e:G
EO
EN
GIN
EE
RS
8.G
DT
/GE
I8_G
EO
TE
CH
_ST
AN
DA
RD
REMARKS
Moi
stur
eC
onte
nt,
%
Dry
Den
sity
,(p
cf)

10
11
12
13
14a
14b
14c
15SA
16
17
18
19
20a20b
21
6
6
4
3
11
5
1
2
0
4
18
50/6"
50/6"
50/4"
50/3"
50/5"
50/5"
50/3"
50/3"
50/1"
50/5"
50/4"
68
Increased gravel content, becomes wet
With silt clasts
Grades to with fine to coarse gravel
Increasing silt content
2-inch layer of sandy silt, trace silty sand withoxidation
Continuous fine to coarse sand with silt andgravel, becomes moist to wet
Silty fine to coarse sand and fine to coarse gravel(very dense, moist)
Likely silt lenses
Becomes dark brown
Gray and brown clayey silt to silty clay with fine tocoarse gravel and sand (hard, moist)
With silt and sand lenseGray silt (hard, wet)
SM/GM
ML/CL
CL/SM
Poor recovery; little sample to review
Drilling soft at 52 feet
Intact sample
11
15
12
11
18
1314
32
Note: See Figure A-1 for explanation of symbols.Grab samples referenced as G-#.
FIELD DATA
Dep
th (
feet
)
25
30
35
40
45
50
Inte
rval
Ele
vatio
n (f
eet)
30
25
20
15
10
Sam
ple
Nam
eT
estin
g
Rec
over
ed (
in)
Gra
phic
Log
Co
llec
ted
Sam
ple
Blo
ws/
foot
MATERIALDESCRIPTION
Gro
upC
lass
ifica
tion
Wat
er L
evel
Log of Boring GEI-5 (continued)Ledgewood Landslide Evaluation
Island County, Washington
0422-097-00
Project:
Project Location:
Project Number:Figure A-6Sheet 2 of 4B
ellin
gham
: D
ate:
10/2
5/13
Pat
h:P
:\0\
0422
097\
00\G
INT
\042
2097
00.G
PJ
DB
Tem
plat
e/Li
bTem
plat
e:G
EO
EN
GIN
EE
RS
8.G
DT
/GE
I8_G
EO
TE
CH
_ST
AN
DA
RD
REMARKS
Moi
stur
eC
onte
nt,
%
Dry
Den
sity
,(p
cf)

22
23
24
25
26a
26b
27
28
29
30a
30b
31
32
33
6
2
5
15
18
17
11
18
18
16
16
50/6"
50/4"
50/5"
50/2"
50/3"
55
50/5"
50/5"
56
38
50/4"
47
Silty fine to coarse sand with fine to coarsegravel (very dense, wet)
Gray silty fine to coarse gravel with fine to coarsesand with silt layers (very dense, wet)
Gray fine sand with silt and trace gravel (verydense, wet)
1-inch thick layer of silt
Gray laminated clayey silt with thin lenses of finesand; sub-horizontal bedding (hard, wet)
Interbedded light gray-tan laminated silty claywith lenses of fine sand with silt and traceblack organics; oxidized (hard, wet)
Interbedded gray fine to medium sand with silt,sand, clayey silt, and trace organics; slightoxidation at sand contacts (very dense/hard,wet)
Gray silty fine to medium sand to sand with silt;with 2-inch layer of light gray silt (very dense,wet)
Gray silty clay with occasional fine sand and thinfine sand lenses with faint laminations (hard,wet)
With occasional fine sand interbeds and gravel
Silty fine sand layer approximately 3 inches thick
With siltier zones and occasional thin lenses ofsand
Slightly distorted bedding
Gray silt with clay and fine sand; massive (hard,wet)
SM
GM
SP-SM
ML
CL
SM/ML
SM/SP-SM
CL
ML
Turbidite sandy structure?
15
13
18
25
21
23
30
30
30
22
31
30
32
Note: See Figure A-1 for explanation of symbols.Grab samples referenced as G-#.
FIELD DATA
Dep
th (
feet
)
55
60
65
70
75
80
Inte
rval
Ele
vatio
n (f
eet)
5
0
-5
-10
-15
-20
Sam
ple
Nam
eT
estin
g
Rec
over
ed (
in)
Gra
phic
Log
Co
llec
ted
Sam
ple
Blo
ws/
foot
MATERIALDESCRIPTION
Gro
upC
lass
ifica
tion
Wat
er L
evel
Log of Boring GEI-5 (continued)Ledgewood Landslide Evaluation
Island County, Washington
0422-097-00
Project:
Project Location:
Project Number:Figure A-6Sheet 3 of 4B
ellin
gham
: D
ate:
10/2
5/13
Pat
h:P
:\0\
0422
097\
00\G
INT
\042
2097
00.G
PJ
DB
Tem
plat
e/Li
bTem
plat
e:G
EO
EN
GIN
EE
RS
8.G
DT
/GE
I8_G
EO
TE
CH
_ST
AN
DA
RD
REMARKS
Moi
stur
eC
onte
nt,
%
Dry
Den
sity
,(p
cf)

34
35
36
37
38
39a
39b
39c
40
41a
41b
42
43
44
16
18
18
18
18
16
15
9
0
11
50/6"
51
72
65
46
50/4"
50/3"
50/3"
50/4"
50/5.5"
50/3"
Low plasticity
Low plasticity to non-platsic, dilatent
Trace fine sand
Non-plastic
With clay; low plasticity
Brown silt with fine sand grading to gray silty finesand with 1-inch thick sand lense (verydense/hard, wet)
Laminated with sub-horizontal beddingBecomes tan with increased silt content
Gray silty fine to coarse sand with occasionalgravel; oxidation staining (very dense, wet)
Gray-tan silty fine to coarse sand with gravel(very dense, wet)
Increased gravel content
Tan-gray silty fine sand with trace fine gravel(very dense, wet)
ML/SM
SM
SM
SM
34
31
32
30
29
24
22
18
13
10
20
Note: See Figure A-1 for explanation of symbols.Grab samples referenced as G-#.
FIELD DATA
Dep
th (
feet
)
85
90
95
100
105
110
Inte
rval
Ele
vatio
n (f
eet)
-25
-30
-35
-40
-45
-50
Sam
ple
Nam
eT
estin
g
Rec
over
ed (
in)
Gra
phic
Log
Co
llec
ted
Sam
ple
Blo
ws/
foot
MATERIALDESCRIPTION
Gro
upC
lass
ifica
tion
Wat
er L
evel
Log of Boring GEI-5 (continued)Ledgewood Landslide Evaluation
Island County, Washington
0422-097-00
Project:
Project Location:
Project Number:Figure A-6Sheet 4 of 4B
ellin
gham
: D
ate:
10/2
5/13
Pat
h:P
:\0\
0422
097\
00\G
INT
\042
2097
00.G
PJ
DB
Tem
plat
e/Li
bTem
plat
e:G
EO
EN
GIN
EE
RS
8.G
DT
/GE
I8_G
EO
TE
CH
_ST
AN
DA
RD
REMARKS
Moi
stur
eC
onte
nt,
%
Dry
Den
sity
,(p
cf)

1
2
3
4
17
9
5
5
50/5"
50/3"
50/5"
50/5"
Asphalt concreteGray-brown silty fine to medium sand with
occasional fine to coarse gravel; diamicton(very dense, moist)
Decreased silt content with silt to silty
Silty, moist to wet
AC
SM
10
11
11
9
TotalDepth (ft)
HammerData
SystemDatum
Start EndChecked ByLogged By
SWCDrilled
Notes:
RMB
Surface Elevation (ft)Vertical Datum
Driller
GroundwaterDepth toWater (ft)Date Measured Elevation (ft)
LatitudeLongitude
48.137672-122.599696
Mobile B-61
Holocene DrillingMethod
Hollow-Stem Auger225.75
Inclinometer installed
Autohammer300 (lbs) / 30 (in) Drop
DrillingEquipment
Geographic
6/27/20136/24/2013
225NAVD88
Note: See Figure A-1 for explanation of symbols.Grab samples referenced as G-#.
FIELD DATA
Dep
th (
feet
)
0
5
10
15
20
25
Inte
rval
Ele
vatio
n (f
eet)
220
215
210
205
200
Sam
ple
Nam
eT
estin
g
Rec
over
ed (
in)
Gra
phic
Log
Co
llec
ted
Sam
ple
Blo
ws/
foot
MATERIALDESCRIPTION
Gro
upC
lass
ifica
tion
Wat
er L
evel
Log of Boring GEI-6Ledgewood Landslide Evaluation
Island County, Washington
0422-097-00
Project:
Project Location:
Project Number:Figure A-7Sheet 1 of 8B
ellin
gham
: D
ate:
10/2
5/13
Pat
h:P
:\0\
0422
097\
00\G
INT
\042
2097
00.G
PJ
DB
Tem
plat
e/Li
bTem
plat
e:G
EO
EN
GIN
EE
RS
8.G
DT
/GE
I8_G
EO
TE
CH
_ST
AN
DA
RD
REMARKS
Moi
stur
eC
onte
nt,
%
Dry
Den
sity
,(p
cf)

5
6a
6b
7
8
9
10
6
17
12
18
18
12
50/6"
50/5"
50/6"
68
81
50/6"
Gray-brown silty fine sand with laminations 1/4 to1/2 inch thick (very dense, moist to wet)
Gray-brown medium to coarse sand with fine tocoarse gravel (very dense, moist)
Becomes moist to wet
Layered finer and coarser
Gray-brown fine to medium sand with silt andlayers of laminated silt; non-plastic (verydense, moist to wet)
Laminated silt lense
Gray-brown laminated to massive silt withoccasional fine gravel (hard, moist)
Gray silty fine sand to fine sandy silt; laminated,non-plastic (very dense/hard, moist)
SM
SP
SP/SM
ML
SM/ML
Subrounded gravel
Vibrating wire piezometer (ID 1300920),50 psi installed in bentonite/cement grout
Diamicton (massive)
11
18
3
19
19
10
17
Note: See Figure A-1 for explanation of symbols.Grab samples referenced as G-#.
FIELD DATA
Dep
th (
feet
)
25
30
35
40
45
50
Inte
rval
Ele
vatio
n (f
eet)
195
190
185
180
175
Sam
ple
Nam
eT
estin
g
Rec
over
ed (
in)
Gra
phic
Log
Co
llec
ted
Sam
ple
Blo
ws/
foot
MATERIALDESCRIPTION
Gro
upC
lass
ifica
tion
Wat
er L
evel
Log of Boring GEI-6 (continued)Ledgewood Landslide Evaluation
Island County, Washington
0422-097-00
Project:
Project Location:
Project Number:Figure A-7Sheet 2 of 8B
ellin
gham
: D
ate:
10/2
5/13
Pat
h:P
:\0\
0422
097\
00\G
INT
\042
2097
00.G
PJ
DB
Tem
plat
e/Li
bTem
plat
e:G
EO
EN
GIN
EE
RS
8.G
DT
/GE
I8_G
EO
TE
CH
_ST
AN
DA
RD
REMARKS
Moi
stur
eC
onte
nt,
%
Dry
Den
sity
,(p
cf)

11
12
13
14
15
16
6
12
12
6
15
18
50/6"
50/6"
50/6"
50/6"
75
50/6"
Laminated
Decreasing silt content; massive
Grades between sand and silt
Gray silty fine sand to silt with occasional finegravel; diamicton (very dense/hard, moist)
Decreased gravel content
SM/ML
18
21
10
13
Note: See Figure A-1 for explanation of symbols.Grab samples referenced as G-#.
FIELD DATA
Dep
th (
feet
)
55
60
65
70
75
80
Inte
rval
Ele
vatio
n (f
eet)
170
165
160
155
150
145
Sam
ple
Nam
eT
estin
g
Rec
over
ed (
in)
Gra
phic
Log
Co
llec
ted
Sam
ple
Blo
ws/
foot
MATERIALDESCRIPTION
Gro
upC
lass
ifica
tion
Wat
er L
evel
Log of Boring GEI-6 (continued)Ledgewood Landslide Evaluation
Island County, Washington
0422-097-00
Project:
Project Location:
Project Number:Figure A-7Sheet 3 of 8B
ellin
gham
: D
ate:
10/2
5/13
Pat
h:P
:\0\
0422
097\
00\G
INT
\042
2097
00.G
PJ
DB
Tem
plat
e/Li
bTem
plat
e:G
EO
EN
GIN
EE
RS
8.G
DT
/GE
I8_G
EO
TE
CH
_ST
AN
DA
RD
REMARKS
Moi
stur
eC
onte
nt,
%
Dry
Den
sity
,(p
cf)

17
18
19AL
20a
20b
21
22
10
18
18
13
9
8
50/5"
44
33
50/1"
50/5"
50/2"
Medium grained sand lense
Gray silty clay with occasional black organicfragments, massive, low plasticity (hard,moist)
With a layer of brown organic silty clay with whiteblebs, weakly laminated
Gray sandy clay with occasional fine to coarsegravel (hard, moist)
Brown medium to coarse silty sand withoccasional fine gravel (very dense, moist)
Gray fine to medium sand with trace fine gravel(very dense, wet)
Brown fine to medium sand with iron-stainedzones and tan silt lenses (2-inches thick)(very dense, wet)
Gray fine to medium sand (very dense, wet)
CL
CL
SM
SP
SP
SP
AL (LL = 35; PI = 13)Fine grained shell fragments in upper 6 inches
of sample
Vibrating wire piezometer (ID 1300935),50 psi installed in bentonite/cement grout
27
25
17
17
20
16
Note: See Figure A-1 for explanation of symbols.Grab samples referenced as G-#.
FIELD DATA
Dep
th (
feet
)
85
90
95
100
105
110
Inte
rval
Ele
vatio
n (f
eet)
140
135
130
125
120
115
Sam
ple
Nam
eT
estin
g
Rec
over
ed (
in)
Gra
phic
Log
Co
llec
ted
Sam
ple
Blo
ws/
foot
MATERIALDESCRIPTION
Gro
upC
lass
ifica
tion
Wat
er L
evel
Log of Boring GEI-6 (continued)Ledgewood Landslide Evaluation
Island County, Washington
0422-097-00
Project:
Project Location:
Project Number:Figure A-7Sheet 4 of 8B
ellin
gham
: D
ate:
10/2
5/13
Pat
h:P
:\0\
0422
097\
00\G
INT
\042
2097
00.G
PJ
DB
Tem
plat
e/Li
bTem
plat
e:G
EO
EN
GIN
EE
RS
8.G
DT
/GE
I8_G
EO
TE
CH
_ST
AN
DA
RD
REMARKS
Moi
stur
eC
onte
nt,
%
Dry
Den
sity
,(p
cf)

23
24
25a
25b
26
27
28
10
4
15
5
4
3
50/6"
50/4"
50/3"
50/5"
50/4"
50/3"
Brown and gray silty fine to medium sand withgravel; diamicton (very dense, moist)
Dark gray
Brown silty fine to coarse sand with tan silt clastsand gray clay clasts, iron-stained at contact(very dense, moist)
Brown fine to medium sand with occasional finegravel (very dense, moist)
SM
SM
SP
16
8
10
20
10
Note: See Figure A-1 for explanation of symbols.Grab samples referenced as G-#.
FIELD DATA
Dep
th (
feet
)
115
120
125
130
135
140
Inte
rval
Ele
vatio
n (f
eet)
110
105
100
95
90
85
Sam
ple
Nam
eT
estin
g
Rec
over
ed (
in)
Gra
phic
Log
Co
llec
ted
Sam
ple
Blo
ws/
foot
MATERIALDESCRIPTION
Gro
upC
lass
ifica
tion
Wat
er L
evel
Log of Boring GEI-6 (continued)Ledgewood Landslide Evaluation
Island County, Washington
0422-097-00
Project:
Project Location:
Project Number:Figure A-7Sheet 5 of 8B
ellin
gham
: D
ate:
10/2
5/13
Pat
h:P
:\0\
0422
097\
00\G
INT
\042
2097
00.G
PJ
DB
Tem
plat
e/Li
bTem
plat
e:G
EO
EN
GIN
EE
RS
8.G
DT
/GE
I8_G
EO
TE
CH
_ST
AN
DA
RD
REMARKS
Moi
stur
eC
onte
nt,
%
Dry
Den
sity
,(p
cf)

29SA
30
31
32
33
34
4
4
5
9
11
11
50/4"
50/4"
50/5"
50/3"
50/5"
50/5"
Grades olive-gray
SA (%F = 8)11
10
Note: See Figure A-1 for explanation of symbols.Grab samples referenced as G-#.
FIELD DATA
Dep
th (
feet
)
145
150
155
160
165
170
Inte
rval
Ele
vatio
n (f
eet)
80
75
70
65
60
55
Sam
ple
Nam
eT
estin
g
Rec
over
ed (
in)
Gra
phic
Log
Co
llec
ted
Sam
ple
Blo
ws/
foot
MATERIALDESCRIPTION
Gro
upC
lass
ifica
tion
Wat
er L
evel
Log of Boring GEI-6 (continued)Ledgewood Landslide Evaluation
Island County, Washington
0422-097-00
Project:
Project Location:
Project Number:Figure A-7Sheet 6 of 8B
ellin
gham
: D
ate:
10/2
5/13
Pat
h:P
:\0\
0422
097\
00\G
INT
\042
2097
00.G
PJ
DB
Tem
plat
e/Li
bTem
plat
e:G
EO
EN
GIN
EE
RS
8.G
DT
/GE
I8_G
EO
TE
CH
_ST
AN
DA
RD
REMARKS
Moi
stur
eC
onte
nt,
%
Dry
Den
sity
,(p
cf)

35
36
37
38
39
40
3
5
3
5
6
5
50/3"
50/5"
50/4"
50/5"
50/6"
50/5"
Gray and black medium to coarse sand with finegravel (very dense, moist to wet)
Becomes fine to medium sand
Fine gravel with medium to coarse sand (verydense, moist)
Gray fine to medium sand (very dense, moist)
SP
GP
SP
18
7
13
Note: See Figure A-1 for explanation of symbols.Grab samples referenced as G-#.
FIELD DATA
Dep
th (
feet
)
175
180
185
190
195
200
Inte
rval
Ele
vatio
n (f
eet)
50
45
40
35
30
25
Sam
ple
Nam
eT
estin
g
Rec
over
ed (
in)
Gra
phic
Log
Co
llec
ted
Sam
ple
Blo
ws/
foot
MATERIALDESCRIPTION
Gro
upC
lass
ifica
tion
Wat
er L
evel
Log of Boring GEI-6 (continued)Ledgewood Landslide Evaluation
Island County, Washington
0422-097-00
Project:
Project Location:
Project Number:Figure A-7Sheet 7 of 8B
ellin
gham
: D
ate:
10/2
5/13
Pat
h:P
:\0\
0422
097\
00\G
INT
\042
2097
00.G
PJ
DB
Tem
plat
e/Li
bTem
plat
e:G
EO
EN
GIN
EE
RS
8.G
DT
/GE
I8_G
EO
TE
CH
_ST
AN
DA
RD
REMARKS
Moi
stur
eC
onte
nt,
%
Dry
Den
sity
,(p
cf)

41
42
43
44
45
11
11
3
6
9
50/5"
50/5"
50/3"
50/6"
50/3"
With silt laminations, wet
With fine gravel
Vibrating wire piezometer (ID 1301200),50 psi installed in bentonite/cement grout
21
20
21
Note: See Figure A-1 for explanation of symbols.Grab samples referenced as G-#.
FIELD DATA
Dep
th (
feet
)
205
210
215
220
225
Inte
rval
Ele
vatio
n (f
eet)
20
15
10
5
0
Sam
ple
Nam
eT
estin
g
Rec
over
ed (
in)
Gra
phic
Log
Co
llec
ted
Sam
ple
Blo
ws/
foot
MATERIALDESCRIPTION
Gro
upC
lass
ifica
tion
Wat
er L
evel
Log of Boring GEI-6 (continued)Ledgewood Landslide Evaluation
Island County, Washington
0422-097-00
Project:
Project Location:
Project Number:Figure A-7Sheet 8 of 8B
ellin
gham
: D
ate:
10/2
5/13
Pat
h:P
:\0\
0422
097\
00\G
INT
\042
2097
00.G
PJ
DB
Tem
plat
e/Li
bTem
plat
e:G
EO
EN
GIN
EE
RS
8.G
DT
/GE
I8_G
EO
TE
CH
_ST
AN
DA
RD
REMARKS
Moi
stur
eC
onte
nt,
%
Dry
Den
sity
,(p
cf)

1
2SA
3
4a4b
18
8
8
11
43
50/5"
50/4"
50/5"
Gravel with silty sand, organics (grass/weeds),pea gravel, and occasional cobbles (drivewayfill)
Light brown silty fine to coarse sand with roundedgravel and occasional cobbles with siltierinterbeds (dense, moist)
Grades to very dense
Gray-brown silt with fine sand to silty sand withoccasional gravel (hard/very dense, moist towet)
Decreased silt content
Gray-brown to light gray fine to coarse sand withsilt to silty fine to coarse sand with gravel andcobbles (very dense, moist to wet)
GW/GM
SM
ML/SM
SP-SM/SM
SA (%F = 28)
10
8
10
14
TotalDepth (ft)
HammerData
SystemDatum
Start EndChecked ByLogged By
SWCDrilled
Notes:
CRW
Surface Elevation (ft)Vertical Datum
Driller
GroundwaterDepth toWater (ft)Date Measured Elevation (ft)
LatitudeLongitude
48.142045-122.601929
Mobile B-59 Truck
Boart Longyear DrillingMethod
Mud Rotary250.5
Inclinometer installed
Autohammer300 (lbs) / 30 (in) Drop
DrillingEquipment
Geographic
6/21/20136/20/2013
191.5NAVD88
Note: See Figure A-1 for explanation of symbols.Grab samples referenced as G-#.
FIELD DATA
Dep
th (
feet
)
0
5
10
15
20
25
Inte
rval
Ele
vatio
n (f
eet)
190
185
180
175
170
Sam
ple
Nam
eT
estin
g
Rec
over
ed (
in)
Gra
phic
Log
Co
llec
ted
Sam
ple
Blo
ws/
foot
MATERIALDESCRIPTION
Gro
upC
lass
ifica
tion
Wat
er L
evel
Log of Boring GEI-7Ledgewood Landslide Evaluation
Island County, Washington
0422-097-00
Project:
Project Location:
Project Number:Figure A-8Sheet 1 of 9B
ellin
gham
: D
ate:
10/2
5/13
Pat
h:P
:\0\
0422
097\
00\G
INT
\042
2097
00.G
PJ
DB
Tem
plat
e/Li
bTem
plat
e:G
EO
EN
GIN
EE
RS
8.G
DT
/GE
I8_G
EO
TE
CH
_ST
AN
DA
RD
REMARKS
Moi
stur
eC
onte
nt,
%
Dry
Den
sity
,(p
cf)

5
6SA
7
8
9
10SA
12
6
4
12
8
11
50/6"
50/6"
50/4"
50/6"
50/6"
50/5"
Some oxidation throughout sample
Gray-brown silty fine gravel with sand (verydense, moist)
Becomes silty gravel
No oxidation observed
Grading to less silt content
Gray fine to coarse sand with silt, gravel, andoccasional cobbles (very dense, moist)
Gray-brown fine to medium sand with silt andoccasional gravel (very dense, moist to wet)
Cobble encountered
Gray-brown to gray fine to medium sand with siltto trace silt; clasts throughout sample (verydense, moist)
GM
SP-SM
SP-SM
SP-SM/SP
Hard drilling, rocking rig
SA (%F = 30)
SA (%F = 9)Vibrating wire piezometer (ID 1300917),
installed in bentonite/cement grout
12
10
16
Note: See Figure A-1 for explanation of symbols.Grab samples referenced as G-#.
FIELD DATA
Dep
th (
feet
)
25
30
35
40
45
50
Inte
rval
Ele
vatio
n (f
eet)
165
160
155
150
145
140
Sam
ple
Nam
eT
estin
g
Rec
over
ed (
in)
Gra
phic
Log
Co
llec
ted
Sam
ple
Blo
ws/
foot
MATERIALDESCRIPTION
Gro
upC
lass
ifica
tion
Wat
er L
evel
Log of Boring GEI-7 (continued)Ledgewood Landslide Evaluation
Island County, Washington
0422-097-00
Project:
Project Location:
Project Number:Figure A-8Sheet 2 of 9B
ellin
gham
: D
ate:
10/2
5/13
Pat
h:P
:\0\
0422
097\
00\G
INT
\042
2097
00.G
PJ
DB
Tem
plat
e/Li
bTem
plat
e:G
EO
EN
GIN
EE
RS
8.G
DT
/GE
I8_G
EO
TE
CH
_ST
AN
DA
RD
REMARKS
Moi
stur
eC
onte
nt,
%
Dry
Den
sity
,(p
cf)

11
12
13SA
14
15
16
12
12
12
7
8
5
50/5"
50/6"
50/5"
50/3"
50/4"
50/5"
With silt and occasional gravel
More silt clasts within body of sample
Trace gravel
Becomes olive gray
SA (%F = 7)
14
12
19
15
Note: See Figure A-1 for explanation of symbols.Grab samples referenced as G-#.
FIELD DATA
Dep
th (
feet
)
55
60
65
70
75
80
Inte
rval
Ele
vatio
n (f
eet)
135
130
125
120
115
110
Sam
ple
Nam
eT
estin
g
Rec
over
ed (
in)
Gra
phic
Log
Co
llec
ted
Sam
ple
Blo
ws/
foot
MATERIALDESCRIPTION
Gro
upC
lass
ifica
tion
Wat
er L
evel
Log of Boring GEI-7 (continued)Ledgewood Landslide Evaluation
Island County, Washington
0422-097-00
Project:
Project Location:
Project Number:Figure A-8Sheet 3 of 9B
ellin
gham
: D
ate:
10/2
5/13
Pat
h:P
:\0\
0422
097\
00\G
INT
\042
2097
00.G
PJ
DB
Tem
plat
e/Li
bTem
plat
e:G
EO
EN
GIN
EE
RS
8.G
DT
/GE
I8_G
EO
TE
CH
_ST
AN
DA
RD
REMARKS
Moi
stur
eC
onte
nt,
%
Dry
Den
sity
,(p
cf)
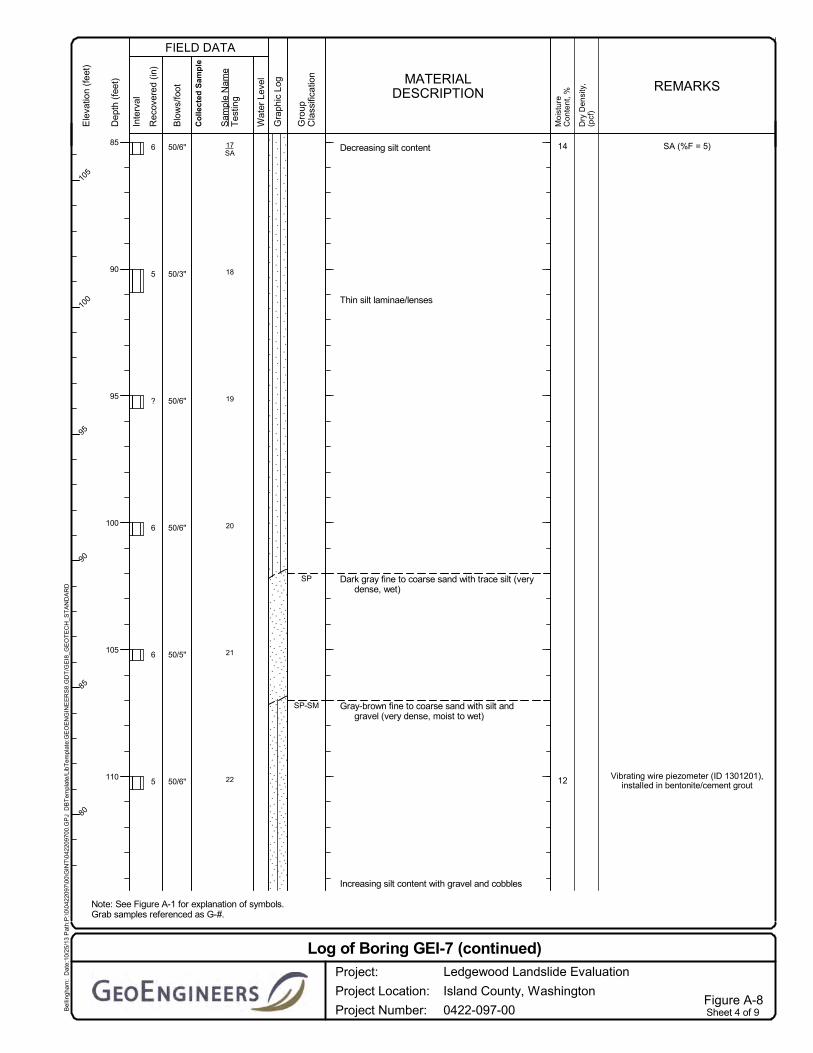
17SA
18
19
20
21
22
6
5
?
6
6
5
50/6"
50/3"
50/6"
50/6"
50/5"
50/6"
Decreasing silt content
Thin silt laminae/lenses
Dark gray fine to coarse sand with trace silt (verydense, wet)
Gray-brown fine to coarse sand with silt andgravel (very dense, moist to wet)
Increasing silt content with gravel and cobbles
SP
SP-SM
SA (%F = 5)
Vibrating wire piezometer (ID 1301201),installed in bentonite/cement grout
14
12
Note: See Figure A-1 for explanation of symbols.Grab samples referenced as G-#.
FIELD DATA
Dep
th (
feet
)
85
90
95
100
105
110
Inte
rval
Ele
vatio
n (f
eet)
105
100
95
90
85
80
Sam
ple
Nam
eT
estin
g
Rec
over
ed (
in)
Gra
phic
Log
Co
llec
ted
Sam
ple
Blo
ws/
foot
MATERIALDESCRIPTION
Gro
upC
lass
ifica
tion
Wat
er L
evel
Log of Boring GEI-7 (continued)Ledgewood Landslide Evaluation
Island County, Washington
0422-097-00
Project:
Project Location:
Project Number:Figure A-8Sheet 4 of 9B
ellin
gham
: D
ate:
10/2
5/13
Pat
h:P
:\0\
0422
097\
00\G
INT
\042
2097
00.G
PJ
DB
Tem
plat
e/Li
bTem
plat
e:G
EO
EN
GIN
EE
RS
8.G
DT
/GE
I8_G
EO
TE
CH
_ST
AN
DA
RD
REMARKS
Moi
stur
eC
onte
nt,
%
Dry
Den
sity
,(p
cf)

23
24
25
26
27
28
2
0
0
5
4
50/3"
50/4"
50/1"
50/5"
50/4"
50/4"
Gray silty fine to coarse sand to sand with siltand trace clay with gravel (very dense, moistto wet)
1-inch silty zone
Oxidized (red-orange) layer
SM/SP-SM
Rock in sampler shoe
12
15
10
Note: See Figure A-1 for explanation of symbols.Grab samples referenced as G-#.
FIELD DATA
Dep
th (
feet
)
115
120
125
130
135
140
Inte
rval
Ele
vatio
n (f
eet)
75
70
65
60
55
50
Sam
ple
Nam
eT
estin
g
Rec
over
ed (
in)
Gra
phic
Log
Co
llec
ted
Sam
ple
Blo
ws/
foot
MATERIALDESCRIPTION
Gro
upC
lass
ifica
tion
Wat
er L
evel
Log of Boring GEI-7 (continued)Ledgewood Landslide Evaluation
Island County, Washington
0422-097-00
Project:
Project Location:
Project Number:Figure A-8Sheet 5 of 9B
ellin
gham
: D
ate:
10/2
5/13
Pat
h:P
:\0\
0422
097\
00\G
INT
\042
2097
00.G
PJ
DB
Tem
plat
e/Li
bTem
plat
e:G
EO
EN
GIN
EE
RS
8.G
DT
/GE
I8_G
EO
TE
CH
_ST
AN
DA
RD
REMARKS
Moi
stur
eC
onte
nt,
%
Dry
Den
sity
,(p
cf)

29
30
31a
32
33
34
4
3
5
0
2
0
50/4"
50/4"
50/5.5"
50/1"
50/2"
50/3"
Oxidation throughout sample
Brown-gray silty fine to medium sand (verydense, moist)
Gray silty fine to coarse gravel with sand togravel with silt and sand; occasional cobble(very dense, wet)
SM
GM/GP-GM
13
16
19
17
15
Note: See Figure A-1 for explanation of symbols.Grab samples referenced as G-#.
FIELD DATA
Dep
th (
feet
)
145
150
155
160
165
170
Inte
rval
Ele
vatio
n (f
eet)
45
40
35
30
25
20
Sam
ple
Nam
eT
estin
g
Rec
over
ed (
in)
Gra
phic
Log
Co
llec
ted
Sam
ple
Blo
ws/
foot
MATERIALDESCRIPTION
Gro
upC
lass
ifica
tion
Wat
er L
evel
Log of Boring GEI-7 (continued)Ledgewood Landslide Evaluation
Island County, Washington
0422-097-00
Project:
Project Location:
Project Number:Figure A-8Sheet 6 of 9B
ellin
gham
: D
ate:
10/2
5/13
Pat
h:P
:\0\
0422
097\
00\G
INT
\042
2097
00.G
PJ
DB
Tem
plat
e/Li
bTem
plat
e:G
EO
EN
GIN
EE
RS
8.G
DT
/GE
I8_G
EO
TE
CH
_ST
AN
DA
RD
REMARKS
Moi
stur
eC
onte
nt,
%
Dry
Den
sity
,(p
cf)

35
36
37
38
39
40
3
1
1
2
1
0
50/3"
50/2"
50/2"
50/2"
50/1"
50/2"
Gray silty fine to coarse sand to sandy gravel andoccasional cobbles (oxidation around gravels)(very dense, moist to wet)
No recovery
SM/GM
11
Note: See Figure A-1 for explanation of symbols.Grab samples referenced as G-#.
FIELD DATA
Dep
th (
feet
)
175
180
185
190
195
200
Inte
rval
Ele
vatio
n (f
eet)
15
10
5
0
-5
-10
Sam
ple
Nam
eT
estin
g
Rec
over
ed (
in)
Gra
phic
Log
Co
llec
ted
Sam
ple
Blo
ws/
foot
MATERIALDESCRIPTION
Gro
upC
lass
ifica
tion
Wat
er L
evel
Log of Boring GEI-7 (continued)Ledgewood Landslide Evaluation
Island County, Washington
0422-097-00
Project:
Project Location:
Project Number:Figure A-8Sheet 7 of 9B
ellin
gham
: D
ate:
10/2
5/13
Pat
h:P
:\0\
0422
097\
00\G
INT
\042
2097
00.G
PJ
DB
Tem
plat
e/Li
bTem
plat
e:G
EO
EN
GIN
EE
RS
8.G
DT
/GE
I8_G
EO
TE
CH
_ST
AN
DA
RD
REMARKS
Moi
stur
eC
onte
nt,
%
Dry
Den
sity
,(p
cf)

41
42
43
44
45
46
0
2
0
0
1
3
50/0.5"
100/2"
100/2"
100/1"
100/1"
100/3"
No recovery
Slow drilling; cobble
Increased silt content
Gray fine to coarse sand with silt and fine tocoarse gravel (very dense, wet)
SP-SM
Vibrating wire piezometer (ID 1301202),installed in bentonite/cement grout
Note: See Figure A-1 for explanation of symbols.Grab samples referenced as G-#.
FIELD DATA
Dep
th (
feet
)
205
210
215
220
225
230
Inte
rval
Ele
vatio
n (f
eet)
-15
-20
-25
-30
-35
-40
Sam
ple
Nam
eT
estin
g
Rec
over
ed (
in)
Gra
phic
Log
Co
llec
ted
Sam
ple
Blo
ws/
foot
MATERIALDESCRIPTION
Gro
upC
lass
ifica
tion
Wat
er L
evel
Log of Boring GEI-7 (continued)Ledgewood Landslide Evaluation
Island County, Washington
0422-097-00
Project:
Project Location:
Project Number:Figure A-8Sheet 8 of 9B
ellin
gham
: D
ate:
10/2
5/13
Pat
h:P
:\0\
0422
097\
00\G
INT
\042
2097
00.G
PJ
DB
Tem
plat
e/Li
bTem
plat
e:G
EO
EN
GIN
EE
RS
8.G
DT
/GE
I8_G
EO
TE
CH
_ST
AN
DA
RD
REMARKS
Moi
stur
eC
onte
nt,
%
Dry
Den
sity
,(p
cf)

47
48
49
50
2
5
1
0.5
100/2"
90/5"
50/6"
50/5"
Gray fine to medium sand with small silt clasts;micaceous (very dense, wet)
Gray silty fine to coarse sand with small siltclasts; micaceous (very dense, wet)
SP
SM
Note: See Figure A-1 for explanation of symbols.Grab samples referenced as G-#.
FIELD DATA
Dep
th (
feet
)
235
240
245
250
Inte
rval
Ele
vatio
n (f
eet)
-45
-50
-55
Sam
ple
Nam
eT
estin
g
Rec
over
ed (
in)
Gra
phic
Log
Co
llec
ted
Sam
ple
Blo
ws/
foot
MATERIALDESCRIPTION
Gro
upC
lass
ifica
tion
Wat
er L
evel
Log of Boring GEI-7 (continued)Ledgewood Landslide Evaluation
Island County, Washington
0422-097-00
Project:
Project Location:
Project Number:Figure A-8Sheet 9 of 9B
ellin
gham
: D
ate:
10/2
5/13
Pat
h:P
:\0\
0422
097\
00\G
INT
\042
2097
00.G
PJ
DB
Tem
plat
e/Li
bTem
plat
e:G
EO
EN
GIN
EE
RS
8.G
DT
/GE
I8_G
EO
TE
CH
_ST
AN
DA
RD
REMARKS
Moi
stur
eC
onte
nt,
%
Dry
Den
sity
,(p
cf)

1
2SA
3
4
6
6
6
4
50/4"
50/4"
50/3"
50/5"
Gray-brown silty fine to coarse sand with graveland occasional cobbles (very dense, moist)
With occasional gravel
Tan-gray fine to coarse sand with silt, gravel,occasional cobbles, and silt layer (3 inchesthick) (very dense, moist)
Gray silty fine to coarse sand with gravel andoccasional cobbles (very dense, moist)
SM
SP-SM/ML
SM
SA (%F = 24)
10
10
11
TotalDepth (ft)
HammerData
SystemDatum
Start EndChecked ByLogged By
SWCDrilled
Notes:
BHC
Surface Elevation (ft)Vertical Datum
Driller
GroundwaterDepth toWater (ft)Date Measured Elevation (ft)
LatitudeLongitude
48.140581-122.601433
Mobile B-59 Truck
Holt Services, Inc. DrillingMethod
Mud Rotary190.5
Autohammer300 (lbs) / 30 (in) Drop
DrillingEquipment
Geographic
6/20/2013
197.5NAVD88
Note: See Figure A-1 for explanation of symbols.Grab samples referenced as G-#.
FIELD DATA
Dep
th (
feet
)
0
5
10
15
20
25
Inte
rval
Ele
vatio
n (f
eet)
195
190
185
180
175
Sam
ple
Nam
eT
estin
g
Rec
over
ed (
in)
Gra
phic
Log
Co
llec
ted
Sam
ple
Blo
ws/
foot
MATERIALDESCRIPTION
Gro
upC
lass
ifica
tion
Wat
er L
evel
Log of Boring GEI-8Ledgewood Landslide Evaluation
Island County, Washington
0422-097-00
Project:
Project Location:
Project Number:Figure A-9Sheet 1 of 7B
ellin
gham
: D
ate:
10/2
5/13
Pat
h:P
:\0\
0422
097\
00\G
INT
\042
2097
00.G
PJ
DB
Tem
plat
e/Li
bTem
plat
e:G
EO
EN
GIN
EE
RS
8.G
DT
/GE
I8_G
EO
TE
CH
_ST
AN
DA
RD
REMARKS
Moi
stur
eC
onte
nt,
%
Dry
Den
sity
,(p
cf)

5SA
6
7
8
9
10AL
4
4
4
18
18
18
50/5"
50/5"
50/5"
44
33
50/6"
Gray fine to coarse silty sand to silt with sandand gravel (very dense/hard, moist) (till-like)
Gray silt with trace fine sand and massive to faintlaminations; low plasticity (hard, moist)
Gray clayey silt to silty clay with sand andoccasional gravel (hard, moist)
With occasional fine gravelGray silty fine to coarse sand with gravel (very
dense, wet)
Gray silty clay; massive (hard, moist)
SM/ML
ML
ML/CL
SM
CL
SA (%F = 26)
AL (LL = 32; PI = 9)Vibrating wire piezometer (ID 1300919),
installed in bentonite/cement grout
11
22
25
23
Note: See Figure A-1 for explanation of symbols.Grab samples referenced as G-#.
FIELD DATA
Dep
th (
feet
)
25
30
35
40
45
50
Inte
rval
Ele
vatio
n (f
eet)
170
165
160
155
150
145
Sam
ple
Nam
eT
estin
g
Rec
over
ed (
in)
Gra
phic
Log
Co
llec
ted
Sam
ple
Blo
ws/
foot
MATERIALDESCRIPTION
Gro
upC
lass
ifica
tion
Wat
er L
evel
Log of Boring GEI-8 (continued)Ledgewood Landslide Evaluation
Island County, Washington
0422-097-00
Project:
Project Location:
Project Number:Figure A-9Sheet 2 of 7B
ellin
gham
: D
ate:
10/2
5/13
Pat
h:P
:\0\
0422
097\
00\G
INT
\042
2097
00.G
PJ
DB
Tem
plat
e/Li
bTem
plat
e:G
EO
EN
GIN
EE
RS
8.G
DT
/GE
I8_G
EO
TE
CH
_ST
AN
DA
RD
REMARKS
Moi
stur
eC
onte
nt,
%
Dry
Den
sity
,(p
cf)

11
12AL
13
14
15
16
18
18
18
4
3
4
38
33
46
50/5"
50/4"
50/4"
Gray silt with trace fine sand (hard, moist)
Gray and brown clayey silt with fine to coarsesand, occasional gravel, and occasionalwoody debris (hard, moist)
Gray and brown silty fine to coarse sand withoccasional gravel; oxidation staining (verydense, moist to wet)
With possible cobbles
Gray-tan fine to coarse sand with silt and gravel(very dense, moist to wet)
ML
ML
SM
SP-SM
AL (LL = 35; PI = 9)
Organic odor (?)
28
19
16
12
Note: See Figure A-1 for explanation of symbols.Grab samples referenced as G-#.
FIELD DATA
Dep
th (
feet
)
55
60
65
70
75
80
Inte
rval
Ele
vatio
n (f
eet)
140
135
130
125
120
115
Sam
ple
Nam
eT
estin
g
Rec
over
ed (
in)
Gra
phic
Log
Co
llec
ted
Sam
ple
Blo
ws/
foot
MATERIALDESCRIPTION
Gro
upC
lass
ifica
tion
Wat
er L
evel
Log of Boring GEI-8 (continued)Ledgewood Landslide Evaluation
Island County, Washington
0422-097-00
Project:
Project Location:
Project Number:Figure A-9Sheet 3 of 7B
ellin
gham
: D
ate:
10/2
5/13
Pat
h:P
:\0\
0422
097\
00\G
INT
\042
2097
00.G
PJ
DB
Tem
plat
e/Li
bTem
plat
e:G
EO
EN
GIN
EE
RS
8.G
DT
/GE
I8_G
EO
TE
CH
_ST
AN
DA
RD
REMARKS
Moi
stur
eC
onte
nt,
%
Dry
Den
sity
,(p
cf)

17
18
19
20SA
21SA
22
2
3
4
4
12
0
50/3"
50/3"
50/3"
50/5"
50/5"
50/2"
Gray-brown silty fine to medium sand to sandwith silt and occasional gravel (very dense,moist to wet)
Gray-brown to gray silty fine to coarse sand withgravel; heavy oxidation staining (very dense,moist) (till-like)
SM/SP-SM
SM
SA (%F = 19)Vibrating wire piezometer (ID 1300934),
installed in bentonite/cement grout
SA (%F = 45)
11
10
16
15
Note: See Figure A-1 for explanation of symbols.Grab samples referenced as G-#.
FIELD DATA
Dep
th (
feet
)
85
90
95
100
105
110
Inte
rval
Ele
vatio
n (f
eet)
110
105
100
95
90
85
Sam
ple
Nam
eT
estin
g
Rec
over
ed (
in)
Gra
phic
Log
Co
llec
ted
Sam
ple
Blo
ws/
foot
MATERIALDESCRIPTION
Gro
upC
lass
ifica
tion
Wat
er L
evel
Log of Boring GEI-8 (continued)Ledgewood Landslide Evaluation
Island County, Washington
0422-097-00
Project:
Project Location:
Project Number:Figure A-9Sheet 4 of 7B
ellin
gham
: D
ate:
10/2
5/13
Pat
h:P
:\0\
0422
097\
00\G
INT
\042
2097
00.G
PJ
DB
Tem
plat
e/Li
bTem
plat
e:G
EO
EN
GIN
EE
RS
8.G
DT
/GE
I8_G
EO
TE
CH
_ST
AN
DA
RD
REMARKS
Moi
stur
eC
onte
nt,
%
Dry
Den
sity
,(p
cf)

23
24SA
25
26
27
28
0
6
6
6
6
0
50/2"
105/6"
50/4"
50/6"
50/4"
110/4"
Gray fine to medium sand with silt (very dense,moist to wet)
Grades to fine sand with thin layers (2 inchesthick) of brown silt
Brown silt to silty fine sand; faint laminations,non-plastic (very dense/hard, moist)
Gray fine sand with silt (very dense, moist to wet)
SP-SM
ML/SM
SP
SA (%F = 14)14
17
20
18
Note: See Figure A-1 for explanation of symbols.Grab samples referenced as G-#.
FIELD DATA
Dep
th (
feet
)
115
120
125
130
135
140
Inte
rval
Ele
vatio
n (f
eet)
80
75
70
65
60
55
Sam
ple
Nam
eT
estin
g
Rec
over
ed (
in)
Gra
phic
Log
Co
llec
ted
Sam
ple
Blo
ws/
foot
MATERIALDESCRIPTION
Gro
upC
lass
ifica
tion
Wat
er L
evel
Log of Boring GEI-8 (continued)Ledgewood Landslide Evaluation
Island County, Washington
0422-097-00
Project:
Project Location:
Project Number:Figure A-9Sheet 5 of 7B
ellin
gham
: D
ate:
10/2
5/13
Pat
h:P
:\0\
0422
097\
00\G
INT
\042
2097
00.G
PJ
DB
Tem
plat
e/Li
bTem
plat
e:G
EO
EN
GIN
EE
RS
8.G
DT
/GE
I8_G
EO
TE
CH
_ST
AN
DA
RD
REMARKS
Moi
stur
eC
onte
nt,
%
Dry
Den
sity
,(p
cf)

29
30
31
32
33
34
0
3
3
3
100/2"
100/4"
50/5"
100/4"
100/3"
100/4"
Tan to gray silty fine to coarse sand to sand withsilt and gravel (very dense, moist to wet)
Tan-gray silt with occasional fine gravel (hard,moist)
Brown silty fine to coarse sand with gravel (verydense, moist to wet)
Heavy orange oxidized staining
Slight orange oxidation staining
Decreased silt content
SM/SP-SM
ML
SM
Vibrating wire piezometer (ID 1300933),installed in bentonite/cement grout
Note: See Figure A-1 for explanation of symbols.Grab samples referenced as G-#.
FIELD DATA
Dep
th (
feet
)
145
150
155
160
165
170
Inte
rval
Ele
vatio
n (f
eet)
50
45
40
35
30
25
Sam
ple
Nam
eT
estin
g
Rec
over
ed (
in)
Gra
phic
Log
Co
llec
ted
Sam
ple
Blo
ws/
foot
MATERIALDESCRIPTION
Gro
upC
lass
ifica
tion
Wat
er L
evel
Log of Boring GEI-8 (continued)Ledgewood Landslide Evaluation
Island County, Washington
0422-097-00
Project:
Project Location:
Project Number:Figure A-9Sheet 6 of 7B
ellin
gham
: D
ate:
10/2
5/13
Pat
h:P
:\0\
0422
097\
00\G
INT
\042
2097
00.G
PJ
DB
Tem
plat
e/Li
bTem
plat
e:G
EO
EN
GIN
EE
RS
8.G
DT
/GE
I8_G
EO
TE
CH
_ST
AN
DA
RD
REMARKS
Moi
stur
eC
onte
nt,
%
Dry
Den
sity
,(p
cf)

35
36
37
38
4
3
3
3
100/4"
100/4"
100/4"
100/4"
Becomes tan; slight staining
Note: See Figure A-1 for explanation of symbols.Grab samples referenced as G-#.
FIELD DATA
Dep
th (
feet
)
175
180
185
190
Inte
rval
Ele
vatio
n (f
eet)
20
15
10
Sam
ple
Nam
eT
estin
g
Rec
over
ed (
in)
Gra
phic
Log
Co
llec
ted
Sam
ple
Blo
ws/
foot
MATERIALDESCRIPTION
Gro
upC
lass
ifica
tion
Wat
er L
evel
Log of Boring GEI-8 (continued)Ledgewood Landslide Evaluation
Island County, Washington
0422-097-00
Project:
Project Location:
Project Number:Figure A-9Sheet 7 of 7B
ellin
gham
: D
ate:
10/2
5/13
Pat
h:P
:\0\
0422
097\
00\G
INT
\042
2097
00.G
PJ
DB
Tem
plat
e/Li
bTem
plat
e:G
EO
EN
GIN
EE
RS
8.G
DT
/GE
I8_G
EO
TE
CH
_ST
AN
DA
RD
REMARKS
Moi
stur
eC
onte
nt,
%
Dry
Den
sity
,(p
cf)

APPENDIX B Laboratory Testing

LEDGEWOOD LANDSLIDE EVALUATION Whidbey Island, Washington
November 27, 2013 | Page B-1 File No. 0422-097-00
APPENDIX B LABORATORY TESTING
Laboratory Testing and Results
Soil samples obtained from the explorations were transported to our laboratory and examined to confirm or modify field classifications, as well as to evaluate index properties of the soil samples. Representative samples were selected for laboratory testing consisting of the determination of the moisture content, sieve analysis, and Atterberg Limit determinations. The tests were performed in general accordance with test methods of the American Society for Testing and Materials (ASTM) or other applicable procedures.
Moisture Content Testing
The natural moisture contents of selected soil samples obtained from the exploratory borings were determined in general accordance with ASTM D 2216 test procedures. The results from the moisture content determinations are presented in the boring logs.
Atterberg Limits
Atterberg limit tests were completed on selected soil samples. The tests were used to classify the soil as well as to aid in evaluating index properties and consolidation characteristics of the fine-grained soil deposits. The liquid limit and the plastic limit were obtained in general accordance with ASTM D 4318. The results of the Atterberg limits are summarized in Figure B-1 through B-14.
Sieve Analyses
Sieve analyses were performed on selected samples in general accordance with ASTM D 422 to determine the sample grain size distribution. The wet sieve analysis method was used to determine the percentage of soil greater than the U.S. No. 200 mesh sieve. The results of the sieve analyses were plotted, classified in general accordance with the Unified Soil Classification System (USCS), and are presented in Figures B-15 through B-24.

FIGURE B-1
ATTERBERG LIMITS TEST RESULTS
0422
-09
7-0
0
AF
2 :
SW
C :t
ln 0
6-11
-13(
Att
erb
ergs
.pp
t)
EX
PLO
RA
TIO
NN
UM
BE
RS
OIL
DE
SC
RIP
TIO
NS
AM
PLE
DE
PT
HM
OIS
TU
RE
CO
NT
EN
T (
%)
LIQ
UID
LIM
IT (
%)
PLA
ST
ICIT
YIN
DE
X (
%)
GE
I-1
GE
I-1
GE
I-1
75’
160’
259’
24 15 16
42 50 29
22 31 9
Gra
y cl
ay (
CL)
Gra
y si
lty le
an t
o fa
t cl
ay w
ith t
race
san
d (C
L/C
H)
Gra
y si
lty c
lay
(CL)
SY
MB
OL
PL
AS
TIC
ITY
CH
AR
T
0102030405060
010
2030
4050
6070
8090
100
LIQ
UID
LIM
IT
PLASTICITY INDEX
CL
-ML
ML
or
OL
CL
or
OL
OH
or
MH
CH
or
OH

FIGURE B-2
ATTERBERG LIMITS TEST RESULTS
0422
-09
7-0
0
AF
2 :
SW
C :t
ln 0
6-11
-13(
Att
erb
ergs
.pp
t)
EX
PLO
RA
TIO
NN
UM
BE
RS
OIL
DE
SC
RIP
TIO
NS
AM
PLE
DE
PT
HM
OIS
TU
RE
CO
NT
EN
T (
%)
LIQ
UID
LIM
IT (
%)
PLA
ST
ICIT
YIN
DE
X (
%)
GE
I-1
GE
I-1
GE
I-1
267’
275’
278’
16 18 16
25 42 54
5 20 36
Gra
y si
lty c
lay
with
tra
ce s
and
(CL-
ML)
Gra
y cl
ay w
ith s
and
and
occa
sion
al g
rave
l (C
L)G
ray
fat
clay
(C
H)
SY
MB
OL
PL
AS
TIC
ITY
CH
AR
T
0102030405060
010
2030
4050
6070
8090
100
LIQ
UID
LIM
IT
PLASTICITY INDEX
CL
-ML
ML
or
OL
CL
or
OL
OH
or
MH
CH
or
OH

FIGURE B-3
ATTERBERG LIMITS TEST RESULTS
0422
-09
7-0
0
AF
2 :
SW
C :t
ln 0
6-11
-13(
Att
erb
ergs
.pp
t)
EX
PLO
RA
TIO
NN
UM
BE
RS
OIL
DE
SC
RIP
TIO
NS
AM
PLE
DE
PT
HM
OIS
TU
RE
CO
NT
EN
T (
%)
LIQ
UID
LIM
IT (
%)
PLA
ST
ICIT
YIN
DE
X (
%)
GE
I-2
GE
I-2
GE
I-2
55’
100’
115’
35 26 32
71 65 73
38 26 34
Gra
y fa
t si
lty c
lay
to c
laye
y si
lt (C
H/M
H)
Ligh
t br
own
fat
clay
ey s
ilt (
MH
)G
ray
fat
silt
(MH
)
SY
MB
OL
PL
AS
TIC
ITY
CH
AR
T
0102030405060
010
2030
4050
6070
8090
100
LIQ
UID
LIM
IT
PLASTICITY INDEX
CL
-ML
ML
or
OL
CL
or
OL
OH
or
MH
CH
or
OH

FIGURE B-4
ATTERBERG LIMITS TEST RESULTS
0422
-09
7-0
0
AF
2 :
SW
C :t
ln 0
6-11
-13(
Att
erb
ergs
.pp
t)
EX
PLO
RA
TIO
NN
UM
BE
RS
OIL
DE
SC
RIP
TIO
NS
AM
PLE
DE
PT
HM
OIS
TU
RE
CO
NT
EN
T (
%)
LIQ
UID
LIM
IT (
%)
PLA
ST
ICIT
YIN
DE
X (
%)
GE
I-2
GE
I-2
125’
130’
31 1652 N
A21 N
AG
ray
fat
silt
(MH
)G
ray
non
plas
tic s
ilt (
ML)
SY
MB
OL
PL
AS
TIC
ITY
CH
AR
T
0102030405060
010
2030
4050
6070
8090
100
LIQ
UID
LIM
IT
PLASTICITY INDEX
CL
-ML
ML
or
OL
CL
or
OL
OH
or
MH
CH
or
OH

FIGURE B-5
ATTERBERG LIMITS TEST RESULTS
0422
-09
7-0
0
AF
2 :
SW
C :t
ln 0
6-11
-13(
Att
erb
ergs
.pp
t)
EX
PLO
RA
TIO
NN
UM
BE
RS
OIL
DE
SC
RIP
TIO
NS
AM
PLE
DE
PT
HM
OIS
TU
RE
CO
NT
EN
T (
%)
LIQ
UID
LIM
IT (
%)
PLA
ST
ICIT
YIN
DE
X (
%)
GE
I-3
GE
I-3
GE
I-3
17.5
’20
’27
.5’
26 87 33
48 42 66
22 19 35
Bro
wn
silty
cla
y w
ith s
and
(CL)
Gra
y cl
ay (
CL)
Gra
y fa
t si
lty c
lay
(CH
)
SY
MB
OL
PL
AS
TIC
ITY
CH
AR
T
0102030405060
010
2030
4050
6070
8090
100
LIQ
UID
LIM
IT
PLASTICITY INDEX
CL
-ML
ML
or
OL
CL
or
OL
OH
or
MH
CH
or
OH

FIGURE B-6
ATTERBERG LIMITS TEST RESULTS
0422
-09
7-0
0
AF
2 :
SW
C :t
ln 0
6-11
-13(
Att
erb
ergs
.pp
t)
EX
PLO
RA
TIO
NN
UM
BE
RS
OIL
DE
SC
RIP
TIO
NS
AM
PLE
DE
PT
HM
OIS
TU
RE
CO
NT
EN
T (
%)
LIQ
UID
LIM
IT (
%)
PLA
ST
ICIT
YIN
DE
X (
%)
GE
I-3
GE
I-3
GE
I-3
40’
50’
55’
36 30 32
74 63 41
44 35 15
Gra
y fa
t si
lty c
lay
(CH
)G
ray
fat
silty
cla
y (C
H)
Gra
y cl
ayey
silt
(M
L)
SY
MB
OL
PL
AS
TIC
ITY
CH
AR
T
0102030405060
010
2030
4050
6070
8090
100
LIQ
UID
LIM
IT
PLASTICITY INDEX
CL
-ML
ML
or
OL
CL
or
OL
OH
or
MH
CH
or
OH

FIGURE B-7
ATTERBERG LIMITS TEST RESULTS
0422
-09
7-0
0
AF
2 :
SW
C :t
ln 0
6-11
-13(
Att
erb
ergs
.pp
t)
EX
PLO
RA
TIO
NN
UM
BE
RS
OIL
DE
SC
RIP
TIO
NS
AM
PLE
DE
PT
HM
OIS
TU
RE
CO
NT
EN
T (
%)
LIQ
UID
LIM
IT (
%)
PLA
ST
ICIT
YIN
DE
X (
%)
GE
I-3
GE
I-3
GE
I-3
GE
I-3
62.5
’87
.5’
100’
130’
18 32 29 38
44 34 21 45
21 6N
on-p
last
ic13
Gra
y cl
ay w
ith s
ilt (
CL)
Gra
y cl
ayey
silt
(M
L)G
ray
silt
(ML)
Gra
y si
lt w
ith f
ine
sand
(M
L)
SY
MB
OL
PL
AS
TIC
ITY
CH
AR
T
0102030405060
010
2030
4050
6070
8090
100
LIQ
UID
LIM
IT
PLASTICITY INDEX
CL
-ML
ML
or
OL
CL
or
OL
OH
or
MH
CH
or
OH

FIGURE B-8
ATTERBERG LIMITS TEST RESULTS
0422
-09
7-0
0
AF
2 :
SW
C :t
ln 0
6-11
-13(
Att
erb
ergs
.pp
t)
EX
PLO
RA
TIO
NN
UM
BE
RS
OIL
DE
SC
RIP
TIO
NS
AM
PLE
DE
PT
HM
OIS
TU
RE
CO
NT
EN
T (
%)
LIQ
UID
LIM
IT (
%)
PLA
ST
ICIT
YIN
DE
X (
%)
GE
I-4
GE
I-4
GE
I-4
55’
57.5
’75
22 23 30
55 34 54
24 10 24
Gra
y fa
t cl
ayey
silt
(M
H)
Gra
y si
lt w
ith f
ine
sand
and
tra
ce c
lay
(ML)
Gra
y fa
t cl
ayey
silt
(M
H)
SY
MB
OL
PL
AS
TIC
ITY
CH
AR
T
0102030405060
010
2030
4050
6070
8090
100
LIQ
UID
LIM
IT
PLASTICITY INDEX
CL
-ML
ML
or
OL
CL
or
OL
OH
or
MH
CH
or
OH

FIGURE B-8
ATTERBERG LIMITS TEST RESULTS
0422
-09
7-0
0
AF
2 :
SW
C :t
ln 0
6-11
-13(
Att
erb
ergs
.pp
t)
EX
PLO
RA
TIO
NN
UM
BE
RS
OIL
DE
SC
RIP
TIO
NS
AM
PLE
DE
PT
HM
OIS
TU
RE
CO
NT
EN
T (
%)
LIQ
UID
LIM
IT (
%)
PLA
ST
ICIT
YIN
DE
X (
%)
GE
I-6
95’
2535
13B
row
n si
lty c
lay
(CL)
SY
MB
OL
PL
AS
TIC
ITY
CH
AR
T
0102030405060
010
2030
4050
6070
8090
100
LIQ
UID
LIM
IT
PLASTICITY INDEX
CL
-ML
ML
or
OL
CL
or
OL
OH
or
MH
CH
or
OH

FIGURE B-10
ATTERBERG LIMITS TEST RESULTS
0422
-09
7-0
0
AF
2 :
SW
C :t
ln 0
6-11
-13(
Att
erb
ergs
.pp
t)
EX
PLO
RA
TIO
NN
UM
BE
RS
OIL
DE
SC
RIP
TIO
NS
AM
PLE
DE
PT
HM
OIS
TU
RE
CO
NT
EN
T (
%)
LIQ
UID
LIM
IT (
%)
PLA
ST
ICIT
YIN
DE
X (
%)
GE
I-8
GE
I-8
50’
60’
23 2832 35
9 9G
ray
clay
ey s
ilt (
ML)
Gra
y si
lt w
ith t
race
fin
e sa
nd (
ML)
SY
MB
OL
PL
AS
TIC
ITY
CH
AR
T
0102030405060
010
2030
4050
6070
8090
100
LIQ
UID
LIM
IT
PLASTICITY INDEX
CL
-ML
ML
or
OL
CL
or
OL
OH
or
MH
CH
or
OH
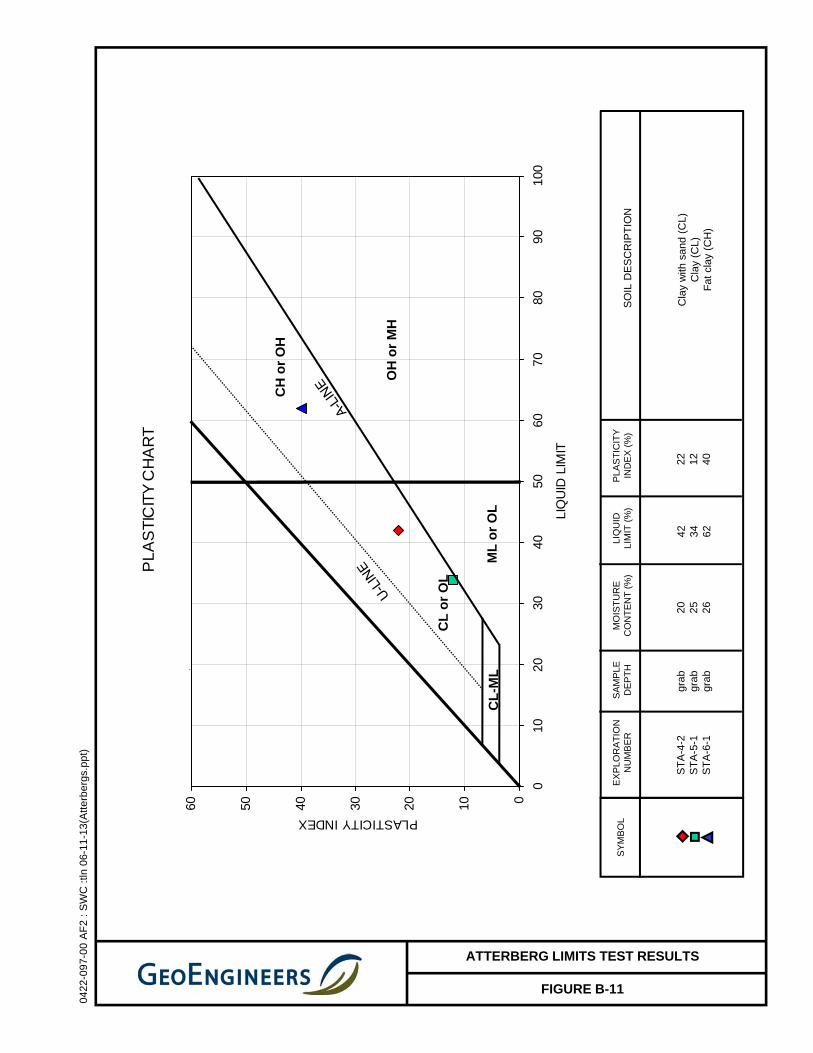
FIGURE B-11
ATTERBERG LIMITS TEST RESULTS
0422
-09
7-0
0 A
F2
: S
WC
:tln
06-
11-1
3(A
tter
ber
gs.p
pt)
EX
PLO
RA
TIO
NN
UM
BE
RS
OIL
DE
SC
RIP
TIO
NS
AM
PLE
DE
PT
HM
OIS
TU
RE
CO
NT
EN
T (
%)
LIQ
UID
LIM
IT (
%)
PLA
ST
ICIT
YIN
DE
X (
%)
ST
A-4
-2S
TA
-5-1
ST
A-6
-1
grab
grab
grab
20 25 26
42 34 62
22 12 40
Cla
y w
ith s
and
(CL)
Cla
y (C
L)F
at c
lay
(CH
)
SY
MB
OL
PL
AS
TIC
ITY
CH
AR
T
0102030405060
010
2030
4050
6070
8090
100
LIQ
UID
LIM
IT
PLASTICITY INDEX
CL
-ML
ML
or
OL
CL
or
OL
OH
or
MH
CH
or
OH

FIGURE B-12
ATTERBERG LIMITS TEST RESULTS
0422
-09
7-0
0 A
F2
: S
WC
:tln
06-
11-1
3(A
tter
ber
gs.p
pt)
EX
PLO
RA
TIO
NN
UM
BE
RS
OIL
DE
SC
RIP
TIO
NS
AM
PLE
DE
PT
HM
OIS
TU
RE
CO
NT
EN
T (
%)
LIQ
UID
LIM
IT (
%)
PLA
ST
ICIT
YIN
DE
X (
%)
ST
A-6
-2S
TA
-7-2
ST
A-7
-3
grab
grab
grab
22 26 32
41 42 59
20 19 37
Cla
y (C
L)C
lay
with
san
d (C
L)F
at c
lay
(CH
)
SY
MB
OL
PL
AS
TIC
ITY
CH
AR
T
0102030405060
010
2030
4050
6070
8090
100
LIQ
UID
LIM
IT
PLASTICITY INDEX
CL
-ML
ML
or
OL
CL
or
OL
OH
or
MH
CH
or
OH

FIGURE B-13
ATTERBERG LIMITS TEST RESULTS
0422
-09
7-0
0 A
F2
: S
WC
:tln
06-
11-1
3(A
tter
ber
gs.p
pt)
EX
PLO
RA
TIO
NN
UM
BE
RS
OIL
DE
SC
RIP
TIO
NS
AM
PLE
DE
PT
HM
OIS
TU
RE
CO
NT
EN
T (
%)
LIQ
UID
LIM
IT (
%)
PLA
ST
ICIT
YIN
DE
X (
%)
ST
A-8
-1S
TA
-8-2
grab
grab
25 4357 61
34 34F
at c
lay
(CH
)F
at c
lay
with
occ
asio
nal s
and
(CH
)
SY
MB
OL
PL
AS
TIC
ITY
CH
AR
T
0102030405060
010
2030
4050
6070
8090
100
LIQ
UID
LIM
IT
PLASTICITY INDEX
CL
-ML
ML
or
OL
CL
or
OL
OH
or
MH
CH
or
OH

FIGURE B-14
ATTERBERG LIMITS TEST RESULTS
0422
-09
7-0
0 A
F2
: S
WC
:tln
06-
11-1
3(A
tter
ber
gs.p
pt)
EX
PLO
RA
TIO
NN
UM
BE
RS
OIL
DE
SC
RIP
TIO
NS
AM
PLE
DE
PT
HM
OIS
TU
RE
CO
NT
EN
T (
%)
LIQ
UID
LIM
IT (
%)
PLA
ST
ICIT
YIN
DE
X (
%)
Bea
ch-1
Bea
ch-2
Bea
ch-3
grab
grab
grab
35 31 34
64 62 71
30 31 44
Gra
y fa
t si
lt (M
H)
Gra
y fa
t si
lt (M
H)
Gra
y fa
t cl
ay (
CH
)
SY
MB
OL
PL
AS
TIC
ITY
CH
AR
T
0102030405060
010
2030
4050
6070
8090
100
LIQ
UID
LIM
IT
PLASTICITY INDEX
CL
-ML
ML
or
OL
CL
or
OL
OH
or
MH
CH
or
OH

Sharepoint: 042209700\Analytical Data\Sieve Figures.ppt tln 06/07/13
Note: This report may not be reproduced, except in full, without written approval of GeoEngineers, Inc. Test results are applicable only to the specific sample on which they were performed, and should not be interpreted as representative of any other samples obtained at other times, depths or locations, or generated by separate operations or processes.
SANDSILT OR CLAYCOBBLES
GRAVEL
COARSE MEDIUM FINECOARSE FINE
U.S. STANDARD SIEVE SIZE
0
10
20
30
40
50
60
70
80
90
100
0.0010.010.11101001000
GRAIN SIZE IN MILLIMETERS
PE
RC
EN
T P
AS
SIN
G B
Y W
EIG
HT
3/8”3” 1.5” #4 #10 #20 #200#40 #60 #1003/4”
Sieve Analysis Results
Ledgewood Landslide EvaluationWhidbey Island, Washington
Figure B-15
SymbolExploration
NumberSample Depth
(feet) Soil Classification
♦ GEI-2 15.5Brown silty fine to medium sand and trace
gravel (SM)
■ GEI-2 25Gray-brown fine to coarse sand with gravel
and silt (SP-SM)
▲ GEI-2 45 Gray fine to medium sand with silt (SP-SM)

Sharepoint: 042209700\Analytical Data\Sieve Figures.ppt tln 06/07/13
Note: This report may not be reproduced, except in full, without written approval of GeoEngineers, Inc. Test results are applicable only to the specific sample on which they were performed, and should not be interpreted as representative of any other samples obtained at other times, depths or locations, or generated by separate operations or processes.
SANDSILT OR CLAYCOBBLES
GRAVEL
COARSE MEDIUM FINECOARSE FINE
U.S. STANDARD SIEVE SIZE
0
10
20
30
40
50
60
70
80
90
100
0.0010.010.11101001000
GRAIN SIZE IN MILLIMETERS
PE
RC
EN
T P
AS
SIN
G B
Y W
EIG
HT
3/8”3” 1.5” #4 #10 #20 #200#40 #60 #1003/4”
Sieve Analysis Results
Ledgewood Landslide EvaluationWhidbey Island, Washington
Figure B-16
SymbolExploration
NumberSample Depth
(feet) Soil Classification
♦ GEI-2 65Light brown silty fine to coarse sand with
occasional gravel (SM)
■ GEI-2 77.5 Brown silty fine to coarse sand with gravel (SM)
▲ GEI-2 85Gray-brown fine to coarse sand with
occasional gravel (SP-SM)

Sharepoint: 042209700\Analytical Data\Sieve Figures.ppt tln 06/07/13
Note: This report may not be reproduced, except in full, without written approval of GeoEngineers, Inc. Test results are applicable only to the specific sample on which they were performed, and should not be interpreted as representative of any other samples obtained at other times, depths or locations, or generated by separate operations or processes.
SANDSILT OR CLAYCOBBLES
GRAVEL
COARSE MEDIUM FINECOARSE FINE
U.S. STANDARD SIEVE SIZE
0
10
20
30
40
50
60
70
80
90
100
0.0010.010.11101001000
GRAIN SIZE IN MILLIMETERS
PE
RC
EN
T P
AS
SIN
G B
Y W
EIG
HT
3/8”3” 1.5” #4 #10 #20 #200#40 #60 #1003/4”
Sieve Analysis Results
Ledgewood Landslide EvaluationWhidbey Island, Washington
Figure B-17
SymbolExploration
NumberSample Depth
(feet) Soil Classification♦ GEI-3 7.5 Gray silty fine sand (SM)
■ GEI-3 22.5 Gray silt with trace clay (ML)
▲ GEI-3 67.5Gray clayey sand to silty sand with gravel
(SC/SM)

Sharepoint: 042209700\Analytical Data\Sieve Figures.ppt tln 06/07/13
Note: This report may not be reproduced, except in full, without written approval of GeoEngineers, Inc. Test results are applicable only to the specific sample on which they were performed, and should not be interpreted as representative of any other samples obtained at other times, depths or locations, or generated by separate operations or processes.
SANDSILT OR CLAYCOBBLES
GRAVEL
COARSE MEDIUM FINECOARSE FINE
U.S. STANDARD SIEVE SIZE
0
10
20
30
40
50
60
70
80
90
100
0.0010.010.11101001000
GRAIN SIZE IN MILLIMETERS
PE
RC
EN
T P
AS
SIN
G B
Y W
EIG
HT
3/8”3” 1.5” #4 #10 #20 #200#40 #60 #1003/4”
Sieve Analysis Results
Ledgewood Landslide EvaluationWhidbey Island, Washington
Figure B-18
SymbolExploration
NumberSample Depth
(feet) Soil Classification
♦ GEI-3 142.5Brown fine to coarse sand with silt and
occasional gravel (SP-SM)

Sharepoint: 042209700\Analytical Data\Sieve Figures.ppt tln 06/07/13
Note: This report may not be reproduced, except in full, without written approval of GeoEngineers, Inc. Test results are applicable only to the specific sample on which they were performed, and should not be interpreted as representative of any other samples obtained at other times, depths or locations, or generated by separate operations or processes.
SANDSILT OR CLAYCOBBLES
GRAVEL
COARSE MEDIUM FINECOARSE FINE
U.S. STANDARD SIEVE SIZE
0
10
20
30
40
50
60
70
80
90
100
0.0010.010.11101001000
GRAIN SIZE IN MILLIMETERS
PE
RC
EN
T P
AS
SIN
G B
Y W
EIG
HT
3/8”3” 1.5” #4 #10 #20 #200#40 #60 #1003/4”
Sieve Analysis Results
Ledgewood Landslide EvaluationWhidbey Island, Washington
Figure B-19
SymbolExploration
NumberSample Depth
(feet) Soil Classification
♦ GEI-4 20Gray silty fine to medium sand with
gravel (SM)
■ GEI-4 32.5 Gray silty fine to coarse sand with gravel (SM)
▲ GEI-4 50 Gray silty fine sand (SM)

Sharepoint: 042209700\Analytical Data\Sieve Figures.ppt tln 06/07/13
Note: This report may not be reproduced, except in full, without written approval of GeoEngineers, Inc. Test results are applicable only to the specific sample on which they were performed, and should not be interpreted as representative of any other samples obtained at other times, depths or locations, or generated by separate operations or processes.
SANDSILT OR CLAYCOBBLES
GRAVEL
COARSE MEDIUM FINECOARSE FINE
U.S. STANDARD SIEVE SIZE
0
10
20
30
40
50
60
70
80
90
100
0.0010.010.11101001000
GRAIN SIZE IN MILLIMETERS
PE
RC
EN
T P
AS
SIN
G B
Y W
EIG
HT
3/8”3” 1.5” #4 #10 #20 #200#40 #60 #1003/4”
Sieve Analysis Results
Ledgewood Landslide EvaluationWhidbey Island, Washington
Figure B-20
SymbolExploration
NumberSample Depth
(feet) Soil Classification
♦ GEI-6 145Brown fine to medium sand with occasional
fine gravel (SP)

Sharepoint: 042209700\Analytical Data\Sieve Figures.ppt tln 06/07/13
Note: This report may not be reproduced, except in full, without written approval of GeoEngineers, Inc. Test results are applicable only to the specific sample on which they were performed, and should not be interpreted as representative of any other samples obtained at other times, depths or locations, or generated by separate operations or processes.
SANDSILT OR CLAYCOBBLES
GRAVEL
COARSE MEDIUM FINECOARSE FINE
U.S. STANDARD SIEVE SIZE
0
10
20
30
40
50
60
70
80
90
100
0.0010.010.11101001000
GRAIN SIZE IN MILLIMETERS
PE
RC
EN
T P
AS
SIN
G B
Y W
EIG
HT
3/8”3” 1.5” #4 #10 #20 #200#40 #60 #1003/4”
Sieve Analysis Results
Ledgewood Landslide EvaluationWhidbey Island, Washington
Figure B-21
SymbolExploration
NumberSample Depth
(feet) Soil Classification
♦ GEI-7 10Light brown silty fine to coarse sand with
gravel (SM)
■ GEI-7 30 Gray-brown silty fine gravel with sand (GM)
▲ GEI-7 50Gray-brown fine to medium sand with silt and
occasional gravel (SP-SM)

Sharepoint: 042209700\Analytical Data\Sieve Figures.ppt tln 06/07/13
Note: This report may not be reproduced, except in full, without written approval of GeoEngineers, Inc. Test results are applicable only to the specific sample on which they were performed, and should not be interpreted as representative of any other samples obtained at other times, depths or locations, or generated by separate operations or processes.
SANDSILT OR CLAYCOBBLES
GRAVEL
COARSE MEDIUM FINECOARSE FINE
U.S. STANDARD SIEVE SIZE
0
10
20
30
40
50
60
70
80
90
100
0.0010.010.11101001000
GRAIN SIZE IN MILLIMETERS
PE
RC
EN
T P
AS
SIN
G B
Y W
EIG
HT
3/8”3” 1.5” #4 #10 #20 #200#40 #60 #1003/4”
Sieve Analysis Results
Ledgewood Landslide EvaluationWhidbey Island, Washington
Figure B-22
SymbolExploration
NumberSample Depth
(feet) Soil Classification
♦ GEI-7 65Gray-brown to gray fine to medium sand with
silt and occasional gravel (SP-SM)
■ GEI-7 85 Olive-gray fine sand with trace silt (SP)

Sharepoint: 042209700\Analytical Data\Sieve Figures.ppt tln 06/07/13
Note: This report may not be reproduced, except in full, without written approval of GeoEngineers, Inc. Test results are applicable only to the specific sample on which they were performed, and should not be interpreted as representative of any other samples obtained at other times, depths or locations, or generated by separate operations or processes.
SANDSILT OR CLAYCOBBLES
GRAVEL
COARSE MEDIUM FINECOARSE FINE
U.S. STANDARD SIEVE SIZE
0
10
20
30
40
50
60
70
80
90
100
0.0010.010.11101001000
GRAIN SIZE IN MILLIMETERS
PE
RC
EN
T P
AS
SIN
G B
Y W
EIG
HT
3/8”3” 1.5” #4 #10 #20 #200#40 #60 #1003/4”
Sieve Analysis Results
Ledgewood Landslide EvaluationWhidbey Island, Washington
Figure B-23
SymbolExploration
NumberSample Depth
(feet) Soil Classification
♦ GEI-8 10Gray-brown silty fine to coarse sand with
occasional gravel (SM)
■ GEI-8 25 Gray silty fine to coarse sand with gravel (SM)
▲ GEI-8 100Gray-brown silty fine to medium sand with
occasional gravel (SM)

Sharepoint: 042209700\Analytical Data\Sieve Figures.ppt tln 06/07/13
Note: This report may not be reproduced, except in full, without written approval of GeoEngineers, Inc. Test results are applicable only to the specific sample on which they were performed, and should not be interpreted as representative of any other samples obtained at other times, depths or locations, or generated by separate operations or processes.
SANDSILT OR CLAYCOBBLES
GRAVEL
COARSE MEDIUM FINECOARSE FINE
U.S. STANDARD SIEVE SIZE
0
10
20
30
40
50
60
70
80
90
100
0.0010.010.11101001000
GRAIN SIZE IN MILLIMETERS
PE
RC
EN
T P
AS
SIN
G B
Y W
EIG
HT
3/8”3” 1.5” #4 #10 #20 #200#40 #60 #1003/4”
Sieve Analysis Results
Ledgewood Landslide EvaluationWhidbey Island, Washington
Figure B-24
SymbolExploration
NumberSample Depth
(feet) Soil Classification
♦ GEI-8 105Gray-brown to gray silty fine to coarse sand
with occasional gravel (SM)■ GEI-8 120 Gray fine to medium sand with silt (SP-SM)
APPENDIX C Field Instrumentation

LEDGEWOOD LANDSLIDE EVALUATION Whidbey Island, Washington
November 27, 2013 | Page C-1 File No. 0422-097-00
APPENDIX C FIELD INSTRUMENTATION
Vibrating Wire Piezometer Installation
Vibrating wire piezometers (VWP) were installed in all of our borings except for GEI-5. Two to four VWPs were installed in each boring to monitor the hydrostatic pressures within the soils. The VWPs were located at depths where wetter soils were encountered during drilling of the borings or at levels of interest to the evaluation.
A VWP is an instrument that is placed at a selected depth in a borehole and is capable of sensing pressure by means of a diaphragm attached to a vibrating wire. Changes in pressure at the diaphragm change the vibrating wire tension and associated vibration frequency which is measured by an electromagnetic coil. The frequency is monitored and related to the pressure. Wires leading from the VWP are located such that a data logging device can record the data and calculated pressure.
TABLE C-1 – VIBRATING WIRE PIEZOMETER INSTALLATION SUMMARY
Boring No.
Depth bgs (ft)
Elevation (ft) Datalogger (part#/serial#)
ID
GEI-1
34 195
52614000/ 42400
1300384
67 162 12-7921
153 76 1300377
254 -25 1300378
GEI-2 95 -16 52614000/
42573
12-9813
130 -51 1300879
GEI-3 45 15 52614000/
42590
1300325
117.5 -57.5 1300916
GEI-4 52.5 27.5 41658/
41657
1300324
67.5 12.5 1300918
GEI-6
45 180 VW Quatro logger/ 52614000/ 42589
1300920
110 115 1300935
225 0 1301200
GEI-7
50 141.5 VW Quatro logger/ 52614000/ 42586
1300917
110 81.5 1301201
210* -18.5 1301202
GEI-8
50 147.5 VW Quatro logger/ 52614000/ 42588
1300919
100 97.5 1300934
150 47.5 1300933
* Not functioning properly after first data download.

LEDGEWOOD LANDSLIDE EVALUATION Whidbey Island, Washington
Page C-2 | November 27, 2013 | GeoEngineers, Inc. File No. 0422-097-00
At the time of this report, insufficient data had been collected to provide a meaningful evaluation of seasonal groundwater fluctuation in the piezometers. Future reporting will include tables or figures presenting the data collected. We recommend that the VWPs be monitored quarterly.
Slope Inclinometer Installation
Three slope inclinometer casings were installed to monitor deformations and to provide indications of slope movement. Slope inclinometers provide a nearly continuous profile of ground deformation as function of depth and are a tool for measuring displacements and determining their cause should they occur. Slope inclinometer casings were installed in boreholes GEI-2, GEI-3 and GEI-4. Within a few days of installation a transversing probe is lowered and raised in the casing to establish a baseline profile that each subsequent test is measured against. Additional recordings were obtained between August and November; the data showed small movements that may be associated with seating of the grout and/or equilibration of stress conditions since they are located either in the slide or near the margins of the slide. Plots of the displacement readings completed to date are included in Figures C-1 through C-3.
A fourth boring (GEI-5) included installation of a “poor boy” inclinometer, which is an inexpensive PVC casing used to determine if an active shear plane has developed sufficient displacement to kink or offset the casing. A steel rod is lowered down the PVC casing and depths at which the rod has difficulty passing or cannot pass indicate movement has occurred since installation. This casing is also available to directly measure groundwater levels.

Figure C-1
Inclinometer Readings GEI-2
Ledgewood Landslide EvaluationWhidbey Island, Washington
SharePoint: 004220970/Working/Report Figures/Appendix C Figures.ppt SWC:tln 10-10-13

Figure C-2
Inclinometer Readings GEI-3
Ledgewood Landslide EvaluationWhidbey Island, Washington
SharePoint: 004220970/Working/Report Figures/Appendix C Figures.ppt SWC:tln 10-10-13

Figure C-3
Inclinometer Readings GEI-4
Ledgewood Landslide EvaluationWhidbey Island, Washington
SharePoint: 004220970/Working/Report Figures/Appendix C Figures.ppt SWC:tln 10-10-13

APPENDIX D LiDAR Data

LEDGEWOOD LANDSLIDE EVALUATION Whidbey Island, Washington
November 27, 2013 | Page D-1 File No. 0422-097-00
APPENDIX D LIDAR DATA
Light Detection and Ranging (LiDAR) mapping is conducted by emitting laser light from an aircraft and measuring the time it takes for that light to reflect off of surfaces and return to the aircraft. Computations are made to separate “first return” signals from “second return” signals, which, in turn, differentiates canopy/vegetation from the ground surface, respectively. The resulting surface topography can be viewed as a hillshade image and to develop topographic relief maps.
In the days following the March 27, 2013 landslide a firm flew the landslide area and sold the data to ICPW. As part of the additional study and funding made available in June 2013 GeoEngineers subcontracted another round of LiDAR to Watershed Sciences Incorporated (WSI). Their report is included in this appendix and data files have been provided to ICPW.

Driftwood Way LiDAR Survey
Ledgewood-Bonair Landslide 2013 Technical Data Report
Prepared by:
WSI Portland Office
421 SW 6th Ave., Ste. 800
Portland, OR 97204
PH: 503-505-5100
FX: 503-546-6801
June 28, 2013
Prepared for:
GeoEngineers
600 Dupont St.
Bellingham, WA 98225
PH: 360-647-1510

Driftwood Way LiDAR Survey - June 28, 2013
Table of Contents
INTRODUCTION............................................................................................................................................................... 1
Overview ......................................................................................................................................................................... 1
ACQUISITION ................................................................................................................................................................... 3
Planning ......................................................................................................................................................................... 3
Ground Survey ............................................................................................................................................................ 3
Monumentation ....................................................................................................................................................... 3
Ground Truthing ..................................................................................................................................................... 5
Airborne Survey.......................................................................................................................................................... 7
LiDAR Survey .......................................................................................................................................................... 7
PROCESSING ................................................................................................................................................................... 9
LiDAR Data Processing ........................................................................................................................................... 9
Calibration................................................................................................................................................................. 9
DELIVERABLES ............................................................................................................................................................. 11
Delivered Data ............................................................................................................................................................ 11
LiDAR Point Data .................................................................................................................................................. 11
Vectors ...................................................................................................................................................................... 11
RESULTS/DISCUSSION ............................................................................................................................................. 12
LiDAR Accuracy Assessment ............................................................................................................................. 12
LiDAR Vertical Accuracy .................................................................................................................................. 12
LiDAR Relative Accuracy ................................................................................................................................. 14
LiDAR Density ....................................................................................................................................................... 15
Certifications .................................................................................................................................................................. 16

www.wsidata.com Page | 1
Driftwood Way LiDAR Survey – June 28, 2013
WSI is pleased to report that data collection, processing, and reporting are complete for the Driftwood Way LiDAR
Survey. Data specifications and processing methodology, as well as schedules, and resolution and accuracy statistics
are presented within.
Overview
In the early morning of March 27, 2013, the Ledgewood-Bonair landside caused
damage hundreds of feet wide in the Ledgewood Beach Community on
Whidbey Island in the state of Washington. Thirty-five homes were evacuated
when the slide occurred and 20 homes either had structural damage or loss of
property. The slide was a small portion of a 1.5 mile landslide complex.
On March 30, 2013, the Corvallis branch of Watershed Sciences, Inc (WSI),
collected LiDAR and 4-band digital imagery of the landslide site. The data was
collected to assess the impact of the landslide and to help guide mitigation
efforts.
Three months later, on June 22, 2013, the Portland branch of WSI collected
LiDAR over the same area to assist with landslide monitoring.
INTRODUCTION
1. INTRODUCTION
Aerial view of the
Ledgewood-Bonair
landslide
Projection:
WA State Plane North
Horiztonal Datum:
North American Datum of
1983 (NAD83) 2011
Vertical Datum:
North American Vertical
Datum 1988 (NAVD88),
GEOID 03
Units:
US Survey Feet

www.wsidata.com Page | 2
Driftwood Way LiDAR Survey – June 28, 2013
Overview map of Driftwood Way study area

www.wsidata.com Page | 3
Driftwood Way LiDAR Survey – June 28, 2013
Planning
Flightlines were developed using ALTM-NAV Planner (v.3.0) software. Careful planning
of the pulse rate, flight altitude, and ground speed ensured that data quality and
coverage conditions (eight pulses per square meter) were met while optimizing flight
paths for minimal flight times.
The mission planning conducted at WSI was designed to optimize flight efficiency while
meeting or exceeding project accuracy and resolution specifications. In this process,
known factors were prepared for, such as GPS constellation availability, photography
and acquisition windows, and resource allocation. In addition, a variety of logistical
barriers were anticipated, namely private property access, and acquisition personnel
logistics. Finally, weather hazards and conditions affecting flight were continuously
monitored due to their impact on the daily success of airborne and ground operations.
Ground Survey Monumentation
Ground data were collected, which includes establishing and occupying survey control,
collecting static positional data, collecting ground check points (GCPs) using GPS real-
time kinematic (RTK) survey with a roving radio relayed unit, and installing air targets.
ACQUISITION
Trimble R7 GNSS base
station set up over
monument WA_EST_05.

www.wsidata.com Page | 4
Driftwood Way LiDAR Survey – June 28, 2013
Using the High Accuracy Reference Network (HARN) and the Continuous
Operation Reference System (CORS), WSI tied to a network of points with
orthometric heights determined by differential leveling. Where available,
First Order National Geodetic Survey (NGS) published monuments with
NAVD88 are used. In the absence of NGS benchmarks, WSI produces our
own monuments. Every effort is made to keep monuments established by
WSI within the public right of way or on public lands. If monuments are
required on private property, consent from the owner is required. All
monumentation is done with 5/8” x 30” rebar topped with a two-inch
diameter aluminum cap stamped “Watershed Sciences, Inc.”
WSI owns and operates multiple sets of Trimble GPS and Global Navigation
Satellite System (GNSS1) dual-frequency L1-L2 receivers, which were used in
both static and RTK surveys (listed in the table below).
During each LiDAR mission, a ground-based technician was deployed,
outfitted with two Trimble Base Stations (R7) and one RTK Rover (R8).
Ground Survey Equipment Specifications
Receiver Model
Antenna OPUS Antenna ID Use
Trimble R7 GNSS
Zephyr GNSS Geodetic Model 2 TRM55972.00 Static
Trimble R8 Integrated Antenna R8
Model 2 TRM_R8_Model2
Static & RTK
1 GNSS consists of the U.S. GPS constellation and Soviet GLONASS constellation.
Monument Accuracy FGDC-STD-007.2-1998 Rating
St Dev Northing, Easting 0.050 m
St Dev Z 0.050 m
Below: Monument cap Whidbey_01
Monument Accuracy

www.wsidata.com Page | 5
Driftwood Way LiDAR Survey – June 28, 2013
Final Monument Positions
All static control points were observed for a minimum of one two-
hour session and one four-hour session. At the beginning of every
session the tripod and antenna were reset, resulting in two
independent instrument heights and data files. Fixed height
tripods were used when available. Data were collected at a
recording frequency of one hertz using a 10 degree mask on the
antenna.
GPS data was uploaded to WSI servers for WSI PLS QA/QC and
oversight. OPUS processing triangulated the monument position
using three CORS stations resulting in a fully adjusted position.
After multiple sessions of data collection at each monument,
accuracy was calculated. Blue Marble Geographics Calculator 2013
software was used to convert the geodetic positions from the
OPUS reports. A total of two control monuments were surveyed
for this project. Upon completion of the project, a total network
adjustment was performed. The final monument positions are
presented in the table below.
Ground Truthing
In order to help georeference the LiDAR data, ground truthing is used to calibrate each individual LiDAR mission.
During or within a short time-span from LiDAR acquisition, ground check points (GCP) are collected on minimally
sloped bare-earth hard surfaces (e.g., paved roads, parking areas, stable hard-packed gravel/dirt) and away from
sudden terrain breaks and highly reflective surfaces (e.g., road markings) in the study area. In order to obtain
statistical viability, ground data from each control monument are gathered in clusters of at least 25 points. More
emphasis is placed on high dispersal of ground data than quantity. Ability to achieve ideal ground survey scenarios is
dependent upon ground access, GPS precisions, and time constraints.
Final Monument Positions
PID Latitude Longitude Ellipsoid
WA_EST_05 48 12 22.70280 -122 28 29.73340 -18.758
Whidbey_01 48 08 41.75811 -122 35 36.08003 75.830
Map of Driftwood Way Control and RTK

www.wsidata.com Page | 6
Driftwood Way LiDAR Survey – June 28, 2013
Ground Survey Methods
Real-Time Kinematic (RTK): A Trimble R7 base receiver is set upon a ground
control point in order to log static GPS data and pinpoint the position of the
monument. During this static session, a kinematic correction is broadcast to a
roving R8 GPS unit, which allows for precise location measurements ( 2.0 cm). All
ground points are observed with a positional dilution of precision (PDOP) of less
than 3.0 while tracking at least six common satellites between the base and roving
receiver. In acquiring this ground data, the collector records a stationary minimum
five-second observation, and then calculates the pseudo-range position from three
one-second epochs with a relative error of less than 1.5 cm horizontal and 2.0 cm
vertical.
Specifications for Ground Level Data Collection
Survey Control Monuments Ground Check Points (GCPs)
Accuracy
RMSEXY ≤ 1.5 cm (0.6 in) RMSEXYZ ≤ 1.5 cm (0.6 in)
RMSEZ ≤ 2.0 cm (0.8 in) (Deviation from monument coordinates)
Resolution
Spacing of at least one mile ≥50 GCP per surveyed monument
Minimum independent occupation of 4 hrs & 2 hrs
184 points total
Equipment Trimble R7 Trimble R7
R8 GNSS R8 GNSS
A WSI ground professional collects true
ground points with a roving R8 unit.

www.wsidata.com Page | 7
Driftwood Way LiDAR Survey – June 28, 2013
AGL
900 m
FOV
24°
Airborne Survey
Data acquisition was conducted between 10:00 AM and 10:30 AM on June 22, 2013. The table below is a
summary of airborne acquisition for the Driftwood Way study area.
LiDAR Survey
The LiDAR survey utilized a Leica ALS50 sensor mounted in
a Partenavia P.68. The system was set to acquire ≥150,000
laser pulses per second and flown at 900 meters above
ground level (AGL), capturing a scan angle of +/- 12 degrees
from nadir. The LiDAR system settings and flight parameters
were designed to yield high-resolution data of ≥8 pulses per
square meter over terrestrial surfaces. To solve for laser
point position, an accurate description of aircraft position
and attitude is vital. Aircraft position is described as x, y,
and z and was measured twice per second (two hertz) by an
onboard differential GPS unit. Aircraft attitude is described as
pitch, roll, and yaw (heading) and was measured 200 times per
second (200 hertz) from an onboard inertial measurement unit
(IMU).
The LiDAR sensor operators constantly monitored the data
collection settings during acquisition of the data, including pulse
rate, power setting, scan rate, gain, field of view, and pulse mode.
During the flight, the crew performed airborne calibration
maneuvers designed to improve the calibration results during the
data processing stage. They were also in constant
communication with the ground crew to ensure proper ground
GPS coverage for data quality. The LiDAR coverage was
completed with no data gaps or voids, barring non-reflective
surfaces (e.g., open water, wet asphalt). All necessary measures
were taken to acquire data under conditions (e.g., minimum cloud
decks) and in a manner (e.g., adherence to flight plans) that
prevented the possibility of data gaps. Moreover, terrain
following to maintain consistent aircraft altitudes eliminated the
potential for data gaps related to both acquisition and laser
Data Collected Equipment Date Range Aircraft Elevation
LiDAR Leica ALS50 6/22/2013 Partenavia P.68 900 m
Flightlines for Driftwood Way

www.wsidata.com Page | 8
Driftwood Way LiDAR Survey – June 28, 2013
The LiDAR system settings
and flight parameters were
designed to yield high-
resolution data of greater
than eight pulses per square
meter.
shadowing of targets. All WSI LIDAR systems are calibrated per the
manufacturer and our own specifications, and tested by WSI for internal
consistency for every mission using proprietary methods.
Weather conditions were constantly assessed in flight, as adverse
conditions not only affect data quality, but can prove unsafe for flying.
The study area was surveyed with opposing flight line side-lap of ≥60%
(≥100% overlap) to reduce laser shadowing and increase surface laser
painting. The system allows up to four range measurements per pulse,
and all discernible laser returns were processed for the output dataset.
Driftwood Way LiDAR Survey Specifications
Sensor Leica ALS50
Aircraft Partenavia P.68
Survey Altitude 900 m AGL
Pulse Mode Single
Mirror Scan Rate 58.2 Hz
Field of View 24°
Percent Side-lap 60%
Resolution/Density 10 pulses/m²
Targeted Swath Width 380 m
GPS Baselines ≤13 nm
GPS PDOP ≤3.0
GPS Satellite Constellation ≥6
Leica sensor (below) mounted in the Partenavia (above)

www.wsidata.com Page | 9
Driftwood Way LiDAR Survey – June 28, 2013
This section describes the processing methodologies for all data acquired by WSI for the Driftwood Way
project. All of our methodologies and deliverables are compliant with federal and industry specifications and
guidelines (USGS v.13, FGDC NSSDA, and ASPRS).
LiDAR Data Processing
Calibration
Once the LiDAR data arrived to the Portland office, WSI employed a suite of techniques to calibrate it.
Processing tasks included: GPS, kinematic corrections, calculation of laser point position, relative accuracy
testing and calibrations, classification of ground and non-ground points, and assessments of statistical absolute
accuracy. For more detailed descriptions of these steps, please see the processing workflow table below.
LiDAR Survey Point Classification
Classification Name
Classification Description
1 Default/Unclassified Laser returns that are not included in the ground class and not dismissed as Noise or Withheld points.
2 Ground Ground that is determined by a number of automated and manual cleaning algorithms to determine the best ground model the data can support.
7 Noise Laser returns that are often associated with birds or artificial points below the ground surface.
11 Withheld Laser returns that have intensity values of 0 or 255.
PROCESSING
LiDAR point cloud
of the Ledgewood–
Bonair landslide.

www.wsidata.com Page | 10
Driftwood Way LiDAR Survey – June 28, 2013
The general workflow for calibration of the LiDAR data was as follows:
Processing Step Software Used
Resolve GPS kinematic corrections for aircraft position data using kinematic aircraft GPS (Collected at two hertz) and static ground GPS (one hertz) data collected over geodetic controls.
IPAS TC v. 3.2, Trimble Business Center v. 3.00
Develop a smoothed best estimate of trajectory (SBET) file that blends post-processed aircraft position with attitude data. Sensor heading, position, and attitude are calculated throughout the survey.
IPAS TC v. 3.2
Calculate laser point position by associating SBET information to each laser point return time, with offsets relative to scan angle, intensity, etc. included. This process creates the raw laser point cloud data for the entire survey in *.las (ASPRS v1.2) format, in which each point maintains the corresponding scan angle, return number (echo), intensity, and x, y, z information. These data are converted to orthometric elevation (NAVD88) by applying a Geoid 12A correction.
Leica ALSPP 2.75 Build #9
Import raw laser points into subset bins (less than 500 MB, to accommodate file size constraints in processing software). Filter for noise and perform manual relative accuracy calibration. Ground points are then classified for individual flight lines to be used for relative accuracy testing and calibration.
TerraScan v. 13, Custom WSI software
Test relative accuracy using ground classified points per each flight line. Perform automated line-to-line calibrations for system attitude parameters (pitch, roll, heading), mirror flex (scale) and GPS/IMU drift. Calibrations are performed on ground classified points from paired flight lines. Every flight line is used for relative accuracy calibration.
TerraMatch v. 13, TerraScan v. 13, Custom WSI software
Assess fundamental vertical accuracy via direct comparisons of ground classified points to ground RTK survey data.
TerraScan v. 13
Assign headers (e.g., projection information, variable length record, project name, GEOTIFF tags) to *.las files.
Las Monkey v. 1.4.6

www.wsidata.com Page | 11
Driftwood Way LiDAR Survey – June 28, 2013
WSI strives to provide the most comprehensive and user-
friendly deliverable products possible. Deliverables can be
categorized according to LiDAR and vectors.
This section describes all specifications and deliverable
formats that are required by PG&E for the Driftwood Way
LiDAR Survey. WSI is committed to meeting or exceeding
all data specifications at all times. Deliverables are
designed to provide GeoEngineers with the most accurate
and useful information possible.
Delivered Data
LiDAR Point Data
LiDAR points (LAS 1.2) have been classified as ground or default with the following attributes: number, XYZ, intensity (8-
bit), return number, classification, GPS time, and scan angle.
Vectors
Delivered vectors include: total area flown (TAF), tiling delineation, and smoothed best estimate of trajectory (SBET) in
ESRI *.shp format.
DELIVERABLES
Orthophoto of
dwellings adjacent
to the Eel River.
Calibrated LiDAR point data
Vectors
o Study area
o Tiling Delineation
o SBET
Technical Data Report
Aerial view of the
Ledgewood – Bonair
landslide.
Driftwood Data Products
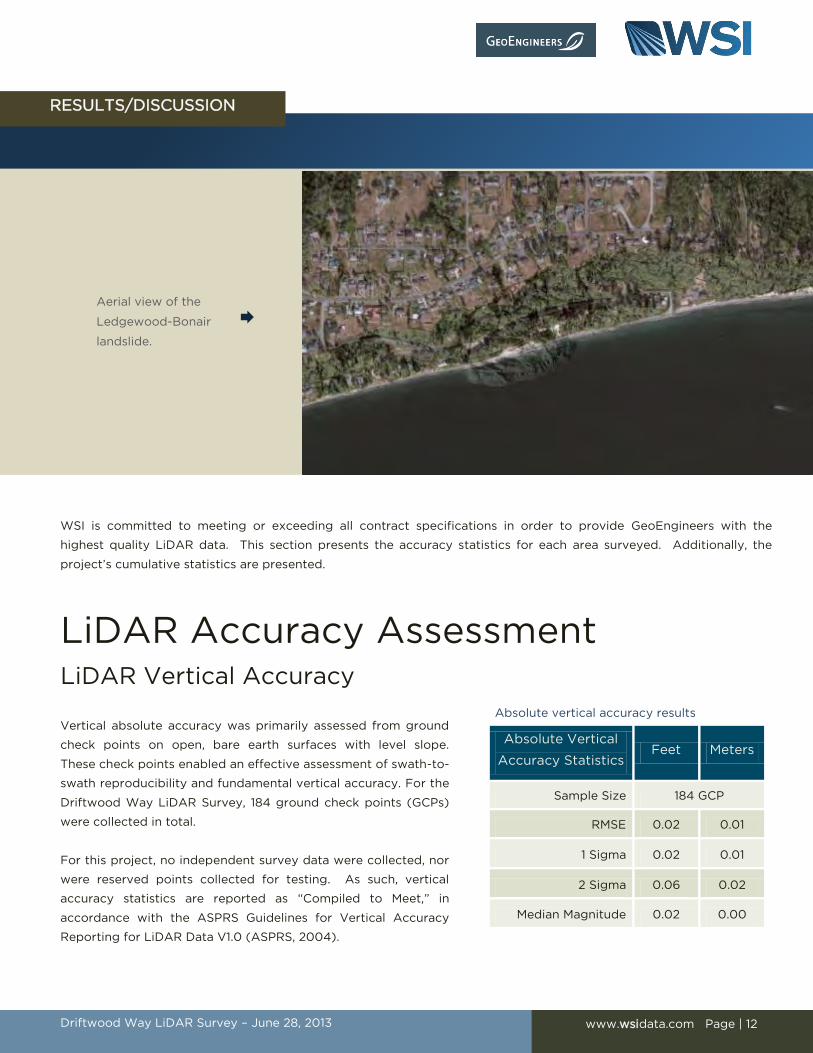
www.wsidata.com Page | 12
Driftwood Way LiDAR Survey – June 28, 2013
WSI is committed to meeting or exceeding all contract specifications in order to provide GeoEngineers with the
highest quality LiDAR data. This section presents the accuracy statistics for each area surveyed. Additionally, the
project’s cumulative statistics are presented.
LiDAR Accuracy Assessment LiDAR Vertical Accuracy
Vertical absolute accuracy was primarily assessed from ground
check points on open, bare earth surfaces with level slope.
These check points enabled an effective assessment of swath-to-
swath reproducibility and fundamental vertical accuracy. For the
Driftwood Way LiDAR Survey, 184 ground check points (GCPs)
were collected in total.
For this project, no independent survey data were collected, nor
were reserved points collected for testing. As such, vertical
accuracy statistics are reported as “Compiled to Meet,” in
accordance with the ASPRS Guidelines for Vertical Accuracy
Reporting for LiDAR Data V1.0 (ASPRS, 2004).
Absolute vertical accuracy results
Absolute Vertical
Accuracy Statistics Feet Meters
Sample Size 184 GCP
RMSE 0.02 0.01
1 Sigma 0.02 0.01
2 Sigma 0.06 0.02
Median Magnitude 0.02 0.00
RESULTS/DISCUSSION
Aerial view of the
Ledgewood-Bonair
landslide.

www.wsidata.com Page | 13
Driftwood Way LiDAR Survey – June 28, 2013
Absolute deviation of laser point to RTK point for Driftwood Way LiDAR survey
Deviation of absolute vertical accuracy for Driftwood Way LiDAR survey
0%
10%
20%
30%
40%
50%
60%
70%
80%
90%
100%
0%
5%
10%
15%
20%
25%
30%
35%
40%
-0.06 -0.04 -0.02 0.00 0.02 0.04 0.06 0.08 0.10
Cu
mu
lati
ve D
istr
ibu
tio
n
Dis
trib
uti
on
Deviation ~ Laser Point to Nearest Ground Survey Point (Feet)
-0.08 -0.06 -0.04 -0.02 0.00 0.02 0.04 0.06 0.08 0.10
Vertical Acccuracy Assessment
0.00
0.01
0.02
0.03
0.04
0.05
0.06
0.07
0.08
0.09
0 50
100
150
Ab
so
lute
E
rro
r (
Feet)
Ground Survey Point
Absolute Vertical Error:Laser point to RTK Survey Point Deviation
Absolute Error
RMSE
1 Sigma
2 Sigma
www.wsidata.com Page | 14
Driftwood Way LiDAR Survey – June 28, 2013
LiDAR Relative Accuracy
Relative accuracy refers to the internal consistency
of the data set and is measured as the divergence
between points from different flightlines within an
overlapping area. Divergence is most apparent
when flightlines are opposing. When the LiDAR
system is well calibrated, the line-to-line divergence
is low (<10 cm). Internal consistency is affected by
system attitude offsets (pitch, roll, and heading),
mirror flex (scale), and GPS/IMU drift.
Relative accuracy statistics are based on the
comparison of 13 flightlines and over 25 million
points. Relative accuracy is reported for the entire
study area.
Relative Accuracy
Statistics Feet Meters
Average 0.113 0.034
Median 0.109 0.033
1 Sigma 0.112 0.034
2 Sigma 0.141 0.043
Survey Points: 25,433,213
Flightlines: 13
Relative accuracy distribution for Driftwood Way LiDAR survey
Relative accuracy results
0%
10%
20%
30%
40%
50%
60%
70%
0.020 0.040 0.060 0.080 0.100 0.120 0.140 0.160 0.180
Re
lati
ve
Ac
cu
rac
y D
istr
ibu
tio
n
Relative Accuracy (ft)Total Compared Points (n = 25,433,213)
0 0.02 0.04 0.06 0.08 0.10 0.12 0.14 0.16
Relative Accuracy Assessment

www.wsidata.com Page | 15
Driftwood Way LiDAR Survey – June 28, 2013
LiDAR Density
The native pulse density is the number of pulses emitted by the LiDAR system. The pulse density resolution
specification for the Driftwood Way survey area is a minimum mean of eight pulses per square meter (ppsm);
WSI achieved 9.97 ppsm. Some types of surfaces (e.g., dense
vegetation, water) may return fewer pulses than the laser
originally emitted. Therefore, the delivered density can be less
than the native density and vary according to terrain, land
cover, and water bodies.
Density histograms have been calculated based on first return
laser point density and ground-classified laser point density.
Ground
Density
(points/ ) (points/ )
0.12 1.28
Pulse
Density
(pulses/ ) (pulses/ )
0.93 9.97
0%
10%
20%
30%
40%
50%
60%
0-0.05 0.05-0.1 0.1-0.15 0.15-0.2 0.2-0.25
Pe
rc
en
t D
istr
ibu
tio
n
Ground Points per Square Foot
Average Ground Point Density
0 0.05 0.10 0.15 0.20 0.25
0%
10%
20%
30%
0-0.2 0.2-0.4 0.4-0.6 0.6-0.8 0.8-1.0 1.0-1.2 1.2-1.4
Pe
rc
en
t D
istr
ibu
tio
n
Pulses per Square Foot
Average Pulse Density
0 0.2 0.4 0.6 0.8 1.0 1.2 1.4

www.wsidata.com Page | 16
CERTIFICATIONS
Watershed Sciences provided LiDAR services for the Whidbey Island study area as described in this
report.
I, Matthew Boyd, have reviewed the attached report for completeness and hereby state that it is a
complete and accurate report of this project.
______________________________________________
Mathew Boyd
Principal
WSI
I, Christopher W. Yotter-Brown, being first dully sworn, say that as described in the Ground Survey
subsection of the Acquisition section of this report was completed by me or under my direct
supervision and was completed using commonly accepted standard practices. Accuracy statistics
shown in the Accuracy Section have been reviewed by me to meet National Standard for Spatial Data
Accuracy.

PG&E Macumber Dam LiDAR & Imagery Survey May 3, 2013
www.wsidata.com
POINT OF CONTACT
Thank You
WSI Portland Office
421 SW 6th Ave., Ste. 800
Portland, OR 97204
PH: 503-505-5100
FX: 503-546-6801
Susan Jackson
Chief Marketing Officer
Oakland, CA
PH: 510-910-8669

APPENDIX E Slope Stability Analysis

LEDGEWOOD LANDSLIDE EVALUATION Whidbey Island, Washington
November 27, 2013 | Page E-1 File No. 0422-097-00
APPENDIX E SLOPE STABILITY ANALYSIS
Slope stability analyses were completed using the Morgenstern-Price method and the computer program Slope\W Version 8.0.10.6504, developed by Geo-Slope International. The phreatic surface was inserted based on the regional groundwater elevation from our interpretation of available VWP data, previous data obtained at the site, and experience. For a more detailed description and interpretation of the analysis see the report text. The results of our slope stability modeling are presented in Figures D-1 through D-8.

Figure E-1
Slope Stability Section E Stage-1
Ledgewood Landslide EvaluationWhidbey Island, Washington
SharePoint: 004220970/Working/Report Figures/Island County Slope Stability Figures.ppt SWC:tln 10-10-13
Reference: GEO-SLOPE International, Ltd., GeoStudio 2012 Version 8.0.10.6504

Figure E-2
Slope Stability Section E Stage-2
Ledgewood Landslide EvaluationWhidbey Island, Washington
SharePoint: 004220970/Working/Report Figures/Island County Slope Stability Figures.ppt SWC:tln 10-10-13
Reference: GEO-SLOPE International, Ltd., GeoStudio 2012 Version 8.0.10.6504

Figure E-3
Slope Stability Section E Stage-3
Ledgewood Landslide EvaluationWhidbey Island, Washington
SharePoint: 004220970/Working/Report Figures/Island County Slope Stability Figures.ppt SWC:tln 10-10-13
Reference: GEO-SLOPE International, Ltd., GeoStudio 2012 Version 8.0.10.6504

Figure E-4
Slope Stability Section E Deep
Ledgewood Landslide EvaluationWhidbey Island, Washington
SharePoint: 004220970/Working/Report Figures/Island County Slope Stability Figures.ppt SWC:tln 10-10-13
Reference: GEO-SLOPE International, Ltd., GeoStudio 2012 Version 8.0.10.6504

Figure E-5
Slope Stability Section C
Ledgewood Landslide EvaluationWhidbey Island, Washington
SharePoint: 004220970/Working/Report Figures/Island County Slope Stability Figures.ppt SWC:tln 10-10-13
Reference: GEO-SLOPE International, Ltd., GeoStudio 2012 Version 8.0.10.6504

Figure E-6
Slope Stability Section C Low Residual
Ledgewood Landslide EvaluationWhidbey Island, Washington
SharePoint: 004220970/Working/Report Figures/Island County Slope Stability Figures.ppt SWC:tln 10-10-13
Reference: GEO-SLOPE International, Ltd., GeoStudio 2012 Version 8.0.10.6504

Figure E-7
Slope Stability Section G
Ledgewood Landslide EvaluationWhidbey Island, Washington
SharePoint: 004220970/Working/Report Figures/Island County Slope Stability Figures.ppt SWC:tln 10-10-13
Reference: GEO-SLOPE International, Ltd., GeoStudio 2012 Version 8.0.10.6504

Figure E-8
Slope Stability Section G Low Residual
Ledgewood Landslide EvaluationWhidbey Island, Washington
SharePoint: 004220970/Working/Report Figures/Island County Slope Stability Figures.ppt SWC:tln 10-10-13
Reference: GEO-SLOPE International, Ltd., GeoStudio 2012 Version 8.0.10.6504

APPENDIX F Report Limitations and Guidelines for Use

LEDGEWOOD LANDSLIDE EVALUATION Whidbey Island, Washington
November 27, 2013 | Page F-1 File No. 0422-097-00
APPENDIX F REPORT LIMITATIONS AND GUIDELINES FOR USE1
This appendix provides information to help you manage your risks with respect to the use of this report.
Geotechnical Services are Performed for Specific Purposes, Persons and Projects
This report has been prepared for the exclusive use of Island County Public Works, and their authorized agents. This report may be made available to other members of the design team. This report is not intended for use by others, and the information contained herein is not applicable to other sites.
GeoEngineers structures our services to meet the specific needs of our clients. For example, a geotechnical or geologic study conducted for a civil engineer or architect may not fulfill the needs of a construction contractor or even another civil engineer or architect that are involved in the same project. Because each geotechnical or geologic study is unique, each geotechnical engineering or geologic report is unique, prepared solely for the specific client and project site. Our report is prepared for the exclusive use of our Client. No other party may rely on the product of our services unless we agree in advance to such reliance in writing. This is to provide our firm with reasonable protection against open-ended liability claims by third parties with whom there would otherwise be no contractual limits to their actions. Within the limitations of scope, schedule and budget, our services have been executed in accordance with our Agreement with the Client and generally accepted geotechnical practices in this area at the time this report was prepared. This report should not be applied for any purpose or project except the one originally contemplated.
A Geotechnical Engineering or Geologic Report is Based on a Unique Set of Project-Specific Factors
This report has been prepared for the Ledgewood Landslide Evaluation, to be located in Coupeville, Washington. GeoEngineers considered a number of unique, project-specific factors when establishing the scope of services for this project and report. Unless GeoEngineers specifically indicates otherwise, do not rely on this report if it was:
■ not prepared for you, ■ not prepared for your project, ■ not prepared for the specific site explored, or ■ completed before important project changes were made.
For example, changes that can affect the applicability of this report include those that affect:
■ the function of the proposed structure; ■ elevation, configuration, location, orientation or weight of the proposed structure; ■ composition of the design team; or ■ project ownership.
1 Developed based on material provided by ASFE, Professional Firms Practicing in the Geosciences; www.asfe.org.

LEDGEWOOD LANDSLIDE EVALUATION Whidbey Island, Washington
Page F-2 | November 27, 2013 | GeoEngineers, Inc. File No. 0422-097-00
If important changes are made after the date of this report, GeoEngineers should be given the opportunity to review our interpretations and recommendations and provide written modifications or confirmation, as appropriate.
Subsurface Conditions Can Change
This geotechnical or geologic report is based on conditions that existed at the time the study was performed. The findings and conclusions of this report may be affected by the passage of time, by manmade events such as construction on or adjacent to the site, or by natural events such as floods, earthquakes, slope instability or groundwater fluctuations. Always contact GeoEngineers before applying a report to determine if it remains applicable.
Most Geotechnical and Geologic Findings are Professional Opinions
Our interpretations of subsurface conditions are based on field observations from widely spaced sampling locations at the site. Site exploration identifies subsurface conditions only at those points where subsurface tests are conducted or samples are taken. GeoEngineers reviewed field and laboratory data and then applied our professional judgment to render an opinion about subsurface conditions throughout the site. Actual subsurface conditions may differ, sometimes significantly, from those indicated in this report. Our report, conclusions and interpretations should not be construed as a warranty of the subsurface conditions.
Geotechnical Engineering Report Recommendations are Not Final
Do not over-rely on the preliminary construction recommendations included in this report. These recommendations are not final, because they were developed principally from GeoEngineers’ professional judgment and opinion. GeoEngineers’ recommendations can be finalized only by observing actual subsurface conditions revealed during construction. GeoEngineers cannot assume responsibility or liability for this report's recommendations if we do not perform construction observation.
Sufficient monitoring, testing and consultation by GeoEngineers should be provided during construction to confirm that the conditions encountered are consistent with those indicated by the explorations, to provide recommendations for design changes should the conditions revealed during the work differ from those anticipated, and to evaluate whether or not earthwork activities are completed in accordance with our recommendations. Retaining GeoEngineers for construction observation for this project is the most effective method of managing the risks associated with unanticipated conditions.
A Geotechnical Engineering or Geologic Report Could be Subject to Misinterpretation
Misinterpretation of this report by other design team members can result in costly problems. You could lower that risk by having GeoEngineers confer with appropriate members of the design team after submitting the report. Also retain GeoEngineers to review pertinent elements of the design team's plans and specifications. Contractors can also misinterpret a geotechnical engineering or geologic report. Reduce that risk by having GeoEngineers participate in pre-bid and preconstruction conferences, and by providing construction observation.

LEDGEWOOD LANDSLIDE EVALUATION Whidbey Island, Washington
November 27, 2013 | Page F-3 File No. 0422-097-00
Do Not Redraw the Exploration Logs
Geotechnical engineers and geologists prepare final boring and testing logs based upon their interpretation of field logs and laboratory data. To prevent errors or omissions, the logs included in a geotechnical engineering or geologic report should never be redrawn for inclusion in architectural or other design drawings. Only photographic or electronic reproduction is acceptable, but recognize that separating logs from the report can elevate risk.
Give Contractors a Complete Report and Guidance
Some owners and design professionals believe they can make contractors liable for unanticipated subsurface conditions by limiting what they provide for bid preparation. To help prevent costly problems, give contractors the complete geotechnical engineering or geologic report, but preface it with a clearly written letter of transmittal. In that letter, advise contractors that the report was not prepared for purposes of bid development and that the report's accuracy is limited; encourage them to confer with GeoEngineers and/or to conduct additional study to obtain the specific types of information they need or prefer. A pre-bid conference can also be valuable. Be sure contractors have sufficient time to perform additional study. Only then might an owner be in a position to give contractors the best information available, while requiring them to at least share the financial responsibilities stemming from unanticipated conditions. Further, a contingency for unanticipated conditions should be included in your project budget and schedule.
Contractors are Responsible for Site Safety on Their Own Construction Projects
Our geotechnical recommendations are not intended to direct the contractor’s procedures, methods, schedule or management of the work site. The contractor is solely responsible for job site safety and for managing construction operations to minimize risks to on-site personnel and to adjacent properties.
Read These Provisions Closely
Some clients, design professionals and contractors may not recognize that the geoscience practices (geotechnical engineering or geology) are far less exact than other engineering and natural science disciplines. This lack of understanding can create unrealistic expectations that could lead to disappointments, claims and disputes. GeoEngineers includes these explanatory “limitations” provisions in our reports to help reduce such risks. Please confer with GeoEngineers if you are unclear how these “Report Limitations and Guidelines for Use” apply to your project or site.
Geotechnical, Geologic and Environmental Reports Should Not be Interchanged
The equipment, techniques and personnel used to perform an environmental study differ significantly from those used to perform a geotechnical or geologic study and vice versa. For that reason, a geotechnical engineering or geologic report does not usually relate any environmental findings, conclusions or recommendations; e.g., about the likelihood of encountering underground storage tanks or regulated contaminants. Similarly, environmental reports are not used to address geotechnical or geologic concerns regarding a specific project.

LEDGEWOOD LANDSLIDE EVALUATION Whidbey Island, Washington
Page F-4 | November 27, 2013 | GeoEngineers, Inc. File No. 0422-097-00
Biological Pollutants
GeoEngineers’ Scope of Work specifically excludes the investigation, detection, prevention or assessment of the presence of biological pollutants. Accordingly, this report does not include any interpretations, recommendations, findings, or conclusions regarding the detecting, assessing, preventing or abating of biological pollutants and no conclusions or inferences should be drawn regarding biological pollutants, as they may relate to this project. The term “biological pollutants” includes, but is not limited to, molds, fungi, spores, bacteria, and viruses, and/or any of their byproducts.
If Client desires these specialized services, they should be obtained from a consultant who offers services in this specialized field.

Earth Science + Technology
Type Name of Services HereName of Project Here
forType Client Name Here
Type Date of Report Here