geothermal evidence from canada for a cold period before recent climatic warming
TRANSCRIPT
iments. V. M. Bryant, Jr., and R. G. Holloway, Eds (American Assoc~ation of Stratigraphic Palynolo- glsts, Calgary. Ontarlo, 1985). pp 39-70
6. T C. Atkinson, K R. Briffa, G. R Coope. Nature 325, 587 (1 987).
7 A. L. Washburn, Earth Sci. Rev. 15, 327 (1979) 8. U. Siegenthaler, U Elcher, H Oeschger, Ann
Glaciol. 5. 149 (1 984) 9. T. E. Cerllng, Earth Planet. Sci. Lett 71. 229
(1 984). 10. H. P. Schwarcz, in Handbook of Environmental
isotope Geochemistry, P Fr~tz and J Ch. Fontes. Eds. (Elsevler, Amsterdam, 1986), vol. 2, pp. 271-303.
11. C. J. Yapp and S Epsteln, Earth Planet. SCI Len. 34. 333 (1 977)
12. K. Rozanskl, Chem. Geol. 52, 349 (1985) 13. S. Oana, J. Earth Sci. Nagoya Univ 5. 103 (1 957) 14 R. Sugisakl, Am J. Sci 259, 144 (1961). 15. E. Mazor, Geochim Cosmochim Acta 36, 1321
(1 972). 16. J. N Andrews and D. J. Lee. J. Hydrol. 41. 233
(1 979). 17 J. Rudolph, H K Rath. C. Sonntag, In Isotope
Hydrology (Internat!onal Atomic Energy Agency. Vienna, 1984), pp. 467-477
18. M. Stute and J. Deak, Radiocarbon 31. 902 (1 989).
19. T. H E. Heaton. A. S. Talma. J. C Vogel, Ouat. Res. 25, 79 (1986).
20 S. H. Hamlln, Rep. 175 (Bureau of Economlc Geology, Austin, TX, 1988)
21. F. J. Pearson and D. E. White. Water Resour. Res. 3, 251 (1967).
22. J E. Brinkman, thesis. University of Ar~zona, Tuc- son (1 981).
23. G Marquardt and E. Rodr~guez, Jr., -Groundwa- ter resources of the Carr~zo aqu~fer In the W~nter Garden area of Texas' (Rep. 210. vol 2, Texas Water Development Board, Austln, 1977)
24. M. Stute. thesis. Un~verslty of Heidelberg (1985) (in German)
25. During its underground passage, ground water accumulates nonatmospher~c noble gases that are produced in the so11 matrlx by nuclear pro- cesses or dlffused from deeper layers of the earth's crust or mantle. Excesses of Ne, Ar. Kr. and Xe due to these processes are rarely detect- ed and can eas~ly be separated from the atmo- spheric noble gases owlng to the~r d~fferent isoto- PIC composit~on. However, He may show concen- trations several orders of magnitude above the solubility equ~l~brium level and the amount of atmospheric He cannot be Isolated Also. the solubility of He IS relat~vely lnsensltlve to temper- ature. Therefore. He cannot be used In paleotem- perature studies. The other process contr~but~ng to the concentrations of all noble gases IS excess air formation due to d~ssolution of small alr bub- bles caused by fluctuat~ons of the ground-water table [T. H. E. Heaton and J. C. Vogel, J. Hydrol. 50, 201 (1981)l. In most cases th~s process can be easily corrected for. because the noble gas concentratlon ratlo of the excess alr component equals that of alr, whereas the solubil~ty equ~l~brl- um component IS fractionated wlth respect to alr as a result of the d~fferent solub~l~ties of the s~ngle noble gases. For the data set from the Carrlzo aquifer described below, excess alr contr~butes on average (numbers In parentheses. maximum) 22(34)% to the Ne. 8(13)% to the Ar, 4(8)% to the Kr, and 3(5)% to the Xe concentratlon of the water sample. Because solubility and ~ t s temperature dependence Increase w~th atomlc mass. the Ne concentratlons are most sensltlve to the addition of excess alr whereas the Xe concentrations are ma~nly controlled by temperature. To separate the two unknowns, two noble gas concentrations, Ideally Ne and Xe, are needed
26. The Ar concentratlons appear to be on the aver- age 2% too low to be consistent wlth the other noble gases. The reason is probably an incom- plete removal of chemically active gases from the gas sample, these gases Influence the sorptlon characterist~cs of the charcoal trap used to sep- arate the lndivldual noble gases. If the Ar value IS
used for calculation of the noble gas tempera- tures, error bars become sl~ghtly larger and the noble gas temperatures are shlfted to lower val- ues, on average by 0 37°C Th~s shlft would not affect our conclus~ons.
27. M Stute and C Sonntag, In Isotopes of Noble Gases as Tracers in Environmental Studies (Inter- nat~onal Atom~c Energy Agency, V~enna, In press)
28. G D. Smlth, F Newhall, L H Rob~nson. D. Swanson, U S Dep. Agric Soil Conserv Sew Rep SCS- TP- 144 (1 964)
29. Climates of the States (National Ocean~c and Atmospher~c Admlnlstratlon. Washlngton. DC, 1978). vol 2.
30 J Hansen and S. Lebedeff, J. Geophys Res. 92, 13345 (1 987)
31. Dat~ng of ground water by 14C IS complicated by the complex hydrochemlstry of C In the ground- water system We applled several recent 14C correction models [see F M Phllllps, M. K. Tan- sey, L. A. Peeters. S Cheng, A Long, Water Resour Res. 25, 2259 (1989) for a summary] to Pearson and Wh~te s data (21) and obta~ned a
standard devlat~on of t2000 years, wh~ch may serve as an estlmate of the uncertalnty In '4C ages due to C hydrochem~stry
32 F M. Ph~llhps. thes~s, Unlverslty of Arlzona, Tucson (1981)
33. R F Welss, J. Chem Eng. Data 16, 235 (1 971) 34 , Deep-Sea Res 17, 721 (1 970) 35 H L Clever. Ed.. Krypton, Xenon, and Radon-
Gas Solubibties, Solub~l~ty Data Ser~es 2 (Interna- tlonal Unlon of Pure and Applled Chemistry, Per- gamon, Oxford. 1979)
36 We thank F M Ph~l l~ps, F J Pearson. Jr . R. Raabe, L Love, L N Plummer, C Sonntag, M Gron~ng, A Suckow. K Osenbruck, K. P~tz. H Jacob, and Texas farmers for the~r valuable contrlbutlons to thls work Thls project was sup- ported by NSF contract ATM 91-05538, the Lamont-Doherty Center for Cllmate Research, and the Alexander V Humboldt Foundation Lamont-Doherty Geologlcal Observatory contrl- butlon 4928
26 December 1991 accepted 12 March 1992
Geothermal Evidence from Canada for a Cold Period Before Recent Climatic Warming
Kelin Wang and Trevor J. Lewis Three deep boreholes in a small area in Quebec, each having two high-accuracy tem- perature logs separated by 22 years, allow reliable determination of the ground surface temperature history during the past few centuries. The temperature logs show that the recent climatic warming was preceded by a cold period near the end of the 19th century in this area. The presence of such acold period is also suggested by borehole temperature data from other areas in Canada.
W h e t h e r the climatic warming during the past hundred years is caused entirely by human activities is uncertain. Earlv instru- mental observations indicate that' surface air temperatures were low near the end of the 19th century ( I , 2), but the scarcity of meteorological stations before 1880 pre- cludes a meaningful global analysis (3). However, the presence of a cold period in various parts of the world at that time has also been suggested by some but not all studies using proxy methods ( 4 4 ) . These data suggest that the recent warming might be partially or mostly a return from a cold period. In this report, we describe geother- mal evidence from Quebec and other areas in Canada for the presence of a cold period before warming near the end of the 19th century. The estimation of ground surface temperature (GST) histories from precise borehole temperature measurements was first attempted in 1969 (7) and 1971 (8), but its im~or tance had not been widelv appreciated until Lachenbruch and Mar- shall (9) provided evidence from the Alas- kan Arctic for climatic warming during the past several decades. Recent developments include the use of a model that realisticallv
Pac~ f~c Geosc~ence Center, Geologlcal Survey of Can- ada. Sldney. B r~ t~sh Columbia, Canada V8L 482.
simulates lithologic layers in the crust and flexible inversion methods (1 0-1 2) and es- timation of G S T over a vast area (13). Compared to proxy methods, this tech- nique involves simple physics (heat con- duction) and is not subject to uncertainties related to calibration. However, the esti- mated GST history is necessarily a highly smoothed version of the real one and pro- vides an interesting contrast with tempera- ture records that are based on proxies.
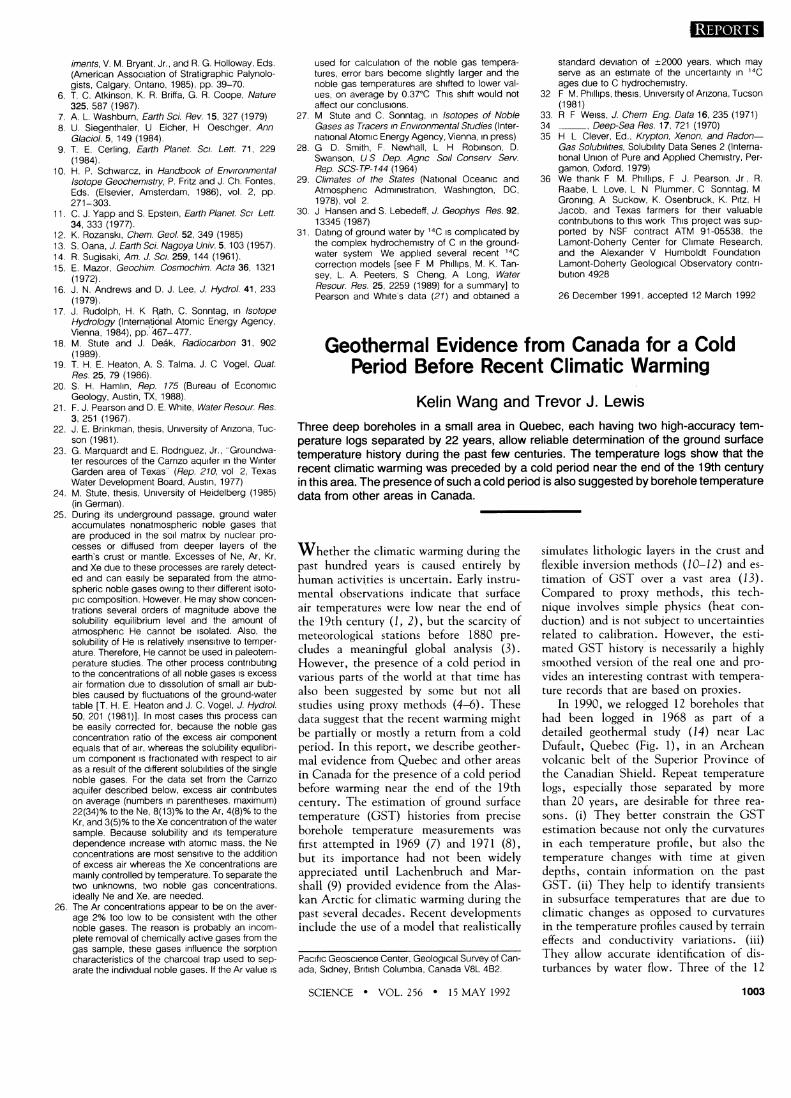
In 1990, we relogged 12 boreholes that had been logged in 1968 as part of a detailed geothermal study (14) near Lac Dufault, Quebec (Fig. I ) , in an Archean volcanic belt of the Superior Province of the Canadian Shield. Repeat temperature logs, especially those separated by more than 20 years, are desirable for three rea- sons. (i) They better constrain the GST estimation because not only the curvatures in each temperature profile, but also the temperature changes with time at given depths, contain information on the past GST. (ii) They help to identify transients in subsurface temperatures that are due to climatic changes as opposed to curvatures in the temperature profiles caused by terrain effects and conductivity variations. (iii) They allow accurate identification of dis- turbances by water flow. Three of the 12
SCIENCE VOL. 256 15 MAY 1992 1003
holes, 022, 024, and 389 (Fig. 2) , were free of water flow disturbance and were used for G S T estimation. The temperature measure- ment, typically at an interval of 10 m in 1968 and 3 m in 1990, has an absolute inaccuracy of <0.026 K and a relative inaccuracy of <0.006 K. Thermal conduc- tivities were measured on core samples (disks) with a divided bar at about every 30 m in each borehole. The samples were water-saturated after vacuum removal of trapped air before measurement, and mea- surement of individual disks to an uncer- tainty of 5% is expected.
We used a spectrum inverse method (12) for the simultaneous inversion of the two temperature logs from each borehole. The rock medium is assumed to have a laterally homogeneous layered structure, so that heat conduction is vertical. Given measured temperature-depth profiles, we es- timated the spectra of the unknown G S T using a Bayesian type generalized least squares theory (1 5). The determination of GST from subsurface temperatures is an ill-posed inverse problem, and proper con- straints are required for a stable and unique solution. Constraints on the GST, thermal properties, and borehole data are given in the form of a priori Gaussian probabilities. Basic constraints on the unknown GST are
Fig. 1. Map of eastern Canada showing borehole sites
its smoothness and boundedness. We intro- duced these constraints probabilistically by regarding the a priori G S T time series as a stationary Gaussian process with a Ham- ming autocovariance function. There are two important parameters in the autocova- riance function: the time domain standard deviation (SD) and the cut-off period PL. The GST at any time falls within 1 SD of the a priori GST, a constant with time, with a probability of about 68%. The SD was set to 1.58 K in our calculations, reflecting our a priori estimate of the mag- nitude of the G S T variation during the past several thousand vears. Using a different SD will change the amplitude 07 the estimated GST history only slightly. The cut-off pe- riod determines the smoothness of the GST and filters out any GST variation with shorter periods. We used a cut-off period of 100 years. A smaller P' enhances the reso- lution of the recent G S T and reduces the resolution back in time but does not affect the overall shape of the GST, which is constrained by two temperature logs 22 vears auart.
The a priori conductivity value used for each layer was the average of the measure- ments across the layer; the SD, due to measurement Inaccuracy and the scattering of the values around the average, is 0.2 W
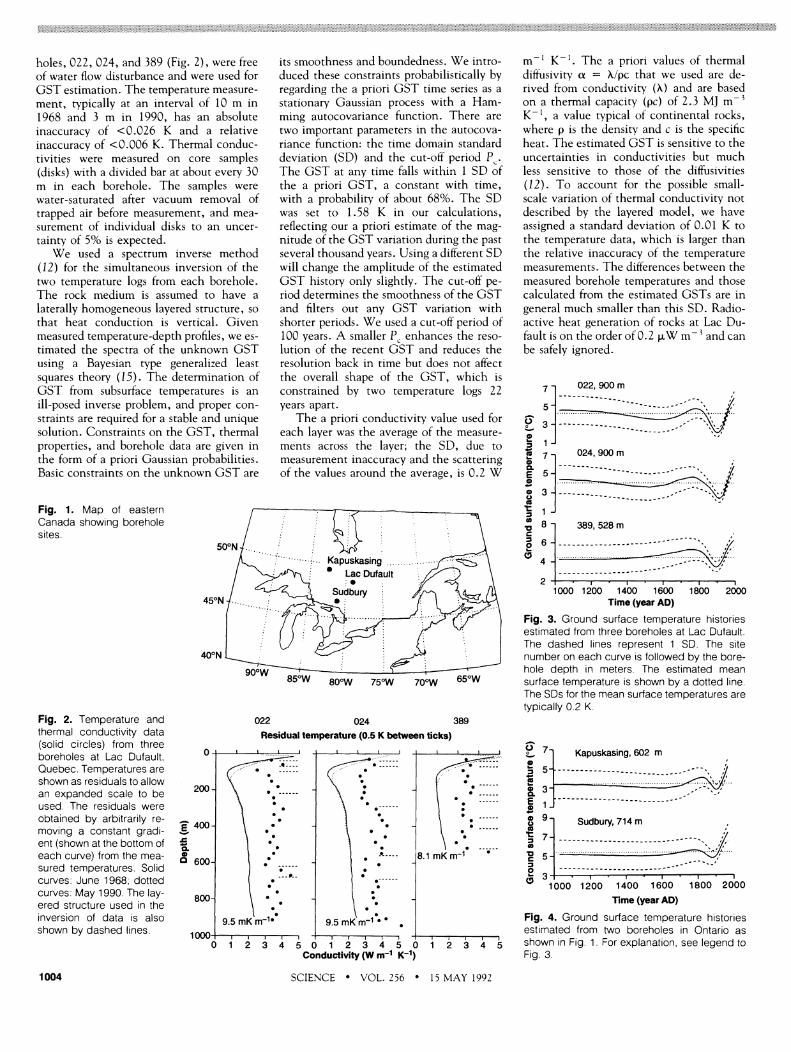
Fig. 2. Temperature and 022 024 389 thermal conduct~v~ty data (sol~d c~rcles) from three boreholes at Lac Dufault, Quebec Temperatures are shown as restduals to allow an expanded scale to be used The res~duals were obta~ned by arbltrarlly re- moving a constant gradl- ent (shown at the bottom of each curve) from the mea- sured temperatures Sol~d curves June 1968 dotted curves May 1990 The lay- ered structure used In the lnverslon of data IS also shown by dashed l~nes
Residual temperature (0.5 K between ticks)
0 1 2 3 4 5 0 1 2 3 4 5 0 1 2 3 4 5 Conductivity (W rn-I K-I)
m- ' K- ' . The a priori values of thermal difiusivity a = Aipc that we used are de- rived from conductivity (A) and are based on a thermal capacity (pc) of 2.3 MJ rnp3 K-I. a value w ~ i c a l o t continental rocks, , . where p is the density and c is the specific heat. The estimated G S T is sensitive to the uncertainties in conductivities but much less sensitive to those of the diffusivities (12). To account for the uossible small- ;=ale variation of thermal cdnductivity not described by the layered model, we have assigned a standard deviation of 0.01 K to - the temperature data, which is larger than the relative inaccuracv of the temDerature measurements. The dikerences between the measured borehole temperatures and those calculated from the estimated GSTs are in general much smaller than this SD. Radio- active heat generation of rocks at Lac Du- fault is on the order of 0.2 p.W rnp3 and can be safely ignored.
ti 4 2
1000 1200 1400 1600 1800 2000 Time (year AD)
Fig. 3. Ground surface temperature hlstor~es estimated from three boreholes at Lac Dufault. The dashed llnes represent 1 SD. The slte number on each curve IS followed by the bore- hole depth in meters The est~mated mean surface temperature IS shown by a dotted Ilne. The SDs for the mean surface temperatures are typ~cally 0.2 K
lime (year AD)
Fig. 4. Ground surface temperature h~stor~es est~mated from two boreholes In Ontarlo as shown In F I ~ 1 For explanat~on see legend to F I ~ 3
1004 SCIENCE VOL. 256 15 MAY 1992

The estimated GSTs from all the bore- holes are similar (Fig. 3). The record of the GSTs of the most recent hundred vears agrees with the trend of the average sukace air temperatures of the Northern Hemi- sphere (3) and that of central Ontario ( 1 6), the nearest region where century-long reli- able meteorological data are available. All three holes show a cold oeriod near the end of the 19th century, which is in agreement with tree-ring data from the United States and southwestern Canada (5). Tree-ring data from the high-latitude area of Canada and Alaska (1 7-19) also suggest such a cold period but with a temperature minimum about 50 years earlier. The two deeper holes, 022 and 024, show a less well re- solved older cold period -400 years ago, which agrees with what has been identified by historical and glacial studies as the Little Ice Age (20, 2 1). Because of the limitation imposed by borehole depths (shown on each curve) and the nature of heat diffu- sion, GST variations before A.D. 1500 cannot be resolved with confidence.
The land where the boreholes were drilled is low and flat in the south and higher and more rugged in the north, with an average difference in elevation of about 70 m. Boreholes 022 and 024 are located in the flat low area; therefore, the topographic effect on the geothermal gradient is negli- gible. Hole 389 is at a higher elevation and on a south-facing slope. Stronger solar ra- diation on the slope causes the upper part of the temDerature orofile to be "bent" toward the warm side, which results in a higher mean surface temperature and an apparent slight warming trend in the GST. Because the sites that were investigated are covered by snow in winter, the annual mean GST is higher than that of the surface air temper- ature.
The Lac Dufault paleotemperature re- sults are considered the most reliable that are available because of the unmatched aualitv of the thermal data. We have also siudied deep borehole data from another 19 sites in Canada. Although conditions are - not as favorable at any of these sites as at Lac Dufault, GST estimates from most of them do show a cold period before the recent climatic warming. Five of the sites yield results nearly identical to those of Lac Dufault for the last 200 years. The GSTs from the two sites nearest Lac Dufault (Fig. 4) substantiate the Lac Dufault results, although their uncertainties are larger.
In order to determine whether the re- cent warming has been caused by human activities. we need to know whether the current temperature and the current rate of temperature increase are significantly above normal, that is, the average temperature and the average rate of temperature in- crease during the centuries or millennia
before industrialization. Because of the de- crease in the resolution of GST back in time, we cannot assess the rate of increase. However, the long-term mean GST can be estimated, and this can be compared with the current temperatures. The deeper the borehole, the better is the mean GST that is determined, but our test using a 3-km hole shows that this value is robust if the borehole is deeper than 600 m. By a com- parison of temperatures only (Figs. 3 and 4), the recent warming has indeed resulted in a temperature that is lo to 2°C higher than average, but the warming is partially a recovery from a cold period.
REFERENCES AND NOTES
1 P D Jones et a1 J Clim Appi Meteoroi 25 121 3 (1 986)
2 H W Ellsaesser, M C MacCracken J J Walton S L Grotch Rev Geophys 24 745 (1986)
3 J Hansen and S Lebedeff J Geophys Res 92 1 3345 (1 987)
4 L M Llbby In Climate Histoy Periodicity and Predictabihty M Ramplno J Sanders W New- man L Konlgsson Eds (Van Nostrand Relnhold New York 1987)
5 H C Frltts and J M Lough Clim Change7 203 (1 985)
6 E Cook et a1 Science 253 1266 (1 991) 7 A E Beck and A Judge Geophys J R Astron
SOC 18, 145 (1 969) V Cermak. Palaeogeogr Palaeoclimatoi Palaeo- ecoi 10, 1 (1971) A H Lachenbruch and B V Marshall. Science 234. 689 (1 986) S B Nlelsen and A E Beck. Tectonophysics 164. 345 (1 989) P Y Shen and A E Beck. J. Geophys Res 96. 19965 (1991) K Wang. !bid 97, 2095 (1 992) H Beltram1 and J C Mareschal. Geophys Res Lett 4, 605 (1991) T J Lewls and A E Beck, Tectonophysics 41. 41 (1 977) A Tarantola and B Valette, Rev Geophys Space Phys 20. 21 9 (1 982) R W Longley. In Proceedings of Toronto Meteo- rological Conference (Royal Meteorological SOCI- ety London. 1953) G C Jacoby and E R Cook, Arct Alp Res 13. 409 (1981) . L D Ulan. Quat Res (NY) 23. 18 (1985) G C Jacoby and R DArrlgo, Clim Change 14, 39 (1989) H H Lamb, Climate Present. Past and Future (Methuen, London, 1977). vol 2 J M Grove, The Little Ice Age (Methuen, London. 1988) K W holds a CanadIan Government Laboratory Vlsltlng Fellowship and IS partially supported by the U S Geological Survey through an extramural contract We thank D S Chapman. R D Hynd- man. P F Hoffman. H Beltraml, and an anony- mous revlewer for valuable suggestlons Geolog- lcal Survey of Canada contrlbutlon 48091
6 January 1992 accepted 12 March 1992
Stress Diffusion Along the San Andreas Fault at Parkfield, California
P. E. Malin and M. G. Alvarez Beginning in January 1990, the epicenters of microearthquakes associated with a 12- month increase in seismicity near Parkfield, California, moved northwest to southeast along the San Andreas fault. During this sequence of events, the locally variable rate of cumu- lative seismic moment increased. This increase implies a local increase in fault slip. These data suggest that a southeastwardly diffusing stress front propagated along the San Andreas fault at a speed of 30 to 50 kilometers per year. Evidently, this front did not load the Parkfield asperities fast enough to produce a moderate earthquake; however, a future front might do so.
Since mid-1987, the microearthquake ac- tivity of the San Andreas fault near Park- field, California, has been monitored by the use of a ten-station network of borehole seismographs (Fig. 1, A and B) . This region has the potential for moderate earthquakes at some time in the next few years (1-3). On the basis of magnitude-distance statistics, the distribution of earthquakes detected by the network is complete to roughly magni- tude M = 0 near the center of the network and M = 0.25 overall (4). By the beginning of 1989, we had identified two seismically quiet patches of fault on which the future earthquakes might take place (4). The hy-
Department of Geology Duke Unlverslty, Durham, NC 27706
pocentral locations of earthquakes observed since 1989 have not filled in the two aseis- mic patches we found then. Instead, they have begun to define clusters of intense activity, particularly north of the network.
Before 1990. the cumulative moments (effectively the sum of the fault areas times their slips) in the regions around the patches increased at roughly constant rates, with one exception, a large step in the cumulative moment produced by an M - 4 earthquake in May 1989, midway between Middle Mountain and Gold Hill. After the begin- " ning of 1990, the cumulative moment rates in the Parkfield area began changing as a function of both time and location. Between January 1990 and May 1991, we observed a rapid increase in the cumulative moment
SCIENCE VOL. 256 15 MAY 1992 1005