geovis'15 - exploring the impact of visual complexity levels in 3d city models on the accuracy...
TRANSCRIPT
Vi lExploring the Impact of Visual Complexity Levels in 3D City Models onComplexity Levels in 3D City Models on the Accuracy of Individuals’ Orientation
d C iti Mand Cognitive Maps
mstim
e.comVictoria Rautenbach*
Arzu Çöltekin** (presenter)
nda trees” dream
Serena Coetzee*
image: : “jacara
*University of Pretoria ** University of Zurich
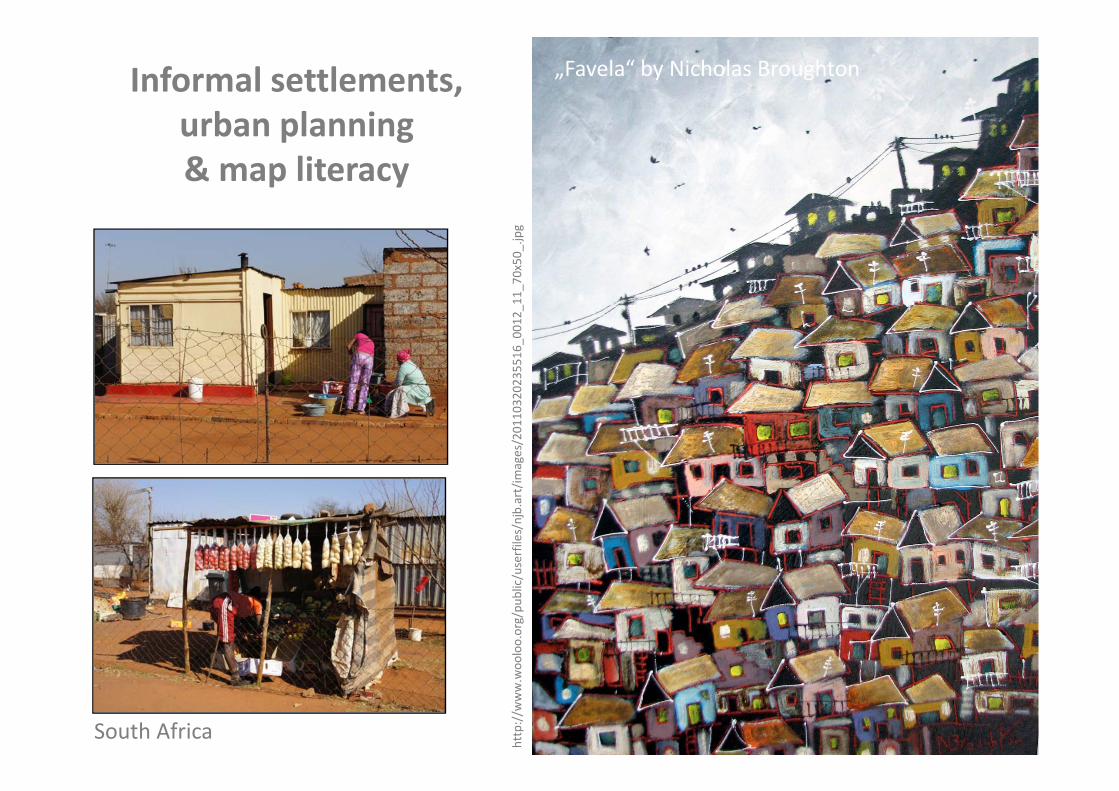
Informal settlements, urban planning
„Favela“ by Nicholas Broughton
urban planning & map literacy
_11_
70x50_
.jpg
2023
5516
_001
2_/im
ages/201
1032
/userfiles/njb.art/
ooloo.org/pu
blic/
South Africa
http://w
ww.wo

Map literacy & alternative visualizations
Map literacy– Map reading is learned
• Though spatial abilities (innate or acquired huge debate) matter
– Clarke (2007): not all planners have the necessary map literacy in South Africa
Visualization alterantives?Visualization alterantives?• 2D maps for development plans
‘h bl ’• 3D ‘human recognizable’ More intuitive? Could it help?
.. understanding visual complexity

Visual complexity
40%40%Illustration: C. Stangor Hoffmann 2000, Ware 2008
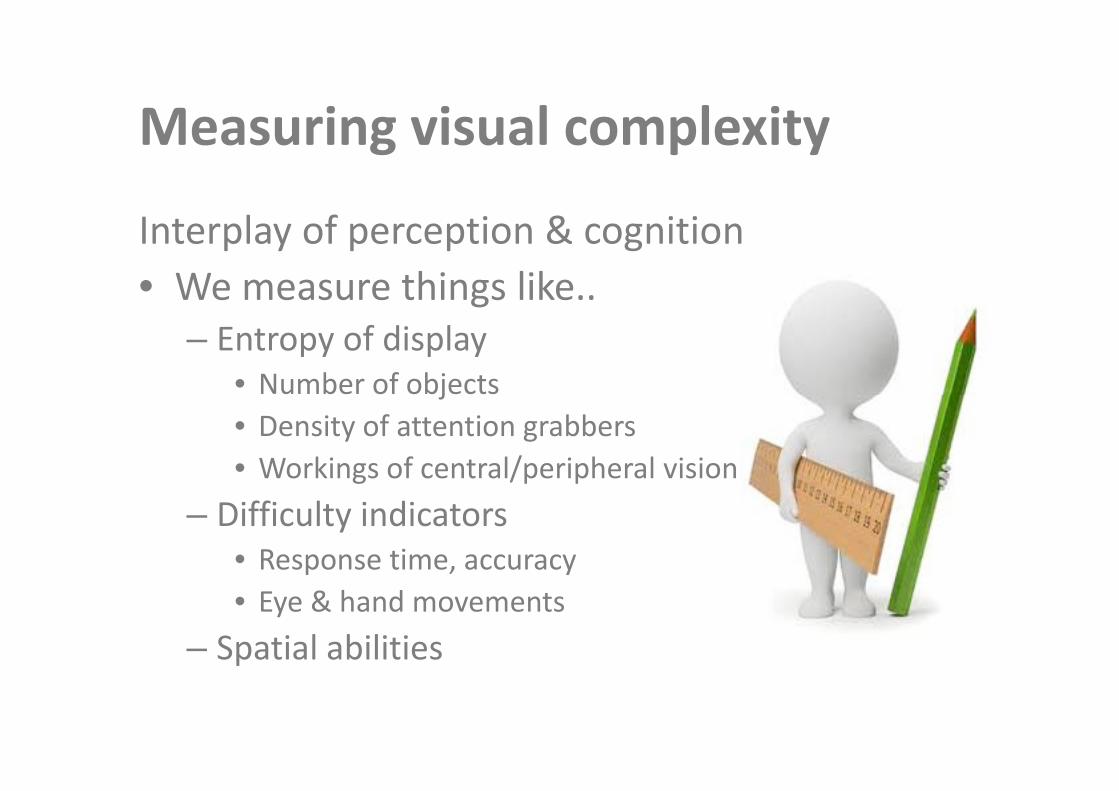
Measuring visual complexityMeasuring visual complexity
l f i & i iInterplay of perception & cognition • We measure things like..g
– Entropy of display• Number of objectsj• Density of attention grabbers• Workings of central/peripheral vision
– Difficulty indicators• Response time, accuracy• Eye & hand movements
– Spatial abilitiesp

Geovisualization & complexityGeovisualization & complexity
di i b h ll d i ll llMap reading is both perceptually and intellectuallycomplex
3K.htm
l
‐ Some maps are more x_picture_6N
3
pcomplex than others
‐ Map‐use tasks are more p_city_com
plex
Map use tasks are morecomplex for some people (e.g., non‐experts, le
x_map_m
ap
p p ( g , p ,low‐spatial people) than others al
ize.us/comp
iImage: vi.su

F t t ti i tGaze plotsEye movements
Fastest participant: ~11 seconds, 25 fixations
010
. 2009, 20
tekin et al
Coltekin, A. (2015). Mix well before use: Understanding the key ingredients of user studies . Workshop (position) paper ‐‐ at the pre‐conference workshop "Envisioning the Future of Cartographic Research" at the International Cartographic Conference , ICC 2015, Curitiba, Brazil.
Colt

Sl t ti i tEye movementsSlowest participant:~521 seconds, 1181 fixations
010
. 2009, 20
tekin et al
Colt
Coltekin, A. (2015). Mix well before use: Understanding the key ingredients of user studies . Workshop (position) paper ‐‐ at the pre‐conference workshop "Envisioning the Future of Cartographic Research" at the International Cartographic Conference , ICC 2015, Curitiba, Brazil.

More realistic more complex?More realistic, more complex?

Example: 2D vs. 3D, Continuous vs. discrete colors
d f l ( ll’ l )reading temperature ‐permafrost visualizations (Dall’Acqua et al., 2013)
2D 3D
Dall’Acqua, L., Coltekin, A., & Noetzli, J. (2013). A Comparative User Evaluation of Six Alternative Permafrost Visualizations for Reading and Interpreting Temperature Information. In GeoViz Hamburg 2013 Interactive Maps that Help Poeple Think.

Response time 2D/3D**
Number of errors 2D/3D
** p= .0 < .01
i 2 /3**
Number of errors discrete/cont Response time 2D/3D
Dall’Acqua, L., Coltekin, A., & Noetzli, J. (2013). A Comparative User Evaluation of Six Alternative Permafrost Visualizations for Reading and Interpreting Temperature Information. In GeoViz Hamburg 2013 Interactive Maps that Help Poeple Think.
**p = .0 < .01

Example
ng
Austria.
inguish
Sattelite images vsmaps
View
ing: Charti
earch, Vienn
a,
cien
tK to
Disti
putatio
n
cs From M
ap V
for Spa
tial Rese
. Usin
g Co
e ffic
tion an
d Co
mp
el Gaze Metric
Eye Tracking
f
unde
r review).
Spatial Cog
nit
014). H
igh‐Leve
Worksho
p on
edzie
lska, A. (u
Map
Viewing.
Colte
kin, A. (20
ntion. 2nd
Int.
chow
ski, A., N
ieen
tion Du
ring
ucho
wski, A., C
cal V
isual Atten
oltekin, A., Du
cocal Visu
al Atte
Krejtz, K., Du
Ambient/Foc
Krejtz, K., Co
Ambien
t / Fo

Example
ng
, Austria.
inguish
Sattelite images vsmaps
View
ing: Charti
earch, Vienn
a,
cien
tK to
Disti
putatio
n
cs From M
ap V
for S
patia
l Rese
. Usin
g Co
e ffic
tion an
d Co
mp
el Gaze Metric
Eye Tracking f
unde
r review).
Spatial Cog
nit
014). H
igh‐Leve
Worksho
p on
edzie
lska, A. (u
Map
Viewing.
Visual clutter algorithm by Rosenholz
Colte
kin, A. (20
ntion. 2nd
Int.
chow
ski, A., N
ieen
tion Du
ring
(2007) applied to satellite imagesand cartographic maps of the same cities
ucho
wski, A., C
cal V
isual Atten
oltekin, A., Du
cocal Visu
al Atte
Krejtz, K., Du
Ambient/Foc
Krejtz, K., Co
Ambien
t / Fo

Example
ng
, Austria.
inguish
Sattelite images vsmapsS li Vi
ewing: Charti
earch, Vienn
a,
cien
tK to
Disti
putatio
n
Saliency maps calculated according to
rdam
cs From M
ap V
for S
patia
l Rese
. Usin
g Co
e ffic
tion an
d Co
mp
Itti & Koch’s model (1981), modified by
Amster
el Gaze Metric
Eye Tracking f
unde
r review).
Spatial Cog
nit
yWalther (2006)
014). H
igh‐Leve
Worksho
p on
edzie
lska, A. (u
Map
Viewing.
ona
Colte
kin, A. (20
ntion. 2nd
Int.
chow
ski, A., N
ieen
tion Du
ring
Barcelo
ucho
wski, A., C
cal V
isual Atten
oltekin, A., Du
cocal Visu
al Atte
Cartographic map Satellite image
Krejtz, K., Du
Ambient/Foc
Krejtz, K., Co
Ambien
t / Fo
Example
ng
, Austria.
inguish
Sattelite images vsmaps
View
ing: Charti
earch, Vienn
a,
cien
tK to
Disti
putatio
n
cs From M
ap V
for S
patia
l Rese
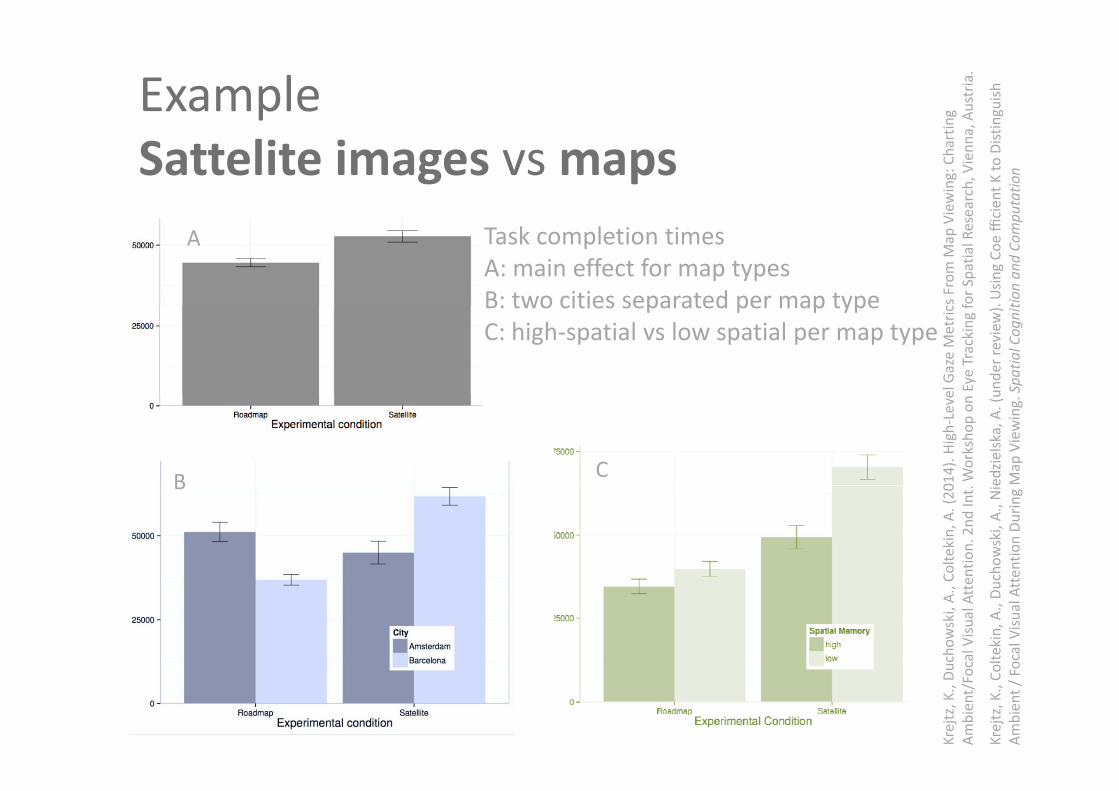
Task completion timesA: main effect for map typesB: two cities separated per map type
A
. Usin
g Co
e ffic
tion an
d Co
mp
el Gaze Metric
Eye Tracking fB: two cities separated per map typeC: high‐spatial vs low spatial per map type
unde
r review).
Spatial Cog
nit
014). H
igh‐Leve
Worksho
p on
B C edzie
lska, A. (u
Map
Viewing.
Colte
kin, A. (20
ntion. 2nd
Int. B
chow
ski, A., N
ieen
tion Du
ring
ucho
wski, A., C
cal V
isual Atten
oltekin, A., Du
cocal Visu
al Atte
Krejtz, K., Du
Ambient/Foc
Krejtz, K., Co
Ambien
t / Fo

Complex = pmore hands?
No mouse useP i l f ll
Eye movements – Heim & Coltekin
Partial or full mouse use
Coltekin, A., Demsar, U., Brychtova, A., Vandrol, J. (2014). Eye‐hand coordination during visual search on geographic displays In: Proceedings of the 2nd International Workshop on Eye Tracking for Spatial Research, Vienna, Austria.

going back to the original question.. going back to the original question

Map literacy & alternative visualizations
Map literacy– Map reading is learned
• Though spatial abilities (innate or acquired huge debate) matter
– Clarke (2007): not all planners have the necessary map literacy in South Africa
Visualization alterantives?Visualization alterantives?• 2D maps for development plans
‘h bl ’• 3D ‘human recognizable’ More intuitive? Could it help?

Preliminary work (this study)Preliminary work (this study)
Not a controlled study
• Three 3D models– unfamiliar cities – presented in virtual environments
• sense of orientation– ‘real life’ landmarks– virtual landmarks
• “cognitive map”cognitive map– sketch the route just shown

ParticipantsParticipants
• 107 University of Pretoria undergraduate students – ‘future experts’ (all enrolled in Faculty of Natural Scienes)
l f l– 51 males, 56 females– 18‐25 years old (average: 20)
• “Focus group” like interactions in classroom• Focus group like interactions in classroom

Selected results – sense of direction (self reported)
50%
Sense of directionFrequency of disorientation
35%
40%
45%
rticipan
ts
25%
30%
35%
age of par
Rarely
10%
15%
20%
Percen
ta
Excellent
0%
5%
10% Extremely poor
Very often

Selected Results – orientation (observed)
50%
40%45%50%
25%30%35%
racy
10%15%20%
Accu
47% 34% 42%0%5%10%
Task3 (Real world) Task5 (VC2) Task6 (VC3)Task3 (Real world) Task5 (VC2) Task6 (VC3)

Selected results (‘cognitive maps’)(‘cognitive maps’)

Quantified success in sketch task
30%
35%
40%tegory
20%
25%
30%
s per ca
10% 19% 17% 34% 20%5%
10%
15%
ketche
s
10% 19% 17% 34% 20%0%
Layout + Circle +
Layout + Circle
Layout + Height
Layout No resemblance
% sk
Circle + Height
Circle Height resemblance

Results SummaryResults ‐ Summary
l l d d h d f• Only 47% correctly indicated the direction of a well‐known building on campus – Even lower number of correct responses with VE: 34% (Alexanderplatz) and 42% (Ettenheim)% ( p ) % ( )
• Drawing the sketch was a challenging task( i 3D t 2D t l t f ti )(requires 3D to 2D mental transformation) – Only a staggering 10% of participants were able to include the layout, circle and height differentiation

Evaluating functional map literacy when using i d i li i f b
Next up..
various maps and geovisualizations for urban design of informal settlements

Thank you!Thank you!
@ResearchMark & @Ted_Underwood ‐‐ https://twitter.com/Ted_Underwood/status/496006063880437762