gerdau s.a. · gerdau s.a. balance sheets--december 31, 2001 and 2000 (in thousands of brazilian...
TRANSCRIPT

Gerdau S.A.
Financial Statements Together with Report of Independent Public Accountants
December 31, 2001 and 2000

Report of Independent Public Accountants (Translation of the report originally issued in Portuguese. See Note 24 to the financial statements.) To the Management and Shareholders of Gerdau S.A.: (1) We have audited the individual (Company) and consolidated balance sheets of GERDAU S.A. (a Brazilian corporation) and subsidiaries as of December 31, 2001 and 2000, and the related statements of income, changes in shareholders’ equity, and changes in financial position for the years then ended, prepared under the responsibility of the Company’s management. Our responsibility is to express an opinion on these financial statements. (2) Our audits were conducted in accordance with auditing standards in Brazil and comprised: (a) planning of the work, taking into consideration the significance of the balances, volume of transactions, and the accounting and internal control systems of the Company and its subsidiaries, (b) checking, on a test basis, the evidence and records that support the amounts and accounting information disclosed, and (c) evaluating the significant accounting practices and estimates adopted by management, as well as the presentation of the financial statements taken as a whole. (3) In our opinion, the financial statements referred to in paragraph (1) present fairly, in all material respects, the individual and consolidated financial positions of Gerdau S.A. and subsidiaries as of December 31, 2001 and 2000, the results of their operations, the changes in shareholders’ equity, and the changes in their financial positions for the years then ended in accordance with accounting practices emanating from Brazilian corporate law. (4) Our audits were conducted for the purpose of expressing an opinion on the financial statements referred to in paragraph (1) above, taken as a whole. The supplementary information consisting of the statements of cash flows is presented to permit additional analyses and is not a required part of the basic financial statements. We have examined this supplementary information in accordance with the auditing procedures described in paragraph (2) above and, in our opinion, it is presented fairly, in all material respects, in relation to the basic financial statements taken as a whole. Rio de Janeiro, January 28, 2002 ARTHUR ANDERSEN S/C Roberto Wagner Promenzio Engagement Partner

GERDAU S.A.
BALANCE SHEETS--DECEMBER 31, 2001 AND 2000
(In thousands of Brazilian reais)
(Translation of the original in Portuguese)
A S S E T S
Company Consolidated 2001 2000 2001 2000 CURRENT ASSETS: Cash and cash equivalents 177,400 188,188 1,012,822 704,169 Trade accounts receivable 402,919 389,797 829,010 708,920 Inventories 499,900 436,917 1,331,133 979,732 Tax credits 28,626 29,251 63,266 51,400 Deferred income and social contribution taxes 1,953 18,028 25,632 31,069 Other receivables 60,080 48,013 98,419 82,342 ------------- ------------- ------------- ------------- Total current assets 1,170,878 1,110,194 3,360,282 2,557,632 ------------- ------------- ------------- -------------NONCURRENT ASSETS: Affiliated companies 33,595 18,422 28,093 17,094 Eletrobrás loans 6,665 12,173 9,345 17,085 Deferred income and social contribution taxes 24,126 22,809 102,141 45,896 Compulsory deposits and other 66,988 63,562 134,594 117,060 ------------- ------------- ------------- ------------- Total noncurrent assets 131,374 116,966 274,173 197,135 ------------- ------------- ------------- -------------PERMANENT ASSETS: Investments 1,759,939 1,600,614 310,595 280,215 Property, plant and equipment 1,613,501 1,629,641 5,807,868 3,848,751 Deferred charges 10,147 12,362 13,502 21,815 ------------- ------------- ------------- ------------- Total permanent assets 3,383,587 3,242,617 6,131,965 4,150,781 ------------- ------------- ------------- ------------- Total assets 4,685,839 4,469,777 9,766,420 6,905,548 ======== ======== ======== ========
The accompanying notes are an integral part of these balance sheets.

GERDAU S.A.
BALANCE SHEETS--DECEMBER 31, 2001 AND 2000
(In thousands of Brazilian reais)
(Translation of the original in Portuguese)
LIABILITIES AND SHAREHOLDERS’ EQUITY
Company Consolidated 2001 2000 2001 2000 CURRENT LIABILITIES: Trade accounts payable 111,891 92,698 580,790 313,444 Loans and financing 323,304 571,537 2,101,970 1,461,245 Debentures 4,683 4,719 4,683 4,719 Taxes and social charges payable 82,491 54,542 88,459 58,892 Deferred income and social contribution taxes 6,634 8,206 6,812 12,974 Payroll 31,929 37,153 84,454 83,129 Proposed dividends/interest on capital 102,271 71,220 111,943 71,305 Other payables 28,148 27,616 175,184 125,536 ------------- ------------- ------------- ------------- Total current liabilities 691,351 867,691 3,154,295 2,131,244 ------------- ------------- ------------- -------------LONG-TERM LIABILITIES: Loans and financing 852,258 775,354 1,841,526 1,498,594 Debentures 231,317 221,643 218,591 221,643 Reserve for contingencies 104,664 112,507 129,680 124,709 Deferred income and social contribution taxes 28,927 28,757 336,611 289,197 Employee benefits 13,331 - 46,378 23,803 Other payables 78,232 98,618 123,488 168,474 ------------- ------------- ------------- ------------- Total long-term liabilities 1,308,729 1,236,879 2,696,274 2,326,420 ------------- ------------- ------------- -------------MINORITY INTEREST - - 1,230,092 82,677 ------------- ------------- ------------- -------------SHAREHOLDERS’ EQUITY: Capital 1,320,133 1,320,133 1,320,133 1,320,133 Capital reserves 255,213 221,150 255,213 221,150 Profit reserves 1,110,413 823,924 1,110,413 823,924 ------------- ------------- ------------- ------------- Total shareholders’ equity 2,685,759 2,365,207 2,685,759 2,365,207 ------------- ------------- ------------- -------------SHAREHOLDERS’ EQUITY INCLUDING MINORITY INTEREST - - 3,915,851 2,447,884 ------------- ------------- ------------- ------------- Total liabilities and shareholders’ equity 4,685,839 4,469,777 9,766,420 6,905,548 ======== ======== ======== ========
The accompanying notes are an integral part of these balance sheets.

GERDAU S.A.
STATEMENTS OF INCOME
FOR THE YEARS ENDED DECEMBER 31, 2001 AND 2000
(In thousands of Brazilian reais)
(Translation of the original in Portuguese)
Company Consolidated 2001 2000 2001 2000 GROSS SALES 3,947,873 3,583,840 7,083,601 6,226,479 Taxes on sales (755,923) (678,213) (865,009) (745,657) Freight and discounts (119,306) (109,139) (330,189) (284,724) ------------- ------------- ------------- ------------- NET SALES 3,072,644 2,796,488 5,888,403 5,196,098 COST OF SALES (1,908,133) (1,915,259) (4,235,146) (3,857,864) ------------- ------------- ------------- ------------- GROSS PROFIT 1,164,511 881,229 1,653,257 1,338,234 SELLING EXPENSES (211,277) (177,226) (264,690) (219,987) FINANCIAL EXPENSES (371,222) (279,578) (633,072) (495,260) FINANCIAL INCOME 67,732 43,779 133,178 106,291 GENERAL AND ADMINISTRATIVE EXPENSES: Management compensation (7,907) (6,939) (12,303) (10,354) General expenses (264,157) (224,604) (457,341) (387,870) EQUITY IN SUBSIDIARIES AND AFFILIATED COMPANIES 177,103 197,817 160,295 69,851 OTHER OPERATING INCOME (EXPENSES) 10,432 9,600 (5,926) 57,328 ------------- ------------- ------------- ------------- INCOME FROM OPERATIONS 565,215 444,078 573,398 458,233 NONOPERATING INCOME (EXPENSE) (23,128) (6,544) (2,925) 6,940 ------------- ------------- ------------- ------------- INCOME BEFORE TAXES AND PROFIT SHARING 542,087 437,534 570,473 465,173 PROVISION FOR INCOME AND SOCIAL CONTRIBUTION TAXES:
Current (56,819) (52,659) (51,000) (55,610) Deferred (13,356) 15,006 36,816 (3,691) MANAGEMENT PROFIT SHARING (7,906) (6,939) (9,994) (7,779) ------------- ------------- ------------- ------------- NET INCOME 464,006 392,942 546,295 398,093 ======= ======= ======= ======= MINORITY INTEREST - - 82,289 5,151 CONTROLLING SHAREHOLDERS’ INTEREST - - 464,006 392,942 ======= ======= ======= ======= EARNINGS PER THOUSAND SHARES - R$ 4.09 3.46 ==== ==== BOOK VALUE PER THOUSAND SHARES - R$ 23.66 20.84 ==== ====
The accompanying notes are an integral
part of these statements.

GERDAU S.A.
STATEMENTS OF CHANGES IN SHAREHOLDERS’ EQUITY
FOR THE YEARS ENDED DECEMBER 31, 2001 AND 2000
(In thousands of Brazilian reais)
(Translation of the original in Portuguese)
Capital reserves Profit reserves Special Investments Total Investment (Law Unrealized and working Retained shareholders’ Capital grants No. 8,200/91) Other Total Legal profit capital Total earnings equity
BALANCES DECEMBER 31, 1999
1,316,881
159,175
21,487 6,187 186,849
47,812
28,667
482,889
559,368
- 2,063,098
Capital increase from reserves
3,252
-
- - - (3,252)
- -
(3,252)
- -
Investment grants
- 34,301
- - 34,301
- - -
- - 34,301
Net income
- -
- - - - - -
- 392,942
392,942
Realization and reversal of reserves
- -
- - - - (8,212)
-
(8,212)
8,212
-
Allocations proposed to Annual Shareholders’ Meeting: Legal reserve - - - - - 19,647 - - 19,647 (19,647) - Investments and working capital reserve - - - - - - - 256,373 256,373 (256,373) - Interest on capital
- - - - - - - - - (125,134) (125,134) -------------- -------------------- ------------------ --------- --------- -------------- -------------- ------------ --------------
BALANCES DECEMBER 31, 2000
1,320,133 193,476 21,487
6,187
221,150
64,207 20,455 739,262
823,924
- 2,365,207
Net income
- -
- - - - - -
- 464,006
464,006
Investment grants
- 34,063
- 34,063
- - -
- - 34,063
Prior-year adjustments - employee benefits
- -
- - - - - -
- (13,331)
(13,331)
Realization and reversal of reserves
- -
- - - - (20,455)
-
(20,455)
20,455
-
Allocations proposed to Annual Shareholders’ Meeting: Legal reserve - - - - - 23,201 - - 23,201 (23,201) - Investments and working capital reserve - - - - - - - 283,743 283,743 (283,743) - Interest on capital
- - - - - - - - - (164,186) (164,186) -------------- -------------------- ------------------ --------- --------- -------------- -------------- ------------ --------------
BALANCES DECEMBER 31, 2001
1,320,133 227,539 21,487 6,187
255,213 87,408 - 1,023,005 1,110,413 - 2,685,759 ======== =========== ========== ===== ===== ======== ======== ======= ========
The accompanying notes are an integral part of these statements.

GERDAU S.A.
STATEMENTS OF CHANGES IN FINANCIAL POSITION
FOR THE YEARS ENDED DECEMBER 31, 2001 AND 2000
(In thousands of Brazilian reais)
(Translation of the original in Portuguese)
Company Consolidated 2001 2000 2001 2000 SOURCES OF FUNDS: From operations- Net income 464,006 392,942 546,295 398,093 Items not affecting working capital-- Depreciation and amortization 172,061 171,604 391,037 340,083 Prior-year adjustments - employee benefits (13,331) - (13,331) - Amortization of negative goodwill - - - (65,320) Cost of permanent asset disposals 89,057 39,329 95,613 48,563 Equity in subsidiaries and affiliated companies (177,103) (197,817) (160,295) (69,851) Monetary variations on long-term liabilities 104,314 47,258 97,237 56,660 Monetary variations on noncurrent assets (6,029) (3,914) (6,120) (5,263) ----------- ----------- ------------- ----------- Total from operations 632,975 449,402 950,436 702,965 From third parties- Contributions received for capital reserves 34,063 34,301 34,201 34,374 Decrease in long-term liabilities (32,464) (58,262) (83,704) (21,195) Working capital of consolidated companies - - (31,260) - Effect of foreign exchange on working capital of companies abroad - - 70,961 1,531 Effect of gain on interest in working capital of affiliated companies - - (104,094) 1,501 Dividends not included in income 30,657 18,508 - - ----------- ----------- ------------- ----------- Total sources 665,231 443,949 836,540 719,176 ----------- ----------- ------------- ----------- USES OF FUNDS: In investments 76,192 163,633 345,132 112,278 In property, plant and equipment 177,376 215,558 513,464 429,415 In deferred charges 2,074 86 2,858 102 Increase in noncurrent assets 8,379 25,730 21,327 17,772 Dividends/interest on capital 164,186 125,134 174,160 125,295 ----------- ----------- ------------- ----------- Total uses 428,207 530,141 1,056,941 684,862 ----------- ----------- ------------- ----------- INCREASE (DECREASE) IN WORKING CAPITAL 237,024 (86,192) (220,401) 34,314 ====== ====== ======= ====== WORKING CAPITAL: Beginning of year 242,503 328,695 426,388 392,074 End of year 479,527 242,503 205,987 426,388 ----------- ----------- ------------- ----------- INCREASE (DECREASE) IN WORKING CAPITAL 237,024 (86,192) (220,401) 34,314 ====== ====== ======= ======
The accompanying notes are an integral part of these statements.

SUPPLEMENTARY INFORMATION
GERDAU S.A.
STATEMENTS OF CASH FLOWS
FOR THE YEARS ENDED DECEMBER 31, 2001 AND 2000
(In thousands of Brazilian reais)
(Translation of the original in Portuguese)
Company Consolidated 2001 2000 2001 2000 Net income 464,006 392,942 546,295 398,093 Equity in subsidiaries and affiliated companies (177,103) (197,817) (160,295) (69,851) Provision for doubtful accounts 13,758 9,926 11,909 24,297 Gain on disposal of property, plant and equipment 19,909 570 24,120 8,195 Gain (Loss) on sale of investments 18,056 (165) 5,129 (221) Debt indexation 172,571 92,929 214,235 102,973 Depreciation and amortization 172,061 171,604 391,037 340,083 Investment grants 34,063 34,300 34,201 34,375 Income and social contribution taxes 24,822 (19,022) 2,976 7,528 Interest on debt 168,303 140,742 248,297 238,522 Contingencies/escrow deposits (9,053) (30,442) (11,306) (28,311) Changes in trade accounts receivable (15,623) (97,928) 64,460 (122,945) Changes in inventories (62,927) (31,329) (51,974) (49,438) Changes in trade accounts payable 30,524 8,248 62,729 (12,410) Other (41,651) 6,555 (131,208) (99,241) ----------- ----------- ------------- ----------- Net cash provided by operating activity 811,716 481,113 1,250,605 771,649 ----------- ----------- ------------- ----------- Acquisition of property, plant and equipment (172,762) (193,545) (444,266) (371,537) Increase in deferred charges (2,074) (69) (2,858) (81) Purchase of investments (1,403) (149,818) (345,132) (112,278) Dividends/interest on capital received 1,124 18,508 - - ----------- ----------- ------------- ----------- Net cash used in investing activity (175,115) (324,924) (792,256) (483,896) ----------- ----------- ------------- ----------- Suppliers of property, plant and equipment (10,653) 6,288 (10,843) 6,709 Working capital financing (73,705) (93,339) (21,972) (105,152) Debentures (27,367) 52,085 (40,093) 52,085 Permanent asset financing 80,049 304,252 909,953 665,796 Amortization of permanent asset financing (342,969) (159,898) (748,756) (545,725) Payment of interest on financing (129,972) (117,536) (208,486) (169,222) Loans with affiliated companies (15,173) (70,384) (10,999) (69,112) Payment of dividends, interest and profit sharing (127,599) (106,185) (137,848) (113,825) ----------- ----------- ------------- ----------- Net cash used in financing activity (647,389) (184,717) (269,044) (278,446) ----------- ----------- ------------- ----------- Change in cash balance (10,788) (28,528) 189,305 9,307 Cash balance: Beginning of year 188,188 216,716 704,169 694,862 Gain on interest in Açominas cash balance - - 119,348 - ----------- ----------- ------------- ----------- End of year 177,400 188,188 1,012,822 704,169 ====== ====== ======= ======
The accompanying notes are an integral part of these statements.

GERDAU S.A.
NOTES TO THE FINANCIAL STATEMENTS
AS OF DECEMBER 31, 2001 AND 2000
(Amounts in thousands of Brazilian reais, unless otherwise indicated)
(Translation of the original in Portuguese)
1. OPERATIONS Gerdau S.A. is a Gerdau Group company; its main activities are the production of common steel shapes (bars, rods, etc.) and specialty steels and the sale of steel products in general (flat and shaped steels), manufactured in various steel mills located in the main Brazilian markets and in Uruguay, Chile, Canada, Argentina and the United States. The Gerdau Group has an installed capacity of 8.4 million tons of raw steel per year, produced in electric furnaces, using scrap and pig iron acquired principally in the regions where the steel mills are located (mini-mill concept). Gerdau also has plants which produce steel using iron ore (in blast furnaces and using direct reduction), in addition to having an industrial unit exclusively for the production of specialty steel. It is the largest scrap recycler in Latin America and ranks among the largest in the world. The Company’s most important market is the construction sector which requires a high volume of rods and wire for concrete, followed by the industrial sector, in which manufacturers of consumer goods, such as automobiles and home appliances and appliances for commercial use, basically use wire rods and shapes in various available specifications. Another important market is for nails, staples and wires, used largely in the agricultural sector. 2. PRESENTATION OF FINANCIAL STATEMENTS The financial statements were prepared in accordance with accounting practices emanating from Brazilian corporate law, amended by articles 4 and 5 of Law No. 9,249/95, and in conformity with CVM (Brazilian Securities Commission) Instruction No. 248/96. Permanent assets and shareholders’ equity are restated from the month of their recording and inception through December 31, 1995. From that date on, they are stated at historical amounts. All other components were maintained at their original amounts since they represent the purchasing power of the currency as of December 31, 2001. We are presenting, as supplementary information to permit additional analyses, the statements of cash flows (Company and consolidated) prepared in accordance with NPC-20 of IBRACON (Brazilian Institute of Independent Auditors).

3. SIGNIFICANT ACCOUNTING PRACTICES (a) Cash and Cash Equivalents--Temporary cash investments are stated at cost plus income earned to the balance sheet date, based on interest rates agreed upon with the financial institutions. (b) Allowance for Doubtful Accounts--Calculated based on an analysis of credit risks which considers loss history, the individual situation of customers, and an evaluation by legal counsel, considered sufficient to cover possible losses on the realization of receivables. (c) Inventories--Stated at the lower of market and production cost or average purchase price. (d) Investments in Subsidiaries--Carried under the equity method. The results of the equity pickup are recorded in income as an operating item. Investments in subsidiaries are detailed in “Attachment to Note 3(d)”. (e) Property, Plant and Equipment--Stated at cost less depreciation. Depreciation is calculated under the straight-line method at the rates shown in Note 11, based on the estimated useful lives of the assets. Interest on loans for financing construction in progress is capitalized. (f) Deferred Charges--Amortization is calculated under the straight-line method on cost, at rates determined based on production from implemented projects in relation to installed capacity. (g) Income and Social Contribution Taxes--Income and social contribution taxes were determined as established by the present legislation. Deferred income and social contribution taxes were determined based on CVM Resolution No. 273 of August 20, 1998. (h) Other Current and Long-term Liabilities--Stated at known or determinable amounts plus corresponding charges and monetary variations, when applicable. 4. CONSOLIDATED FINANCIAL STATEMENTS The consolidated financial statements as of December 31, 2001 include the accounts of the Company and its direct and indirect subsidiaries listed below: Florestal Itacambira S.A. (100%), Florestal Rio Largo Ltda. (99%), Itaguaí Comércio, Importação e Exportação Ltda. (99%), Seiva S.A. - Florestas e Indústrias (96%), Gerdau Laisa S.A. (99%), Gerdau Aza S.A. (99%), Indústria Del Aciero S.A. - Indac (99%), Gerdau Chile Inversiones Ltda. (99%), Aceros Cox S.A. (100%), Axol S.A. (100%), Gerdau MRM Steel Inc. (100%), Gerdau Courtice Steel Inc. (100%), Gerdau Steel Inc. (100%), FLS Holdings Inc. (100%), GTL Equity Investments Corp. (100%), GTL Financial Corp. (100%), Gerdau GTL Spain S.L. (100%), Gerdau MRM Holdings Inc. (100%), Sociedad Industrial Puntana S.A. - SIPSA (72%), Sipar Aceros S.A. (38%), AmeriSteel Corporation (85%), Gerdau USA Inc. (100%), Aço Minas Gerais S.A. - Açominas (52%), Armafer Serviços de Contrução Ltda. (100%), Prontofer Serviços de Construção Ltda. (100%), Gerdau Participações Ltda. (98%), CEA Participações S.A. (99%), Gerdau Internacional Empreendimentos Ltda. - Grupo Gerdau (99%), Açominas Overseas Ltd. (100%), Aço Minas Comércio, Importação e Exportação S.A. (100%), and Laminadora do Sul S.A. (100%).

Following are the principal practices used in preparing the consolidated financial statements: a. Gerdau S.A. and its subsidiaries adopt consistent accounting practices in recording their
operations and evaluating their assets and liabilities. The financial statements of companies located abroad were translated at the exchange rate prevailing on the balance sheet date.
b. Intercompany balances and transactions are eliminated. c. Minority interest in subsidiaries is set forth separately. During the year, the following transactions were carried out: a. On August 30, 2001, 0.45% of the shares of Aço Minas Gerais S.A. - Açominas was acquired
for R$2,080. b. On December 7, 2001, 17.67% of Aço Minas Gerais S.A. - Açominas was auctioned, and the
Company, through its subsidiary Gerdau Participações Ltda., acquired the total offered. To date, only the shareholder Natsteel Brasil Ltda. waived its right to its proportional portion of auctioned shares (based on agreement reached by Açominas shareholders). Other shareholders are required to declare their options no later than February 13, 2002. Accordingly, 13.82% of Açominas capital was considered as acquired for R$333,780.
c. On November 14, 2001, the Company, through its subsidiary AmeriSteel Corporation,
entered into an agreement to purchase operating assets of the Birmingham Southeast steel mill, located in Cartersville, in the State of Georgia, USA, for R$112,533. The definitive purchase was closed at the end of December.
In accordance with article 32 of CVM Instruction No. 247, the financial statements of the jointly controlled subsidiary Sipar Aceros S.A. were consolidated proportionally to the indirect interest of the Company in its capital. The financial statements of Aço Minas Gerais S.A. - Açominas were consolidated proportionally when the ownership interest was 38%, and fully consolidated when the percentage reached 52%. The amounts of the principal assets, liabilities and statements of income of these companies are as follows:
Açominas Sipar 2001 2000 2001 2000 Assets: Current assets 768,431 635,624 75,565 78,370 Noncurrent assets 112,672 31,076 2,730 387 Permanent assets 2,776,251 2,603,241 18,257 29,712 ------------- ------------- --------- ---------- Total assets 3,657,354 3,269,941 96,552 108,469 ======= ======= ===== ====== Liabilities and shareholders’ equity: Current liabilities 791,694 642,523 46,072 25,703 Long-term liabilities 473,145 305,603 4,066 6,878 Shareholders’ equity 2,392,515 2,321,815 46,414 75,888 ------------- ------------- --------- ---------- Total liabilities and shareholders’ equity 3,657,354 3,269,941 96,552 108,469 ======= ======= ===== ======

Açominas Sipar 2001 2000 2001 2000 Statements of income: Net sales 1,027,258 991,302 82,615 96,194 Cost of sales (763,192) (689,273) (68,424) (71,486) Selling expenses (26,520) (29,510) (5,445) (12,576) General and administrative expenses (74,811) (60,007) (4,673) (4,820) Financial expenses (129,824) (60,003) (8,579) (253) Equity in subsidiaries and affiliated companies 14,776 3,892 18 - Other operating income (expenses) (29,173) 39,240 (28) (209) Nonoperating income (expense) (5,589) 3,095 240 (2,065) Provision for income and social contribution taxes 80,239 - (1,050) (1,851) ------------- ----------- --------- ---------- Net income (loss) 93,164 198,736 (5,326) 2,934 ======= ====== ===== ======
Through its direct and indirect subsidiaries, the Company has goodwill and negative goodwill that are amortized based on the realization of the assets which gave rise to them or based on the realization of future income projections, as follows:
2001 2000 Goodwill in investments 276,134 235,947 Goodwill in property, plant and equipment 271,412 282,224 Negative goodwill in property, plant and equipment 312,231 381,564
The equity in subsidiaries and affiliated companies in the consolidated statements of income refers basically to the effect of currency devaluation on foreign investments, which was not eliminated. 5. CASH AND CASH EQUIVALENTS
Company Consolidated 2001 2000 2001 2000 Cash and banks 173 22,344 7,122 25,487 Investment funds 177,227 165,844 295,216 253,352 Fixed-income securities - - 558,906 350,574 Variable-income securities - - 151,578 74,756 ---------- ---------- ------------- ---------- 177,400 188,188 1,012,822 704,169 ====== ====== ======= ======
Of the existing balance, R$556,275 - consolidated (R$407,289 - consolidated in 2000) refer to investments in U.S. dollars.
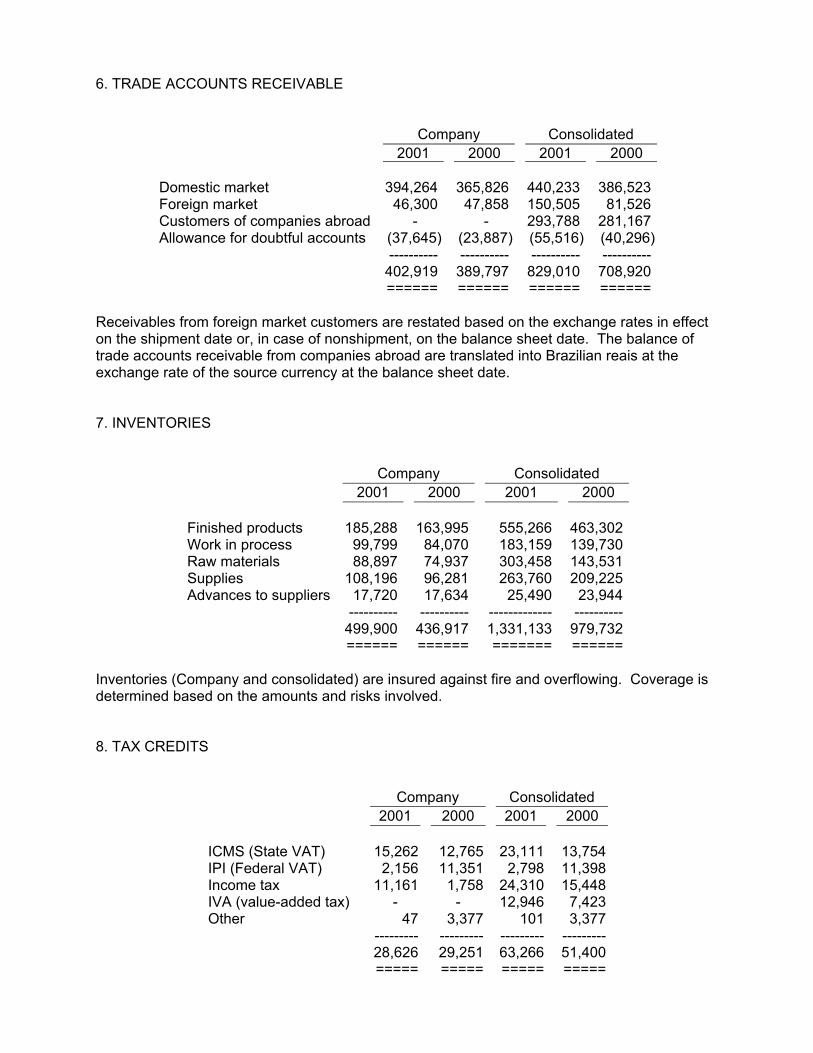
6. TRADE ACCOUNTS RECEIVABLE
Company Consolidated 2001 2000 2001 2000
Domestic market 365,826 440,233 386,523
46,300 47,858 150,505 81,526 Customers of companies abroad - - 293,788 Allowance for doubtful accounts (37,645) (23,887) (40,296) ---------- ---------- ---------- 389,797 829,010 708,920
====== ====== ====== ====== Receivables from foreign market customers are restated based on the exchange rates in effect on the shipment date or, in case of nonshipment, on the balance sheet date. The balance of trade accounts receivable from companies abroad are translated into Brazilian reais at the exchange rate of the source currency at the balance sheet date.
Company 2001 2000 2000
394,264 Foreign market
281,167 (55,516)
---------- 402,919
7. INVENTORIES
Consolidated 2001
Finished products 163,995 555,266 463,302
99,799 84,070 183,159 139,730 Raw materials 88,897 74,937 303,458 Supplies 108,196 96,281 209,225 Advances to suppliers 17,720 25,490 23,944 ---------- ------------- ----------
499,900 436,917 1,331,133 979,732 ====== ====== ======= ======
Inventories (Company and consolidated) are insured against fire and overflowing. Coverage is determined based on the amounts and risks involved.
Company
185,288 Work in process
143,531 263,760
17,634 ----------
8. TAX CREDITS
Consolidated 2000 2001 2001 2000 ICMS (State VAT) 15,262 12,765 23,111 13,754 IPI (Federal VAT) 2,156 11,351 2,798 11,398 Income tax 11,161 1,758 24,310 15,448 IVA (value-added tax) - - 12,946 7,423 Other 47 3,377 101 3,377 --------- --------- --------- --------- 28,626 29,251 63,266 51,400 ===== ===== ===== =====
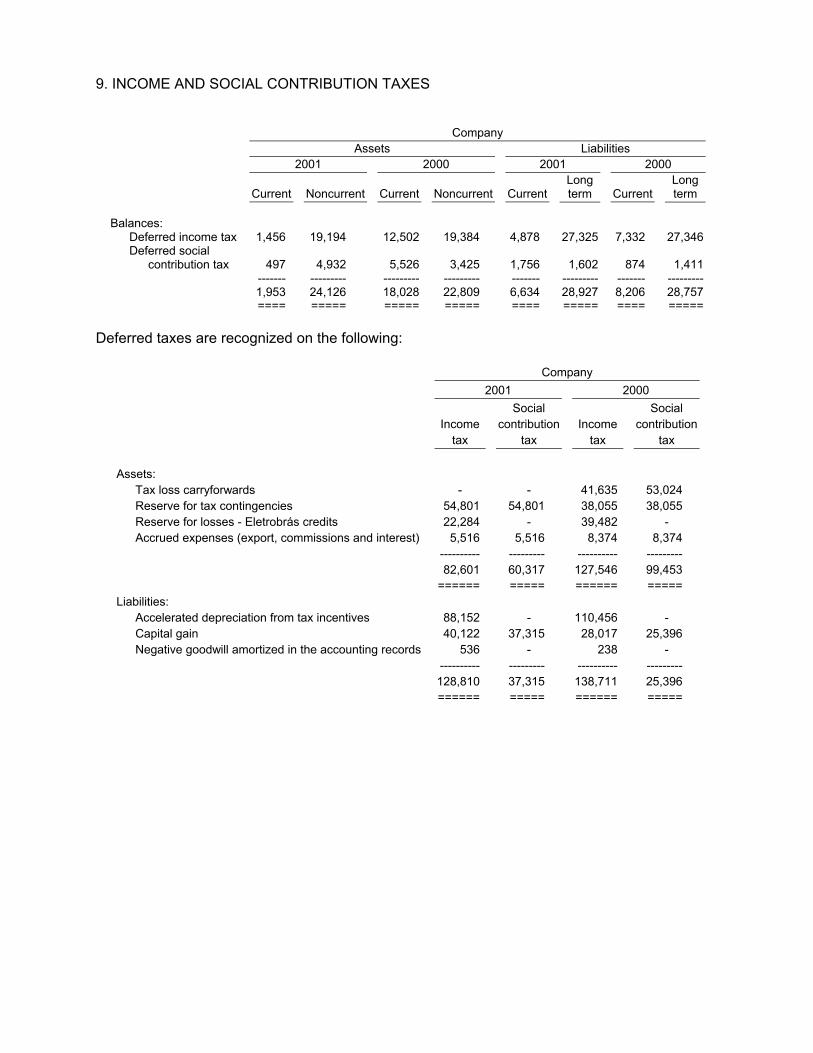
9. INCOME AND SOCIAL CONTRIBUTION TAXES
Company Assets Liabilities 2001 2000 2001 2000
Current Noncurrent Current Noncurrent Current Long term Current
Longterm
Balances: Deferred income tax 1,456 19,194 12,502 19,384 4,878 27,325 7,332 27,346 Deferred social contribution tax 497 4,932 5,526 3,425 1,756 1,602 874 1,411 ------- --------- --------- --------- ------- --------- ------- --------- 1,953 24,126 18,028 22,809 6,634 28,927 8,206 28,757 ==== ===== ===== ===== ==== ===== ==== =====
Deferred taxes are recognized on the following:
Company 2001 2000
Incometax
Social contribution
tax Income
tax
Social contribution
tax Assets: Tax loss carryforwards - - 41,635 53,024 Reserve for tax contingencies 54,801 54,801 38,055 38,055 Reserve for losses - Eletrobrás credits 22,284 - 39,482 - Accrued expenses (export, commissions and interest) 5,516 5,516 8,374 8,374 ---------- --------- ---------- --------- 82,601 60,317 127,546 99,453 ====== ===== ====== ===== Liabilities: Accelerated depreciation from tax incentives 88,152 - 110,456 - Capital gain 40,122 37,315 28,017 25,396 Negative goodwill amortized in the accounting records 536 - 238 - ---------- --------- ---------- --------- 128,810 37,315 138,711 25,396 ====== ===== ====== =====
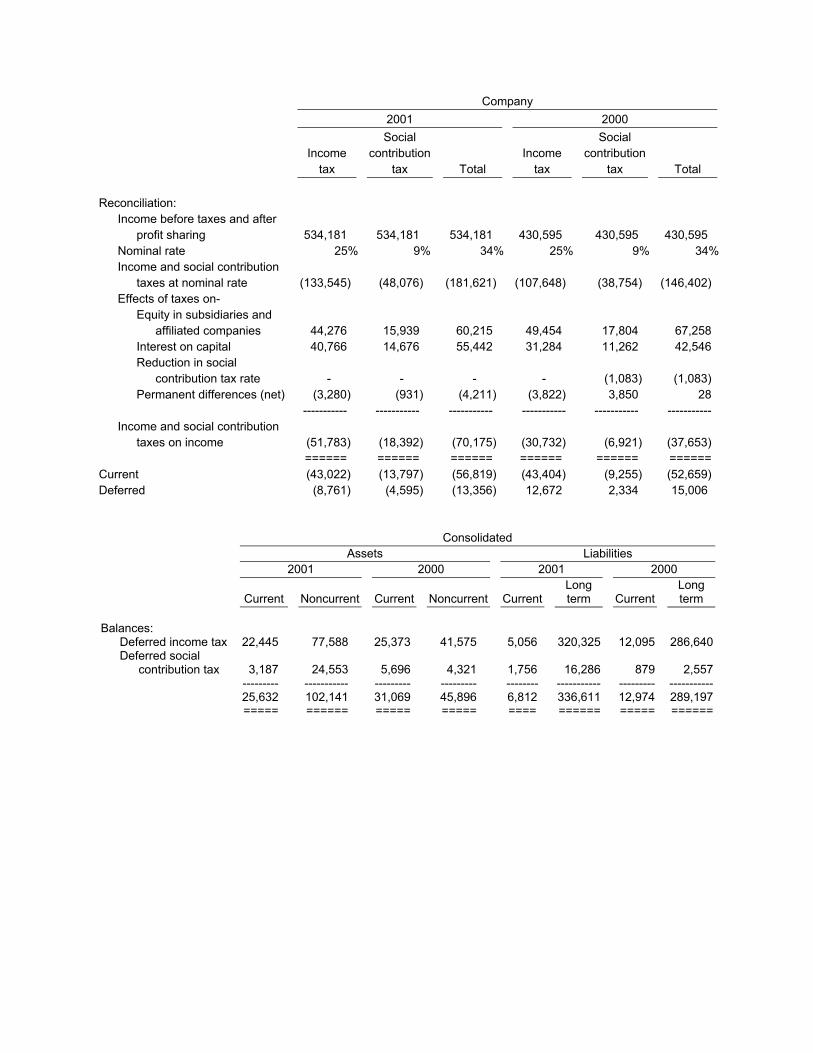
Company 2001 2000
Income tax
Social contribution
tax Total Income
tax
Social contribution
tax Total Reconciliation: Income before taxes and after profit sharing 534,181 534,181 534,181 430,595 430,595 430,595 Nominal rate 25% 9% 34% 25% 9% 34% Income and social contribution taxes at nominal rate (133,545) (48,076) (181,621) (107,648) (38,754) (146,402) Effects of taxes on- Equity in subsidiaries and affiliated companies 44,276 15,939 60,215 49,454 17,804 67,258 Interest on capital 40,766 14,676 55,442 31,284 11,262 42,546 Reduction in social contribution tax rate - - - - (1,083) (1,083) Permanent differences (net) (3,280) (931) (4,211) (3,822) 3,850 28 ----------- ----------- ----------- ----------- ----------- ----------- Income and social contribution taxes on income (51,783) (18,392) (70,175) (30,732) (6,921) (37,653) ====== ====== ====== ====== ====== ====== Current (43,022) (13,797) (56,819) (43,404) (9,255) (52,659) Deferred (8,761) (4,595) (13,356) 12,672 2,334 15,006 Consolidated Assets Liabilities 2001 2000 2001 2000
Current Noncurrent Current Noncurrent Current Long term Current
Long term
Balances: Deferred income tax 22,445 77,588 25,373 41,575 5,056 320,325 12,095 286,640 Deferred social contribution tax 3,187 24,553 5,696 4,321 1,756 16,286 879 2,557 --------- ----------- --------- --------- -------- ----------- --------- ----------- 25,632 102,141 31,069 45,896 6,812 336,611 12,974 289,197 ===== ====== ===== ===== ==== ====== ===== ======

Deferred taxes are recognized on the following:
Consolidated 2001 2000
Incometax
Social contribution
tax Income
tax
Social contribution
tax Assets: Tax loss carryforwards 243,080 246,658 49,311 64,268 Reserve for tax contingencies 103,200 55,946 194,039 39,991 Reserve for losses - Eletrobrás credits 23,648 - 40,917 - Accrued expenses (export, commissions and interest) 5,701 5,701 8,516 8,516 ----------- ----------- ----------- ----------- 375,629 308,305 292,783 112,775 ====== ====== ====== ====== Liabilities: Accelerated depreciation from tax incentives 799,201 50,912 820,384 12,780 Negative goodwill amortized in the accounting records 188,916 149,547 136,444 25,396 ----------- ----------- ----------- ----------- 988,117 200,459 956,828 38,176 ====== ====== ====== ======
Consolidated 2001 2000
Income tax
Social contribution
tax Total Income
tax
Social contribution
tax Total Reconciliation: Income before taxes and after profit sharing 560,479 560,479 560,479 457,394 457,394 457,394 Nominal rate 25% 9% 34% 25% 9% 34% Income and social contribution taxes at nominal rate (140,120) (50,443) (190,563) (114,349) (41,165) (155,514) Effects of taxes on- Rate difference at companies located abroad 4,081 185 4,266 4,426 2,274 6,700 Equity in subsidiaries and affiliated companies 40,074 14,427 54,501 17,463 6,287 23,750 Interest on capital 41,117 14,802 55,919 31,314 11,273 42,587 Reduction in social contribution tax rate - - - - (1,213) (1,213) Recovery of Açominas’ deferred tax assets 62,231 22,403 84,634 18,369 6,613 24,982 Permanent differences (net) (10,404) (12,537) (22,941) (8,728) 8,135 (593) ----------- ----------- ----------- ----------- ----------- ----------- Income and social contribution taxes on income (3,021) (11,163) (14,184) (51,505) (7,796) (59,301) ====== ====== ====== ====== ====== ====== Current (36,746) (14,254) (51,000) (46,021) (9,589) (55,610) Deferred 33,725 3,091 36,816 (5,484) 1,793 (3,691) The variation between asset and liability balances for 2001 compared with 2000 (consolidated) is different from income and social contribution taxes on income, due to the exchange variations on balance sheet accounts of subsidiaries located abroad.

10. COMPULSORY DEPOSITS AND OTHER
Company Consolidated 2001 2000 2001 2000 Compulsory deposits 39,403 37,596 44,016 37,957 Debtors under contract 3,821 13,365 11,316 18,909 ICMS (State VAT) credit balance on purchases of property items 9,472 - 19,261 - Income tax incentives 14,292 12,601 14,632 12,830 Prepaid expenses - - 17,383 16,142 Other - - 27,986 31,222 --------- --------- ---------- ---------- 66,988 63,562 134,594 117,060 ===== ===== ====== ======
11. PROPERTY, PLANT AND EQUIPMENT Company 2001 2000 Annual
depreciationrate - % Cost
Accumulated depreciation
and depletion
Net book value
Net book value
Land, buildings and construction 0 to 4 657,238 (226,695) 430,543 422,665 Machinery, equipment and installations 6 to 10 1,941,971 (1,089,676) 852,295 827,427 Furniture and fixtures 10 36,752 (27,507) 9,245 11,170 Vehicles 20 19,897 (15,034) 4,863 5,721 EDP equipment 20 142,599 (72,168) 70,431 67,978 Construction in progress - 183,828 - 183,828 230,781 Forestation/reforestation - 87,864 (25,568) 62,296 63,899 ------------- ------------- ------------- ------------- 3,070,149 (1,456,648) 1,613,501 1,629,641 ======= ======= ======= =======

Consolidated 2001 2000
Annual depreciation
rate - % Cost
Accumulated depreciation
and depletion
Net book value
Net book value
Land, buildings and construction 0 to 5 2,945,528 (909,810) 2,035,718 1,199,971Machinery, equipment and installations 2 to 10 5,271,514 (2,119,986) 3,151,528 2,121,259Furniture and fixtures 10 102,600 (62,069) 40,531 29,430Vehicles 10 to 20 32,539 (24,386) 8,153 9,415EDP equipment 10 to 20 153,295 (78,397) 74,898 71,210Construction in progress - 403,440 - 403,440 311,165Forestation/reforestation - 128,713 (35,113) 93,600 106,301 ------------- ------------- ------------- ------------- 9,037,629 (3,229,761) 5,807,868 3,848,751 ======= ======= ======= ======= a. Insured Amounts Property, plant and equipment are insured against fire, electrical damages and explosion. Coverage is determined based on the amounts and risks involved. b. Capitalization of Interest and Financial Charges During the year R$6,789 - Company and R$11,796 - consolidated (R$8,699 - Company and R$13,124 - consolidated in 2000) were capitalized. c. Changes in Property, Plant and Equipment Company Consolidated 2001 2000 2001 2000 Balance - beginning of year 1,629,641 1,604,912 3,848,751 3,632,411 Purchases/disposals 151,566 195,652 470,834 382,806 Depreciation and depletion allocated to cost of sales (137,955) (155,301) (328,013) (309,137)Administrative depreciation and depletion (29,751) (15,622) (39,646) (30,946)Increase in equity in consolidated companies - - 1,724,403 22,920 Effect of exchange rates on property items abroad - - 131,539 150,697 ------------ ------------ ------------ ------------ Balance - end of year 1,613,501 1,629,641 5,807,868 3,848,751 ======= ======= ======= =======
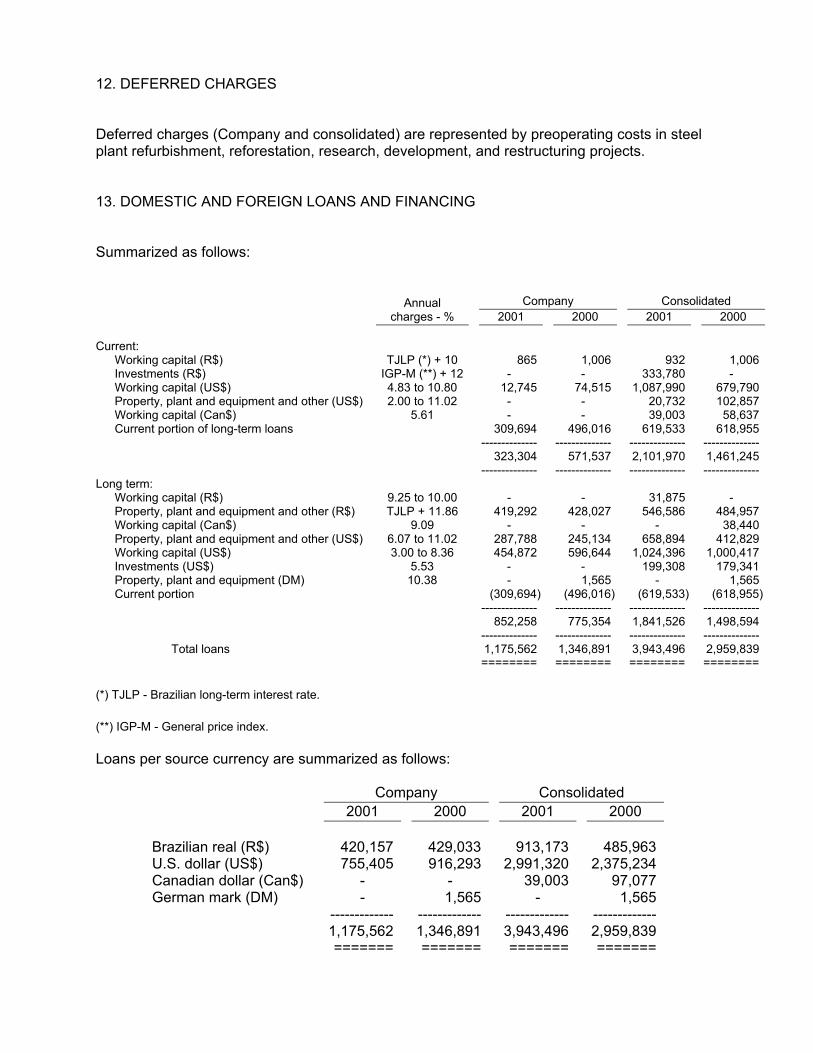
12. DEFERRED CHARGES Deferred charges (Company and consolidated) are represented by preoperating costs in steel plant refurbishment, reforestation, research, development, and restructuring projects. 13. DOMESTIC AND FOREIGN LOANS AND FINANCING Summarized as follows: Annual Company Consolidated charges - % 2001 2000 2001 2000 Current: Working capital (R$) TJLP (*) + 10 865 1,006 932 1,006 Investments (R$) IGP-M (**) + 12 - - 333,780 - Working capital (US$) 4.83 to 10.80 12,745 74,515 1,087,990 679,790 Property, plant and equipment and other (US$) 2.00 to 11.02 - - 20,732 102,857 Working capital (Can$) 5.61 - - 39,003 58,637 Current portion of long-term loans 309,694 496,016 619,533 618,955 -------------- -------------- -------------- -------------- 323,304 571,537 2,101,970 1,461,245 -------------- -------------- -------------- -------------- Long term: Working capital (R$) 9.25 to 10.00 - - 31,875 - Property, plant and equipment and other (R$) TJLP + 11.86 419,292 428,027 546,586 484,957 Working capital (Can$) 9.09 - - - 38,440 Property, plant and equipment and other (US$) 6.07 to 11.02 287,788 245,134 658,894 412,829 Working capital (US$) 3.00 to 8.36 454,872 596,644 1,024,396 1,000,417 Investments (US$) 5.53 - - 199,308 179,341 Property, plant and equipment (DM) 10.38 - 1,565 - 1,565 Current portion (309,694) (496,016) (619,533) (618,955) -------------- -------------- -------------- -------------- 852,258 775,354 1,841,526 1,498,594 -------------- -------------- -------------- -------------- Total loans 1,175,562 1,346,891 3,943,496 2,959,839
======== ======== ======== ======== (*) TJLP - Brazilian long-term interest rate. (**) IGP-M - General price index. Loans per source currency are summarized as follows:
Company Consolidated 2001 2000 2001 2000 Brazilian real (R$) 420,157 429,033 913,173 485,963 U.S. dollar (US$) 755,405 916,293 2,991,320 2,375,234 Canadian dollar (Can$) - - 39,003 97,077 German mark (DM) - 1,565 - 1,565 ------------- ------------- ------------- ------------- 1,175,562 1,346,891 3,943,496 2,959,839 ======= ======= ======= =======

Financed assets were pledged as collateral for FINAME loans. Other loans are secured by the controlling shareholders’ guarantees. Eurobond agreements include covenants limiting the financing amount to four times the Company’s cash generating capacity (EBITDA). In the agreement with the BNDES covering the financing for the increase in ownership interest in Açominas, covenants limit the financing amount to five times EBITDA. Prepayment transactions include covenants limiting the financing amount to four times the Company’s EBITDA. Subsidiaries Gerdau Courtice Steel Inc. and Gerdau MRM Steel Inc. have revolving credit lines in the amount of Can$208 million, with rates which approximate market rates for first line customers plus 2.25% per year. Subsidiary GTL Financial Corp. has a credit line involving U.S. commercial paper in the amount of US$140 million at LIBOR plus 1.6% per year, with covenants limiting the financing amount to four times the Company’s EBITDA. Subsidiary AmeriSteel Corporation has revolving credit lines in the amount of US$285 million, with interest of 6.3% per year. For all covenants described above, the penalty for noncompliance is the acceleration of loan maturities. EBITDA which is the basis for measurement is for the consolidated. Maturities of the long-term portion are as follows:
Company Consolidated In 2003 229,754 577,559 In 2004 427,737 639,539 In 2005 72,292 378,834 In 2006 50,297 144,769 In 2007 15,157 40,124 After 2007 57,021 60,701 ----------- ------------- 852,258 1,841,526 ====== =======

14. DEBENTURES
General Shareholders’ Quantity Annual
Issue Meeting Issued In treasury
Maturity rate - % 2001 2000
Issue: 3rd - A and B 05.27.82 48,000 29,979 06.01.2011 16.95 46,967 42,364 4th 06.10.83 42,000 42,000 02.28.2012 16.95 - - 5th 11.29.89 29,986 - 12.05.2005 TR (*) + 8 18,832 23,003 7th 07.14.82 22,800 18,155 07.01.2012 16.95 14,691 13,631 8th 11.11.82 59,988 39,196 05.02.2013 16.95 40,613 39,861 9th 06.10.83 41,880 11,578 09.01.2014 16.95 100,426 88,921 10th 02.27.81 6,450 6,450 11.30.2015 16.95 - - 11th - A and B 06.29.90 50,000 43,320 06.01.2020 16.95 14,471 18,582 ----------- ----------- 236,000 226,362 Company: ====== ====== Seiva S.A. - Florestas e Indústrias
11.11.81 12,000 12,000 11.01.2015 Not determined
- -
Debentures held by consolidated affiliated companies
(12,726) - ----------- ----------- Consolidated 223,274 226,362 Current portion - Company and consolidated
(4,683) (4,719)
----------- ----------- Long-term portion - consolidated 218,591 221,643 ====== ====== (*) TR - Brazilian reference rate. On November 23 and 27, 2001 respectively, the Shareholders’ Meeting and the Board of Directors’ Meeting of the Company approved an issue of nonconvertible subordinated debentures, in the amount of R$300 million. The request for registration for public distribution has been filed with CVM. These debentures include covenants limiting the consolidated gross debt to four times EBITDA; in case of noncompliance, the penalty is accelerated maturity. 15. FINANCIAL INSTRUMENTS a. General Considerations The Company and its subsidiaries have contracted financial instruments, the risks of which are managed through financial position strategies and exposure limit control systems. All transactions are fully recorded in the books and restricted to the following instruments:
Temporary cash investments - recorded at their redemption value on the balance sheet date, and are presented in Note 5.
•

Investments and loans between subsidiaries and related parties - are presented in Note 3(d) and in the investments schedule (attachment to same Note), respectively.
•
•
•
•
Loans and financing - are presented in Note 13.
Debentures - are presented in Note 14.
Financial derivatives - the Company, aiming at minimizing the effect of exchange rate variations on its liabilities, has contracted swap transactions, which were translated into Brazilian reais on the contract date, and are linked to CDI (Interbank deposit rates). Swap contracts are as follows:
Company and consolidated
Contract date Description Amount
(US$000) In proportion to CDI - % Maturity
02.12.2001 Eurobonds 50,000 84.5 05.20.2004 02.12.2001 Eurobonds 50,000 87.0 05.20.2004 07.18.2001 Eurobonds 30,000 103.7 05.20.2004 03.30.2001 Imports 9,515 100.0 10.04.2004 10.04.2001 Imports 32,556 100.0 06.25.2002 12.05.2001 Imports 12,559 100.0 12.23.2002 07.16.2001 Prepayment 30,710 80.3 03.01.2006 07.18.2001 Prepayment 10,236 92.8 03.01.2006
b. Market Value Market values of financial instruments are as follows:
Company 2001 2000 Book
value Market value
Book value
Market value
Temporary cash investments 177,227 177,227 165,844 165,844 Eurobonds 291,386 294,111 454,806 454,677 Other loans and financing 884,176 884,176 892,085 892,085 Debentures 236,000 236,000 226,362 226,362 Investments 1,759,939 1,759,939 1,600,614 1,600,614 Affiliated companies (assets) 33,595 33,595 18,422 18,422
Consolidated 2001 2000 Book
value Market value
Book value
Market value
Temporary cash investments 1,005,700 1,005,700 678,682 678,682 Eurobonds 65,044 73,428 189,423 186,139 Other loans and financing 3,878,452 3,878,452 2,770,416 2,770,416 Debentures 223,274 223,274 226,362 226,362 Investments 310,595 310,595 280,215 280,215 Affiliated companies 28,093 28,093 17,094 17,094

Eurobond market value was determined based on the quotation of the bond in the secondary money market. Except for Eurobond financing, the other financial instruments, which are recorded in the books at their contracted net value, do not have an active market that permits such comparison. 16. TAXES AND SOCIAL CHARGES PAYABLE
Company Consolidated 2001 2000 2001 2000 Withholding income tax 10,890 6,483 11,348 9,387 Income and social contribution taxes 19,291 - 20,463 - Tax on billing 8,922 6,926 9,249 7,064 Social charges on payroll 16,303 15,136 17,080 15,994 ICMS (State VAT) 12,931 12,057 16,386 12,451 IPI (Federal VAT) 1,768 2,601 1,809 2,568 Other 12,386 11,339 12,124 11,428 --------- --------- --------- --------- 82,491 54,542 88,459 58,892 ===== ===== ===== =====
17. REFIS On December 6, 2000, the Company opted for the Federal Government’s Tax Recovery Program (REFIS), to pay PIS and COFINS (taxes on revenue) liabilities in installments. These tax liabilities were recorded in the reserve for contingencies, in long-term liabilities. After the option for REFIS, the balances were classified in taxes payable, in current liabilities, and other payables in long-term liabilities. Renegotiated taxes, which are payable in 60 monthly installments, are as follows:
Company Principal Interest Total PIS 28,224 5,252 33,476 COFINS 6,568 1,379 7,947 --------- ------- --------- Total 34,792 6,631 41,423 ===== ==== ===== Current portion 10,183 1,941 12,124 Long-term portion 24,609 4,690 29,299 --------- ------- --------- Total 34,792 6,631 41,423 ===== ==== =====
The Company has made regular payments of taxes, contributions and other obligations. Such payments are a basic condition for maintaining REFIS payment terms.

This transaction was guaranteed by a lien on land and buildings, in the total amount of R$78,494, located at the Company’s unit in the municipality of Charqueadas, State of Rio Grande do Sul, where the Piratini specialty steel mill is located. Total tax credits for income and social contribution taxes from third parties offset against fines and interest upon the consolidation of debts under REFIS, on December 6, 2000, amounted to R$57,040, for which R$4,351 was paid for such credits. The Company did not use its own tax credits. The net charge to the Company’s income in 2000, arising from the option for REFIS, was R$6,338. 18. RESERVE FOR CONTINGENCIES The Company is a party to labor, civil and tax lawsuits. Based on the opinion of legal counsel, management believes that the reserve for contingencies is sufficient to cover probable losses reasonably estimated, arising from unfavorable court decisions, and that the final decisions will not have significant effects on the Company’s financial position as of December 31, 2001.
Company Consolidated 2001 2000 2001 2000 Tax 90,080 96,986 99,184 103,120 Labor 14,203 15,313 23,884 19,046 Civil 381 208 6,612 2,543 ----------- ----------- ----------- ----------- Total 104,664 112,507 129,680 124,709 ====== ====== ====== ======
19. SHAREHOLDERS’ EQUITY a. Capital As of December 31, 2001 and 2000, authorized capital is represented by 240,000,000,000 common shares and 480,000,000,000 preferred shares, all without par value, in accordance with the change approved by the Extraordinary Shareholders’ Meeting on April 28, 2000. As of December 31, 2001 and 2000, subscribed paid-up capital is represented by 39,382,020,386 common shares and 74,109,685,986 preferred shares, totaling R$1,320,133. Preferred shares are nonvoting and cannot be redeemed, but are entitled to a share in profits 10% more than the common shares.

b. Interest on Capital The Company calculated interest on capital in accordance with the limits established by Law No. 9,249/95. For tax purposes, the respective amount was accounted for as financial expense. For reporting purposes, the amount was treated as dividends, thus not affecting income. Interest on capital (R$164,186) was credited to shareholders in place of statutory dividends (30%), as follows:
2001 2000 Net income 464,006 392,942Realization of unrealized profit reserve on equity pick-up 20,455 8,212Recognition of legal reserve (23,201) (19,647) ----------- -----------Adjusted net income 461,260 381,507 ====== ======Interest on capital 1st semester - common shares 15,674 14,689Interest on capital 1st semester - preferred shares 32,445 30,407Interest on capital 2nd semester - common shares 37,807 26,071Interest on capital 2nd semester - preferred shares 78,260 53,967 ----------- -----------Interest on capital 164,186 125,134 ====== ======Interest paid or credited - % 36 33Per thousand common shares 1st semester - R$ 0.3980 0.3730Per thousand preferred shares 1st semester - R$ 0.4378 0.4103Per thousand common shares 2nd semester - R$ 0.9600 0.6620Per thousand preferred shares 2nd semester - R$ 1.0560 0.7282
The realization of the unrealized profit reserve on the equity pick-up is based on investments sold and dividends received. The remaining net income was allocated to the statutory reserve for investments and working capital, as established by the bylaws. 20. STATUTORY PARTICIPATION Management’s participation is limited to 10% of net income after income tax and to the amount of their regular compensation.

21. POSTRETIREMENT BENEFITS a. Pension Plan - Defined Benefit The Company and other subsidiaries of the Gerdau Group in Brazil co-sponsor defined benefit pension plans, which substantially include all employees in Brazil (“Gerdau Plan” and “Açominas Plan”). Additionally, the Canadian and U.S. subsidiaries sponsor defined benefit plans (“Canadian Plan” and “American Plan”) including substantially all of their employees. In addition to the pension plan, the American Plan provides for specific health care benefits to retired employees, as long as these employees retire after a certain age, and after a specific number of years of service. The U.S. subsidiary has the right to change or eliminate such benefits. Contributions are based on amounts calculated on an actuarial basis. The Gerdau Plan is managed by Gerdau - Sociedade de Previdência Privada, an entity established by the Gerdau Group for this purpose. Plan assets for the Gerdau Plan consist of investments in bank CDs, securities, and investment funds. The Açominas Plan is managed by Fundação Açominas de Seguridade Social - Aços, a private pension entity established by Açominas for this specific purpose. The Canadian and U.S. plans are managed by Royal Trust/Great West Life and Wells Fargo, respectively. The total cost of pension plans of this type amounted to R$2,374 in 2001 and R$1,470 in 2000 for the Company, and R$18,003 in 2001 and R$13,031 in 2000 for the consolidated. The current expenses for defined benefit pension plans are composed as follows:
Company Consolidated 2001 2001 2000 Current service cost - 11,374 8,132 Interest cost - 25,203 19,704 Return on plan assets - (28,307) (22,433) Amortization of past service cost - 400 - Amortization of gain (loss) - 21 205 Amortization of unrecognized transition obligation - (81) (68) --- --------- --------- Net cost of pension plans - 8,610 5,540 == ===== =====

Reconciliation of the plan assets and liabilities is as follows:
Company Consolidated 2001 2001 2000 Total liabilities (125,833) (785,920) (289,203)Fair value of plan assets 132,676 816,002 276,540Balance of assets (liabilities) 6,843 30,082 (12,663)Unrecognized gains (losses) - 42,875 (6,361)Past service cost - (515) (503)Other - (477) (372) ----------- ----------- -----------Total assets (liabilities), net 6,843 71,965 (19,899) ====== ====== =======Actuarial assets 6,843 105,012 3,904Pension plan liabilities recognized in the balance sheet - (33,047) (23,803) ----------- ----------- -----------Assets (liabilities), net 6,843 71,965 (19,899) ====== ====== =======
Changes in plan assets and actuarial obligations were as follows:
Company Consolidated 2001 2001 2000 Benefit obligation: Benefit obligation at beginning of year - 339,060 259,826 Cost of service - 11,374 8,132 Interest cost - 25,203 19,704 Actuarial loss - 19,904 15,464 Payment of benefits - (16,881) (13,922) Adjustment for recognition of initial obligation 125,833 407,260 - ---------- ----------- -----------Benefit obligation at end of year 125,833 785,920 289,204 ====== ====== ======
Company Consolidated 2001 2001 2000 Plan assets: Fair value of plan assets at beginning of year - 323,730 265,237 Return on plan assets - (2,619) 22,744 Employees’ contributions - 4,236 2,481 Payments of benefits - (16,881) (13,922) Adjustment for recognition of beginning balance of plan assets 132,676 507,536 - ---------- ----------- -----------Fair value of plan assets at end of year 132,676 816,002 276,540 ====== ====== ======

The following is a summary of assumptions adopted for calculation and recording of the defined benefit component of the plans, both for the Company and consolidated:
% Gerdau
Plan Açominas
Plan Canadian
Plan American
Plan Average discount rate 9.73 10.24 7.00 7.25 Salary increase rate 8.68 7.75 2.50 - 4.00 4.50 Expected rate of return on assets 9.73 10.24 7.00 - 7.50 9.25
b. Defined Contribution Pension Plan The Company also co-sponsors a defined contribution pension plan, managed by Gerdau - Sociedade de Previdência Privada. Contributions are calculated based on a percentage of employees’ salaries. Total cost of this plan was R$1,492 in 2001 and R$1,194 in 2000 for the Company, and R$1,536 in 2001 and R$1,226 in 2000 for the consolidated. Subsidiaries located abroad do not have defined contribution pension plans. c. Retirement and Termination Benefits The Company estimates that it will pay R$13,331 (Company and consolidated) related to indemnities to executives upon retirement or termination. The accrued amount has been charged to “prior-year adjustments” in shareholders’ equity, as provided for by article 84 of CVM Resolution No. 371 of December 13, 2000. Considering all types of benefits to employees granted by the Company, the status of assets and liabilities as of December 31, 2001 is as follows:
Company Consolidated 2001 2001 2000 Pension plan liabilities - defined benefit - 33,047 23,803 Retirement and termination benefit liabilities 13,331 13,331 - --------- --------- --------- Total actuarial liabilities 13,331 46,378 23,803 Actuarial assets 6,843 105,012 3,904

22. INFORMATION BY GEOGRAPHIC AREA AND BUSINESS SEGMENT
Consolidated South North Brazil America (*) America 2001 2000 2001 2000 2001 2000 Geographic area: Gross sales 4,531,284 4,007,348 331,177 282,937 2,221,140 1,936,194 Net sales 3,557,515 3,148,822 271,169 247,127 2,059,719 1,800,149 Cost of sales (2,237,802) (2,131,478) (197,605) (181,318) (1,799,739) (1,545,068) Gross profit 1,319,713 1,026,344 73,564 65,809 259,980 246,081 Selling expenses (225,800) (188,518) (14,503) (11,738) (24,387) (19,731) Financial expenses, net (322,219) (273,043) (54,047) (27,233) (123,629) (88,693) General and administrative expenses (324,167) (267,794) (16,684) (20,759) (128,794) (109,671) Income from operations 603,869 433,090 (11,112) 4,281 (19,359) 20,862 Net income 511,990 374,250 3,121 2,387 31,184 21,456 EBITDA (**) 1,002,036 755,333 58,616 49,984 249,308 254,789
(*) Brazil not included. (**) Income before financial expenses, taxes on income, and depreciation and amortization.
Company Consolidated 2001 2000 2001 2000 Gross sales per market: Domestic market 3,689,687 3,311,738 3,922,934 3,508,005 Foreign market 258,186 272,102 523,138 499,343 Companies located abroad - - 2,637,529 2,219,131 -------------- -------------- -------------- -------------- 3,947,873 3,583,840 7,083,601 6,226,479 ======== ======== ======== ========
Company Consolidated 2001 2000 2001 2000 Gross sales per business segment: Civil construction 1,638,367 1,502,772 3,186,447 2,793,867 Industry 1,887,083 1,582,748 3,447,921 2,910,347 Other 422,423 498,320 449,233 522,265 -------------- -------------- -------------- -------------- 3,947,873 3,583,840 7,083,601 6,226,479 ======== ======== ======== ========

23. ARGENTINEAN PESO DEVALUATION A loss of R$43,026 (R$49,689 - consolidated) was recognized, related to the devaluation of the Argentinean peso in relation to the U.S. dollar and Brazilian real. Of this amount, R$23,116 (Company and consolidated) refers to loss on investments that the Gerdau Group holds in two units in Argentina, and R$19,910 (R$26,573 - consolidated) refer to the increase in the Argentinean units’ financial expenses, arising from restatement of liabilities indexed to the U.S. dollar. This loss was calculated based on a 70% devaluation of the Argentinean peso in relation to the U.S. dollar and Brazilian real. 24. EXPLANATION ADDED FOR TRANSLATION TO ENGLISH The accompanying financial statements are presented on the basis of accounting practices emanating from corporate law in Brazil. Certain accounting practices applied by the Company and its subsidiaries that conform with those accounting practices in Brazil may not conform with generally accepted accounting principles in the countries where these financial statements may be used.
* * * * * * * * * * * *

Attachment to Note 3(d) 1/4
GERDAU S.A.
INVESTMENTS IN SUBSIDIARIES AND AFFILIATES
(In thousands of Brazilian reais)
(Translation of the original in Portuguese)
A. INVESTMENTS
Company 2001 2000
Deposit for future
Investment capital increase Total Total
Subsidiaries: Gerdau Internacional Empreendimentos Ltda. (*) 1,011,291 27,000 1,038,291 726,679 Seiva S.A. - Florestas e Indústrias - - - 18,081 Itaguaí Comércio, Importação e Exportação Ltda. - - - 277,436 Gerdau Participações Ltda. (**) 516,874 3,720 520,594 526,519 Armafer Serviços de Construção Ltda. 139,942 28,800 168,742 21,454 Other 14,574 3,957 18,531 16,910
-------------- --------------1,746,158 1,587,079
Other investments 13,781 13,535-------------- --------------1,759,939 1,600,614======== ========
(*) Company holding investments in companies located abroad. (**) Company holding interest in Açominas.

Attachment to Note 3(d) 2/4
Consolidated 2001 2000 Investment Goodwill Total Total
AmeriSteel Corporation - 276,134 276,134 236,873MRS Logística S.A. 4,050 - 4,050 4,050Dona Francisca Energética S.A.
14,531 - 14,531 14,531
Partnerships 9,567 - 9,567 9,542Other investments
6,313 - 6,313 15,219 ----------- ----------- 310,595 280,215 ====== ======
B. DATA ON INVESTMENTS Company - 2001
Equity in subsidiaries
NetShareholders’ and affiliated Sharequotas% Capital equity income companies ownership held Subsidiaries:
Gerdau Internacional Empreendimentos Ltda. 370,654 1,018,314 65,749 8,718 99.31 368,097,438 Seiva S.A. - Florestas e Indústrias 74,280 134,487 30,655 3,106 - - Itaguaí Comércio, Importação e Exportação Ltda. 3,596 72,690 74,850 67,559 - - Gerdau Participações Ltda. 422,266 574,453 62,205 55,902 89.98 379,941,045 Armafer Serviços de Construção Ltda. 97,894
139,942
41,353
41,375 100.00
97,894,269
Other - - - 443 - - ----------- 177,103 ======
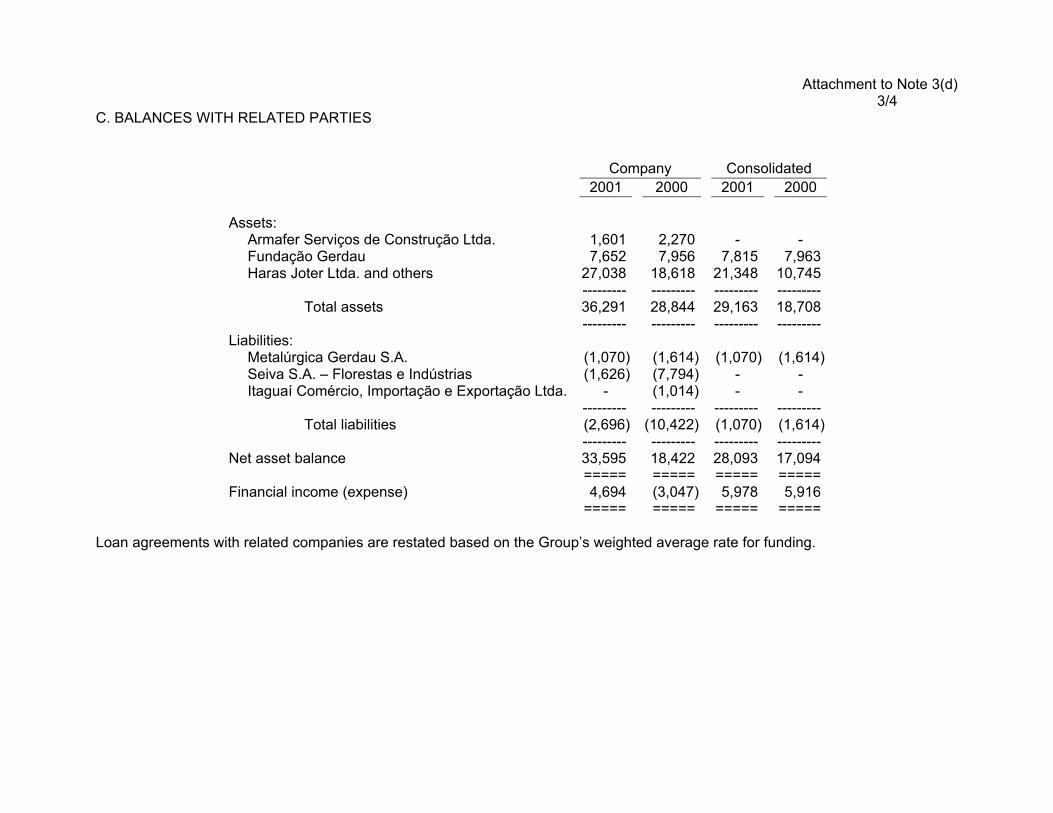
Attachment to Note 3(d) 3/4
C. BALANCES WITH RELATED PARTIES
Company Consolidated 2001 2000 2001 2000
Assets: Armafer Serviços de Construção Ltda. 1,601 2,270 - - Fundação Gerdau 7,652 7,956 7,815 7,963 Haras Joter Ltda. and others
27,038 18,618 21,348 10,745 --------- ------------------ ---------
Total assets 36,291 28,844 29,163 18,708--------- ---------
--------- ---------
Liabilities: Metalúrgica Gerdau S.A. (1,070) (1,614) (1,070) (1,614) Seiva S.A. – Florestas e Indústrias (1,626) (7,794) - - Itaguaí Comércio, Importação e Exportação Ltda.
- (1,014) - - --------- ------------------ ---------
Total liabilities
(2,696) (10,422) (1,070) (1,614)--------- ------------------ ---------
Net asset balance 33,595 18,422 28,093 17,094 ===== ========== =====
Financial income (expense)
4,694 (3,047) 5,978 5,916 ===== ========== =====
Loan agreements with related companies are restated based on the Group’s weighted average rate for funding.

Attachment to Note 3(d) 4/4
D. TRANSACTIONS WITH RELATED PARTIES Company 2001 2000
Accounts Accounts Accounts Accounts Sales Purchases receivable payable Sales Purchases receivable payable
Armafer Serviços de Construção Ltda. 12 - - - 1,524 - 21 - Seiva S.A. - Florestas e Indústrias - - - - - - 5 - Aço Minas Gerais S.A. - Açominas 137 113,328 - 7,351 181 47,831 31 262 Sociedad Industrial Puntana S.A. - SIPSA 592 - 29 - 854 - 193 - Gerdau Laisa S.A. 4,689 - 632 - 4,451 - 266 - Gerdau Aza S.A. 3,639 - 398 - 1,775 - - - Sipar Aceros S.A. 19,015 - 4,026 - 11,408 - 1,165 -
Purchases and sales of raw materials and products are conducted under the same conditions and terms as transactions with unrelated parties.
* * * * * * * * * * * *