germany's photovoltaic cluster - institute for strategy and
TRANSCRIPT

PED‐329
Microeconomics of Competitiveness: Firms, Clusters and Economic Development
Germany’s Photovoltaic Cluster
Authored by Kareen El‐Beyrouty
Adilet‐Sultan Meimanaliev
Lilit Petrosyan
Diva Singh
Professor Michael Porter
Section Advisor Dr. Christian Ketels
Harvard University
May 2009

TABLE OF CONTENTS
1. COUNTRY ANALYSIS .......................................................................................................................... 1
1.1 Overall Economic Performance .................................................................................................. 1
1.2 National Business Environment .................................................................................................. 7
1.3 National Level Recommendations for the German Government ............................................ 11
2. PHOTOVOLTAIC CLUSTER ANALYSIS ............................................................................................... 12
2.1 Overview of German Photovoltaic Cluster ............................................................................... 12
2.2 Photovoltaic Technology .......................................................................................................... 14
2.3 Photovoltaic Value Chain .......................................................................................................... 15
2.4 Cluster Map .............................................................................................................................. 17
2.5 Key Success Factors for Development of the Cluster ............................................................... 20
2.6 Challenges for the Cluster Going Forward ............................................................................... 25
2.7 Recommendations for Continued Success of the Cluster ........................................................ 28

1
1. COUNTRY ANALYSIS
1.1 Overall Economic Performance
The German economy is the fifth largest economy in the world in PPP terms (US $2.7 trillion in
20081) and the leading economy in Europe. In 2007, services constituted 69.5 percent of GDP;
industry and construction, 29.6 percent; and agriculture, the remaining 0.9 percent.2
Figure 1. GDP growth in Germany
Source: EIU data.
Strong growth in 2007 led unemployment in 2008 to fall below 7.8 percent,3 the lowest level since
the reunification of Eastern and Western Germany.4 With 1.3 percent annual growth in 2008, 5
however, the economy began to contract in the second quarter due to the strong euro, high oil
1 EIU data. 2 Library of Congress, Federal Research Department, April 2008. 3 EIU data. 4 Modernization and integration of the Eastern German economy continues to be a long‐term process. 5 CIA data.
‐4.00
‐3.00
‐2.00
‐1.00
0.00
1.00
2.00
3.00
4.00
5.00
1999 2000 2001 2002 2003 2004 2005 2006 2007 2008 2009
Real Change in GDP (%)
EU
OECD
Germany

2
prices, tighter credit markets, and slowing growth abroad. The German economy is predicted to
contract by 6 percent in 2009.6
There is a GDP per capita gap between states in East and West Germany, with East German states
having a lower GDP per capita on average. East German states, however, are growing faster than
West German states with the help of government incentives packages to encourage investment in
the region.
Table 1. German Lander Nominal GDP Per Capita for PV Module Producing States
Region Lander 2008 5 Year Growth East Brandenburg 21,721 € 19.26% East Thuringia 21,875 € 20.05% East Saxony 22,620 € 17.89% East Saxony-Anhalt 22,427 € 23.46% East Mecklenburg-Vorpommern 21,439 € 19.73% West North Rhine-Westphalia 30,113 € 15.49% West Bavaria 35,530 € 15.37% West Baden Wurttemburg 33,876 € 14.75%
Germany Average -- 30,343 € 15.72%
Source: Statistical offices of the Lander and the Federal Statistical Office.
Budgetary Policy
From a budget deficit of about 4 percent of GDP in 2004, the economy reached balance in 2007.7 A
substantial policy effort contributed to a structural adjustment of about 3 percent of GDP between
2003 and 2007.8 Much of this adjustment reflected cuts in discretionary, aging, and welfare
expenditures. The adjustment continued in 2007 with the VAT hike, a reduction in the deductibility
of interest income, expenditure restraint, and an increase in healthcare premiums.9 However,
6 Financial Times, “World in Recession: Berlin expects 6% contraction but snubs call for new stimulus,” 30 April 2009, Asia Ed 1. 7EIU data. 8 IMF country report, February 2008. 9 Ibid.

3
recent developments have led the government to revise fiscal policy with more countercyclical
measures.
Domestic Demand
Even though consumers are feeling considerable relief from the recent oil price fall, hopes for a
noticeable boost to consumption did not become reality. Wages rose in 2008 about 3 percent, in
accordance with collective agreements.10 However, there are substantial job losses in the course of
the recession and a rising savings ratio.
Figure 2. Germany’s export market share
Source: WEO, OECD, Direction of Trade Statistics, and IMF staff calculations.
German external performance
The export sector’s performance has been strong and the country’s growth is being carried by net
exports, while the domestic consumption remains weak. Improving competitiveness, rising external
demand, and favorable trade linkages helped exporters to build market share. Exports of goods rose
10 Federal Ministry of Economics and Technology, Annual Economic Report 2008.

4
by more than 50 percent in real terms since the euro’s inception in 1999.11 Germany has been
world’s number one exporter since 2003. The current‐account surplus has remained large at more
than 5 percent of GDP since 200412, following deficits in the 1990s.13 This turnaround in the current
account is the reflection of steady improvements in the trade balance, especially within the EU.
Figure 3. Exports Portfolio by Cluster, 1997‐2007
In 2008, exports amounted to 47.2 percent of GDP, while imports were 40.9 percent. Germany's
most important market is the European market14: European countries are the destination of 74
percent of German exports, while other European countries are the source of 71 percent of German
imports.15 An immediate neighbor, France is its most important trading partner, accounting for 9.6
11 IMF Country Report, December 2006. 12 EIU data 13 EIU data. 14 Ibid. 15 German Federal Ministry of Economics and Technology.

5
percent of German exports in 2006.16 The United States ranks second at 8.7 percent.17 Of
Germany's ten leading trading partners, which together account for about two thirds of Germany's
foreign trade, only three ‐ the United States, Japan and China ‐ are located outside Europe.
Germany has strengthened its already strong position in the world. Most German clusters have
grown and substantially increased their shares in the world export market between 1999 and 2007
(Figure 3).
In terms of foreign direct investment, Germany is a very attractive place. In 2008, it attracted EUR
460 billion and had operations of 45,000 foreign companies, including the world’s 500 largest
corporations.18
Table 2. Unemployment rate in Germany in 2003 (in percent)
Unemployment
The distribution of Germany’s workforce by sector has the following structure: agriculture 2.2
percent; industry 25.5 percent; and service, 72.3 percent, with total 39.1 million participants.19
Unemployment remains in double digits in some states in the East, where high wages are not
16 Ibid. 17 Ibid. 18 GTAI (2009) web‐site: http://www.gtai.com/homepage/germany‐at‐a‐glance/facts‐figures/our‐economy/?backlink=0 [Accessed in May 2009]. 19 Library of Congress, Federal Research Department, April 2008.

6
matched by productivity. Germany’s stagnation is widely viewed as a structural problem with its
roots in the labor market. Overregulation has prevented the domestic economy from absorbing
quickly the labor shed by the export sector. Wage rigidities and high reservation wages remain
important impediments to employment creation, despite significant reforms. Given high labor costs
and wage rigidities, companies stepped up their purchases of intermediate inputs from cheaper
(mostly foreign) suppliers (outsourcing) and, at times, shifted entire production lines to lower‐cost
counties (off‐shoring). As a result, high unemployment is an important problem in the German
economy and fighting it has been a central focus of the government’s reforms. Germany’s labor
market problems are concentrated in unemployment in the East, unemployment and non‐
participation among older workers nation‐wide, and nonparticipation among women—particularly
in the West—and young people.

7
1.2 National Business Environment
Figure 4 summarizes the strengths and weaknesses of the national diamond.
Figure 4. National Diamond Analysis
Source: Authors’ analysis.
Factor Conditions
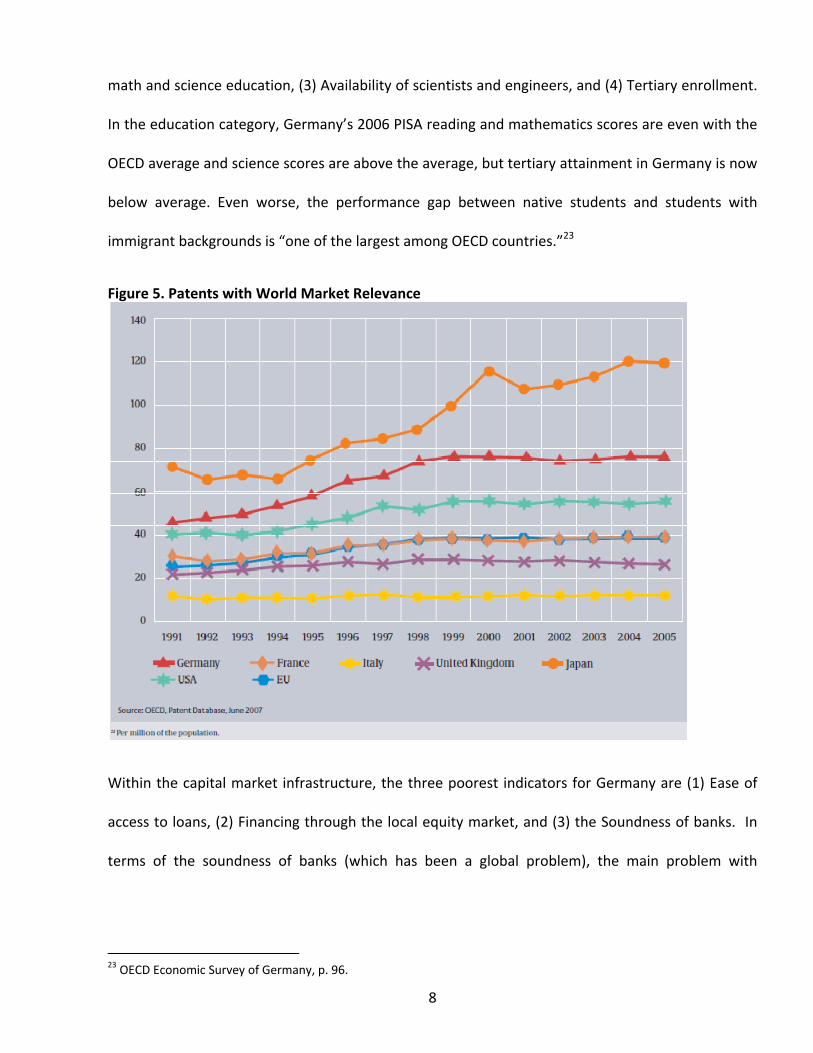
In terms of broad positive factor conditions, Germany has very high quality logistical and
communications infrastructure. Germany has ranked second in the global ranking list for the
number of patents per capita. Germany spends 2.5 percent of GDP20 on research and development
(R&D), which is quite a high level worldwide, though it is still less than in Japan and the US.
Apart from patents, the three broad areas where Germany is above its competitiveness rankings
based on purchasing power parity‐adjusted GDP per capita21 are administrative infrastructure,
capital market infrastructure, and innovation infrastructure.22 Within innovation infrastructure, four
targets that need the most improvement are (1) Quality of the educational system, (2) Quality of
20 World Development Indicators. 21 Above means doing poorly. 22 Rankings in 2008 Global Competitiveness Report.
8
math and science education, (3) Availability of scientists and engineers, and (4) Tertiary enrollment.
In the education category, Germany’s 2006 PISA reading and mathematics scores are even with the
OECD average and science scores are above the average, but tertiary attainment in Germany is now
below average. Even worse, the performance gap between native students and students with
immigrant backgrounds is “one of the largest among OECD countries.”23
Figure 5. Patents with World Market Relevance
Within the capital market infrastructure, the three poorest indicators for Germany are (1) Ease of
access to loans, (2) Financing through the local equity market, and (3) the Soundness of banks. In
terms of the soundness of banks (which has been a global problem), the main problem with
23 OECD Economic Survey of Germany, p. 96.

9
German banks is the €816 billion of toxic assets the Landesbanken (State Banks) hold.24 In response,
the German federal government is offering to create a bad bank to buy up the toxic assets provided
that the banks agree to consolidate the state‐owned banking sector.25 Small and medium‐sized
businesses are the driving force of the German economy. The roughly 3.5 million small and
medium‐sized companies and self‐employed persons comprise 99.7 percent of all businesses,26
produce 40.8 percent of taxable turnover, provide 70.5 percent of jobs and train 83.4 percent of all
apprentices.27 Financing for small and medium‐sized companies in eastern Germany is more difficult
than in West Germany. The reserves and securities that are available for the purpose of securing
loans are mostly smaller than for companies in western Germany. Due to significantly higher loan
defaults in the past, banks are less willing than they were previously to accept credit risks.
Within the administrative infrastructure, the poorest indicators are (1) Ease of starting a new
business, (2) Number of procedures required to start a business, and (3) Burden of government
regulation. To address starting a business, the German government launched a Start‐Up Campaign
in 2006. An information system was placed online offering support for start‐up consultancy services
in 2006, electronic commercial registration was introduced for companies in 2007, and the
minimum amount of capital required to start a limited liability company will be lowered to €10,000.
Demand Conditions
On average, Germany’s rank in demand conditions is competitive compared to its PPP adjusted GDP
per capita, but two indicators are particularly low in this category. First is the government
procurement of advanced technology products. The second lowest performing indicator is 24 Financial Times, 4 May 2009. 25 Ibid. 26 Chritian Rammer, United Nations University, Universiteit Maastricht, Country Review of Germany, The “POLICY MIX” Project. 27 Ibid.

10
government success in ICT promotion. ICT now contributes more to value creation in Germany than
automotive and mechanical engineering and it is estimated that ICT accounts for 40 percent of
economic growth.28 To address ICT promotion, the German government has created a program,
Information Society Germany 2010, to maximize growth and employment in the sector.
Related and Supporting Industries
This is by far the strongest part of the German national diamond, with only the extent of cluster
policy being a relative disadvantage for Germany. Even the ranking for the extent of cluster policy is
only two ranks above the GDP ranking for Germany. The most visible cluster policy in Germany is
currently the German government’s High‐Tech Strategy. This strategy, which began in 2006, focuses
on 17 high‐tech fields, such as health, security, energy, optical technologies, information and
communication, and nanotechnologies. As part of the strategy, the German government aims to
increase R&D expenditures to reach 3 percent of GDP.29 Unfortunately, although most of Germany’s
clusters are high‐tech, there are some fast‐growing ones like tobacco and construction services that
are not. For these clusters, there is no discernible cluster policy in Germany.
Context for Strategy and Rivalry
Germany’s context for strategy and rivalry ranking is approximately as strong as its factor and
demand conditions rankings, but far behind its related and supporting industries ranking. Within
this category, Germany does particularly well in the intensity of local competition and the
effectiveness of antitrust policy. There are, however, three indicators in which Germany does not
28 German Federal Ministry of Economics and Technology, http://www.bmwi.de/English/Navigation/Technology‐policy/the‐information‐society.html. 29 EU 2008 assessment of progress on the Lisbon Strategy reforms, p. 24.

11
do well at all. These are: (1) Impact of taxation on incentives to work and invest, (2) Distortive effect
of taxes and subsidies on competition, and (3) Rigidity of employment.
In terms of taxation, Germany implemented a corporate tax reform in 2008 to increase its
competitiveness as a business location. This reform has reduced the corporate tax rate from 39
percent to below 30 percent.30 In the 2007 Employment Rigidity Index, Germany scored 13 points
above the high‐income OECD average.31,32 The Hartz labor reforms implemented from 2002 to 2004
mainly focused on reducing high unemployment, but now Germany must turn to improving the
competitiveness of its labor force.
1.3 National Level Recommendations for the German Government
Cross‐cutting reforms
• Improving domestic consumption through promotion of domestic products
• Simplification of government regulations, particularly in the area of starting a business,
while conducting further tax reforms to complement 2008 tax cuts
• Further restructuring of the financial market to facilitate easy access to loans while easing
financing through equity market
Strategy and rivalry‐ labor market improvements
• Reducing rigidity of employment and expanding large‐scale job training and placement
programs
• Reduction of social benefits to increase incentives to work
• Relaxing immigration policy for high skilled labor
30 German Business Portal, http://www.german‐business‐portal.info/GBP/Navigation/en/Business‐Information/legal‐requirements.html. 31 Above is worse. 32 World Development Indicators.

12
Innovation promotion
• Keeping policy of reaching 3% GDP expenditures on R&D and increasing government
expenditure on advanced technology products to promote demand
• Attracting top‐level researchers from abroad, expanding bilateral and multilateral scientific
co‐operation, offering attractive return options to German researchers
• Improving the education system at all levels, especially at the level of tertiary education in
order to meet expected increases in the demand for highly qualified people.
2. PHOTOVOLTAIC CLUSTER ANALYSIS
2.1 Overview of German Photovoltaic Cluster
In 2007, Germany was the world’s largest solar PV market with 3.8 GWp of total installed PV power,
representing 49 percent of global market share.33 The German cluster accounted for 55 percent of
global solar electricity production and installed 1.1 GWp of new PV capacity in 2007 alone,
generating EUR 5.7 billion in revenues (33 percent of the world market), including EUR 2.5 billion in
exports.34
The cluster boasted more than 10,000 businesses35, including over 80 manufacturers of PV
components, over 60 PV equipment suppliers, and employed 42,000 people in 2007 (denoting
employment growth of over 30 percent since 2006).36 The growth of the cluster has been
buttressed by a strong focus on innovation and technology, with over 60 research institutes in
Germany engaged in the development of PV technology. German investments in PV R&D
33 GTAI (2009d). 34 GTAI (2009d) and Wissing (2008). 35 Wissing (2008). 36 GTAI (2009d).

13
amounted to approximately EUR 176 million in 2007, and between 2004 and 2007, the cluster
registered over 250 patents. 37
Due to an extensive incentive program provided by the German government, the German PV cluster
is concentrated in the former East‐German states of Saxony, Thuringia, Saxony‐Anhalt, and Berlin‐
Brandenburg. Over 90 percent of PV manufacturers in Germany are located in this region. While
many PV equipment and machinery suppliers are spread further south into Bavaria, this is due to
the well‐established heavy machinery and equipment cluster located in that region. As for PV
research institutes, there is a heavy concentration in both eastern Germany and Bavaria, so as to
allow proximity to both manufacturers and equipment suppliers (Figure 6).
Figure 6. PV Cluster Geography
Source: GTAI (2009a‐c).
While the solar irradiation levels in Germany are well below many other regions and countries of
the world, the German PV cluster has developed successfully due to a number of key factors: (i)
37 GTAI (2009d).

14
supportive government policies and incentives; (ii) the availability of a skilled labor force and high‐
quality infrastructure; (iii) significant investment in R&D; (iv) the presence of highly developed
supporting industries; and (v) the depth and breadth of enabling industry associations.
The next three sections provide an overview of photovoltaic technology, the PV value chain and
cluster map. Section 2.5 then elaborates analytically on each of the enabling factors that have been
critical for growth of the cluster thus far. The final section brings to light challenges for the cluster
going forward and provides recommendations for continued success.
2.2 Photovoltaic Technology38
PV systems generate electricity from solar radiation. A PV system consists of PV modules that
produce electricity and inverters that convert the generated direct current into alternating current.
Safe, durable, reliable, recyclable, and requiring little maintenance, PV modules used in PV systems
have an estimated lifetime of 30 years. Customizable in size, the modules are weatherproof clusters
of a large number of PV cells under a sheet of glass.
A PV cell is made of two layers of a semi‐conductor material: positively charged and negatively
charged. Electricity is generated when light shines on the semi‐conductor. Therefore, a PV cell
requires daylight, not direct sunlight. The most common semi‐conductor material used in PV cells is
silicon.
Crystalline silicon (about 90% of the market) and thin film technologies are the most widely
commercialized PV technologies. Monocrystalline, polycrystalline, and ribbon sheets are the three
main types of crystalline cells that are made from thin slices cut from a single crystal of silicon, a
block of silicon crystals, or grown ribbons, respectively. 38 Adapted from EPIA (2008) and EPIA and Greenpeace (2008).

15
The four types of thin film modules (amorphous silicon, cadmium telluride, copper indium
diselenide, and multi‐junction cells) differ in the active photosensitive material that is placed in very
thin layers onto glass, stainless steel or plastic.
The efficiency measure for solar cells calculates what share of sunlight received is turned into
electricity. Presently, the efficiency of crystalline silicon cells is 12‐17%, while that of thin films is 5‐
13%.
Among other PV technologies that have been researched and commercialized are concentrated
photovoltaics and flexible films. The former are designed to concentrate sunlight using a lens and
saving on the semiconducting PV material. Their efficiency is a promising 20‐30%. Flexible cells are
based on thin film technology, but use flexible backing material, which has advantageous
applications potential.
Small PV systems have been used in consumer electronics. Large PV systems can be used as grid‐
connected or stand‐alone systems for domestic and industrial purposes. PV systems can be
combined into hybrid systems that use electricity generated from other sources.
The future of PV technology lies in increasing the efficiency of PV cells and potentially greater
integration of PV systems with applications such as PV integrated houses, buildings, construction
materials, and fuel‐efficient cars.
2.3 Photovoltaic Value Chain
The crystalline‐based technology value chain has several distinct production stages (Figure 7):
1. Silicon feedstock production;
2. Silicon processing – silicon is processed into ingots and ingots are cut into squares;

16
3. Wafer production – wafers are sliced from the squared ingots;
4. Cell production – cells are produced from the wafers;
5. Module production – cells are put together in modules; and
6. System production – systems are produced from the modules and installed. It should be
noted that production of inverters and other non‐PV module components can be separated
here as a sub‐stage.
Figure 7. Crystalline‐based technology production process
Source: EPIA (2008).
As silicon production and processing requires substantial investment and technical knowledge, the
number of companies at this stage is relatively small. At the level of cell and module production, the
number of producers is larger due to less intensive knowledge and investment requirements. At the
very end of the value chain are installers that are usually small, local businesses.
Explosive growth of the global PV industry in recent years has led to shortages of silicon feedstock.
Electronic grade silicon had been historically produced solely for the semi‐

17
conductor/microelectronics industry, but by 2007 over half of the worldwide electronic grade
silicon was used by the PV industry. Solar grade silicon can be of lower quality than electronic grade
silicon; therefore several companies, including new entrants, have chosen to produce it.
The non‐PV module components account for 20‐70% of the total PV system installation costs.39 This
part of the value chain, particularly inverters, has been growing substantially recently.
Clearly, the non‐silicon thin film‐based technology value chain differs in the upstream. There are no
investment and knowledge intensive production stages related to silicon production. Instead, there
are sourced photosensitive materials and glass, stainless steel and plastic. With lower production
costs, thin film manufacturing has expanded rapidly – globally, film shipments have more than
doubled between 2006 and 200740.
The German PV cluster houses companies specializing in all or parts of the PV value chain. For
instance, Wacker‐Chemie AG is one of the world’s leading suppliers of silicon for the semiconductor
and PV industries, Deutsche Solar AG and PV Silicon AG are the main suppliers of silicon ingots and
wafers, and QCells has operations in virtually all parts of the value chain.41
2.4 Cluster Map
The map of the German PV cluster is depicted in Figure 8. At the center of the cluster are PV
manufacturers, producers of PV equipment, and installers of PV systems – all players located along
the entire value chain. PV equipment producers supply tools for all stages in the value chain and
account for 15% of the cluster’s revenue, or EUR 875 million in 2007.42
39 IEA (2006). 40 Jager‐Waldau (2008). 41 Ibid. and Wissing (2008). 42 GTAI (2009a).

18
Finance is made available to the cluster through the banking system and funding programs from
KfW (German Development Bank).
The existence of strong supporting industries has been instrumental for the quick development and
upgrading of the cluster. The caliber of most supporting industries in Germany is such that they are
usually leading industries in Europe and ranked among the top three or five globally.
Close cooperation with education and research institutions, industry associations, and utilities
operators has been crucial for creating an enabling environment for the cluster. For instance, there
are over 60 education and research institutes who train specialists and carry out R&D in clean
technologies, including photovoltaics. Within the framework of the International Energy Agency’s
Photovoltaic Power Systems Program, Germany has collaborated with 18 OECD countries on joint
photovoltaic R&D projects.
Figure 8. Cluster Map
Source: Authors’ analysis.
19
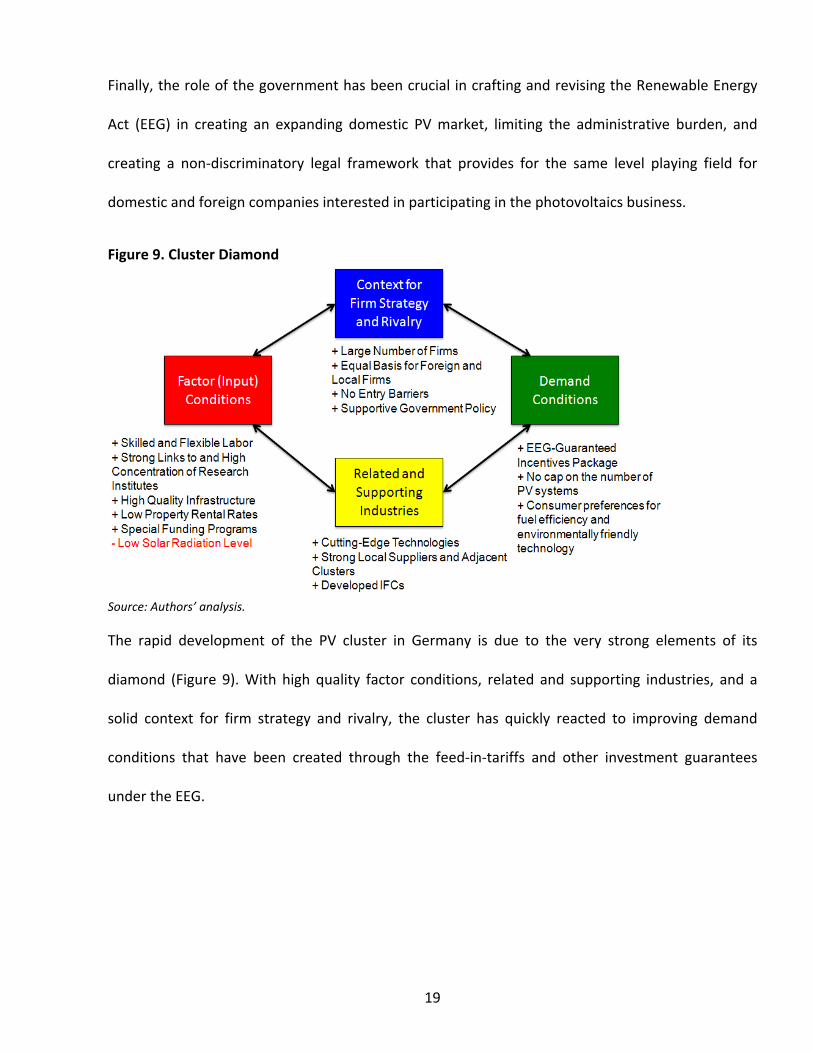
Finally, the role of the government has been crucial in crafting and revising the Renewable Energy
Act (EEG) in creating an expanding domestic PV market, limiting the administrative burden, and
creating a non‐discriminatory legal framework that provides for the same level playing field for
domestic and foreign companies interested in participating in the photovoltaics business.
Figure 9. Cluster Diamond
Source: Authors’ analysis.
The rapid development of the PV cluster in Germany is due to the very strong elements of its
diamond (Figure 9). With high quality factor conditions, related and supporting industries, and a
solid context for firm strategy and rivalry, the cluster has quickly reacted to improving demand
conditions that have been created through the feed‐in‐tariffs and other investment guarantees
under the EEG.

20
2.5 Key Success Factors for Development of the Cluster
(i) Government Policy and Incentives
The German government’s policies to encourage solar PV technology and electricity production
date back to the Electricity Feed‐In Act of 1991 and 1000 Roofs Program of 1991‐1995.43 The Act
and Program provided grid access to solar electricity producers for the first time as well as a refund
payment of approximately EUR 0.085 per kWh, and tested the grid compatibility of PV systems.
Between 1995 and 1999, the Government introduced further regional support programs and demo
plants for PV producers, working towards the initiation of the 100,000 Roofs Program in 1999,
which provided low‐interest loans for 300 MWp of installed capacity.44
In 2000, Germany passed the Renewable Energy Sources Act (EEG), requiring grid operators to pay a
higher price to solar electricity producers (EUR 0.51 per kWh) than to providers of traditional fossil
fuel electricity.45 Then in 2004, the Government amended the EEG to introduce a feed‐in tariff (FIT)
system whereby solar electricity providers would be given a guaranteed price of between EUR
0.457‐0.624 for a period of 20 years.46 While the German government’s pre‐2000 policies helped
spur interest and initial action in the solar PV sector, the introduction of the EEG in 2000 and
subsequent amendment in 2004 were key milestones that helped the German PV cluster takeoff. In
addition to the 20 year price guarantee provided under the 2004 amendment, an additional
element of the feed‐in policy was an annual reduction of 5 percent in the 20 year rate. This
incentivized early entry into the PV sector as the rate PV electricity producers started at would be
the rate they would keep for 20 years. Moreover, the FIT was provided to commercial PV providers
as well as individual households that connected their solar panels to the grid. This encouraged 43 Rafael Wiese, BSW 2007 (GTZ). 44 Ibid. 45 Ibid. 46 Ibid.

21
widespread adoption of solar PV panels by German homes—by 2008, nearly 400,000 households in
Germany had installed solar panels.47
Apart from the FIT, the German Government also provided tax credits for commercial PV providers,
including VAT exemption and a 20 year depreciation period for investments. The Government’s
policy framework aimed at making East Germany the hub for PV activity in Germany and therefore
most incentives were geared towards firms setting up in the former East German states. For
example, firms entering the East German cluster received investment incentives of up to 50 percent
of capital expenditure, and the KfW provided low interest loans for private and commercial
investors alike.48 By 2008, the federal Government had provided about $1.2 billion in subsidies to
firms in the East German solar cluster. Notably, foreign firms and investors were welcomed and
given incentives equivalent to German firms.49 As a result, the East German PV cluster soon
attracted some of the best international PV companies, which stood to gain from the myriad
incentives, positive externalities and know‐how afforded them by locating in East Germany.
Finally, in addition to the various investment incentives (such as low‐interest loans and public
guarantees) provided to PV companies, the Government also offered an extensive scheme of
operational incentives, such as recruitment and training support, wage subsidies, and incentives for
R&D.50
(ii) Skilled Labor force and High‐Quality Infrastructure
Another crucial enabling factor for the development of the German PV cluster was the plentiful
supply of skilled labor as well as high‐quality infrastructure. Over 25 percent of the German
47 Caroline Bayley, “Germany’s Sunny Revolution.” Accessed at http://news.bbc.co.uk/2/hi/business/7181866.stm. 48 GTAI (2009d). 49 Ibid. 50 Ibid.

22
workforce had university or vocational college education, and 50 percent of workers were classified
as skilled craftsmen or technicians. Furthermore, the historical presence of the microchip and
semiconductor industries in East Germany gave the region a highly‐skilled and flexible labor force.51
Numerous universities developed solar technology and offered a range of graduate level courses
with a strong focus on PV and renewable energies.52
On the infrastructure front, the German Unity Transport Projects were launched in 1991 to close
the infrastructure gap between East and West Germany. The projects involved a total investment
of EUR 38.5 billion and included the construction of 9 railway ventures, 7 motorways, and 1
waterway.53 Overall since 1990, over EUR 67 billion have been publicly invested to rebuild East
German infrastructure that was subpar at the time of reunification. This huge investment in East
German infrastructure led to a double advantage by 2007—not only was the quality of
infrastructure completely modernized and top‐rate, but the property and rental rates of the region
were relatively low compared to West Germany and other cosmopolitan centers of Europe. Hence,
setting up in the East German cluster was a win‐win situation for companies in terms of costs as
well as high‐quality physical and technical infrastructure. Logistics centers were also abundant,
with Berlin‐Brandenburg alone boasting 5 freight traffic centers and nearly 100 large logistics
companies.54
Moreover, Germany had a 100 percent digitalized telecommunications network with 87,000 miles
of fiber optics and an ISDN density five times higher than in the US or UK.55 All in all, the availability
51 Caroline Bayley, “Germany’s Sunny Revolution.” Accessed at http://news.bbc.co.uk/2/hi/business/7181866.stm. 52 GTAI (2009d). 53 German Federal Ministry of Transport, Building and Urban Affairs. Accessed at http://www.bmvbs.de/en/Federal‐Government‐Commissione/‐,2577/Infrastructure‐for‐unified‐Ger.htm. 54 Accessed at http://www.zab‐brandenburg.de/files/documents/SolarFolder_E_080820.pdf. 55 GTAI (2009).
23
of highly‐skilled and specialized workers, a good transportation system, and solid physical and
technical infrastructure at relatively low costs made East Germany an ideal setting for the growth of
the PV cluster.
(iii) Significant Investment in R&D
Under its High‐Tech Cluster Strategy, the German federal government allocated significant
resources towards energy and environmental technologies in 2006‐2009. The presence of world‐
class research institutes together with a concerted public and private sector effort to invest in PV
technology, has made Germany home to one of the richest PV R&D landscapes in the world. In
2007, the German PV industry invested EUR 175.8 million in R&D.56 State‐funded research has also
been massive, given the federal government’s commitment to invest EUR 6.5 billion in renewable
energy research, technology and innovation in this legislative period.57 Germany is especially
focused on new PV technology areas such as organic photovoltaics, and in 2007, the German
Ministry of Education and Research committed to invest EUR 360 million to support groundbreaking
research on organic PV. As a result of this heavy emphasis on R&D, over 250 solar PV patents were
registered in Germany between 2004 and 2007.58
The close cooperation and collaboration between research institutes, universities and PV
manufacturers and equipment suppliers has helped make the adoption of new PV technologies
more cost effective and seamless. This has been a vital element in the German PV cluster’s success
to date.
56 GTAI (2009d). 57 Ibid. 58 Ibid.

24
(iv) Highly Developed Supporting Industries
The presence of highly developed supporting industries, especially in semiconductors, optics,
chemicals and glass, has also played a fundamental role in enabling the successful growth of the
German PV cluster. The East German states where the PV cluster is concentrated were already
home to the top semiconductor industry in Europe, as well as a vibrant optics industry with over
400 companies and 235,000 employees. In addition, Germany is the global leader in logistics, and
ranks among the top 3 globally in information and communications technology (ICT). It is the
European leader in the chemicals industry (among the top 4 globally), and has an extensive glass
sector with 330 companies and 50,000 employees. Last but not least, Germany is a powerhouse in
the machinery and equipment industry, harboring 6000 companies with 0.9 million employees,
responsible for 28 percent of the world’s mechanical engineering patents.59
The depth and breadth of these supporting industries has provided the German PV cluster with a
rich source of highly specialized workers, a ready supply of machinery and equipment inputs, and
one of the best transport and ICT infrastructures in the world. The existence of these clusters
together with the large number of PV firms located in such a concentrated area, has also led to
many learning‐by‐doing externalities.
(v) Well Established Institutions for Collaboration
Industry associations have played an important role in coordinating the sharing and exchange of
information. There are multiple organizations at the sub‐national, national, European and
international levels. For instance, the European Photovoltaic Industry Association (EPIA) unites
members from the entire PV value chain and represents their interests at the national, international
and global level. EPIA is the world’s largest PV industry association representing about 80% of the 59 GTAI (2009). Web‐site: http://www.gtai.com/homepage/industries.

25
worldwide PV industry.60 The German Energy Agency (DENA) is a child of the Federal Government
and KfW, intended to serve as a competence center for energy efficiency with almost 6,000 sales
offices.61 Finally, the Federal Solar Energy Association (BSW) unites over 650 members (producers,
wholesalers, consultants, R&D institutes) and serves as a forum between solar businesses and the
German government.
2.6 Challenges for the Cluster Going Forward
While Germany’s PV cluster is slated to grow at a rate of 25‐30 percent over the next decade,62 such
growth will depend on the confluence of certain crucial elements: (i) demand conditions for solar
PV within Germany and internationally; and (ii) the ability of the cluster to compete against rising
PV markets in China, Spain and the USA. This section will expand on these elements that present
potential challenges for the future success of the cluster. The final section will then provide
recommendations to address these challenges and ensure future progress.
60 EPIA (2009). Web‐site: www.epia.org. 61 DENA (2009). Web‐site: http://www.dena.de/en/infos/about‐dena. 62 GTAI (2009b).

26
Figure 10. Installed PV Power by country, 2006
Source: IEA (2006).
(i) Demand Conditions in Germany and Abroad
Ensuring a growth rate of 25‐30 percent for the German PV cluster in coming years will require
robust demand for solar PV within Germany and abroad. Domestic demand conditions are
promising. This is partly because of the German government’s goal to make the country a global
leader in renewable energy and environmental sustainability, through incentive programs and such.
But it is also due to the propensity of German consumers to purchase more fuel efficient cars and
electronics, and be more environmentally conscious. Indeed, Germany’s commitment to
environmental sustainability and renewable energy permeates German consumers and society on a
social, cultural and ethical level, over and above government incentives.

27
In terms of international demand, the European Union’s decision to increase the share of power
obtained from renewable energy sources by 20 percent and to cut carbon emissions by 20 percent
by 2020, should help keep demand for solar PV buoyant throughout Europe. In addition to its own
market, Germany’s location at the heart of Europe provides companies located in the East German
cluster easy access to other growing PV markets in Spain, France and Italy. Furthermore, with the
rapid growth in India, China and other developing countries, the strain on conventional power
sources will only increase in coming years, making the move towards renewable energies inevitable.
Not only will solar PV play an important role as a clean energy proxy for traditional sources of
power, but it will also make it easier to provide electricity in rural and remote areas which are far
removed from the grid. Germany’s reputation for providing the highest quality goods makes the
“Made in Germany” label on solar PV products attractive internationally.
Against this mostly positive backdrop, there are also some concerns regarding future demand
conditions. In particular, once the German government tapers off incentives such as the attractive
FIT provided to solar PV users at present, will this lead to a drop in PV production and demand?
There are also concerns that the EU may introduce a system of trading renewable energy
obligations (similar to the UK’s system of Renewables Obligation Certificates) among member
states, which could cause Germany’s FIT mechanism to unravel.63
(ii) Competition from Growing PV Markets in Asia, Spain, and the USA
While the German PV cluster has enjoyed a preeminent position in the global market so far, the
cluster faces rising competition from growing PV markets in Asia (China, Taiwan, Korea), Europe and
the USA. As more and more companies enter, the industry is becoming less consolidated. In fact,
market share of the top 10 PV manufacturers fell from 80 percent in 2004 to 57 percent in 2007, 63 Caroline Bayley, “Germany’s Sunny Revolution.” Accessed at http://news.bbc.co.uk/2/hi/business/7181866.stm.

28
and only two of the top ten companies are German.64 Moreover, as China, Spain and other
countries with much higher solar irradiance levels than Germany aggressively enter the PV sector,
the German cluster will confront stiffer competition than ever before. The growth stories of China
and Taiwan are particularly remarkable—China expanded PV production capacity from 3 MW in
2001 to 1070 MW in 2007.65 As of 2007, 98 percent of Chinese and Taiwanese PV production was
exported.66
2.7 Recommendations for Continued Success of the Cluster
Given the challenges outlined above, we recommend the following policies to ensure continued
success of the German PV cluster:
1. The German PV industry and Government must work in tandem to continue a high level of
investment in PV R&D. Cutting edge technological innovations will enable Germany to build
on its present market dominance in the PV sector. Not only will this enable the German
cluster to compete against Chinese and Spanish counterparts, but will also expand the
demand base for PV products (if technology leads to cost reductions).
2. Germany must coordinate with the EU to ensure that policies introduced on an EU‐wide
basis, such as trading certificates to meet renewable obligations, do not induce a sudden
negative shock to the German PV cluster and policy framework.
3. Germany should remain completely open to foreign PV companies and continue to offer
these companies the same incentives as German firms. In this way, even when PV markets
such as Spain grow, the well‐established German cluster will provide an attractive location
for international companies looking to set up in Europe and access all markets there. 64 Jager‐Waldau (2008). 65 Ibid. 66 Ibid.

29
References
Arnulf Jager‐Waldau (2008). PV Status Report 2008: Research, Solar Cell Production and Market Implementation of Photovoltaics. European Commission, Directorate General Joint Research Centre, Institute for Energy, Renewable Energy Unit: September 2008.
Benoit, Bertand. “Berlin expects 6% contraction but snubs call for new stimulus.” Financial Times, 30 April 2009, Asia Ed1.
Christian Rammer, “Country Review Germany”, Monitoring and analysis of policies and public financing instruments conducive to higher levels of R&D investments, The “POLICY MIX” Project, United Nations University, Universiteit Maastricht.
CIA World Factbook.
Commission of the European Communities. “Implementation of the Lisbon Strategy Structural Reforms in the context of the European Economic Recovery Plan: Annual country assessments‐ a detailed overview of progress made with the implementation of the Lisbon Strategy reforms in Member States in 2008.”
EIU, country data.
EPIA (2008). Photovoltaic Energy: Electricity from the Sun.
EPIA and Greenpeace (2008). Solar Generation V – 2008: Solar Electricity for Over One Billion People and Two Million Jobs by 2020.
German Council of Economic Experts. “Mastering the Financial Crisis‐ Strengthening Forces for Growth.” Annual Report 2008/09 Summary.
German Federal Ministry of Economics and Technology. “Annual economic report 2008 Staying on course!”
German Federal Ministry of Economics and Technology. “The Federal Government’s Initiative for Small and Medium‐Sized Businesses”, July 2006.
German Federal Ministry of Economics and Technology. http://www.bmwi.de/English/Navigation/root.html.
German Federal Ministry of Education and Research. “The High‐Tech Strategy for Germany.” 2006. Published by the Public Relations Division of the Federal Ministry of Education and Research.
German Federal Ministry of Finance. “From the 2000 Tax Reform to the 2008 Corporate Tax Reform‐consistent and palpable reduction of direct tax burdens for citizens and enterprises.” 9 July 2007.

30
German Statistical Office of the Lander. “Entstehung, Verteilung und Verwendung des Bruttoinlandsprodukts in den Ländern und Ost‐West‐Großraumregionen Deutschlands 1991 bis 2008.”
Global Competitiveness Rankings. 2008. Institute for Competitiveness at Harvard University.
GTAI (2009a). Photovoltaic Equipment in Germany. Germany Trade and Invest: January 2009.
GTAI (2009b). Photovoltaics in Germany. Germany Trade and Invest: January 2009.
GTAI (2009d). The Photovoltaic Industry in Germany – The World’s Strongest PV Cluster. Germany Trade and Invest: February 2009.
GTAI (2009с). Photovoltaic R&D in Germany. Germany Trade and Invest: January 2009.
GTAI (2009с). Photovoltaic R&D in Germany. Germany Trade and Invest: January 2009.
IEA (2006). Trends in Photovoltaic Applications: Survey Report of Selected IEA Countries between 1992 and 2005. International Energy Agency, Photovoltaic Power Systems Programme. Report IEA‐PVPS T1‐15: 2006.
IMF Country Report, December 2006.
IMF Country Report, February 2008.
Lothar Wissing (2008). National Survey Report of PV Power Applications in Germany 2007. International Energy Agency, Cooperative Program on Photovoltaic Power Systems. Task 1 – Exchange and dissemination of information on PV power systems. Prepared on behalf of BMU –German Federal Ministry for the Environment, Nature Conservation and Nuclear Safety. May 2008.
OECD Economic Surveys: Germany. Volume 2008/7. April 2008
OECD Economic Surveys: Germany. Volume 2008/7. April 2008.
OECD. “PISA 2006: Science Competencies for Tomorrow’s World.” Chapter 6 Tables.
PV Policy Group (2006). Improving the European and National Support Systems for Photovoltaics: Assessment of 12 National Policy Frameworks for Photovoltaics, Country Analyses, Benchmarks, Conclusions. European Best Practice Report.
Wiesmann, Gerrit and James Wilson. “Berlin cranks up pressure on regional banks to consolidate.” Financial Times, 4 May 2009, Europe Ed1.
World Bank. World Development Indicators.
World Export Values, 2008. Institute for Competitiveness at Harvard University.