get britain cycling goodwin report - wordpress.com from the ‘get britain cycling’ appcg inquiry...
TRANSCRIPT

Get BritainCycling
Report from the Inquiry
Report from the ‘Get Britain Cycling’ APPCG Inquiry
2
Author’s Foreword: Cycling on the Cusp of Greatness
I, like most professional transport planners, providers and researchers of my generation, have grown up thinking that cycling, though worthy, is of small significance compared with the great questions of cars, traffic and public transport, or the universal significance of walking. This applies, I think, equally to those who saw the future as building roads for an unending growth in car use, and those who favoured traffic restraint and better public transport – and even those who cycled regularly themselves. We were wrong. The evidence demonstrates quite clearly that, in the words of one witness to the Inquiry, Andy Salkeld, of Leicester City Council, cycling is the mode of transport ‘on the cusp of greatness’. Its potential is seen already in Cambridge, the flagship city of cycling in Britain, and the potential for rapid and prolonged growth from a low base is seen in many other places as discussed here. The most evident symbol of the complex developments affecting cycling at present is seen in London, a city where cycling overall, at around 2% of all journeys, falls far short of many smaller towns in the UK, and great cities overseas, yet London boroughs – Hackney, Islington, Lambeth, Wandsworth, Hammersmith and Fulham – are all in the top dozen places in the Census ranking of cycling to work. The rates of growth compare well with the best; the new technical methodologies, design standards, and political and professional commitment at all levels are of world standard; and already in 2011 there were in total more peak–period cyclists than cars crossing the Thames by the six great bridges of Lambeth, Westminster, Waterloo, Blackfriars, Southwark and London Bridge - an astonishing demonstration of the contribution already made by cycling to traffic flow in the City. In practical terms for the national average figure around 2%, we should see the important places and developments as having a potential somewhere in the region of 30%-40%, which would put cycling on a par with any of the other modes. Both experience and statistical analysis suggests that this is achievable, the cost of doing so being in the order of £10-£20 per head of the population per year, sustained for some decades, a figure which would simply accord with cycling having the same share of resources as it currently does of travel. The evidence is that the economic benefits in terms of health and traffic congestion alone are substantially greater than the cost, and more indirect judgements indicate that the resulting improvement in quality of life and the attractiveness or residential areas and town centres adds to these benefits. It is not uncommon for claims to be made which look good on paper but are unrealistic in terms of practical politics or financial constraints.

Report from the ‘Get Britain Cycling’ APPCG Inquiry
3
In this case, the signs are very good. An expansion of the role of cycling accords with the different priorities of all the main political parties, and gives scope for politicians to build popularity with their voters, and a remarkable legacy. The time scale is such that effects would build-up over a generation, giving a continuity of attention and policy which would justify the emerging signs of cross-party agreement on strategy and financial commitments. Phil Goodwin London April 2013
The Inquiry, and the Scope of this Report
The All Party Parliamentary Cycling Group is an association of members of the Houses of Commons and Lords, representing all the main parties. It is not formally a Select Committee, but it set up the current Inquiry in a way which will be familiar to those who have been involved with Select Committee Inquiries – an invitation to submit evidence from interested public and private bodies, experts, and individuals, followed by arrangement of witness sessions where the advice was questions in discussion and examination. The Minister responsible for cycling in the Department for Transport, Norman Baker, decided to treat the Group’s proceedings with the same seriousness accorded to Select Committees. A list of those attending the witness sessions is given in Annex 3 of this report. including three Ministers; organisations representing cyclists, pedestrians, motorists and freight transport; professional engineers, designers and road planners working for national and local government agencies; police and law agencies; researchers and other specialists. I should record that the quotations attributed to witnesses here are based on my own notes taken during the Inquiry1. meanwhile, I have tried to ensure that the quotations are fair and accurate, and apologise if there are any errors. In most cases I have used summaries of arguments that were made, in
1 If these quotations need to be revised when the transcripts are available, amendments will be issued.
Report from the ‘Get Britain Cycling’ APPCG Inquiry
4
rather general format, without mentioning witnesses by name. Similarly the collated set of written evidence submitted will also be published as soon as possible so that readers may check the summaries given here with the full original documents – which are, in many cases, very detailed and excellent reviews of the field. As a collection, the evidence submitted, together with the sources they cite, probably represent the most complete compilation of literature on cycling policy that has yet been available anywhere. It is a resource which will be invaluable for future research projects and policy analysis. This report is a sort of middle ground between the summary recommendations formally endorsed by APPCG, and the full evidence base. There were 6 weeks available for writing after the end of the Group’s discussions, and I am conscious that a full appreciation and analysis of all the evidence would probably take half a year. What I have done here is select what seem to be the main themes and points of view, without repeating material which is already summarised well in the full evidence. In some cases I have gone back to original source material rather than the summaries provided by witnesses, and have sought further explanation from witnesses which they have willingly given. In general, I have focussed on policy and practice rather than basic research, of which there are many excellent reviews referred to in the text. Any errors in the Report are my own, not of the All Party Parliamentary Cycling Group: the argument and conclusions are my own responsibility, and I acknowledge the great contribution which has been made by the many excellent witnesses and others submitting evidence.

Report from the ‘Get Britain Cycling’ APPCG Inquiry
5
The Basic Statistics and what is Wrong with them
The national share of cycling, compared with best performing local areas According to the latest National Travel Survey (2012, for 2011 data) about 2% of all trips in the UK are made by bicycle, with an average trip length of about 3 miles. Because this is shorter than the average of all trips, the proportion of all mileage travelled is about 1%. The average trip takes just over 20 minutes, giving an average speed of travel (allowing for some parking time) of about 10 miles an hour. The percentage of people is not the same as the percentage of trips: for the population as a whole, a two thirds majority do not make a single trip by bicycle in a year, while one third (a minority, but quite a substantial one, more for example than the proportion of voters for any single one of the political parties) make an average of 6-7 trips a week, travelling 16 miles. Altogether, about 15% of the population travels more than once a week by bike. The first, over-riding question that has to be faced is how can it be that a mode of transport with such apparently small numbers of users is laying claim to a critically important potential role in the whole future of transport? The answer is that average statistics for the country as a whole, and indeed in many cases for individual cities as a whole, are fundamentally misleading: what is important is analysis of where and under what conditions those trips are taking place, the rates of growth they have recently shown, the disproportionately large benefits of many different kinds that can be gained from small expenditures, and the proven impact of policies and investments. First learning to ride a bike is by no means simple, as anyone with experience of teaching their children (or dimly remembering their own childhood) can attest. Yet ‘it is like learning to ride a bike: once you learn you never forget’ is the universal metaphor for the life-time retainment of a skill learned when young. The figure of the number of people who can cycle is very much greater. Frances Macleod, witness for the Department for Culture, Media and Sport, reported that 85% of people can ride a bike. More people own bikes

Report from the ‘Get Britain Cycling’ APPCG Inquiry
6
than own cars, albeit sometimes left unused for long periods at the back of their garage.

Report from the ‘Get Britain Cycling’ APPCG Inquiry
7
These national figures are not representative of all parts of the country. In recent years it has become apparent that the biggest growth rates of cycling are in some cities. The 2011 census measured a 10.1% increase in cycling to work since 2001 in the group of 8 ‘core cities’. Even some of those who started off at a very low level ten years ago, saw high growth rates2 – a growth of 8.6% in Birmingham, 15.8% in Liverpool, 21.4% in Manchester, 34.7% in Leeds, 53.3% in Newcastle, 61% in Sheffield. The actual numbers, though, were low. Particularly interesting were the cases of Bristol, Oxford, and Cambridge. Bristol, already at a more respectable 4.6% in 2001, showed the highest growth rate of 63.4% to a 7.5% share in 2011. Oxford had a 14.9% share in 2001 which grew by 14.3% to 17% in 2011. And Cambridge – which now has the highest cycle share for the journey to work of any UK city3 – already had a 25.9% share in 2001 and in spite of that still managed to grow by 11.7% to 28.9% of work trips in 2011. Thus neither a very low share, reflecting a lack of cycling tradition, nor a very high share, reflecting as great a participation as would seem possible, were a barrier to significant growth. There are special circumstances in all of these places, and these are examined further in later sections. But what is demonstrated is that there is nothing in the nature of the British temperament, or the way in which local economies function, which makes it impossible to see substantial double figures of mode share, which continue to grow even when already high.
The UK in an international context – Netherlands and Denmark in the lead There is much interest in how the UK compares with other countries, and many witnesses referred to the experience, especially, of Denmark and the Netherlands. Much of the evidence on those stems back to international comparisons carried out by the American scholars John Pucher and Ralph
2 One must acknowledge a 6.4% reduction in Nottingham, and 6.7% reduction, from a higher base, in York. 3 In order, the top 12 cycle-to-work locations recorded in the Census were: Cambridge, Oxford, London Hackney, York, Gosport, London Islington, South Cambridgeshire, London Lambeth, Norwich, London Wandsworth,, Bristol, and London Hammersmith and Fulham. The significance of this list is the diverse nature of the places listed.

Report from the ‘Get Britain Cycling’ APPCG Inquiry
8
Buehler, who have kindly allowed me to re-examine the data and results they had collated4.
It is evident that Denmark and the Netherlands head the list, and much of best practice in design standards and policy formulation comes from these countries. But for the UK it is perhaps more instructive to compare our role at national level with the group of countries from France to Germany, which share many other characteristics with the UK and have faced similar debates about whether cycling policy is serious. It is sometimes said that the high cycling countries have simply inherited this position from a historical and cultural tradition. In fact in every country – including the Netherlands –
4 More detailed information is available in their paper, Pucher, John and Buehler, Ralph (2008) 'Making Cycling Irresistible: Lessons from The Netherlands, Denmark and Germany', Transport Reviews, 28:4, 495 — 528 , and recent book John Pucher and Ralph Buehler, eds. "City Cycling," MIT Press, Cambridge, Mass, 2012, pp. 365. http://citycyclingbook.wordpress.com
0.6 1 1 1 2 2 3 4 4
8 9 9
10
18
26
0
5
10
15
20
25
30
International Comparison Percentage of Journeys by Cycle
calculated by Pucher and Buehler 2010

Report from the ‘Get Britain Cycling’ APPCG Inquiry
9
cycling showed a long term decline as car ownership and use increased, and growth to the current level was achieved by a reversal of trend, not a continuation of it. It is important to recognise that the existence of selected high performing cities is a common characteristic of the countries with a high national average just as much as those like the UK with a low national average. This is shown in further figures collated by Pucher and Buehler. In Germany, Freiburg – one of the world leading cities for sustainable transport policy overall – has a figure for cycling is 22% of all trips, and for Munster 38%. For Denmark Copenhagen has 35%. In the Netherlands, Leiden has 33% and Groningen 40%.
Assessing the Potential for Growth For technical reasons, computer modelling and forecasting5 has played little role in assessing the future potential of the volume of cycling. Experience in practice of the results of specific initiatives, either on an experimental basis or as large scale policy developments applied over a number of years, has been much more influential, and indeed reliable. The question of what is a suitable and achievable level of objective in the longer term has been of recurrent interest in the Inquiry. Although there must logically be some ‘natural upper limit’, it was taken as so far above
5 The sort of model used by the Department for Transport for national or regional traffic forecasting does not handle cycling well. This is due to: the small statistical share with consequently high error bands at a national level; difficulties in dealing with modes of transport whose trends are changing size or even direction and are radically different in different areas; difficulties in forecasting behaviour when personal motivations include, but are manifestly more complex than, saving time or money (such as health, esteem, peer influence, environmental awareness, fashion, self-image, or life-style preferences); no direct calculation of the impact of changes in street design, regulation, enforcement and other factors favouring cycling. For these reasons although in some ways the Department’s core road traffic forecasts do implicitly convey some sort of arithmetic implication or assumption about trends in cycling, those implied numbers are not robust, possibly even as an order of magnitude or direction of movement let alone detailed numbers, and would need to be completely redefined and recalculated to comprehend the sort of developments discussed in the Inquiry. My understanding is that DfT modellers would probably agree with this description – the forecasting tools they have developed were never intended for such a purpose. This understanding is not always fully appreciated at Ministerial level though. The question of the effects of the road transport forecasts themselves on cycling is different, and discussed below.
Report from the ‘Get Britain Cycling’ APPCG Inquiry
10
current UK norms as not to be important (but see note on TfL estimates of potential below). Therefore the question of assessing the future potential of cycling was mostly seen as closely connected with the question of how much funding was available, and on what it would be spent. For that reason the discussion on potential demand and on desirable expenditure tended to intertwine: they are logically distinct but closely connected, and in effect merged. Nearly all witnesses were aware of the levels of cycling in Denmark and Netherlands, and many referred to this as an achievable aspiration for the UK. Philip Darnton, giving a useful warning that one should avoid getting ‘trapped in targets’ where these might take attention away from a more detailed analysis of journeys of different distances, nevertheless emphasised that strategic thinking needed a 40-year time-scale. Lynn Sloman suggested that the evidence showed cycling could double every decade, over such a time-scale, achieved by expenditure broadly at the level of the Cycling Demonstration Towns (see below) of £14-£17 per head of the population per year6. Martin Gibbs suggested £25 per head per year, sustained for several decades. Mike Ames suggested aiming for 20%-40% of journeys, stressing that this involved not aiming only at active young men, but at a much wider cross section of the population. John Parkin suggested £10 per head per year, sustained for 10 years. Phil Insall referred to the call by Sir Liam Donaldson, Chief Medical Officer, to multiply the amount of cycling done by 8. Tom Bogdanowicz saw targets as essentially moving: first you aim for 5%, then 10%, then more – the upper bound not being determined in advance. For London, Caroline Pidgeon referred to the (then) target of increasing the cycling share to 5% by 2026, suggesting it should be redefined to 2020, with a subsequent target of 10% by 2026, doubling the current spending. Isabel Dedring aimed at the ‘shortest possible number of years to increase the expenditure on cycling to the same proportion as its mode share’, and Andrew Gilligan planned £18 per head per year. (The new Mayor’s Cycling Strategy was published after the Inquiry hearings had been
6 Lynn Sloman’s ‘doubling every decade for 40 years’, starting at 2%, would add to 32% of all trips (if the total number stayed constant) by the end of the period, a proportion which is already approached or exceeded in the leading cycling cities.

Report from the ‘Get Britain Cycling’ APPCG Inquiry
11
completed, and is discussed below). Most witnesses saw this as a rearrangement of priorities for funding within the transport budget, not a claim for increased resources for transport overall: and several emphasised – including Anna Soubry, Minister for Public Health, that expenditure on some cycling activities are legitimate claims on health budgets, not only transport. The same would apply to education, trade, economics and other Government responsibilities.
From these, and many rather similar judgements in the written evidence, one can see a convergence in view among those concerned with assessing the maximum potential and how to achieve it. This is not a complete identity, and of course one would expect that it must vary from place to place, but even so the focus of discussion would be on achievement of cycling at around 20%-40% of trips, achieved over a number of decades (hence implying a trajectory which would include shorter-term objectives of growth rates through 5%, 10% etc), with expenditure of the order of £10-£20 per head of the population. While these figures will vary, between places and over time, they seem to have a great advantage to crystallise discussion and planning at the local level, a starting point for planning and adjustment.
A new London methodology for estimating potential demand for cycling The new Mayor’s Cycling Strategy was published after the Inquiry hearings had been completed, and this must be acknowledged as one of the most important initiatives on cycling that has been seen in the UK, showing serious political and professional commitment led by the Mayor and the Transport Commissioner, and real funding. As part of the launch of the strategy, Transport for London this month issued a seminal new method of analysis to calculate the future potential of cycling. Looking at the specific origins, destinations, constraints (eg need to carry cumbersome luggage, disability) it considers whether cycling is a reasonable option on a trip-by-trip basis. The work shows that even after allowing for all the trips which could not realistically be made by cycle, only 7% of the potential is currently realised, ranging from almost none in many locations, to 24% in the leading borough, Hackney.
Report from the ‘Get Britain Cycling’ APPCG Inquiry
12
Analysis of the specific individuals making cycling trips shows that “Frequent cyclists are typically white, male, between 25 to 44, and on a higher than average income” – these groups, and people like them, still have a substantial potential for growth. But “much of the potential comes from women, ethnic minorities, younger and older people, and those on a lower income” As far as I know, such analysis has not been done anywhere else. Of course, the statement that there is ‘potential’ for cycling trips is not the same as actually achieving it, but it is remarkable that this method does indicate a similar maximum level of use to that actually achieved in the best cycling locations (though these are in fact still increasing). It is a serious and innovative planning tool and deserves wider use.

Report from the ‘Get Britain Cycling’ APPCG Inquiry
13
Case Studies of Particular Places
Against this background, it is useful to consider the experience reported to the Inquiry from a wide range of different locations, with special reference to:
• The experience of the Cycling Demonstration Towns, referred to by many and explicitly reported by Lynn Sloman who with her colleagues had written the report, published by the Department for Transport, on the results.
• Some selected areas on which evidence had been submitted, discussed by witnesses from local authorities and cycle campaigners in one of the Inquiry sessions, namely Leicester (Andy Salkeld), Manchester (Dave Newton) Devon (Lester Wilmington) and Cambridge (Jim Chisholm).
• The new cycling Strategy in London • To this may be added an informative current study of Munich,
carried out by Hass-Klau (forthcoming).
Cycling Demonstration Towns The ‘Cycling Demonstration Towns’ were selected in an initiative providing significant government funding for cycling on a competitive basis to a small number of places, on the basis of a commitment to cycling and a supportive general transport strategy. The selected towns were Aylesbury, Brighton and Hove, Darlington, Derby, Exeter, Lancaster with Morecambe. In total they showed a 27% increase in cycling overall from 2005- 2009, with estimated benefits of £47m-£64m for a cost of £18m, using assumptions and methods broadly based on the approach used by the Department of Transport for road projects, albeit with some assumptions which were rather less favourable, including a time scale of 10 years only (as against the time scale for benefits of 60 years used for road schemes), and a rather heavy cost in terms of assumed greater cost of accidents to cycling if there were more cyclists. (Sensitivity tests were carried out, and a longer period of appraisal, and associated measures to

Report from the ‘Get Britain Cycling’ APPCG Inquiry
14
reduce the risk of cycling, would provide estimates of value for money of up to four times greater).
Overviews provided by Cambridge, Leicester, Manchester and Devon
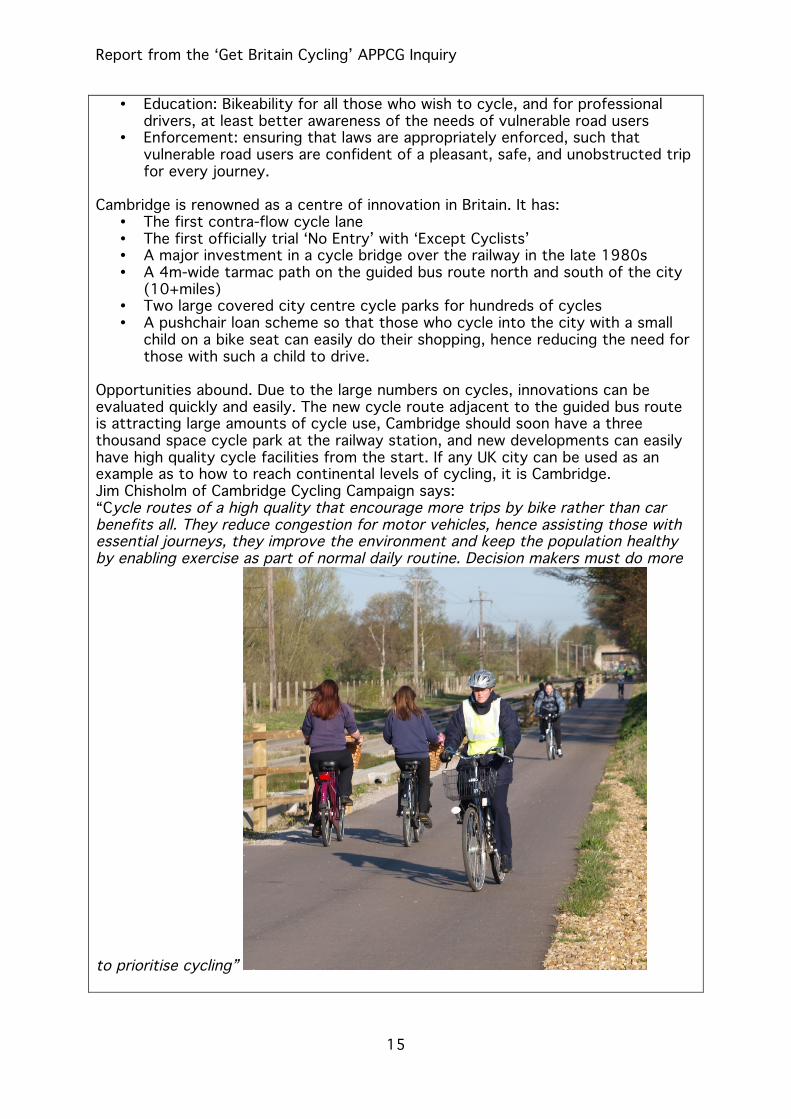
Cambridge: Already the Cycling Flagship – now aiming for even more people Cambridge is the only British centre where levels of cycling approach those seen in the best continental towns or cities. Cambridge Cycling Campaign was formed nearly 20 years ago and now has more than one thousand members. It is a charity that aims: “for better, safer and more cycling in and around Cambridge”, working effectively with authorities responsible for planning, highways, health, transport and education. Cycling in Cambridge is not dominated by fit young men, or even university students, but has an almost equal gender balance, covering a wide spread of ages. People cycle for all forms of utility or leisure trips including school, work, shopping etc. 28% of work trips are by bike and 52% of residents cycle at least once per month. Automatic cycle counters show this is an all year round activity almost independent of weather, and not just a summer activity. Census data from 2001 and 2011 for Cambridge plus South Cambridgeshire shows a population increase of about 14% to a total of about 250,000. In that time the proportion of people driving to work dropped, with the proportion driving to work in Cambridge lower than anywhere other than a few London boroughs and the Isles of Scilly. The absolute number of those who live in Cambridge driving to work has actually fallen. Despite already very high rates, numbers of those cycling to work has risen by 35% in Cambridge and 29% in South Cambridgeshire in that ten-year period. The big challenge for Cambridge and the surrounding area is the rapidly expanding population, with thirty thousand new houses expected within eight miles of the centre within fifteen years. New and improved cycle routes, especially those of high quality that avoid conflicts with motor traffic, have shown big increases in levels of cycling. Providing many more such links can mitigate potential increase in car use, at relatively small cost compared with the cost of providing new roads. In Cambridge cycling is a commonplace activity conducted by ordinary people in everyday clothes. New residents in new developments will need to adapt to the Cambridge ‘normal’. Help to encourage them to cycle is based in the three “E’s”:
• Engineering: the provision of high quality infrastructure, suitable for large numbers, including those less confident on bikes
Report from the ‘Get Britain Cycling’ APPCG Inquiry
15
• Education: Bikeability for all those who wish to cycle, and for professional drivers, at least better awareness of the needs of vulnerable road users
• Enforcement: ensuring that laws are appropriately enforced, such that vulnerable road users are confident of a pleasant, safe, and unobstructed trip for every journey.
Cambridge is renowned as a centre of innovation in Britain. It has:
• The first contra-flow cycle lane • The first officially trial ‘No Entry’ with ‘Except Cyclists’ • A major investment in a cycle bridge over the railway in the late 1980s • A 4m-wide tarmac path on the guided bus route north and south of the city
(10+miles) • Two large covered city centre cycle parks for hundreds of cycles • A pushchair loan scheme so that those who cycle into the city with a small
child on a bike seat can easily do their shopping, hence reducing the need for those with such a child to drive.
Opportunities abound. Due to the large numbers on cycles, innovations can be evaluated quickly and easily. The new cycle route adjacent to the guided bus route is attracting large amounts of cycle use, Cambridge should soon have a three thousand space cycle park at the railway station, and new developments can easily have high quality cycle facilities from the start. If any UK city can be used as an example as to how to reach continental levels of cycling, it is Cambridge. Jim Chisholm of Cambridge Cycling Campaign says: “Cycle routes of a high quality that encourage more trips by bike rather than car benefits all. They reduce congestion for motor vehicles, hence assisting those with essential journeys, they improve the environment and keep the population healthy by enabling exercise as part of normal daily routine. Decision makers must do more
to prioritise cycling”

Report from the ‘Get Britain Cycling’ APPCG Inquiry
16
) Photos From Cyclestreets.net Attribution CC Attribution-Share Alike (by-sa) Pedestrians and cycles mix in the vehicle restricted shopping area School children and commuters on a path, which passes beneath the busy northern Cambridge Bypass.
Leicester – overcoming the barriers of previous car-dominated development Leicester is a thriving diverse city with over 100 spoken community languages and dialects. The population has grown by over 50,000 from 2001-2011. People in Leicester are significantly younger, poorer and less healthy than the national average. The city has been grappling with the on-going issue of traffic in cities since the 1947 Town & Country Planning Act, the subsequent 1964 Leicester Transport Plan claimed to ‘Say ‘no’ to the motor car scientifically’ but left a legacy of ring roads, underpasses, flyovers and multi-storey car parks that dominate public space, constrain transport choice and limit regeneration opportunities. Leicester City Mayor - Sir Peter Soulsby - announced his ‘Connecting Leicester’ vision in 2012. Through an extensive development plan, this will help make Leicester a modern, people-friendly city. It will remove some of the barriers created by past developments such as the Ring Road and create a thriving city centre at the heart of Leicester. High quality walking and cycling routes will connect existing and new shopping, leisure, heritage, housing and transport facilities. He said ‘Our city has a rich heritage with many gems. ‘Connecting Leicester’ is our focus for bringing together these special buildings and places through a series of key projects over the next five years. I want to repair the 1960’s ‘council vandalism’ that drove the city’s inner ring road straight through the old Roman and medieval quarters of Leicester.” Cyclists across Leicester - now 13,000+ based on numbers of people passing all cordon counts. Local Transport Plan monitoring in Leicester shows 8,077 cyclists crossing the inner and outer ring roads in 2012. Cyclist numbers crossing these cordons grew by 3,504 (77%) between 2008 & 2012. People reporting ‘Cycling to Work’ increased 10% to 4,971 between the 2001 and 2011 census. Despite this growth cyclists still make up less than 2% of people entering the city centre each day.

Report from the ‘Get Britain Cycling’ APPCG Inquiry
17
Cyclists are welcome in Leicester City Centre Pedestrian Zone, constructed as part of a major public realm improvement project up to 2008. Before and After surveys 2007-2009 show that pedestrian numbers doubled, cycling numbers tripled and the number of vulnerable street users increased five-fold. The same surveys showed the modal share of people arriving in the city centre by car falling from 30% to 20%. The current Connecting Leicester Project extends the benefits of the city centre Pedestrian Zone beyond the ring road via new ‘stepping stone’ public realm improvement projects.

Report from the ‘Get Britain Cycling’ APPCG Inquiry
18
Manchester – aiming for a leading role in cycling
“It is the vision of Greater Manchester to become the foremost cycling city outside London” (Councillor Matthew Colledge, Transport Lead for the Greater Manchester Combined Authority. In 2011, Transport for Greater Manchester (TfGM) secured £4.9 million from Local Sustainable Transport Fund (LSTF) for a Commuter Cycle project and in 2012, a further £32.5 million for the LSTF “Let’s Get to Work” bid. This, alongside local contributions, resulted in the total of funding available to Greater Manchester in excess of £50 million. Of this, in the region of £15 million is being invested in cycling including infrastructure, parking and a range of support and promotion measures including adult cycle training. Working alongside district colleagues, TfGM also has a dedicated cycle team promoting and developing all aspects of cycling throughout the county. This is over and above other programmes such as Metrolink expansion, Bus priority measures and bus station development, all of which include cycle infrastructure and cycle parking. Data Greater Manchester saw an increase in cycling to work over the last decade of 22% with over 25,000 cycle journeys to work per day; this was reflected in some key increases in Manchester of 82%, Salford 21%, Trafford 13% and Bury 12%. Manchester had the 11th highest number of working residents stating that their main method of travel to work was by cycle. The Bridgewater Water Way, a new traffic free canal route in the south of the conurbation, saw an increase of 300% in cycling, proof that traffic free routes, serving areas that people want to cycle to, is key to increasing cycling. Greater Manchester Cycle Strategy The region is developing an all-encompassing Cycle Strategy which will sit beneath the Greater Manchester Strategy and the LTP. Linking the Greater Manchester Cycling strategy to the wider Greater Manchester strategy will provide an opportunity for all policy makers to come together to capitalise on the recent successes of cycling and to look to embed cycling into cross-cutting policy frameworks. The primary ambition is to deliver an integrated and strategically planned network of high-quality, newly built or enhanced, cycling routes that will be segregated from other traffic wherever possible and that will connect a range of employment centres, schools and leisure opportunities with each other and the wider regional centre. The lack of such a network is the largest single barrier to the growth of mainstream cycling to levels seen in continental Europe. These “spokes” connecting with a variety of “hubs” across Greater Manchester will build from other investments made in cycling infrastructure most recently through the Local Sustainable Transport Fund particularly the cycle hubs, rail station and Metrolink cycle parking facilities and new cycle routes. TfGM is working in partnership with many organisations such as British Cycling, based in Manchester, Sustrans and the CTC, who are all members of the TfGM External Advisory Group, also campaign groups such as Love your Bike (Manchester Friends of the Earth), the Greater Manchester Cycle Campaign Group and District Authority Cycle Forums. Likewise, working with the private sector, such as Bruntwood and Peel Holdings is also yielding results in terms of secure cycle parking at hubs. The Political perspective Councillor Andrew Fender, Chair of the Transport for Greater Manchester (TfGM)

Report from the ‘Get Britain Cycling’ APPCG Inquiry
19
Committee, said: “Greater Manchester is the home of British Cycling and our ambitious plans aim to make that association not just a matter of geography but of a shared philosophy – a culture of cycling. “Following successful bids to the Department for Transport (DfT), TfGM is leading a major investment in cycling, on a scale never before seen in Greater Manchester, the benefits of which – a healthier, fitter, greener and more active and sustainable society – will last for generations. “We hope to be able to go even further with a successful bid to the Department for Transport’s new Cycle City Ambition Grant”

Report from the ‘Get Britain Cycling’ APPCG Inquiry
20
Devon – disproving fears that hills make cycling impossible
Devon’s commitment to cycling was outlined in the 2012 Cycling Strategy Update. This set out a vision To create a first class environment for cycling, where people of all ages, abilities and backgrounds have the opportunity to choose cycling for a large proportion of everyday journeys and for leisure. In 2012 Devon County Council’s cabinet approved an investment programme of £13.9m in Cycling to 2015. This will help deliver key elements of the Devon Local Transport Plan 2011-2026 which include; Work with communities to provide safe, sustainable and low carbon transport choices, and making Devon the ‘Place to be naturally active’. Over 50% of the land in Devon is covered by environmental designations. This is one of the County’s main assets and has meant our engineering teams have had to work in particularly sensitive environments including World Heritage Sites, Sites of Special Scientific Interest, RAMSAR sites, AONBs National Parks.
• Between 2006 – 2011 there was a 15% growth in average daily cycle trips
across Devon. Exeter saw over 40% growth over the same period. Countywide traffic levels during this time fell by 1.5% and by 5.4% in Exeter.
• Comparison of 2011 National Census data against the 2001 results put Exeter in the top ten UK Cities for increases in cycling with a 57% increase in cycling to work rates. Research for the DfT showed that that in 2009 almost 6000 additional adults cycled in the City in a typical week who had not cycled in 2006.
• Since 2007 over 20,000 children across Devon have received Bikeability training and 1000 adults
• Devon County Council received the 2012 Devon Federation of Small Businesses Best All Round Scheme for Tourism Award for its investment in cycling. The economic benefits of cycling are demonstrated by events such as the Tour of Britain. In the seven years it has visited the County it has brought in more than £21 million and showcased the county to a worldwide audience
• Devon’s current flagship project is the Exe Estuary Trail. Annual trips have increased rapidly from 71,000 in 2009 to 112,000 by 2012, an increase of 59% (The route is due for completion in 2015)
As a large and undulating rural county particular care has to be taken to provide opportunities that follow natural contours to provide routes that allow everybody the opportunity to get on a bike not just the most fit and able. This involves taking advantage of river valleys and estuaries and the network of disused railway lines that exist in Devon. In addition all of these routes are subject to Equality Assessments to ensure that they accessible to less able users and wherever possible multi-use. Councillor Stuart Hughes, Devon County Council Cabinet Member for Highways and Transportation, said: “We made a commitment to be a cycling county and we have achieved that – improving infrastructure to make cycling a more realistic option for local people, whether they’re travelling to work or school or cycling in their leisure time. Improvements to our cycle network have also made our county an even more attractive destination for visitors, which is helping to support our local economy.
When Exeter applied to be a Cycling Demonstration Town one of the main questions from the visiting judges was “Isn’t Exeter too Hilly for people to Cycle?”. We quoted examples of Cities on the continent where there were substantial numbers of
Report from the ‘Get Britain Cycling’ APPCG Inquiry
21
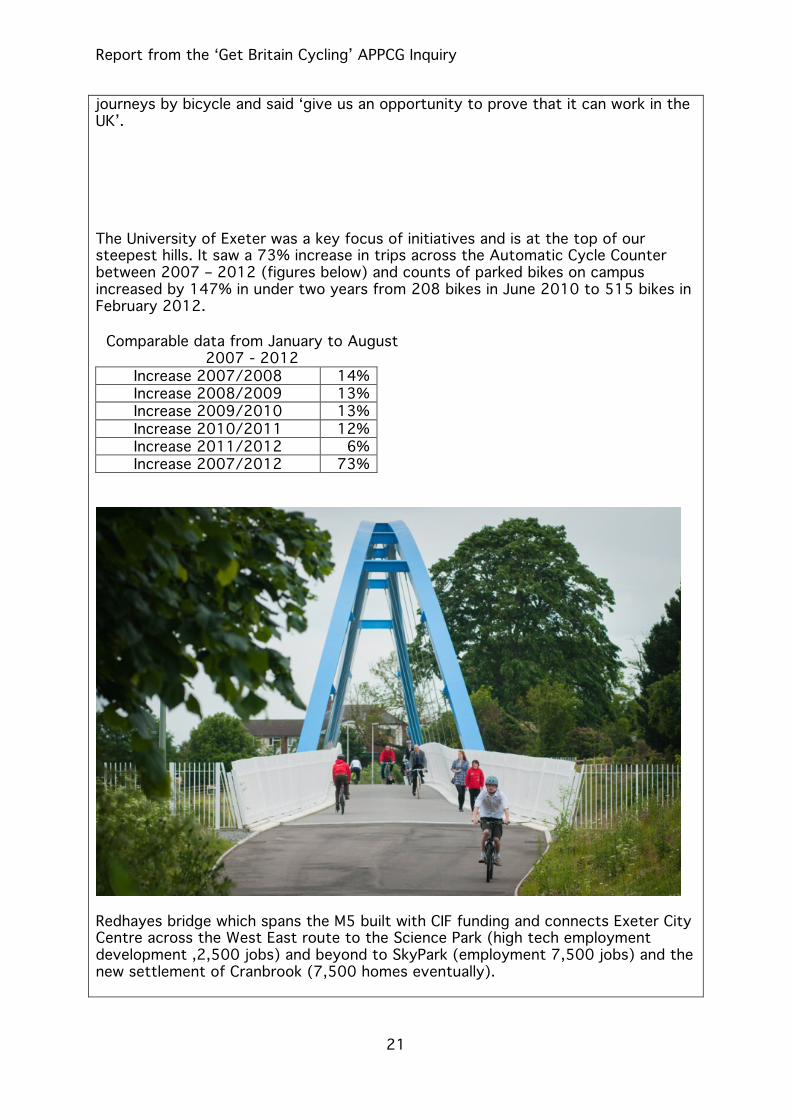
journeys by bicycle and said ‘give us an opportunity to prove that it can work in the UK’. The University of Exeter was a key focus of initiatives and is at the top of our steepest hills. It saw a 73% increase in trips across the Automatic Cycle Counter between 2007 – 2012 (figures below) and counts of parked bikes on campus increased by 147% in under two years from 208 bikes in June 2010 to 515 bikes in February 2012.
Comparable data from January to August 2007 - 2012
Increase 2007/2008 14% Increase 2008/2009 13% Increase 2009/2010 13% Increase 2010/2011 12% Increase 2011/2012 6% Increase 2007/2012 73%
Redhayes bridge which spans the M5 built with CIF funding and connects Exeter City Centre across the West East route to the Science Park (high tech employment development ,2,500 jobs) and beyond to SkyPark (employment 7,500 jobs) and the new settlement of Cranbrook (7,500 homes eventually).

Report from the ‘Get Britain Cycling’ APPCG Inquiry
22
London – the Mayor’s Vision for Cycling
Although the principles under discussion in London were part of the evidence submitted and witness statements by TfL, the Greater London Authority, the London Cycling Commissioner and cycling groups, the launch of the new Mayor’s Vision for Cycling took place after the end of the evidence sessions: it is certain that it would have been a key talking point for the Inquiry, and recognised as a key step forward not just for London but for the whole country. Many of the themes of the Inquiry are expressed explicitly in the Vision, including the key importance of political leadership at the highest level. The report is introduced by two forewords, from Boris Johnson and Sir Peter Hendy, representing both the political and professional leadership in London, and it is my assessment that the words and intent are genuine. It is also the case that the professional career structure in London now makes cycling a sensible career choice for the best staff. In summary, the Vision notes that
“Cycling on London’s main roads has risen by 173 per cent since 2001. We intend to double cycling over the next 10 years. To support this growth, major investments are needed. Analysis shows that more than half of the potentially cyclable trips in the Capital are in Outer London. These total around2.4 million a day, most of which are made by car….
“By 2020 the London cycle network will be easily understood and heavily used. We want to change the nature of cycling, attracting thousands of people who do not cycle now. We will offer two clear kinds of branded route: high capacity Superhighways, mostly on main roads, for fast commuters, and slightly slower but still direct Quietways on pleasant, low-traffic side streets for those wanting a more relaxed journey. Some Quietways will also be attractive green routes through open space, suitable for recreation and family enjoyment. In the City and West End, a mixture of Quietways and new Superhighways will make up the ‘Central London Grid’, joining all the others together. Outside the centre, local links complete the picture.
Where there is conflict between modes (which there often isn’t) we will try to make a clear choice, not an unsatisfactory compromise. We will segregate where possible, though elsewhere we will seek other ways to deliver safe and attractive cycle routes. Timid, half-hearted
Report from the ‘Get Britain Cycling’ APPCG Inquiry
23
improvements are out – we will do things at least adequately, or not at all7.
“Routes will be wide enough to cope with higher volumes of cyclists, and designed to reduce conflict between pedestrians and bikes. Confusing shared pavements will be avoided. We are revising the London Cycle Design Standards to ensure that everything we build or fund in the future is consistent with this Vision document. In discussions with the boroughs, we will commit to develop specific standards of service and maintenance for each of London’s new routes.
The total budget for routes, junctions and suburban cycling improvements…will rise about five-fold, from just under £120m to between £550m and £600m.”
Some of the argument put to the Inquiry would suggest that a greater budget, and a more accelerated programme, would both be successful in achieving greater results than a ‘doubling in ten years’. If such a doubling were uniformly spread over the whole of London, it would still leave Greater London well down in the ranking list of cycling cities. However, that is unlikely to happen. It seems more likely that (a) there will be even greater prominence of some locations and roads where cycling becomes the leading mode of transport, and many where it contends on an equal footing with car, bus and rail; and (b) to the extent that this is successful, some of the boroughs who are currently hardly interested in cycling at all, and pull down the overall average, will themselves reconsider their local strategies. The result of these two processes would be to set up a policy dynamic such that the radical original intention actually grows, rather than diminishes, and we would see successive revisions of the strategy with earlier and bigger targets, and growing budgets which are revealed as more and more legitimate as the pattern of travel changes. If this is correct – and at the moment it is speculation8 - then the current vision is a critically important
7 I interpret that ‘not at all’ as a rare piece of slightly imperfect drafting, rather than a statement of intent. 8 Something similar happened to city centre pedestrianisation in many European countries. Also to traffic calming; 30kph (corresponding with our 20mph) default speed restrictions in residential areas; the renovation of urban trams, to the regeneration of inner cities with

Report from the ‘Get Britain Cycling’ APPCG Inquiry
24
transitional phase, rather than the final version of a long term strategy.
redevelopment of apartments attractive to people who would previously have naturally tended to suburban living; legislation on seat belts, drink driving; and (sometimes) residents’ parking schemes. After a certain critical level, such initially controversial policies become more popular and there is greater support to implement them speedily and with greater ambition.

Report from the ‘Get Britain Cycling’ APPCG Inquiry
25
Munich
As part of a wider study of the effects of sustainable transport strategies on economic growth, Hass-Klau’s9 results for Munich are particularly interesting, as this is a rich, traditionally car-oriented, city in a country with a culture which is more ‘southern’ than the north European countries of Netherlands and Scandinavia. The general transport strategy has been very favourable to pedestrianisation and public transport. Cycling has always been important in Munich. However, in recent years the promotion of cycling has become even more important, and about €4.2 million is spent annually on cycling by the city. As can be seen from the modal split data below cycling increased from 12% in 1992 to 17% in 2011. The latest figures make clear that Munich has the highest model split in cycling of any German speaking city of similar population size. The city now has 1,200km of cycle ways and cycle lanes plus 350km of route signing. In the last years major roads have become wide cycle lanes like the Maximilian Strasse, Odeansstrasse and Einsteinstrasse. Thirty percent of one-way streets are open to cyclists and by 2015 fifty percent will be open. Once a year, on a weekend in May the motorway around the historic city centre is closed and only cyclists are allowed (however only in the evening from 21.00 onwards). There are 25,000 bike and ride spaces within the city and 2000 more will be built. In addition, there are about 2000 cycle parking spaces in the district centres of the city The proportion by car of all trips in the city increased from 39% to 44% from 1982 to 1989, but has reduced since then, to 42% in 1992 and 33% in 1999, with forecasts of a further reduction to 28% by 2020. There has been a small increase in walking from 1992 to 1999, and a rather stable public transport use: the big increase has been in cycling, from 19% to 27%. Employment. Although Bavaria, the Land of which Munich is the capital, has traditionally been an economically strong area of Germany, in recent years the performance of the area as a whole has not been so strong, with increased pockets of low growth and economic decline. However, the City itself, and its hinterland, have been booming. 440,000 people were employed in office jobs and worked in the City of Munich in 2004 and 52,000 in the region. By 2010 this increased to 453,907 in the city and 104,292 in the hinterland. The growth of these employees was about 3% more in the city but about 100% in the hinterland.
9 Hass-Klau C (2014 forthcoming) Pedestrian and City Traffic (new edition), used by permission with thanks.

Report from the ‘Get Britain Cycling’ APPCG Inquiry
26
The signs are that employment could have grown even more in the centre of Munich except that the constraints of space and available property, which to some extent apply in the city as a whole, are tightest in the centre. This is shown by very high increases in centre land values, as demand has exceeded supply. The vacancy rate of office space is another good indicator of the economic success in a city: in 2011, the average was 6% in the city and 7 % in the region.

Report from the ‘Get Britain Cycling’ APPCG Inquiry
27
Road Traffic Forecasts, ‘Peak Car’ and the Future of Cycling
Philip Pank Transport Correspondent, The Times, November 6 2012 (Extracts) Years of falling traffic volumes suggest that car use has passed its peak and may have entered a long era of decline, a growing body of officials from the Department for Transport and London’s City Hall believe. The implications for how cities are designed and streets are used are enormous if car use really has passed its tipping point. Supporters of “Peak-Car” theory see a future in which the inner cities are given over to pedestrians, cyclists and public transport, and café culture replaces car culture. But even if the officials are right, they know that they have a hard task ahead trying to convince those responsible for setting roads policy to adopt such a dramatic course. As one senior official said: “We are entering a new phase in terms of how we need to think about the roads, and if we are not we should be. It is time for a ‘refresh’ about our strategy and what the roads network should look like in 20 years’ time. The issue has been more the political one.” The numbers may yet provide an impetus to act. In 2008, the volume of traffic across the country fell for the first time since the 1973 oil crisis. Traffic declined again in 2009 and 2010, but rose very slightly last year. The distance travelled per person has fallen every year since 2005 and is now 6 per cent lower than a decade ago, figures from the DfT show. The distance travelled by car peaked in 2006 and has fallen by 8% in a decade. The car lobby links the decline to the recession and believes that the trend will revert to growth when the economy improves. However, proponents of “Peak Car” say that it is more than a recessionary blip. The evidence seems most compelling in London. Data compiled by Transport for London show that traffic has fallen almost every year in the past decade. In Central London, traffic fell by 19 per cent between 2000 and 2009. The number of cars in the area peaked in 1990 and has fallen by 37 per cent since 2000. An ageing population, more single-person households, young people and “empty nesters” returning to high-density, inner-city living and a proliferation of home working and mobile computing are all thought to be contributory factors. So too is a sharp rise in fuel and car insurance costs and a rapid decline in young drivers. Experts say that local authorities and politicians could create a virtuous circle by providing safe and plentiful provision for cycling, walking and public transport, which would accelerate a natural change in the way we travel. “The trends started changing before the recession, and given the right policies they can continue after,” said Phil Goodwin, Professor of Transport Policy at the University of the West of England. “It gives us the choice to change. With less traffic pressure we can improve the reliability of buses, the safety of cycling and the comfort of walking — and have pavement cafés and more attractive shopping centres.” … TfL says that in Central London car capacity has fallen by 30 per cent since 2000, with road space given to wider pavements, bus lanes and pedestrian areas such as on the north side of Trafalgar Square and at Piccadilly Circus. But a political decision to make long-term investment in cycle infrastructure and pedestrian schemes may yet founder amid official forecasts of continued growth in car use. The DfT predicts that the number of cars on the road will rise to 38,191,302 by 2035 from 28,467,300 last year. The growth is largely down to an expected 10 million increase in the size of the population. Miles travelled per car are expected to rise by just 2.6 per cent by 2035. If the politicians balk at radical change, the cost of doing nothing will also be high. The DfT’s forecasts predict that average delays on the roads will have increased by 54 per cent by 2035 and that traffic will be travelling 8 per cent slower because of congestion. DfT modelling has been called into question after the West Coast Main Line fiasco. “It is up to local authorities to decide how their streets are designed and whether they use the department’s forecasting data to help plan the future layout of their town centres,” Stephen Hammond, the Roads Minister, said.

Report from the ‘Get Britain Cycling’ APPCG Inquiry
28
In recent years there has been considerable academic and professional discussion about the reliability of Department for Transport official traffic forecasts, which have rather consistently tended to overpredict long term traffic growth since the late 1980s, and especially since 1989 when a large scale revision of methodology and policy was effected. In the period before the Inquiry started, there was particular interest in a theory named ‘Peak Car’, and my own role in it, which led to speculation that the ideas of peak car would be an essential part of my own conclusions, and influence the APPCG recommendations. The article in The Times shown above summarises why it has been judged important. Several witnesses referred directly to the argument, or indirectly to the observation that traffic had been falling, or only growing very slowly, in their own areas, and this was expected, or planned, to continue. The idea of Peak Car is certainly very important for the future of transport policy generally, and for calculation of its economic and environmental effects. It can represent a powerful departure from the assumption of ever-increasing road traffic which has dominated some generations of transport planning, and therefore a brief summary of the current state of the argument is necessary here. However, my conclusion is that the policy conclusions from the Inquiry are not dependent on accepting, or rejecting, the peak car hypothesis. Cycling will occupy an increasingly critical role in the future of transport equally whether car ownership continues to grow, or if it does not, but for different reasons. In summary, the idea of some sort of natural saturation level of car use traffic has a long pedigree in traffic forecasting, being especially influential in the 1970s. It was effectively abandoned as an important element of forecasting in the 1980s, since when official forecasts have envisaged car use continuing to increase throughout the periods, typically 30-40 years, for which forecasts are thought to be possible. The idea has recently returned because in many advanced economies, car use per head, and sometimes total car traffic, has shown little signs of growth. In some countries, and especially cities, it has declined. While this is generally accepted as a statement of fact, there is not yet a convergence about the reasons. A notable figure in the

Report from the ‘Get Britain Cycling’ APPCG Inquiry
29
discussion is Professor David Metz, former Chief Scientist at the DfT, who argues that car use has more or less reached its natural maximum level, and will show little further growth in future years. Figures 1, showing overprediction of traffic volumes since 1989, 2 (GB miles per person) and 3 (International Index of total car and van traffic) are now often cited in the discussion.
The DfT modellers’ own interpretation of over-prediction is that it is mainly due to errors in the assumptions on future rates of economic growth and population (Governments tending to be over-optimistic about both, but not for reasons connected with transport). Car use per head of the population actually slowed down from the early 1990s, levelled off, and declined in recent years: at the same time the total mileage travelled by ‘other modes’, including, but not only, cycling, has increased, but the total increase has been less than the total reduction in car mileage, accounting for only about a quarter of it.

Report from the ‘Get Britain Cycling’ APPCG Inquiry
30
The interesting thing is that similar trends have been seen in many other developed countries, so that even though there will be special features in each country, there is interest in whether a more general trend is being seen, with a move away from the car domination, or ‘love affair with the car’ which had been prominent in the previous half century. Of special importance is the observation that nearly all of these countries show a shift away from an automatic propensity to acquire a driving license at the earliest possible age: work by BMW in Germany suggests that this is very widespread in many of their developed country markets. Research by Stokes in the UK suggests that this trend is ramifying through successive age groups as the first generation of young non-drivers get older. Work by Le Vine and Jones suggests that a very steep fall off in company driving is a significant factor especially in the South-East, for wealthier and older male groups, before the recession. There is much interest in the use of mobile internet access, home shopping and other web-based activities to replace some proportion of trips previously made by car. Population growth would always be a potential source of increased volume of travel, but work by Headicar suggests that where population growth is in towns any change in the total amount of car use would be less than proportionate, and might even be negative. The DfT’s current view is that when economic growth resumes, road traffic is expected to restart, albeit at a lower rate then previously, more or less in line with population. For reasons mentioned in section 1, there are no national level forecasts for cycling issued with the same importance as those for road traffic, and indeed it would be arithmetically possible for cycling nationally to increase by several hundred per cent without materially affecting the national traffic forecasts. However probably the most important evidence is not at the national level, but at the level of cities and other urban areas. The most important argument is that it is cities where the influence of policy, alternative modes to the car, and physical barriers to car use are most effective. Newman and Kenworthy (2011) showed that the growth of urban car vehicle kilometres per person declined over a 40 year period up to 2005, when it was still positive, on average, but low. Puentes and Toner (2009) suggested that the

Report from the ‘Get Britain Cycling’ APPCG Inquiry
31
growth of per capita car use in US cities was slowing throughout the 2000s, and declined from about 2005. A study by Cosgrove et al (2008) for the Australian Treasury particularly noted that the relationship between income and growth in car use in metropolitan urban areas had flattened substantially from the 1980s onwards. In terms of policy content, evidence available includes the following key experience (as well as more detailed case studies on a very wide variety of locally specific initiatives):
a) The pedestrianisation of large areas of city centre. b) The evolution of ideas about traffic calming, shared space, and
quality design c) A substantial body of experience about public transport, including
high speed long distance rail services, and local street-running metro systems with reserved or priority track access.
d) Repeated cross-section studies before and after a policy intervention (eg from studies of the effects of reducing public transport fares in the 1980s, studies of both increasing and reducing road capacity in the 1990s, monitoring road pricing in London and Stockholm, and the range of smarter choices initiatives including workplace and school travel planning, personalised travel advice, marketing, car sharing or pooling or clubs.
e) A growing evidence base of longitudinal studies of reported behaviour, including ten years or more of data of how commuting trips in particular change over time for specific individuals. This enables measurement of ‘churn’ and the volatility of choice from day to day or from year to year. It is crucial in understanding the potential for future change, because of the axiom that analysis of change must proceed from evidence on change, not evidence on states. (Most of the received wisdom that ‘travel choices are too difficult to change’ stems from this mistake).
f) In the Sustainable Travel Towns, car driver trips per person went down by 9%, and car driver distance per person by 5% to 7%, from 2004 to 2008. In other towns of similar size, car use had gone

Report from the ‘Get Britain Cycling’ APPCG Inquiry
32
down there as well, though not as much: car driver trips per person by 1.2% and car driver distance per person by 0.9%.
g) Studies by Carmen Hass-Klau of the impact of building new urban tram systems in European cities found that car ownership was reduced in the neighbourhood of the trams, by an average of 13%, even though these areas were also affected by gentrification and increased property values as a result of the same improvements. She also carried out case studies in a number of cities notable for their increasing population and successful economic results, even under current economic difficulties, for employment and turnover. Four notable cases were Freiburg, Munich, Strasbourg and London – all showing high cycle growth, falling motor traffic, and economic and population growth. Paris is a rather similar case.
The reasons above provide the context within which the main large scale successful cycling initiatives have become widely and long enough established to reverse a long term downward trend and replace it by very substantial growth. It is at the level of specific cities or regions that the growth rates implied in the national traffic forecasts are least robust. The point of this discussion is that any policy has to be assessed in relation not to a single forecast, but to a range of different possibilities, and that range is now wider than has been traditionally assumed. Road traffic may well start to increase again, but it could stay stable and there is a serious possibility that it might fall, as shown in figure…
Suggested Increasing, Stable and Reducing Traffic Scenarios for Appraisal
Now we can consider the implications of increasing or reducing predicted road traffic levels, for cycling. If indeed there is pressure for city traffic to

Report from the ‘Get Britain Cycling’ APPCG Inquiry
33
increase by serious amounts – 20% to 50% - then the problems of traffic congestion will become quite intolerable, and problems of emissions, energy use and quality of life will have a harmful effect on city vitality, economic success and social efficiency. In that case, cycling will have a very important role in ameliorating these problems, and there will be a very powerful argument for more priority, not less, simply in order to avoid the costs of excessive traffic. If, on the other hand, the combined effect of policy and changes in social taste results in a fall in car-based road traffic, there will still be a need to provide easy and beneficial ways of moving about, and cycling will – in part spontaneously – have increasing demand. Currently there are great financial pressures on national and local government, as indeed on most of the public, and there is a need for reassurance that that any substantial expenditure gives good value for money, and is in accord with the political and economic priorities of the time. There is substantial evidence that cycling initiatives, like other smarter choices give very good value for money indeed – better than most infrastructure projects – in line with a decade of discovery that small, local, cheap improvements to the quality and ease of transport (such as local safety schemes, area traffic management, reallocation of road capacity to walkers, cyclists and public transport, and improvements to the public realm in town centres and areas of concentrated shopping and leisure activity) typically give benefit cost ratios (BCRs) in double figures, with benefits that may be 10 or 20 times as large as costs, or more. In conclusion, there has been a tendency for the debate about analysis of the trends to be associated with arguments about future transport policy, with the ‘green lobby’ supporting, and the ‘car lobby’ denying, the idea of a structural shift in car use. But this tendency is not absolute, and it would be foolish. A greater attention to cycling is one of those robust strategies which, for different reasons, remains well supported whatever the outcome of the ‘peak car’ debate, and whatever the pressures for increased, or reduced, vehicle traffic.

Report from the ‘Get Britain Cycling’ APPCG Inquiry
34

Report from the ‘Get Britain Cycling’ APPCG Inquiry
35
Benefits of Cycling: traffic, health, economy
There has been technical work on the characteristics, costs and benefits of cycling for many years: much of this was usefully re-summarised for the Inquiry, is very widely available, and in broad measure it is not controversial10. Therefore only a brief overview is necessary for the purpose of this report.
Concerning traffic impacts, it is manifest that the road space taken by a cyclist is substantially less than the space taken by a car. Depending on the conditions, the ratio is often taken to be in the proportion of one third to one fifth, or less, with the biggest advantage being in congested urban traffic conditions. The cost of providing that road space is also much less, since the heavier the vehicle, and the higher forces exerted by accelerating and braking, the more damage is done to road surface: by far the greatest damage done to the road surface of cycle lanes is done by the motor vehicles not the cycles.
A classic poster from Munster helpfully summarises the point.
10 Of course as in any sensitive area of research, there are controversies about methodology and assumptions, notably in areas where the traditions of transport engineering and economics, developed mainly in the context of motor vehicle traffic, do not always cope well with the specifics of cycling. These controversies are important, but are not crucial, in the sense that the range of argument about results seems virtually always to be about whether the benefits of cycling are big, or very big. There is no hint in the evidence provided to the Inquiry of any serious body of opinion saying that the effects are negligible or negative.

Report from the ‘Get Britain Cycling’ APPCG Inquiry
36
Health Benefits
The Inquiry was well provided with evidence from medical experts, by whom cycling is now considered one of the major potential means of improvement of public health: a summary of the advice of NICE, the National Institute for Health Care Excellence, is included as Annex 1. One of the witnesses, Professor Adrian
Davis, of the NHS Bristol Public Health Directorate, gave a very useful summary of very extensive research on the well-established benefits of physical activity: his work, and a review for Sustrans by Angela Wilson and Andy Cope, provide useful reviews of further cited references. These range from reduced risk of chronic diseases such as heart disease, type 2 diabetes, and some cancers to enhanced function and preservation of function with age. There is also strong emerging evidence that activity delays cognitive decline and is good for brain health as well as having extensive benefits for the rest of the body. Since 2000 there has been a major expansion in the number of peer reviewed research papers addressing cycling as transport. In 2007 Cycling England published a report Cycling & Health. What’s the evidence? in which the extent and

Report from the ‘Get Britain Cycling’ APPCG Inquiry
37
robustness of the evidence base were set out, citing over 100 peer reviewed studies.11 One interesting study in the Netherlands found that regular cyclists missed significantly fewer days a year from work than non-cyclists. The result of these effects is that when they are taken into account at all in transport appraisals, the health effects can dwarf the traditional calculations of time savings. The appraisal of the Cycling Demonstration Towns, commissioned by the Department for Transport, estimated that health benefits made up over 70% of the total benefits. Schemes using a tool called Health Economic Assessment Tool (HEAT)12 developed by the World Health Organisation mostly produce Benefit to Cost Ratios of over 4:1, or £4 of benefit for every £1 of cost, and some had results very much higher. Generally, official studies of the benefits and costs of cycling have adopted a very cautious approach, tending to use assumptions which are less favourable to cycling than the comparable assumptions are to motor vehicle traffic. Even so, the value for money is excellent, and the conservative assumptions increase the confidence one would have with the robustness of the results.
11 Cavill, N., Davis, A. 2007 Cycling & Health. What’s the evidence. London: Cycling England. 12 http://heatwalkingcycling.org/

Report from the ‘Get Britain Cycling’ APPCG Inquiry
38
Backlog and Barriers To Change
One of the recurrent themes of the Inquiry was that there were barriers to change in local areas of a number of different kinds. Thus in the evidence from Leicester (see above) there is a keen awareness of the damage done to the attractiveness and success of the city centre by what are in retrospect seen as mistaken attempts to cope with car traffic by road construction. The Highways Authority noted that its scope and expertise simply did not provide training for cycling considerations and design. An overview of this backlog was given in the evidence of John Dales, particularly in the context of design:
“the challenge we face in Britain is not that a range of potentially appropriate design solutions is unknown; it is that too many professionals lack the knowledge, experience, training skills and/or political support to appreciate, apply and adapt for Britain the kind of physical solutions that have proved successful in other countries…it is possible to identify a number of reasons affecting British designers’ ability to deliver better physical provision for cycling: 1. Most have been trained in a professional environment in which, to
use a well-worn phrase, ‘the car is king’. As a consequence, the default in terms of street space allocation has almost always been to ensure first the efficient flow of motor vehicles. Provision for other modes has received much lower priority.
2. The idea of allocating street capacity for a user group (‘Would-be Cyclists’) that currently constitutes a flow of zero, has typically been discounted as ‘an obvious waste of money’.
3. Where the opportunity has arisen to improve conditions for cycling, designers have tended to focus on measures that ‘make life a little easier’ for people who are already cycling.
4. Designers who do not cycle, of which there are many of course, often do not appreciate the type of facilities that would be genuinely beneficial for cycling. Hence, for example, strips of coloured surfacing that hug the gutter and are poorly enforced and maintained.
5. Designers who do cycle have often failed to appreciate the concerns and requirements of those who do not. They have therefore tended to design for the ‘vehicular cyclist’ (someone who is confident to claim their place in the middle of a lane.)
6. Road safety problems are conventionally understood only in terms of the numbers and severity of recorded injuries. The principle of ‘Road Danger Reduction’ – tackling danger at source – is relatively

Report from the ‘Get Britain Cycling’ APPCG Inquiry
39
novel, so addressing the perceptions of danger that prevent people cycling tends to be regarded as solving a problem that doesn’t exist. (‘It ain’t broke, so why should we fix it?’)
7. British designers, whose experience is largely of British cycle facilities, generally have not an understanding of what works in others countries, or why. When there are exposed to certain techniques or ideas, a common reaction – often partly justified by the current regulatory framework – is that ‘we couldn’t do that here’.”
Planning and Design The importance of good design was emphasised by a very large proportion of all the witnesses. John Dales expressed the views of many in suggesting some basic principles of cycle-friendly design, especially that a key design principle is route continuity. “A route is not just for those who will cycle its whole length, but the adage of a chain only being as strong as its weakest link certainly applies. Much well-intended investment can (and has been) wasted if design fails to address key problem locations: typically big junctions where motor traffic conditions are very hostile to cycling. Another key design principle is that it should be specifically intended to encourage cycling by people who currently do not cycle (or cycle very little and locally)”. An interesting example of this was a current project being carried out in Southampton. The first photo shows an aerial view of existing roundabout on west side of Itchen Bridge, and this may be compared with an alternative design currently out for consultation.

Report from the ‘Get Britain Cycling’ APPCG Inquiry
40
The general conclusions from the discussion can be summarised as indicating that Cycle-friendly road design needs to be based on four types of situation:
• The provision of purpose-designed exclusive rights of way, segregated from other traffic, of cycle paths, cycle lanes, etc, making use of verges, parallel rights of way, disused railways, bridle paths and similar. These must always consider how they join the rest of the network.
• The provision of designated lanes within existing streets, primarily by reallocation of space among the various users. A weak element of the design in these cases is often that they are short or come to an abrupt end at particularly hazardous locations, or weave across road way and pavement interrupted by street lights, trees or other barriers, or are too narrow.
• Realistically, there will be many places where cyclists travel where neither a segregated track nor designated space is provided. In these locations it is particularly important to ensure that the speed and driving styles of passing vehicles is appropriate to mixed road use, by a combination of (enforced) speed limits and driver education.

Report from the ‘Get Britain Cycling’ APPCG Inquiry
41
• In all new developments, whether of transport facilities or building works, there should be a statutory requirement that the effects on and provision for cyclists is considered at an early stage of the design, and is part of the approval procedure.

Report from the ‘Get Britain Cycling’ APPCG Inquiry
42
Safety, Speed, and Regulation: a problem of the Hierarchy of Legal and Moral
Responsibility
There was a specific session focussing on safety in the Inquiry, with twelve main witnesses. It was instructive that the tone for these discussions was set by Edmund King, for the AA, Neil Greig, for the Institute of Advanced Motoring, Karen Dee for the Freight Transport Association, and David Dansky, for the Association of Bikeability Schemes. Karen Dee pointed out ‘we are all in this together’, a tone which in the previous session had been initiated by Roger Geffen, for the CTC: ‘Edmund King of the AA is on the same page as us’.13 A recurrent theme in the submitted evidence, and especially in witness statements, was a tension between some quite simple and practical precepts of ensuring the safety of cyclists, and the moral, ethical and legal principles which underpin them. At the risk of somewhat oversimplifying the issues, it may be helpful to try and unpack why an apparent broad agreement in principle is not always applied in practice. There are four different strands of argument which weave around each other. First, it is manifest that cyclists in traffic are in some danger. That danger is sometimes exaggerated in people’s perceptions, especially when they are parents or in loco parentis for children, but it is real, even when exaggerated. Anna Soubry, Minister of Public Health, was not alone, speaking as a parent, when she said “I never even considered putting my children on a bike. I would not put a child on a bike in Nottingham” while at the same time recognising that cycling was as good a form of exercise as any, if not better, from the point of view of health, and also a great way to travel, and entirely committed to the strategy for sustainable transport on which her Department had very close working relationships with the Department for
13 There had been a BBC television programme, describing a ‘war’ between cyclists and motorists, which everybody who mentioned it felt was distorted, unhelpful and untrue. Neil Greig pointed out that most cyclists are, in fact, also motorists; and Edmund King that it was wrong to talk of ‘two tribes’, since many were the same people.
Report from the ‘Get Britain Cycling’ APPCG Inquiry
43
Transport. Some schools (a minority, I think) reflect this ambivalence when they have doubts about whether they should encourage the children in their charge to cycle to school. Secondly these concerns are countered by logically different propositions:
• Even where cycling adds some risk in terms of road danger, the overall net effect on health is positive because the benefits of the activity itself are several times greater than the risk of an accident, which is perceived to be higher than it really is. In terms of added healthy life expectancy the combined effect of traffic danger and improved health is positive. (This is an argument which is very clear to health professionals, is entirely valid, but is sometimes difficult to grapple with in terms of one’s own children).
• The necessary policy response is to improve traffic conditions for cyclists in such a way that they can enjoy the benefits of improved health without the smaller, but real, costs of traffic danger. This leads naturally to reduction of traffic speed, but also to design features including the width of cycle lanes, priority at intersections, and so on. This argument is sensible, well supported by evidence, and entirely consistent with 20mph as a default speed in urban areas. But it leaves unresolved what the advice should be in those areas which have chosen not to implement such policies, or while waiting for a programme to be completed.
• It is widely observed that one of the factors improving cycle safety is the number of cyclists: where there are many cyclists, the motorists in that area will be much more aware of their presence, than where there are only a few occasional cyclists whose presence is unexpected. The evidence is not clear where the threshold applies for ‘many cyclists make safe cycling’ but it seems definite that in places like Cambridge, or the London bridges, there are so many cyclists that few if any vehicle drivers can be unaware of them. In this case one would not want to ‘scare people off’ from cycling, because if they stop doing so, the roads become more dangerous for the remaining fewer cyclists. This is a much-experienced part of the human condition, where people acting collectively can sometimes find a better solution for all than

Report from the ‘Get Britain Cycling’ APPCG Inquiry
44
when each individual makes decisions alone. It always causes some tension in how to find the effective individual motivations for the public advantage.
Thirdly, building on these rather complex individual concerns, there is naturally a need to establish a legal framework which is based on robust moral principles and also is practical, acceptable and enforceable. Here some of the witnesses made a strong case for a clear hierarchy of rights which they see as almost self-evidently true. This is based on the proposition that the more vulnerable should be protected from the less vulnerable. Thus children should be protected from those adults who might harm them, the ‘innocent bystander’ should be protected against those committing an offense, pedestrians should be protected from cyclists, and cyclists from motor vehicles. This protection cannot be absolute, but the principle is that the balance of interest should favour the more vulnerable, and put greater responsibility on those whose behaviour could do more damage. Fourthly, it is a commonplace that the police often have more important priorities than controlling parking; it is also a commonplace that motorists breaking speed or parking regulations very rarely do so with the deliberate malevolent intent of wrongdoing that a burglar or kidnapper displays; it is also a commonplace that someone killed by dangerous driving is just as dead as someone killed by common assault. Against the background of these rather complex principles, the Inquiry heard some very practical evidence on two controversial issues. The first was a legal distinction between ‘careless’ and ‘dangerous’ driving, coupled with a division of responsibility between police and prosecuting authorities, which is widely felt to be soft on dangerous driving even where the intent is different. The second is the appearance of reluctance on the part of police to enforce speed limits of 20 mph in urban areas, as will be seen when the transcripts are available.

Report from the ‘Get Britain Cycling’ APPCG Inquiry
45
I suspect that elements of this intertwined set of arguments will continue to run for a long time into the future. But the core propositions at the heart of the argument are that cycle safety needs to be improved, and that this must be done by a combination of better road design, better education, better attitudes, better laws, and better enforcement of them. It seems that such simple principles are in tune with the spirit of the time and the well-being of the nation.
Report from the ‘Get Britain Cycling’ APPCG Inquiry
46
Training and Education
There is an important argument about what role schools can or should play concerning cycling training: this is linked to their activities in relation to cycling to school. One proposal of great interest to (some) motoring organisations is an idea that teaching children to cycle safely is a very good way of introducing them to the skills of road craft which will, in later years, also be useful to them in preparing them to learn to drive. At the same time, the specific nature of that training is likely to make drivers more aware of and sensitive to the needs of cyclists than they would otherwise be – and hence be better and safer drivers. Bikeability training – the new version of cycle proficiency – has great advantages. It should continue to be funded, and expanded to cover more schools, including both primary and secondary schools. Cycle training is a cheap way of increasing activity that children can do outside school, can be integrated into sport in school and can help tackle childhood obesity. Some level of cycle training in schools can be seen as a pathway to assist driver training at an age where people are not allowed to drive cars, and to do this in a way which sensitises them to driver behaviour which does not cause hazards for cyclists. There are innovative schemes also for adults, including both those who want to feel more confident in their cycling, and those drivers for whom cycle sensitivity training improves their driving skills and indeed their employability. At the professional level, traffic engineering and road design have typically been taught with minimal attention to cycling, so that many transport planners have not had a chance to develop the necessary skills. University courses in relevant skills (engineering, architecture, etc) should include

Report from the ‘Get Britain Cycling’ APPCG Inquiry
47
cycling elements in the same way they do for traffic generally14. Continuing professional education should include a focus on contemporary cycling issues. The various handbooks for road design need to updated and do more to promote cycling.
Other themes of great importance for further reporting
The Inquiry received evidence on a wide range of other themes which it has not been possible to discuss in detail in this report, although to some extent they have been included in the Recommendations at a summary level. These include
• Cycling in national parks, forest trails, and other rural areas of significance to leisure and tourism
• Cycle hire facilities, especially as between different models of public and private sector engagement
• Regulations affecting folding and conventional bikes on public transport, especially on trains during busy periods, and on volunteer heritage railway services
• Provision of advance booking of cycles on trains • Arrangements for employer support of tax-advantageous cycle purchase
for employees, especially in relation to public sector employers not all of whom are fully engaged
• The circumstances under which cycling on pavements or pedestrian streets and areas is to be encouraged, and the conditions under which this takes place
• The role of cycling in relation to park-and-ride facilities aimed at motorists • Research gaps in the evidence base on effects of cycling policies and how
to optimise the balance among a wide range of complementary policy instruments
When the full transcripts are of the hearings are available, it will be possible to revisit these issues, perhaps issuing more detailed comments and advice: there is no implication that their omission from detailed consideration in this report is a reflection on their importance, but simply arises from the constraints of time and documentation. In many cases the right thing to do is entirely in accord with the same principles which have influenced the other policy recommendations.
14 I can attest that many University Masters’ courses in transport studies do now, I think, include cycling, at least in terms of the general planning arguments. The gap seems to be more one of technical skills in design and implementation.

Report from the ‘Get Britain Cycling’ APPCG Inquiry
48
•
Action Checklist Compiled from Policy Recommendations put to the Inquiry
One of the most interesting features of the development of professional skills, design guides, planning principles and strategies affecting cycling is the role of cycling organisations and enthusiasts in helping to define the territory – partly in order to fill the gap that had existed in continuity and priority of attention among professional organisations15: cyclists had to form their own body of technical experts and thinkers when, as used to be the case, the most senior person responsible for cycling in many transport authorities was very far down the career chain, and alas often tended to stay there. The result has been a very thoughtful tradition of voluntary involvement, which was reflected during the inquiry. The following list has been compiled from a range of different cycling organisations submitting evidence to the Inquiry, mostly in their own words or tone. They do not always agree with each other on every detail, and the suggestions are at a level of detail which would need considerably more detailed technical assessment on a case-by-case basis, rather than blanket recommendations for all circumstances. Nevertheless they provide a large part of the informed policy base which has been used during the Inquiry, and as a resource for local decision-making. One can be confident that a local authority which systematically works through the checklist, considering its application in local conditions, will be sure to cover nearly all the main issues and opportunities. 1 Commitment
1.1 The Prime Minister and Transport Secretary should publicly commit to a cross-departmental Action Plan, including a clearly framed ambition to achieve substantial increases in cycle use and improvements in cyclists’ safety . 1.2 This Plan should be backed by:
• Commitments from all relevant departments – e.g. those responsible for transport, health, education, business and skills, environment and rural
15 This has recently been changing quickly.
Report from the ‘Get Britain Cycling’ APPCG Inquiry
49
affairs, sport, traffic law and enforcement, and the Treasury – to play their respective roles in promoting cycle use and cycle safety;
• Commitments from other key partners, e.g. local government, the health sector, public transport operators, the police;
• Cross-party support; • And hence the long-term cross-organisational commitment to sustained
investment in cycling.
1.3 The Action Plan should also be backed by clear capital and revenue funding commitments, both dedicated cycle provision and for “smarter choices” measures to promote cycling (including Bikeability cycle training – see 4.4 - 4.7). These should amount to at least £10 per head of population annually from national budgets, to be matched by additional funds sourced locally (e.g. from the Local Transport Plan, Local Transport Boards, Local Economic Partnerships, developer contributions or public health funding) . 2 Planning, the built environment and cycling infrastructure General principles 2.1 The creation of good cycling conditions requires a willingness to traffic volumes and/or speeds, and to reallocate road-space and junction capacity. Cycle planning should be seen not only as contributing to the wider aim of motor traffic restraint, and also as a beneficiary of that aim. The objective should be to enable all journeys to be made by cyclists of any age ability and experience-level, in conditions that safe, direct, coherent, comfortable and attractive. 2.2 Cycle and pedestrian planning should reflect the “hierarchy of road users”, with primary consideration given to pedestrians and then cyclists. 2.3 Standards for designing highways, traffic schemes and cycle-specific infrastructure should be revised to reflect continental best practice. 2.4 Cycling should be considered in all relevant transport and planning policies, and specifically in the planning and design of all highway or traffic schemes and significant new developments (see also 2.25 - 2.28). Cycle provision should not simply be “bolted on” to these schemes as an afterthought.

Report from the ‘Get Britain Cycling’ APPCG Inquiry
50
2.5 Cycle audits, safety audits or similar procedures should be undertaken by people who are suitably qualified and knowledgeable about cycling, who can not only identify genuine risks to cyclists’ safety (and not merely deviations from written standards), but can also identify potential opportunities to improve cycling conditions. Traffic restraint 2.6 Cycling can benefit from demand-reduction policies (such as road user charging, parking charges and fuel duty), or from reductions in motorised access (e.g. to town-centres or through residential rat-runs, to provide ‘filtered permeability’ for cycling) and parking provision. Lowering speeds and speed limits 2.7 Local authorities should be encouraged to progress towards 20mph being the ‘default’ speed limit for built-up streets. 40mph zones should be piloted on minor rural road networks. 2.8 Lower speeds should be achieved primarily through a combination of good local advocacy (i.e. building local public support), good design (e.g. creating the sense of a street as a place where walking and cycling is to be expected), and “psychological traffic calming (e.g. removing centre lines). These may be backed up as required by enforcement (e.g. using time-over distance cameras). More aggressive forms of physical traffic calming should generally be avoided, particularly pinch-points which can be hazardous for cyclists. Dedicated space for cycling on or alongside major roads 2.9 Busy or high-speed roads should have some form of dedicated space for cycling. Cyclists generally prefer segregation where this can be done to a high standard. Segregation is particularly important on busy roads with 40mph or higher speed limits, and is also desirable on busier roads with 30mph limits if done to best practice continental standards. Nonetheless, on-carriageway cycle lanes and even the use of wide bus lanes (if properly enforced) can also prove effective at boosting cycle use, particularly from a low base. 2.10 By contrast, simply converting pavements to shared use cycle tracks should only be seen as a ‘last resort’ solution. It may be acceptable alongside inter-urban main roads (where there are few pedestrians or side-road

Report from the ‘Get Britain Cycling’ APPCG Inquiry
51
junctions), but should generally be avoided in urban areas or other situations where this would create conflict with pedestrians and/or undermine safety or priority for cyclists at junctions (see also 2.12). 2.11 Cycle facilities, whether on or off road, should have decent widths, with good, well maintained surfaces (see 2.27). Care should be taken to minimise the need for cyclists to stop or slow down (e.g. at junctions), and to negotiate Ramps, gradients and sharp corners. 2.12 On-carriageway cycle lanes should preferably have coloured surfacing, particularly at junctions and other points of conflict. Coloured surfacing may also be used to promote awareness of strategic routes and to help cyclists with way-finding (see also 2.17). 2.13 Highway authorities should be given the powers to take enforcement action against those who drive or park illegally in mandatory cycle lanes, through the long-overdue implementation of powers contained in Part 6 of the Traffic Management Act 2004. Tackling junctions 2.14 Action should be taken to reduce the risks the disproportionate risks cyclists face at junctions, and the ‘severance’ effect of major roads and other transport corridors. Solutions can include: raised tables at more minor junctions, traffic signals (with advance stop lines), separate signalised crossings (for more major junctions and/or those which are approached by segregated cycle tracks), or grade separation (e.g. tunnels and bridges – these should be designed to be cycle-friendly. 2.15 The Government should make or amend regulations to allow the introduction of continental best practice solutions, particularly for giving cyclists priority at junctions (e.g. when using segregated facilities). These include cycle-specific traffic lights, and rules giving cyclists (and indeed pedestrians) who are going straight ahead at a junction priority over other traffic which is intending to turn across their path. Improving cycle access 2.16 Opportunities should be taken to exempt cycles from regulations such as one-way streets and motor vehicle restrictions (e.g. to town centre pedestrian-priority areas) and road closures. Traffic-free routes and off-road access

Report from the ‘Get Britain Cycling’ APPCG Inquiry
52
2.17 Opportunities should be sought to open up routes for both recreational and utility through parks, woodland and open spaces, along disused railway lines, canals, river banks, seafronts and the coast. 2.18 Rights of way laws should be simplified, to permit cycling on footpaths on the same basis as on bridleways (i.e. provided they are prepared to give way to pedestrians), except in limited circumstances where there are clear reasons not to do so. Signing and promotional literature should be used to guide recreational cyclists to the most suitable routes. Cycle networks, signing and waymarking 2.19 Whilst aiming to provide safe, coherent, direct, comfortable and attractive cycling conditions throughout the road network, it is nonetheless useful to identify coherent networks of strategic routes in urban areas, where improvements can be prioritised and which can be publicly promoted, signed and waymarked (e.g. through coloured surfacing). This can help boost public confidence and awareness of cycling as a safe and attractive transport option. 2.20 Urban networks should be seamlessly linked to routes connecting to other nearby towns and settlements, and to recreational cycling opportunities in the surrounding area. (see also 4.11). 2.21 Coherent signing is important for all cycle networks, both in urban and rural areas, and for recreational and utility and recreational cycling alike. Cycle signing should give distances in minutes, to raise awareness of how quickly journeys can be made by cycle. Cycle parking and other ‘trip-end’ facilities 2.22 Ample cycle parking should be provided in residential areas and developments, as well as at other key destinations (e.g. schools, workplaces, town centres, retail outlets, business parks, public transport stations and interchanges, civic buildings and other public amenities). 2.23 Cycle parking should take account of the differing needs of short stay and long stay users. Short stay users will prioritise convenient and easily visible locations, while longer-stay users place more emphasis on security and shelter.

Report from the ‘Get Britain Cycling’ APPCG Inquiry
53
2.24 All cycle parking should be well designed, easily accessible and secure. “Wheel-bender” cycle parking (which only holds the bike’s front wheel) should be avoided. The role of planning policy 2.25 Planning policies should guide developments to locations which are easily accessible by cycling, as part of a wider aim of reducing motor vehicle dependence. Developments which would worsen cycle access and/or exacerbate motor vehicle dependence should not be permitted. 2.26 Planning policies should support the creation of safe and attractive cycling conditions, e.g. by:
• securing good cycle access to and within new developments; • ensuring the provision of cycle parking and other trip-end facilities (e.g.
showers), and to ensure in particular that cycle parking is designed into new residential developments;
• promoting high public realm design standards that create an environment which encourages walking and cycling;
• safeguarding or improving access to disused railways and other potentially valuable access corridors, woodlands and open spaces.
2.27 Planning agreements should secure contributions from developers for improvements to cycling conditions in the surrounding area. 2.28 Planning agreements should include green travel plans which encourage cycling as part of a wider package of measures to avert the risk of new developments contributing to the growth of motor traffic. These should be properly monitored and enforced. Road and path maintenance 2.29 Highway and path maintenance policies and procedures should take account of cyclists’ needs, and the particular vulnerability of cyclists to poor maintenance, by:
• Giving due priority to routes which are well-used by cyclists (and particularly to designated cycle routes) in the procedures for highway inspections, vegetation clearance and winter maintenance;
• Prioritising repairs where these occur within 1.5m of the kerb (or of the outside of any parking bays), other parts of the carriageway likely to be
Report from the ‘Get Britain Cycling’ APPCG Inquiry
54
used by cyclists, or where cyclists may be particularly vulnerable to road defects (e.g. at junctions or on gradients);
• Ensuring that street works to not create temporary road layouts or road surface conditions which are hazardous to cyclists, and that they do not result in cycle routes becoming severed or obstructed;
• Ensuring that repairs are done to a high standard, avoiding hazardous temporary repairs, and reinstating coloured surfacing.
2.30 Local authorities should seek to integrate their planned highway maintenance and cycle infrastructure improvement programmes, as the former can present valuable opportunities to improve cycling conditions at marginal extra cost and with minimum disruption. 3 Road safety (other than speed, infrastructure and cycle training) Road user training, awareness and behaviour 3.1 Cycle awareness should be more strongly emphasised in the training and testing of drivers. 3.2 Public awareness campaigns should be run to promote driver awareness of cycle safety issues, e.g. about watching out for cyclists at junctions, leaving adequate space when overtaking them (particularly at pinch-points or on left-hand bends). 3.3 Public awareness campaigns on road safety more generally (e.g. on speeding or mobile phone use) should be expressly linked to enforcement activity, to maximise the synergy between them (with the awareness campaigns helping to legitimise the enforcement, while the enforcement activity reinforces the message of the awareness campaigns). This requires cross-organisational co-ordination between those involved in road safety education and the police. 3.4 Consideration should be given to providing insurance discounts for those who have successfully completed level 3 Bikeability cycle training (see 4.4 - 4.7), or to reducing any thresholds for may be introduced for trainee drivers to reach a minimum age, or complete a minimum number of driving lessons, before they can obtain a full driving licence. Traffic law and enforcement: key issues

Report from the ‘Get Britain Cycling’ APPCG Inquiry
55
3.5 Much greater priority and resources should be devoted to road traffic law and enforcement, by the Home Office, Ministry of Justice, chief police officers, prosecutors and the courts (including coroners). Roads policing is important not just for improving road safety but also for tackling other forms of crime. 3.6 Police forces and other emergency services should actively support 20mph limits and other speed limit reductions (see 2.6). They should desist from objecting to such schemes for lack of resources (or on other spurious grounds) – 20mph limits require no greater enforcement effort than 30mph limits. 3.7 The current distinction between ‘careless’ and ‘dangerous’ driving should either be clarified or amended, so that driving which has caused obvious ‘danger’ is not dismissed as mere ‘carelessness’, leading frequently to derisory sentences. This should be done in the first instance through the current revision of the CPS’s prosecution guidelines on bad driving offences. However, changes to primary legislation may also be needed. 3.8 At the same time, amendments should be made to sentencing policy, to make greater use of lengthy driving bans and other non-custodial options (e.g. suspended sentences, restorative justice) for those whose driving has caused obvious ‘danger’ but where the evidence does not suggest they are ‘dangerous individuals’ (who need to be locked up to avoid the risk of re-offending). Custodial sentences should however remain the norm for those whose driving offences, subsequent behaviour or past offending histories suggest more dangerously irresponsible attitudes – including those who have previously breached driving bans. 3.9 The rules on civil compensation should be changed to create a presumption that injured pedestrians and cyclists are entitled to full compensation, unless it is clear that they were solely and culpably at fault. Reductions in compensation should only be made on evidence of genuine culpability on the victim’s part, not mere technical breaches of Highway Code rules – particularly where these are non-mandatory (e.g. on use of helmets or hi-vis clothing), where adherence to the rule may not have made a difference to the outcome, or where the victim is a child, an older person or a person with disabilities.

Report from the ‘Get Britain Cycling’ APPCG Inquiry
56
Traffic law and enforcement: improving the operations of police, prosecutors and the courts 3.10 There is a need for fundamental overhauls to the quality of police investigations, CPS charging decisions and case management, and the conduct of inquests and court hearings, including sentencing. Increased resources, training and the creation of specialist investigation units should all be considered. 3.11 The police should adhere to the Road Death Investigation Manual (RDIM) standards for serious injury collisions as well as fatalities. Evidence should be gathered promptly on matters such as vehicle speeds eyesight, mobile phone use, drink or drug driving etc. Statements should be taken as soon as practicable from suspects, victims and other witnesses. Care should be taken both at the crash scene and afterwards to avoid ‘loosing’ witnesses, and to ensure they are kept informed of relevant court dates etc. 3.12 Police should pass all case files involving death or serious injury to the CPS to decide whether to charge. It is unacceptable that they currently have the discretion not to do this. 3.13 Prosecutors should be correctly advised on the legal distinctions between ‘careless’ and ‘dangerous’ driving (see also 3.7), and the potential uses of manslaughter charges, and how to present the case for these more serious charges in court. They should not charge, or accept guilty pleas, for ‘careless’ offences where this is not legally justified, and should always consult with the victim(s) or bereaved relatives before making such a decision. 3.14 Coroners should not routinely dismiss road crashes as “accidental deaths”, or to make unsubstantiated comments about cyclists’ responsibilities or possible ways in which they might have avoided death (e.g. through use of helmets or hi-viz clothing). 3.15 Coroners should make greater use of their powers to make “Section 43” reports to highlight solutions that might prevent deaths, and particularly the recurrent causes of deaths (e.g. lorries failing to see cyclists in their ‘blind spots’).
Report from the ‘Get Britain Cycling’ APPCG Inquiry
57
3.16 The courts should make greater use of driving bans in sentencing (see also 3.8). They should be much firmer in resisting pleas of ‘hardship’, particularly when considering driving bans. Traffic law and enforcement: information, transparency and performance management 3.17 The Department for Transport, Home Office and Ministry of Justice should collaborate to ensure that data can be produced to show what prosecutions, convictions and sentences result from cases where cyclists, or other road user groups, are killed or injured (n.b. this cannot be done at present). 3.18 Police forces and CPS divisions should be required to report on how they handle road collisions, e.g. the reasons why these do or do not result in prosecutions, convictions and sentences. This transparency would help inform dialogues both nationally and locally on where improvement is most needed. See also 3.11, 3.13 and 3.19. Victims support 3.19 Road crash victims should be covered by the Victims Charter and should receive the same victims’ support services as other homicide victims. They should be consulted wherever possible about decisions on the charging and prosecution of drivers in their cases, and should be entitled to information about why and by whom such decisions have been made. See also 3.17 - 3.18. Lorries and other large vehicles 3.20 The Government should pay far greater attention to the hazards posed to cyclists by large vehicles, particularly lorries. Solutions to be considered should include: o The design and safety equipment of lorries and other large vehicles, e.g.: larger windows (and less metal) on the fronts and side-panels of lorry cabs; lowering the driver’s seating position, fitting cameras, sensors linked to audible warning devices, under-running side guards, and simple warning signs to cyclists on the backs of lorries; o Providing cycle awareness training or (preferably) actual cycle training for drivers of lorries and other large vehicles;
Report from the ‘Get Britain Cycling’ APPCG Inquiry
58
o Raising cyclists’ awareness through cycle training and through carefully messaged awareness campaigns (but see 4.5 and 4.12); o Good health and safety management of vehicle fleets and drivers – including more active roles for the Health & Safety Executive and/or Traffic Commissioners; o Measures to reduce lorry use at times and places where cycle use is high, e.g. by promoting increased use of rail-freight and/or transhipment depots, and through lorry access restrictions, coupled perhaps to relaxations of night-time delivery bans. 3.21 Research should be conducted on the above measures to assess their value and cost-effectiveness. 3.22 When procuring services involving construction or delivery vehicles, Local authorities and other public sector bodies should be encouraged to stipulate that contractors should be signed up to the Fleet Operator Recognition Scheme (FORS) or a similar accreditation process to ensure high standards of lorry design and equipment, driver training etc. 3.23 The Government should avoid increasing the threat posed to cyclists through increases to maximum permitted lorry lengths, weights or speed limits. Measuring cycle safety 3.24 The measurement of cycle safety should support the aim of promoting more, as well as safer, cycling – bearing in mind that more and safer cycling can, and should, go hand in hand (the “safety in numbers” effect). 3.25 Cycle safety should therefore not be measured simply in terms of cyclist casualties or fatalities, as this potentially incentivises the promotion of cycling and its wider health and other benefits. Instead, it should be measured, both locally and nationally, through:
• Rate-based indicators (e.g. the risk of a cycle casualty per billion km cycled) ; and
• Perception based indicators (e.g. what proportion of cyclists and non-cyclists alike perceive cycling to be safe in their area).
4 Promotion of cycling (‘smarter choices’)
Schools and workplaces
Report from the ‘Get Britain Cycling’ APPCG Inquiry
59
4.1 The Departments for Education (DfE) and for Business Innovation and Skills (BIS) should play much more active roles in promoting cycling in schools and in workplaces respectively. 4.2 Schools, colleges and employers alike should be incentivised to promote cycling for their pupils and work-forces respectively, e.g. through bike to school and bike to work initiatives (see also 4.6 and 4.9 - 4.10). They should be encouraged to work with local authorities and others to improve cycle access, cycle parking, and facilities such as lockers and showers – with funding made available to support this. They should not simply seek to ban or restrict cycle use, or to impose helmet rules – these are not only misguided in terms of health and safety, but may also be illegal. Diversity 4.3 There should be dedicated funding to promote cycle use among communities and groups with relatively low levels of cycle use, including: women and teenage girls, black and minority ethnic communities, health patients, and people with all forms of disability, and other disadvantaged groups and communities. Cycling is a particularly effective way to tackle health inequalities. Cycle training 4.4 Bikeability cycle training should be made widely available, not just for younger children (aged c9-10) but also for teenagers (as they gain greater independence and need to make greater use of busier roads for longer journeys), and for adults (who may wish to discover or rediscover cycling in later life). 4.5 A balance must be struck between the need to communicate safety messages without overstating the risks of cycling. The aim should be to give trainees the confidence and skills to enjoy cycling safely, including on busy roads and junctions. They should be encouraged to use eye contact and road positioning to ensure they can see, be seen and be noticed by other road users, and to avoid being overtaken where this would be hazardous. 4.6 Bikeability cycle training should be incorporated into the national curriculum. 4.7 Research should be conducted into the presumed safety benefits of “Bikeability” cycle training, not just for improving participants’ safety when

Report from the ‘Get Britain Cycling’ APPCG Inquiry
60
cycling but also its impact on their wider road safety awareness, e.g. how quickly they learn to drive, and/or their safety as drivers (see also 3.4). Events and promotional activities 4.8 Support should be given to led rides, mass rides, bike breakfasts, bike festivals and similar activities which give people an opportunity to ‘give cycling a try’. The role of the health sector 4.9 As public health directors’ roles are transferred from the NHS to local authorities (from April 2013), stronger links should be forged nationally and locally between transport and public health, particularly in the light of NICE’s public health guidelines on active travel. 4.10 As Europe’s largest employer, the NHS should be encouraged to show leadership by becoming a role model of a cycle-friendly employer. Cycle maps and journey planners 4.11 Good cycle maps (suggesting a comprehensive network of route options, not just designated “cycle facilities”) and online journey planners are valuable tools for giving people the confidence to try cycling. Publicity and imagery 4.12 Cycling should be promoted as a safe, normal, enjoyable and aspirational activity for people of all ages, backgrounds and abilities. Cycling imagery should show diverse people, wearing smart or ‘normal’ clothing. 5 Integration with public transport
5.1 Cycling should be promoted in conjunction with public transport as a healthy and sustainable door-to-door option for longer-distance journeys. This can be done through:
• Good access to, from and within stations and interchanges • Secure, sheltered and accessible cycle parking; • Cycle centres (offering cycle hire, repair and storage facilities) at larger
stations and interchanges; • Providing cycle carriage space on new and refurbished trains and trams
(also on some buses, e.g. for more lightly used routes serving areas which are popular for recreational cycling activity, including mountain biking);

Report from the ‘Get Britain Cycling’ APPCG Inquiry
61
• Allowing reasonable use of cycle space on public transport vehicles, including optional reservation systems on longer-distance train services for which seats are also reservable;
• Providing good information and publicity about the options for cycle-public transport travel, including information on which services permit cycle carriage, and clear signing on trains to show where cycle spaces are located;
5.2 Public transport operators should gather both data and stakeholder feedback (e.g. through cycle user forums) that can be used assess the value investing in cycle integration, and information about what measures are working and what improvements may be possible. 6 Miscellaneous: partnerships, data and performance monitoring 6.1 Partnerships should be formed nationally and locally with key partners involved in health, education, businesses and employers, planning, developers and economic development agencies (in both urban and rural areas), retailers, the leisure and tourism sectors, public transport operators, traffic law and enforcement, and the voluntary and community sectors. 6.2 Improved data is required on cycle use at the local level, to measure progress towards increased cycle use and improved cycle safety, and identify what measures are proving most effective (and cost effective) at achieving the aims of more and safer cycling. 6.3 Stakeholder engagement (e.g. through cycle forums including the kinds of partners engaged in the Inquiry) is important to help assess what is working and where improvements are possible, and to inform the development and renewal of relevant local and national strategies, policies and programmes – e.g. on transport, planning and road safety, as well as cycle-specific policies.

Report from the ‘Get Britain Cycling’ APPCG Inquiry
62
Recommendations of the All Party Parliamentary Cycling Group
Finally I include here the recommendations which the APPCG itself agreed, following discussion and consideration of the evidence in the Inquiry. While helping in the assembly of evidence and discussion of principles, it should be clear that it is the APPCG itself which ‘owns’ these recommendations and will pursue their implementation. The ‘We’ in the following text is the All Party Parliamentary Group members, and, in the style of political discussion, the national interest. The content accords with my own interpretation of the evidence and of the strategic role that cycling can play.
VISION
Our vision is to realise the full potential of cycling to contribute to the health and wealth of the nation, and the quality of life in our towns and local communities. We believe this is both possible and necessary.
We need to get the whole of Britain cycling: not just healthy people or sporty young males, but people of all ages and backgrounds, in both urban and rural areas.
We need to change the culture of how we use our roads, so that people are no longer afraid to cycle or allow their children to do so. Our streets, roads and local communities, need to become places for people, where cycling and walking are safe and normal.
Increases in cycling recently achieved by towns in Britain (even with quite modest investment), and other cities like Seville and New York, suggests that this is possible, if the funding and the political will is there. Some strong messages came from the enquiry:
• the need for vision, ambition and strong political leadership – including a national Cycling Champion.
• the Government needs to set out an action plan for more and safer cycling with support from the Prime Minister down.
• We need transformation of our towns, streets and communities, and to the way we think about cycling, whether as drivers or as people who might take up cycling ourselves.
• Our vision is for a dramatic increase in the number and diversity of people who cycle, because they see it as a safe and normal activity.
• We suggest that the long-term ambition should be to increase cycle use from less than 2% of journeys in 2011, to 10% of all journeys in 2025, and 25% by 2050.
RECOMMENDATIONS

Report from the ‘Get Britain Cycling’ APPCG Inquiry
63
Our recommendations are divided into five broad topics.
1 A new priority for investing public funds 2 Redesigning our roads, streets and communities 3 Safe driving and safe speed limits 4 Training and education 5 Political leadership
A NEW PRIORITY FOR INVESTING PUBLIC FUNDS
Whether by helping people get to workplaces, reducing the phenomenal cost of physical inactivity to the health service or alleviating the strain on local public transport, our economy is boosted every time a journey is made by bike.
Dutch cities reap massive economic benefits because of a consistently high level of investment for several decades (now £24 per person per year). Although London now plans to spend £14, Scotland is up to £4 and other cities are increasingly following, England outside the capital still spends less than £2 per head; far too low to seriously increase cycling levels. Investment now would help government realise the full financial potential that cycling can deliver.
It is essential that the patterns of spending on cycling should be seen as mainstream commitments, with long term continuity rather than temporary ‘initiatives’. While these are welcome, they should be in addition to a much larger sustained base of funding, not in place of it.
Many of the improvements that would benefit cyclists, such as improvements to road quality, creation of segregated cycle tracks and junction changes, will also benefit pedestrians and other road users. They should therefore form part of planned highway maintenance programmes.
Money is needed for both capital and revenue budgets. Creating cycle-friendly roads, junctions and cycle facilities will require significant capital spending over many years. In the meantime though, some well-targeted revenue funding for cycle training and other ‘smarter choices’ measures could help kick-start the process of Getting Britain Cycling with some highly cost-effective ‘quick wins’.
Recommendations
• Create a cycling budget of £10 per person per year, increasing to £20 • Ensure local and national bodies, such as the Highways Agency, Department for
Transport, and local government allocate funds to cycling of at least the local proportion of journeys done by bike.
• Cycle spending that makes a tangible contribution to other government
departments, such as Health, Education, Sport and Business, should be funded from those budgets, not just the DfT.

Report from the ‘Get Britain Cycling’ APPCG Inquiry
64
Redesigning our roads, streets and communities
Too often cycle routes have been designed piecemeal or cyclists have been an afterthought in highway design. As we saw from some best practice areas, ‘thinking bike’ at the beginning of a design and planning process can reap dividends for other road users as well as cyclists.
Suitable road surfaces, arrangements at junctions, and interactions with other traffic are often about planning rather than cost. Cycle friendly driving styles and the speed of passing vehicles can be supported by suitable design. Small improvements such as a well-placed bollard or junction redesign can make a big difference.
Purpose-designed exclusive rights of way, segregated from other traffic, are ideal, especially as part of of a network of cycle paths and lanes, making use of verges, parallel rights of way, disused railways, bridal paths and similar. Continuity of funding would enable better and more cost effective planning of connected segregated routes.
Designated on-road lanes play an important role where segregation is not appropriate, and may require reallocation of road space. They need to be substantial – too often in the past they have been token gestures, ending abruptly at junctions, weaving across pavements, or just too narrow.
We were struck by the Highways Agency witnesses’ candour in acknowledging that most of his profession had little knowledge or training in how to design for cycling. This will need to be remedied.
Bike security is also an important factor in people’s decision to cycle and we call for more secure bike parking at both ends of a journey – including at railway stations.
Recommendations
• a statutory requirement that cyclists’ and pedestrians’ needs are considered at an early stage of all new development schemes, including housing and business developments as well as traffic and transport schemes, including funding through the planning system
• revise existing design guidance, to include more secure cycle parking, continental
best practice for cycle-friendly planning and design, and an audit process to help planners, engineers and architects to ‘think bike’ in all their work.
• The Highways Agency should draw up a programme to remove the barriers to
cycle journeys parallel to or across trunk roads and motorway corridors, starting with the places where the potential for increased cycle use is greatest.
• Local authorities should seek to deliver cycle-friendly improvements across their
existing roads, including small improvements, segregated routes, and road reallocation.

Report from the ‘Get Britain Cycling’ APPCG Inquiry
65
• The Department for Transport should approve and update necessary new regulations, such as allowing separate traffic lights for cyclists and commencing s6 of the Road Traffic Act 2004.
SAFE DRIVING AND SAFE SPEED LIMITS
Cycling is a safe activity – especially when compared to the health risks of physical inactivity. Yet there are collisions and deaths on our roads. These are tragic and avoidable. Fears over safety are a major barrier to getting more people cycling. Evidence from the UK and elsewhere show that places with high cycle use are the safest places to cycle: more cycling leads to safer cycling, and vice versa. More cycling and less motor traffic also creates safer streets for everyone else too. Heavy Goods vehicles are disproportionately involved in deaths and serious injuries, despite some excellent work by some freight organisations. We support the widespread extension of 20mph speed limits as the default value on urban streets, with exceptions (whether higher or in some cases lower) being determined by positive decision at local level. We accept that roads used largely as the main conduits for through traffic will continue to have higher speed limits, and where this is decided, alternative cycle provision should be provided. Although roads going through rural areas may not be suitable to a general approach such as this, there are many rural lanes where speed limits of 40mph or less are entirely justified on general safety grounds, and we support the successful implementation of these. We are very concerned that the Police seem not to be interested in enforcing the law when it comes to speed limits, and a tacit acceptance that enforcement of such limits is mainly a matter of design and education, and outside the scope of ordinary policing, penalties, and courts. This undermines respect for the law, reduces its impact, and costs lives. Similarly, the courts and justice system too often produce trivial sentences even when avoidable deaths and injuries are caused by drivers. This sends a damaging message. Equally, cyclists should of course obey the law when cycling. Recommendations
• Extend 20 mph speed limits in towns, and consider 40mph limits on many rural lanes.

Report from the ‘Get Britain Cycling’ APPCG Inquiry
66
• Improve HGV safety by vehicle design, driver training, and mutual awareness with cyclists; promote rail freight and limit use of HGVs on the busiest urban streets at the busiest times, and use public sector projects to drive fleet improvements.
• Strengthen the enforcement of road traffic law, including speed limits, and
ensuring that driving offences – especially those resulting in death or injury - are treated sufficiently seriously by police, prosecutors and judges.
Training and education
Most children do not cycle. We need to encourage young people to ride a bike as a healthy, active, cheap and fun experience and help them cycle as much as they can. Cycle training is a cheap and effective way of promoting activity that children can do outside school, can be integrated into sport in school and can help tackle childhood obesity. It is a skill that they will be able to use for their whole lives. Despite the Government’s support for Bikeability cycle training (which was described to us as “cycle proficiency for the 21st century”), it is currently only available for about half of all school pupils in England, with even fewer being trained to level 3 Bikeability in their teens. It should be available to all – as swimming is.
Better training at an early age will also train future car drivers to think bike and could have a long term impact on driver safety.
People of all ages should be enabled to give cycling a try, and particularly those we know cycle less: people with disabilities, ethnic minorities and those from disadvantaged backgrounds. The Department for Transport’s own research shows that smarter choices measures of this kind are highly cost-effective ways to boost cycle use. Transport for London’s ‘Catch up with the bicycle’ campaign is an excellent example of how to promote cycling as stylish and aspirational, which anyone can do in their normal clothes. Cycling must become a normal activity, not a minority pursuit.
Recommendations
• Provide cycle training at all primary and secondary schools
• Offer widespread affordable (or free) cycle training and other programmes to encourage people of all ages and backgrounds to give cycling a try, as evidenced by NICE.
• Promote cycling as a safe and normal activity for people of all ages and
backgrounds.
POLITICAL LEADERSHIP
Report from the ‘Get Britain Cycling’ APPCG Inquiry
67
It is striking that the places where best practice has been developed furthest, and the greatest successes seen, have been those where politicians at the highest levels have made an explicit, genuine commitment. To Get Britain Cycling we need vision and leadership from the very heart of government.
But it is not a task for central government alone. Local authorities and devolved administrations have an important role to play, particularly given their responsibilities for promoting public health. They also need to work with a huge range of partners in the transport sector and beyond.
National and local Government should designate cycling responsibilities at the highest professional and political levels, these being a major part of their job description and not simply a formal responsibility. There needs to be a commitment at local government levels particularly to sweeping away unnecessary barriers to implementation of suitable measures.
The Government should produce a Cycling Action Plan, drawn up with a wide range of partners and signed by the Prime Minister. This must include the roles of different government departments – the Home Office, MoJ, DCLG, DCMS, DEFRA, DfE and BIS all have key roles to play and should make clear commitments, not just leaving cycling within the Department for Transport.
This National Cycling Action Plan should have clear timescales and deliverables, and lead to annual progress reports, which should be published and debated in Parliament. These should include better data on cycle use, cycle safety and perceptions of cycle safety.
Recommendations
• The Government should produce a cross-departmental Cycling Action Plan, with annual progress reports.
• The Government should appoint a national Cycling Champion, an expert from outside the Department for Transport.
• The government should set national targets to increase cycle use from less than 2% of journeys in 2011, to 10% of all journeys in 2025, and 25% by 2050
• Central and Local government and devolved authorities should each appoint a lead politician responsible for cycling.

Report from the ‘Get Britain Cycling’ APPCG Inquiry
68
Annex 1 Summary of advice from NICE, The National Institute for Health Care
Excellence
Walking and cycling should become the norm for short journeys and should be encouraged throughout local communities says NICE, in new guidance published on 28 November 2012. Local authorities, schools and workplaces should introduce ways to enable their communities to be more physically active and change their behaviours. Regular physical activity is crucial to achieving and maintaining a healthy lifestyle. It can help to reduce the risk of coronary heart disease, stroke and type 2 diabetes by up to 50%i, and is also important for good mental health. At present, we are not active enough as a nation - around two-thirds (61%) of men and nearly three-quarters (71%) of women aged 16 and over are not physically active enoughii. Just over half of boys aged two to 10 years old and a third of girls in the same age group achieve the recommended level of daily physical activity. Physical inactivity is the fourth leading risk factor for global mortality (accounting for 6% of deaths globally)iii. Walking is the most common recreational and sporting activity undertaken by adults in Britain, with cycling the fourth most commoniv. The majority (85.8%) of adults claim that they can ride a bicycle, yet the average time spent travelling on foot or by bicycle has decreased; from 12.9 minutes per day in 1995/97 to 11 minutes per day in 2007v. Cycle use is lower in Britain than it is in other European Union countries; bicycles are used in around 2% of journeys in Britain compared with about 26% of journeys in the Netherlands, 19% in Denmark and 5% in Francevi. This is the first time that NICE has published guidance for organisations and institutions, such as schools, workplaces and local authorities that have a responsibility or influence over local communities, to encourage them to promote physical activity specifically through walking and cycling. NICE recommends coordinated action to identify and address the barriers that may be discouraging people from walking and cycling more often or at all. These include:

Report from the ‘Get Britain Cycling’ APPCG Inquiry
69
• Implement town-wide programmes to promote cycling for both transport and recreational purposes. These could include cycle hire schemes, car-free events or days, providing information such as maps and route signing, activities and campaigns that emphasise the benefits of cycling, fun rides, and others.
• Ensure walking routes are integrated with accessible public transport links to support longer journeys. Signage should give details of the distance and/or walking time, in both directions, between public transport facilities and key destinations.
• Develop and implement school travel plans that encourage children to walk or cycle all or part of the way to school, including children with limited mobility. Pupils should be involved in the development and implementation of these plans.
• Ensure walking and cycling are considered alongside other interventions, when working to achieve specific health outcomes in relation to the local population (such as a reduction in the risk of cardiovascular disease, cancer, obesity and diabetes, or the promotion of mental wellbeing).
The guidance emphasises that encouraging and enabling people to walk or cycle requires action on many fronts, and from a range of different sectors. An integrated approach is needed to achieve the potential public health benefits. The British Heart Foundation.
ii. Craig R, Mindell J, Hirani V (2009). Health survey for England 2008. London: The Health and Social Care Information Centre. iii. Chief Medical Officers of England, Scotland, Wales and Northern Ireland (2011) Start active, stay active: a report on physical activity from the four home countries´ Chief Medical Officers. iv. Swimming is the second most common recreational and sporting activity undertaken by adults in Britain, with keep-fit the third most common. Sport and leisure module of the 2002 General Household Survey. v. Department for Transport, 2010.

Report from the ‘Get Britain Cycling’ APPCG Inquiry
70
vi. Ministry of Transport, Public Works and Water Management, The Netherlands, 2009 About the guidance
1. The guidance is available on the NICE website. 2. Although NICE public health guidance is not statutory, the NHS, local
authorities and the wider public, private, voluntary and community sectors are expected to follow it.
3. Adults (19-64 years) should be doing at least 150 minutes of moderate intensity activity over the week, in bouts of 10 minutes or more. Activities could include brisk walking or cycling. Older adults (65 years +) should aim to be active daily. Over a week, activity should add up to at least 150 minutes of moderate intensity activity in bouts of ten minutes or more. Children and young people (5-18 years) should engage in moderate to vigorous intensity physical activity for at least 60 minutes and up to several hours every day. (Department of Health, July 2011).The full UK physical activity guidelines can be found on the DH website.

Report from the ‘Get Britain Cycling’ APPCG Inquiry
71
Annex 2 List of written evidence received (to be added)

Report from the ‘Get Britain Cycling’ APPCG Inquiry
72
Annex 3 Witnesses giving evidence at sessions of the Inquiry
Session 1
British Cycling: Martin Gibbs CTC: Roger Geffen Cyclenation: Andre Curtis Sustrans: Jason Torrance Bicycle Association: Phillip Darnton Transport for Quality of Life: Lynn Sloman University of Westminster: Rachel Aldred Bikebiz: Carlton Reid The Guardian: Peter Walker The Times: Kaya Burgess and Phillip Pank Session 2
Automobile Association: Edmund King Institute of Advanced Motorists: Neil Greig Freight Transport Association : Karen Dee The Association of Bikeability Schemes: David Dansky British Cycling: Martin Gibbs CTC: Chris Peck Transport & Health Study Group: Jenny Mindell Parliamentary Advisory Council for Transport Safety: David Davies Martin Porter QC Ministry of Justice: Martin Jones Metropolitan Police: Chief Inspector Ian Vincent RoadPeace: Amy Aeron-Thomas Session 3
• CTC – Chris Peck
Report from the ‘Get Britain Cycling’ APPCG Inquiry
73
• Sustrans – Tony Russell • LCC – Gerhard Weiss • Ibikelondon – Mark Ames • CILT – Chartered Institute of Logistics and Transport – Adrian Lord • South Bank University – John Parkin • Dr.Dave Horton • Highways Agency – Mike Wilson • Urban Initiatives – John Dales • 20s Plenty – Rod King • Living Streets – Tony Armstrong • Phil Jones Associates – Phil Jones Session 4
Chris Boardman Sustrans - Phil Insall Dr Adrian Davis The Department of Health The Cycle to Work Alliance NICE The Forestry Commission Department for Culture, Media and Sport Natural England Mountbatten School, Hampshire Session 5
Anna Soubry MP, Parliamentary Under Secretary of State at the Department of Health Caroline Pidgeon AM, from the London Assembly Transport Committee Transport for London Local Government Association Cyclenation Cambridge Cycling Campaign Association of Train Operating Companies (ATOC) Transport for Greater Manchester

Report from the ‘Get Britain Cycling’ APPCG Inquiry
74
London Cycling Campaign Transport for London Borough Cycle Officers Group Campaign to Protect Rural England (CPRE) Devon County Council Leicester City Council Session 6
Norman Baker MP, Parliamentary Under Secretary of State at the Department of Transport Stephen Hammond MP, Parliamentary Under Secretary of State at the Department of Transport Carl Sargeant AM, the Minister for Social Justice and Local Government from the Welsh Assembly Government Jon Snow Andrew Gilligan, Cycling Commissioner for London Isabel Dedring, Deputy Mayor of London The Association of Chief Police Officers The Crown Prosecution Service European Cycling Federation Dutch Cycling Embassy

Funded by