get real! individuals prefer more sustainable investments · get real! individuals prefer more...
TRANSCRIPT

Get Real!
Individuals Prefer More Sustainable Investments
Rob Bauer∗ Tobias Ruof† Paul Smeets‡
December 4, 2018
Abstract
Do people put their pension savings on the table to promote sustainability? We answerthis question in a large-scale field experiment (n = 3,256). The pension fund in our studygave its members a real vote for more or less sustainable investments. A comparison groupmade the same decision, but hypothetically. We find that 66.7% of the participants favorto invest their pension savings in a more sustainable manner. This choice is driven by socialpreferences. As a result of these strong social preferences, we find no difference betweenthe real and hypothetical treatment groups. Neither financial beliefs, confusion, nor alack of information serve as explanation. Institutional investors benefit from taking theirclients’ social preferences seriously, with consequences for asset prices and the fulfillmentof the United Nations Sustainable Development Goals.
Keywords: field experiment, social preferences, socially responsible investments,sustainable finance, experimental finance
JEL Classification: G02, G20, G23, G28
We are grateful to Pensioenfonds Detailhandel for enabling us to collect the data used in this paperand we particularly thank Henk Groot, Henk van der Kolk, Andre Snellen, and Rene Upperman.We thank seminar participants at Radboud University, at Nijmegen University, and at MaastrichtUniversity. We are also grateful to the valuable comments of Jaap Bos, Inka Eberhardt, PietEichholtz, Peiran Jiao, Matthijs Korevaar, Joyce Mertens, Luuk Perik, Thomas Post, DrazenPrelec, Paulo Rodrigues, Lidwien Sol, Martin Strobel, Matthias Wibral, and Leonard Wolk. Thispaper is financially supported by an Inquire grant. Paul Smeets is supported by a VENI grant fromthe Netherlands Organisation for Scientific Research (NWO) under grant number 016.Veni.175.019.The authors declare no conflict of interest.
∗Department of Finance, Maastricht University (MU) and European Centre for Corporate Engagement(ECCE), School of Business and Economics, Maastricht University, and International Centre for Pension Man-agement (ICPM), Toronto, Canada.†Corresponding author: Department of Finance, MU and ECCE (phone: +49 (0) 157 34320361; e-mail:
[email protected])‡Department of Finance, MU and ECCE, Maastricht University
1

1 Introduction
1 Introduction
People often claim to behave in a sustainable manner, but do not back their talk by action.1
They state to care for animal well-being but buy the cheapest meat in the supermarket (Klink
and Langen, 2015). The hypothetical gap is the difference between what people say they do and
what they actually do. It is the difference between stated preferences and revealed preferences
(List and Gallet, 2001; Carson et al., 2006; Harrison, 2006a; Beshears et al., 2008).2 We compare
sustainable investment decisions with real consequences to hypothetical decisions.3 Sustainable
investments grew in importance over the last years. They comprise more than a quarter of
the assets under management worldwide (McKinsey, 2017).4 The implementation of the 2015
United Nations Sustainable Development Goals further illustrates the societal relevance of
sustainable behavior. Consequently, sustainable investment behavior has attracted increased
attention from academics (e.g. Hong and Kostovetsky 2012; Kruger 2015; Bialkowski and Starks
2016; Barber et al. 2018; Riedl and Smeets 2017; Hartzmark and Sussman 2018; Kruger et al.
2018).
Understanding why people invest sustainably is not only important to academics, but also to
institutional investors who often invest on behalf of individuals. Pension funds alone hold more
than half of all assets under management (Willis Tower Watson, 2018).5 How should pension
funds manage their fiduciary duty regarding sustainable investments? How should they decide
on behalf of their clients? The European Commission installed a High-Level Expert Group on
Sustainable Finance in 2017. On the basis of the experts’ proposal, the Commission intends to
introduce a formal requirement that ”Investment firms. . . [should ask retail investors] about
their preferences for sustainable investments.”6
We provide a scientifically valid method to elicit these preferences. We conducted a large-
scale field experiment (n = 3,256) in cooperation with a Dutch pension fund which had 18.7
1 See for example Cummings and Taylor (1998, 1999); List and Shogren (1998a,b, 2002); List (2001); Ajzen et al.(2004); Harrison et al. (2004); Harrison (2006b); Vermeir and Verbeke (2006); Beshears et al. (2008); Harrisonand Rutstrom (2008); Gracia et al. (2011); FeldmanHall et al. (2012); De-Magistris et al. (2013); Terlau andHirsch (2015); for an overview see Harrison (2006b); Loomis (2014); for a meta-study see List and Gallet (2001);Murphy et al. (2005).
2 The gap between what people say and what they do has received various names next to the hypothetical gap,namely: the hypothetical bias, the intention-behavior gap, the attitude-behavior gap, normative vs revealedpreferences, the value-action gap, the judgment-action gap, or the green gap (without claiming completeness).In this paper, we will refer to it as hypothetical gap.
3 Examples for findings of a hypothetical gap outside the economics literature are Rhodes and de Bruijn (2013) whofind a gap between the intention to engage in physical activity (hypothetical) and actual engagement (see alsoJennings et al. 2015; Osman and Wiegmann 2017). John et al. (2012) report a gap between reported and actualquestionable medical research practices. And the question of moral decision-making has led psychologists andmoral philosophers to study the gap between hypothetical and real choices. The judgment-action gap therebydescribes the difference between what people say they do when being confronted with a moral decision andwhat they actually do. FeldmanHall et al. (2012) show that real moral decisions can substantially differ fromhypothetical moral decisions.
4 McKinsey (2017) reports that investments according to environmental, social, and governance principles aregrowing by an annual rate of 17%. In the United States, sustainable investments account for over a third andin Europe for half of all assets (JP Morgan, 2018).
5 According to an estimate by Willis Tower Watson (2018), pension funds worldwide hold USD 45 trillion assetsunder management.
6 See https://ec.europa.eu/info/sites/info/files/180524-sustainable-finance-factsheet en.pdf.
2

1 Introduction
billion euros of assets under management in 2016.7 This defined-benefit pension fund invests
on behalf of its members. As part of our experiment, the board of the pension fund gave
its members a real vote on its future sustainable investment strategy. Participants faced the
choice of more or less sustainable investments. The board guaranteed that it will implement the
outcome of the voting. Pension savings of the members are at stake, so the choice is relevant.
We told participants that sustainable investments not only focus on financial returns but also
on societal returns. Our experiment had different treatments. Next to the real choice, another
group made a hypothetical choice which was identical, but without consequences.
Our experimental design has three key advantages. First, the consequential vote with
only two choices makes our experiment incentive-compatible (Cummings et al., 1995, 1997;
Harrison, 2006a; Carson and Groves, 2007).8,9 We are not aware of any pension fund that gave
its members a consequential vote on the investment strategy of the whole pension plan. Second,
the political preferences of our sample are close to the outcome of the last national election in
the Netherlands. This is important, because it assures that our sample did not overrepresent
voters in favor of sustainable investing (like supporters of the Green Party or the Animal Party),
nor underrepresent voters of parties known to be skeptical about sustainability10. Third, we
published a pre-analysis plan of our study at the Open Science Framework11, in which we
specified our measures, sampling procedure and analyses.
We find that 65.4% of participants in the hypothetical treatment favor to invest their pension
savings more sustainably. Only 9.6% are against it and 25.0% do not have an opinion. Strik-
ingly, hypothetical answers do not differ from real answers. In the real treatment, 67.9% are in
favor of investing more sustainably. We also find no difference among those who are against the
sustainable expansion (Real: 10.8%; Hypothetical: 9.6%) and a very small difference among
those with no opinion (Real: 21.2%; Hypothetical: 25.0%).
Why do we not find a hypothetical gap? We explore three possibilities. First, participants
might expect sustainable investments to financially outperform conventional investments and
would thus choose more sustainable investments regardless of their treatment. Second, partic-
ipants could have strong social preferences in favor of sustainable investments in which case
hypothetical and real choices would be the same. Take a vegan who chooses a vegetable dish
over meat in both a hypothetical and real setting. Third, subjects might have been confused
or did not take their real choice seriously. This would render the real choice to be of mere
hypothetical nature.
7 See https://www.ipe.com/Uploads/v/a/k/Top-1000-European-Pension-Funds.pdf.8 A choice set with more than two choices opens the door for strategic voting. Imagine a person has to choose
from three options A,B, and C and the option chosen by the majority will be implemented. Further imaginethe person’s preferences to be A � B � C. If she expects that option A will be chosen by only very few people,it can be optimal for her to pick option B to at least avoid option C. This would however imply that she didnot pick the option which maximized her utility. Therefore, the choice is not incentive-compatible.
9 The lacking incentive-compatibility of stated preferences can be of serious concern as it opens the door forinterfering answering motives such as socially desirable answering (e.g. Lusk and Norwood 2009; Grimm 2010;Norwood and Lusk 2011; Klink and Langen 2015).
10 Several studies show that political preferences are a valid proxy for social preferences: Fisman et al. (2017);Kerschbamer and Muller (2017); Almas et al. (2016); Cohn et al. (2018).
11 See https://osf.io/pz7rn/.
3

1 Introduction
We show that financial beliefs do not drive the choice for more sustainability through two key
findings. First, we find a majority voting for the more sustainable option even among those who
should be least likely to vote in favor, specifically subjects who expect lower financial returns
with more sustainable investments and subjects who are uncertain about the returns. Second, a
substantial fraction of participants in the real treatment are willing to give up financial returns
in order to invest more sustainably. This question was asked directly after their vote and thus
should have made respondents more reluctant to state that they are willing to accept lower
returns as they knew that their choice might be implemented. Much rather, we find strong
social preferences to drive the choice for more sustainable investments. First, a validated
measure of social preferences (Falk et al., 2016) is positively related to the choice for more
sustainable investments. Second, we find that people who voted for a political party with
a stronger sustainability agenda are more likely to support more sustainable investments by
the pension fund. Third, the choice for sustainable investments is not influenced by different
defaults. The absence of default effects is another sign of strong preferences.12 Expectations
on the financial performance do not drive our results. We also show that confusion or lack of
information do not drive our results.
Our paper makes three main contributions. First, we contribute to the discussion on sus-
tainable investing. Previous findings show that investors value sustainability in their investment
decisions (Bollen, 2007; Hong and Kostovetsky, 2012; Barber et al., 2018; Hartzmark and Suss-
man, 2018). Yet, these aggregate-level studies cannot inform institutional investors how to
invest on behalf of their clients. The data do not show what fraction of individuals has strong
social preferences. Riedl and Smeets (2017) use individual-level data to show that sustainable
investors indeed have strong social preferences. However, in their study individuals invest on
their own behalf and their investment decisions cannot simply be generalized to a setting of
delegated portfolio management. In particular, if people’s pension is at stake, choices could be
very different. We show that social preferences play an important role in delegated investment
decisions. Pension fund members are even willing to forego financial returns to invest in a
sustainable manner.
Second, we add to the literature on the hypothetical gap. In contrast to most of this
literature, we find no hypothetical gap (e.g. Brown et al. 1996; List and Shogren 1998a; Loomis
et al. 2009). Previous papers identify different factors that contribute to the existence of a
hypothetical gap, such as socially desirable answering (e.g. Lusk and Norwood 2009; Grimm
2010), certainty of choices (Champ et al., 1997; Ethier et al., 2000; Champ and Bishop, 2001),
trust (Terlau and Hirsch, 2015), the perceived effectiveness of one’s own choice (Kollmuss and
Agyeman, 2002; Fowler III and Close, 2012; Salomon et al., 2017; Berger and Corbin, 1992), the
seriousness of the task (De-Magistris et al., 2013), or whether people feel responsible (Blake,
1999). We show that it is also crucial to measure the strengths of people’s preferences. If these
preferences are weak, a hypothetical gap is more likely to arise than with strong preferences.
12 Two of the main drivers responsible for the status quo bias are loss aversion and regret avoidance (Samuelsonand Zeckhauser, 1988; Kahneman et al., 1991; Tversky and Kahneman, 1991; Feldman et al., 1999; Nicolle et al.,2011) which should especially matter for choices with real consequences.
4

2 The experimental design
In our case, the absence of the hypothetical gap in sustainable behavior can be explained by
strong social preferences.
Third, we contribute to a growing stream of literature on social preferences in the field
(e.g. Frey and Meier 2004; Gneezy and List 2006; List 2006; Gneezy et al. 2010; DellaVigna
et al. 2012; Andreoni et al. 2017; Kessler et al. 2018). Specifically, we study how pension
funds should deal with the social preferences of their clients. It has become commonplace to
acknowledge the influence of time preferences on retirement decisions (O’Donoghue and Rabin,
1998; Carroll et al., 2009; Beshears et al., 2014; Goda et al., 2015). Similarly, several studies
show how to elicit risk preferences of pension fund participants (Donkers et al., 2012; Alserda
et al., 2016). However, social preferences are not yet considered (EUROSIF, 2016, p. 82).
Investment managers often fear that this is too difficult and too costly.13 Such concerns could
lead to a poor execution of the European Commission’s directive. We show a simple, validated
way to elicit preferences for sustainable investments. If pension funds take these preferences
seriously, this can have a large economic and societal impact.
2 The experimental design
In June 2018, we invited 49,552 active members of Pensioenfonds Detailhandel to participate
in our online survey. The survey consisted of three parts. Part 1 briefly familiarized all re-
spondents with the concept of sustainable investments and introduced the United Nations
Sustainable Development Goals (SDGs).14 You can find the instructions and questions we use
in Appendix B. In Part 2, we introduced our 2x2 between-subjects experimental design (see
Table 1). Respondents were randomly assigned to one of four groups and were unaware of the
existence of other treatment groups. The 2x2 design comprised the dimensions (real choice
vs hypothetical choice) x (3 SDG default vs 4 SDG default). We explain these treatments in
more detail below. Part 3 elicited social preferences and financial return expectations regarding
sustainable investments. Further, we asked respondents to provide information on their gender,
age, and education; on their financial background; and on their voting behavior in the 2017
Dutch national elections. Part 3 was identical across all treatments.
Table 1 – The experimental 2x2 design.
3 SDG default 4 SDG defaultReal I IIHypothetical III IV
In Part 1, respondents learned that they would decide on the sustainable investment strategy
of their pension fund. The exact framing of the decision depended on the respective treatment
13 See, for example, a statement by the BVI, a German investment fund association representing asset managerswith over EUR 3 trillion assets under management (https://www.bvi.de/fileadmin/user upload/Regulierung/Positionen/2018 06 21 BVIs view-MiFID II sustainability requirements.pdf).
14 For more information, see https://www.un.org/sustainabledevelopment/sustainable-development-goals.
5

2 The experimental design
(see below). Importantly, all respondents learned, irrespective of their treatment, that they
would have to state whether their pension fund should focus on three or four Sustainable De-
velopment Goals (SDGs). We explained that investing according to an SDG meant that The
Pension fund would engage with the companies’ board to assure that the company’s policy
and actions are aligned with the respective SDG. We told them that in 2017 Pensioenfonds
Detailhandel had spoken with a total of 246 corporate boards to promote sustainability. In
addition, we gave them several examples of earlier SDG engagement by the Pension Fund. We
explicitly pointed out that focusing on four SDGs would result in more sustainable investment
activities than focusing on three SDGs.
3 SDG default vs 4 SDG default
The first dimension of our 2x2 design consists of the difference between a 3 SDG default and a
4 SDG default. Staying with the default option is a widely found phenomenon, also called the
status quo bias (e.g. Samuelson and Zeckhauser 1988; Tversky and Kahneman 1991). Two of
its main drivers are loss aversion and regret avoidance (e.g. Samuelson and Zeckhauser 1988;
Kahneman et al. 1991; Tversky and Kahneman 1991; Feldman et al. 1999; Nicolle et al. 2011)
which are significantly more important to respondents in the real treatment than to those in
the hypothetical treatment. With the introduction of different defaults, we can account for
differences in the status quo effect on real and hypothetical choices.
In the 3 SDG default treatment, we told participants that the pension fund currently
focuses on three SDGs, namely: ‘Climate action’, ‘Decent work and economic growth’, and
‘Peace, justice, and strong institutions’. Participants were then introduced to the fourth SDG
‘Responsible consumption and production’. They could choose:
”Do you want Pensioenfonds Detailhandel to add the fourth sustainable development
goal ‘Responsible consumption and production’?
a. Yes, add
b. No, do not add
c. I have no opinion regarding this matter”
In the 4 SDG default treatment, we told participants that the pension fund’s future
policy will include four SDGs ‘Climate action’, ‘Decent work and economic growth’, ‘Peace,
justice, and strong institutions’ and ‘Responsible consumption and production’. Participants
could then decide:
”Do you want Pensioenfonds Detailhandel to leave out the fourth sustainable develop-
ment goal ‘Responsible consumption and production’?
a. Yes, leave it out
b. No, do not leave it out
c. I have no opinion regarding this matter”
6

2 The experimental design
Importantly, the question of interest – whether Pensioenfonds Detailhandel should focus on
three or on four SDGs – was the same for all four treatments except for the words ‘add’ or
‘leave out’. Respondents could either choose to add (3 SDG default) or to leave out (4 SDG
default) the fourth SDG. In addition, respondents always had the answer option ‘No opinion’.
Hypothetical vs Real
The second dimension of our 2x2 design consists of the difference between hypothetical vs real
choices. Participants of the real treatment learned:
“[. . . ] Your choice counts. If the majority of respondents chooses to add
(leave out) the fourth sustainable development goal, it will happen. The board of
Pensioenfonds Detailhandel guarantees its implementation.”
In this treatment, we explicitly stress the two key characteristics of their consequential
choice: (1) their vote counts and (2) the board guarantees that the majority vote will be
implemented.
Both these elements are absent in the hypothetical treatment as participants learned:
“[. . . ] Pensioenfonds Detailhandel is genuinely interested in your opinion and
may take the results of the survey into account when making a decision.”
We chose the wording ”may take into account” as it signals interest while it is clearly not
consequential. Consider the following example: John calls his wife and asks her “My dear,
where do you want to go for holiday next summer? I am genuinely interested in your opinion
and might take your answer into account when booking the flights.” Our participants under-
stood the difference between the hypothetical and real choice as 86.0% in the real and 88.1%
in the hypothetical treatment (difference: p-value = 0.0698) correctly answered the following
comprehension question (see Question 2 in Appendix D and E):
”If a majority chooses ’Yes, add’ (’Yes, leave it out’), Pensioenfonds Detailhandel...
a. guarantees to add (leave out) ’Sustainable consumption and production’ to
(of) its socially responsible investment policy as the fourth Sustainable De-
velopment Goal. The Board of Pensioenfonds Detailhandel has decided to
implement the outcome of this vote.
b. cannot guarantee that it will add (leave out) ‘Sustainable consumption and
production’ to (of) its socially responsible investment policy as the fourth
Sustainable Development Goal but may include the results of the survey in
its choice.”
7

3 The data
The correct answer depended on whether the participant was in the hypothetical (b. is
correct) or in the real treatment (a.). In case, the participants incorrectly answered the question,
they were made aware of their misperception.
Everything besides the necessary information within each treatment group was exactly the
same. The 2x2 design therefore allows us to directly capture the effect of consequentiality on
the subject’s choices by taking into account their status quo. The binary nature of the choice
is essential as it assures incentive compatibility (see Cummings et al., 1995; 1997; Harrison,
2006a; Carson and Groves, 2007). Providing participants with multiple options, like choosing
between adding different SDGs, would have introduced incentives for strategic voting (see
Arrow’s impossibility theorem; Arrow 2012). For example, if participants expect that it is
unlikely that their first best choice will get a majority vote, they can strategically vote for the
second-best option.
3 The data
3.1 The participants
Participants in our study are members of Pensioenfonds Detailhandel, a large Dutch pension
fund. The Dutch state requires employees to save for their pension. It is mandatory for
participants to contribute to the pension fund through their current employer. Of the invited
49,552 participants, 3,256 (6.6%) answered the question on whether to add or leave out the
fourth Sustainable Development Goal and 2,429 (4.9%) completed the survey which took on
average 15.3 minutes. Table A.2 presents summary statistics of the respondents. The sample
consists of 61.5% women and 38.5% men, with an average age of 46.4 years. Slightly less than
a third have a university degree or a degree from a university of applied sciences (29.4%). The
average monthly net household income is 2,868 Euro.
Table A.3 shows that our randomization into the real and hypothetical choice treatments
worked. We do not find any significant differences between the treatment groups regarding
their preferences, demographic characteristics and financial background.
3.2 Representativeness of our sample
Surveys face the risk of a biased response sample. This is of special concern in a setting like
ours, where the topic is sustainable investing and people with stronger social preferences might
be more likely to participate in the survey. Yet, our sample is fairly representative of the invited
population. Our sample contains slightly fewer women (61.5% vs 66.5%) and is slightly older
(46.4 years compared to 42.6 years). The yearly income in our sample is 25,832 euro compared
to 24,295 euro in the invited sample. As we show below, men, older people, and people with
a higher income are less likely to expand sustainable investing. Hence, these differences go
against our findings and thus cannot explain our results.
8

3.2 Representativeness of our sample
Second, we tested whether participants in our study have stronger social preferences than
non-respondents, which would likely result in an upward bias in the support for more sustainable
investing at the pension fund. We therefore asked participants to provide information on
whether they voted in the Dutch national elections in 2017 and, in case they did, to name
the party they voted for. Voting behavior is a good proxy for social preferences, because the
relation between social preferences and voting behavior has been well-established. Fisman et al.
(2017) show that equality-focused subjects were more likely to vote for Barack Obama in 2012
and are also more likely to be affiliated with the U.S. Democratic Party. Kerschbamer and
Muller (2017) find that social preferences predict political attitudes. Almas et al. (2016) find
conservatives to systematically accept a higher level of inequality than non-conservatives. Hong
and Kostovetsky (2012) show that U.S. investment managers who donate to the Democratic
Party are more likely to invest in companies which are seen to be socially responsible. Hence,
by comparing the voting behavior of our sample to the outcome of the 2017 Dutch national
elections, we can observe whether we attracted certain voters more than others resulting in a
non-representative distribution of preferences. Table A.4 presents the voting behavior of our
sample. 2,647 respondents answered the question of which 139 did not want to state whether
they voted. The reported voter turnout was 85.4% which is close to the official turnout of
81.6%.15 This is a first indication that our sample is close to representative for the voting
behavior in the Netherlands. Of the 2,142 respondents who voted, 562 (26.2%) did not want to
state the name of the party they voted for. The distribution of votes for the remaining 1,580
respondents resembles the official voting outcome very closely. Importantly, the voter outcome
for parties known to strongly advocate sustainability like the green party (GroenLinks) and the
animal party (Partij voor de Dieren) is close to the official outcome. This is a strong indicator
that we do not have a selection bias of certain preferences which favor sustainable investing.
The only clear difference between the reported voting behavior in our sample and the official
turnout is the share reporting to have voted for the PVV, a Dutch populist party16. Yet, this
finding is in line with previous work showing that people refrain from admitting their support
for extreme groups (Gingerich, 2010; Bullock et al., 2011).
Hence, our sample is close to representative in terms of demographics, financial background,
and social preferences. We will show below that small differences in the characteristics of our
respondents cannot explain our results but even go against our results.
15 The official 2017 parliamentary election results can be found online at https://www.verkiezingsuitslagen.nl/verkiezingen/detail/TK20170315.
16 Its leader, Geert Wilders, ”told supporters he would ensure there were ’fewer Moroccans’ in the country” dur-ing an election campaign in 2014 (https://www.theguardian.com/world/2014/mar/20/dutch-politician-geert-wilders-moroccans-outrage-pvv-party-anti-islam). As a consequence, he was found guilty of inciting racialdiscrimination in December 2016 (https://www.telegraph.co.uk/news/2016/12/09/anti-islam-dutch-mp-geert-wilders-found-guilty-discrimination/). He has further mentioned that he wants to ban all mosques in the Nether-lands (https://www.independent.co.uk/news/world/europe/netherlands-pvv-leader-geert-wilders-koran-islam-mosque-ban-holland-dutch-pm-favourite-a7214356.html).
9

4 Results
4 Results
4.1 The hypothetical gap
In the hypothetical treatment, two thirds (65.4%) of respondents preferred an increased focus
on sustainable investments and chose four SDGs (see Figure 1)17. Only 9.6% of respondents
chose three SDGs, while 25.0% reported to have no opinion. How do respondents choose when
their decisions have real consequences? The literature on the hypothetical gap argues that
respondents should be less likely to choose four SDGs. In contrast to this expectation, 67.9% of
participants in the real treatment favored more sustainable investments and chose four SDGs,
which is almost exactly the same as in the hypothetical treatment (p-value = 0.1245). Similarly,
choices in favor of three SDGs barely differ between the real and hypothetical choices (10.8%
in the real treatment and 9.6% in the hypothetical treatment; p-value = 0.2579). Hence, in
contrast to our expectation and the majority of findings in the literature, the difference between
real and hypothetical choices is non-existent. Only the difference among those without an
opinion is significant, but small in economic terms (real: 21.2%; hypothetical: 25.0%; p-value
= 0.0112). It could indicate that respondents in the real choice treatment do not shy away
from taking responsibility through voting.
Overall, we find a clear majority of 66.7% of participants across all treatments to favor more
sustainable investing. Remarkably, respondents in favor of four SDGs are 6.5 times as many as
those against it (four SDGs: 66.7%, three SDGs: 10.3%).
Result 1: 66.7% of respondents are in favor of expanding sustainable investments. Surpris-
ingly, there is no difference between hypothetical and real choices.
Why do we find no hypothetical gap? There are three potential explanations. First, people
could decide to invest sustainably as they expect these investments to financially outperform
conventional investments. If return expectations are sufficiently high, everybody would opt
for more sustainable investments regardless of the consequentiality of their choice. Second,
participants can have strong preferences for sustainable investments. People who have strong
preferences about their choice are unaffected by whether it is of real or hypothetical nature. A
vegan would choose vegetables over meat no matter whether the choice is real or hypothetical.
People with weaker preferences, however, tend to sway between real and hypothetical choices.
Someone might say that she cares for the environment but if asked to pay the voluntary premium
to make her flight CO2 neutral, she passes. Another person might talk a lot about sustainability,
but when given the chance to expand sustainable investments using his pension savings, he votes
against it. Third, it could be that the real choice in fact looks like a hypothetical choice or that
people are confused. Consequently, there would be no difference between real and hypothetical
choices.
In the following sections, we show that the absence of a hypothetical gap in our sample is
the result of strong social preferences.
17 For now, we do not differentiate between the 3 SDG default and 4 SDG default treatments and look at themjointly. We will get back to this in the next section.
10

4.2 Financial return expectations
Figure 1 – The distribution of real and hypothetical choices.
The graph presents the distribution of real and hypothetical choices regarding the following question: “Doyou want Pensioenfonds Detailhandel to add (leave out) the fourth sustainable development goal ‘Responsibleconsumption and production’?”. Answer options were ‘Yes, add (leave it out)’, ‘No, do not add (leave itout)’, and ‘I have no opinion regarding this matter’. Words in parentheses refer to the different status quotreatments which are looked at jointly here. The graph presents the distribution of real and hypotheticalchoices separately, which refers to whether answering the above-stated question was consequential or not. Inthe hypothetical treatment, choices were nonconsequential. In the real treatment, choices were guaranteed to beimplemented by the pension fund if more than 50% of respondents would choose in favor of three, respectivelyfour SDGs. Error bars present 95% confidence intervals. Non-overlapping error bars indicate a statisticallysignificant difference at the 5% level between the treatments real and hypothetical within each answer category.
4.2 Financial return expectations
In this section, we explore how expectations about financial performance influence sustain-
able investment choices. An important design feature is how to introduce costs and benefits
of sustainable investments. We told participants that investing according to the Sustainable
Development Goals means that not only the financial return counts. For those investments it
is also important to consider the impact on the environment and society. We deliberately did
not mention absolute costs or benefits of sustainable investments, because these are simply un-
known. Several studies show that sustainable investments outperform conventional investments
(Derwall et al., 2005; Edmans, 2011), but other studies rather find an underperformance (Hong
and Kacperczyk, 2009; Barber et al., 2018; Riedl and Smeets, 2017; Hartzmark and Sussman,
2018). The return expectations of individual investors reflect these ambiguous findings regard-
ing realized returns on sustainable investments. Some studies find investors to expect lower
risk adjusted returns (Renneboog et al., 2008; Riedl and Smeets, 2017). Others find investors
to expect higher risk-adjusted returns on sustainable investments (Hartzmark and Sussman,
2018).
11

4.2 Financial return expectations
(a) Distribution of financial beliefs (b) Percentage choosing 4 SDGs per belief cate-gory
Figure 2 – Financial beliefs.
Figure 2(a) shows the distribution of financial beliefs. Figure 2(b) presents the percentage of participants choos-ing four SDGs for each return expectation separately. Return expectations were elicited by asking participantsto answer the following question: “When do you think the investment return is highest?” Answer options were‘It is highest with 3 SDGs’, ‘The return is equally high with 3 or 4 SDGs’, ‘It is highest with 4 SDGs’, and ‘Ido not know’. The categories shown in Figure 2B refer to the following question: “Do you want PensioenfondsDetailhandel to add (leave out) the fourth sustainable development goal ‘Responsible consumption and produc-tion’?”. Answer options were ‘Yes, add (leave it out)’, ‘No, do not add (leave it out)’, and ‘I have no opinionregarding this matter’. Words in parentheses refer to the different status quo treatments which are looked atjointly here. Both figures present the distribution of real and hypothetical choices separately, which refers towhether answering the above-stated question was consequential or not. In the hypothetical treatment, choiceswere nonconsequential. In the real treatment, choices were guaranteed to be implemented by the pension fundif more than 50% of respondents would choose in favor of three, respectively four SDGs. Error bars present 95%confidence intervals. Non-overlapping error bars indicate a statistically significant difference at the 5% levelbetween the treatments real and hypothetical within each answer category.
We also asked participants about their financial return expectations when the pension fund
would focus on 3 or 4 SDGs respectively. Specifically, we asked participants:
”When do you think the investment return is highest?
a. It is highest with 3 SDGs.
b. The return is equally high with 3 or 4 SDGs.
c. It is highest with 4 SDGs.
d. I do not know.”
Figure 2(a) plots the distribution of financial beliefs within our sample. The majority of
56.4% of participants provided a return expectation; 16.3% of participants expect a lower return
with four SDGs (answer a), 15.4% expect a higher return, and 24.7% of respondents think that
there is no difference in returns between investing in three or four SDGs. Return expectations
are clearly not overly favorable toward sustainable investing and are thus unable to explain
that two thirds choose to expand sustainable investments at their pension fund.
Figure 2(b) supports this claim. While we find stronger support for four SDGs if return
expectations are more positive, the majority is in favor of four SDGs independent of return
expectations. The difference between real and hypothetical choices of four SDGs are non-
12

4.3 Strong social preferences
significant. Two findings are especially noteworthy. First, even among those who expect four
SDGs to yield lower returns, 60.8% chose four and only 25.0% three SDGs. Thus, even when
people expect to be worse off, they favor the more sustainable option. Second, literature shows
that people do not like uncertainty and therefore avoid outcomes which increase uncertainty
(e.g. Ellsberg 1961; Mukerji and Tallon 2001; Charness and Gneezy 2010). We find that of
the participants who do not know what returns to expect, 62.6% favor four SDGs. While this
number has to be treated with caution as the uncertain option depends on the default treat-
ment, we find that the majority of subjects chooses four SDGs irrespective of their default.18
Thus, we can confidently say that the majority is in favor of four SDGs independent of return
expectations, even if people do not know what to expect.
Last but not least, we asked participants, who expected similar or higher returns with four
SDGs, whether they would be willing to accept lower financial returns in order to expand sus-
tainable investments? This question was asked directly after return expectations were elicited
and thus shortly after the main question. Respondents in the real treatment thus were aware
of the fact that their choice could have an impact on the investment activities of their pension
fund. More importantly, the fund could thus also consider a willingness to accept lower returns
as the right to give up financial returns in order to increase the social impact of their invest-
ments. Figure 3 shows that 42.4% of participants in the real treatment would go for four SDGs
even if it meant lower returns (Hypothetical: 42.1%, difference: p-value = 0.8761). In other
words, participants did not only choose the more sustainable option regardless of their return
expectations. Almost half of them were even willing to give up financial returns.
All in all, there is no evidence that participants only support more sustainable investments
because they see it as a free lunch.
Result 2: The majority of respondents chooses to expand sustainable investing irrespective of
return expectations. A significant share even accepts lower financial returns in exchange.
In the following subsection, we show that the effect of social preferences on the choice for four
SDGs is unaffected when we control for return expectations in a multinomial logit regression.
4.3 Strong social preferences
We measure social preferences using the validated social preferences measure of Falk et al.
(2016) ”How willing are you to give to good causes without expecting anything in return?”.
Participants rate their agreement on a 10-point Likert scale from completely unwilling to very
18 People in the 3 SDG default should consider the choice of three SDGs to be less uncertain as this is the defaultoption while those in the 4 SDG default should consider the choice of four SDGs to be less uncertain. For thosewho do not have a return expectation for sustainable investments, we therefore expect that the support for fourSDGs is lower in the 3 SDG default than in the 4 SDG default. Figure A.1 shows the default effect for thoseparticipants who did not know what return to expect (43.6% of the entire population, see Figure 2(a)). Ashypothesized, we do find a significant difference where 59.4% of participants in the 3 SDG default and 65.8% ofthose in the 4 SDG default choose four SDGs (one-sided T-test; p-value = 0.0107). Yet, it is remarkable thateven for those who consider choosing four SDGs as the option with higher uncertainty, we find a clear majorityto opt for the more sustainable option.
13

4.3 Strong social preferences
Figure 3 – Accepting lower returns.
This graph presents the answer distribution of respondents to the question “Do you want Pensioenfonds De-tailhandel to opt for four SDGs if the return on investment would decrease?”. Answer options were ‘yes’, ‘no’,and ‘I do not know’. The graph presents the distribution of real and hypothetical choices separately. Real andhypothetical refers to whether answering the question “Do you want Pensioenfonds Detailhandel to add (leaveout) the fourth sustainable development goal ‘Responsible consumption and production’?” was consequentialor not. Words in parentheses refer to the different status quo treatments which are looked at jointly here. Thegraph presents the distribution of real and hypothetical choices separately, which refers to whether answeringthe above-stated question was consequential or not. In the hypothetical treatment, choices were nonconsequen-tial. In the real treatment, choices were guaranteed to be implemented by the pension fund if more than 50% ofrespondents would choose in favor of three, respectively four SDGs. Error bars present 95% confidence intervals.Non-overlapping error bars indicate a statistically significant difference at the 5% level between the treatmentsreal and hypothetical within each answer category.
willing. Higher ratings correspond to higher levels of social preferences. The average level
of social preferences in our sample is 6.1 on a 10-point Likert scale (for summary statistics,
see Table A.2). We investigate to what extent social preferences predict the support for more
sustainable investments. Table 2 presents relative-risk ratios of a multinomial logit regression
that regresses the support for four sustainable development goals on our measure of social
preferences. The dependent variable takes on three values for the choices ‘3 SDGs’, ‘4 SDGs’,
and ‘No opinion’. As baseline, we take respondents who chose three SDGs. To interpret the
relative-risk ratios, consider the effect of Gender (female) on the choice for 4 SDGs. If the
coefficient equals one, men and women are equally likely to choose 4 SDGs. A coefficient larger
than one indicates that women are more likely to choose 4 SDGs. Similarly, a coefficient smaller
than one indicates that women are less likely to choose 4 SDGs.
In the first column of specification (1), we study the effect of social preferences on the
likelihood to choose four SDGs. A one standard deviation increase in social preferences increases
14

4.4 Default effects
the likelihood to choose four SDGs by 57.4%. Given that 69.7%19 of our sample chose four SDGs,
social preferences have a substantial economic impact on sustainable investment decisions.
Social preferences are not related to the choice of no opinion. In specification (2), we control
for financial beliefs, demographics, and information on participants’ financial background. As
anticipated, expecting lower returns decreases the likelihood to choose four SDGs by 76.8%
while expecting higher returns increases the likelihood by 84.6%. Remarkably, we find that
respondents who do not know what returns to expect are 2.4 times more likely to also report
that they have no opinion on whether to choose three or four SDGs. This finding supports the
hypothesis that these subjects are ambiguity averse which increases the power of our finding
that the majority of these subjects still opts for four SDGs (see rightmost bars in Figure 2(b)).
However, with the inclusion of these controls, the effect size of social preferences does not
decrease but, on the contrary, slightly increases (β = 1.6022) showing that social preferences
robustly explain the choice for more sustainable investments.
Result 3: Social preferences strongly predict the choice for more sustainable investments and is
robust to including financial beliefs. This is consistent with a preference-based explanation
for sustainable investments.
Looking more closely at the effects of demographics on sustainable investments in Table
2, we see that women are significantly more likely to choose four SDGs compared to men.
Women in our sample also have stronger social preferences than men (F: 6.2 vs M: 5.9; p-value
= 0.0079). These results are in line with previous literature findings (see e.g. Bolton and
Katok 1995; Eckel and Grossman 1998; Guth et al. 2007; for a meta-analysis see Croson and
Gneezy 2009). Remember that our sample has slightly more men compared to the pension
fund’s population. The support we find for more sustainable investments therefore is on the
conservative side. Noteworthy is that even among men the majority opts for more sustainable
investments (68.5%). Second, age is related to the respondents’ choice for sustainable investing.
Older people are less likely to choose four SDGs. Each 10 years of age decrease the likelihood
to choose four SDGs by 17.0%. Given that our respondents are slightly older than the invited
sample and older people are less in favor of sustainable investments, the support for sustainable
investments is a lower-bound. Third, education has no impact on whether respondents choose
three or four SDGs. Not surprisingly, highly educated respondents are 46.3% less likely to have
no opinion. And finally, people with a higher income are slightly less likely to choose four
SDGs.
4.4 Default effects
In contrast to real choices, hypothetical choices have no consequences. The status quo bias
should thus be stronger in the real choice treatment and could hide people’s actual preferences
19 The actual percentage of 69.7% differs from the otherwise stated 66.7% as some subjects answered the mainquestion whether to add a fourth SDG but dropped out of the survey before giving a prediction. Among those,who give a prediction, the percentage of accepting 4 SDGs is slightly higher.
15

4.4 Default effects
Table 2 – The effect of social preferences on sustainable investing.
This table presents relative-risk ratios of a multinomial logit regression where the dependent variable takes onthree values for the choices ‘3 SDGs’, ‘4 SDGs’, and ‘I have no opinion regarding this matter’. Baseline arerespondents who chose three SDGs. Social preferences are elicited by asking respondents to rate the question“How willing are you to give to good causes without expecting anything in return?” on a 10-point Likert scalefrom completely unwilling to completely willing (see Falk et al. 2016). Financial beliefs were elicited by askingparticipants to answer the following question: ”When do you think the investment return is highest?” Answeroptions were ’It is highest with 3 SDGs’, ’The return is equally high with 3 or 4 SDGs’, ’It is highest with 4SDGs’, and ’I do not know’. For summary statistics, see Table A.2, and for definitions of the other variables,see Table A.1. Significance levels show the difference from one and are indicated by *** p<0.01, ** p<0.05, *p<0.1.
(1) (2)4 SDGs No opinion 4 SDGs No opinion
PreferencesSocial preferences (std) 1.5737*** 0.9307 1.6022*** 0.9984
(0.1050) (0.0704) (0.1155) (0.0825)Financial beliefsLower returns with 4 SDGs 0.2315*** 0.3502***
(0.0463) (0.0917)Higher returns with 4 SDGs 1.8464** 1.2984
(0.5615) (0.4702)Do not know 0.8242 2.3686***
(0.1679) (0.5606)DemographicsFemale 2.0447*** 1.8123***
(0.3057) (0.3187)Age 0.9830*** 0.9744***
(0.0054) (0.0062)Highly educated 0.9912 0.5329***
(0.1631) (0.1079)Financial backgroundLow monthly income 0.9107 0.9830
(0.1707) (0.2181)High monthly income 0.7263 0.7661
(0.1717) (0.2314)Do not report 0.6456** 1.2274
(0.1330) (0.2876)Constant 7.5682*** 1.8056*** 20.7619*** 4.2414***
(0.5318) (0.1494) (7.5115) (1.7735)Observations 2,529 2,529 2,383 2,383
(e.g. Samuelson and Zeckhauser 1988; Tversky and Kahneman 1991). Consider receiving
investment advice, where the default option is to not focus on sustainable investments. Those
who prefer to invest sustainably but fear that returns will be too low stay with the default and
do not reveal their actual preferences – which they would in case of a hypothetical survey with
the same default. With our different treatments, we are able to differentiate between status
quo effects and the consequentiality of choices.
16

4.5 External validation: voting behavior and sustainable investments
Table 3 shows that the status quo does not affect the choice for more sustainable investments.
We again use a multinomial logit regression where the dependent variable takes on the three
values ‘3 SDGs’, ‘4 SDGs’, and ‘No opinion’. If a status quo bias were present, we would
expect respondents in the 4 SDG default treatment to be more likely to support four SDGs
than respondents in the 3 SDG default. Accordingly, the coefficient of ‘4 SDG default’ in the
first column of specification (1) should be significantly greater than one. The non-significance
of the coefficient shows that this is clearly not the case. Framing has no effect on the choice
between three or four SDGs. In specification (2), we control for all four treatment groups
individually. Given that the status quo effect should be stronger in the real choice treatment,
the coefficient of the independent variable ‘4 SDG default & Hypothetical’ should be the largest
of the three treatment variables and significantly greater than one. The coefficient is indeed
the largest (β ≈ 1.18) but not significantly different from one nor from the other treatment
variables.
The non-significance of all coefficients confirms that framing has no effect on the choice to
expand sustainable investing. In specification (3), we include financial beliefs, demographics,
and information on the financial background as controls. As a consequence of including financial
beliefs, the coefficient of ‘4 SDG default & Hypothetical’ turns marginally significant (difference
from one: p-value = 0.095). This is the result of a statistical difference in return expectations
as there are slightly more respondents in the hypothetical treatment who expect higher returns
with three SDGs (Hypothetical: 17.9% vs Real: 14.8%; p-value = 0.0270). Thus, this effect
does not capture an actual hypothetical gap.
More importantly, the effect size and the significance level of social preferences is not affected
by including treatment effects which indicates that strong preferences drive the decision to invest
sustainably. An individual with strong preferences for sustainable investing will choose more
sustainable investments, irrespective of what the default option is, and whether it is a real or
hypothetical choice.
Result 4: Respondents’ choice of expanding sustainable investments does not depend on how
their choice is framed (no status quo dependency). The support for more sustainable
investments is always high, consistent with strong preferences.
4.5 External validation: voting behavior and sustainable invest-
ments
To test for external validity of our results, we explore the relation between the support for
more sustainable pension investments and voting behavior in the last national parliamentary
elections. We construct respondents’ preferences for sustainable policies by evaluating the
stance on sustainability of the political party they voted for. We use the official voting guide
for the 2017 Dutch national elections.20 Five of the 30 questions posed in this voting guide deal
with issues related to sustainability. All questions are posed such that they can be answered
20 See https://tweedekamer2017.stemwijzer.nl.
17

4.5 External validation: voting behavior and sustainable investments
with ‘agree’, ‘disagree’, or ‘neither of the two’. A party receives one point for each question
for which they choose the more sustainable option. If a party chooses ‘neither of the two’, it
receives half a point. For example, consider the statement “All coal-fired power stations may
remain open for the time being.” If a party agrees to this statement, it receive zero points; if it
disagrees it receive one point; and if it says neither of the two, they receive half a point. Each
political party thus receives a score between zero and five. The entire construction of the score
is presented in Table A.5.
Table 3 – The effects of consequentiality and status quo dependency on sustainableinvesting.
This table presents relative-risk ratios of a multinomial logit regression where the dependent variable takeson three values for the choices ‘3 SDGs’, ‘4 SDGs’, and ‘I have no opinion regarding this matter’. Baselineare respondents who chose three SDGs. For summary statistics, see Table A.2. Social preferences are elicitedby asking respondents to rate the question “How willing are you to give to good causes without expectinganything in return?” on a 10-point Likert scale from completely unwilling to completely willing (see Falk et al.2016). 3 SDG default and 4 SDG default refer to two different status quo treatments to which participants wererandomly assigned. In the 3 SDG default, participants were told that the pension fund currently focuses on threeSDGs. Participants were introduced to the fourth SDG ‘Responsible consumption and production’ and couldchoose: “Do you want Pensioenfonds Detailhandel to add the fourth sustainable development goal ‘Responsibleconsumption and production’?”. Answer options were ‘Yes, add’, ‘No, do not add’, and ‘I have no opinionregarding this matter’. In the 4 SDG default treatment, it was communicated that the pension fund’s futurepolicy will include a fourth SDG ‘Responsible consumption and production’. Participants could then choose:“Do you want Pensioenfonds Detailhandel to leave out the fourth sustainable development goal ‘Responsibleconsumption and production’?”. Answer options were ‘Yes, leave it out’, ‘No, do not leave it out’, and ‘Ihave no opinion regarding this matter’. Real and hypothetical refers to whether answering the question “Doyou want Pensioenfonds Detailhandel to add (leave out) the fourth sustainable development goal ‘Responsibleconsumption and production’?” was consequential or not. Words in parentheses refer to the different statusquo treatments. In the hypothetical treatment, choices were nonconsequential. In the real treatment, choiceswere guaranteed to be implemented by the pension fund if more than 50% of respondents would choose in favorof three, respectively four SDGs. For definitions of the other variables, see Table A.1. Significance levels showthe difference from one and are indicated by *** p<0.01, ** p<0.05, * p<0.1.
(1) (2) (3)4 SDGs No
opinion4 SDGs No
opinion4 SDGs No
opinionPreferencesSocial preferences (std) 1.6080*** 0.9928
(0.1162) (0.0823)Treatment effects4 SDG default 1.0617 0.9366
(0.1248) (0.1233)3 SDG default 0.8026 1.0703 0.9052 1.2626
& Hypothetical (0.1326) (0.1965) (0.1852) (0.2981)4 SDG default 0.8013 0.7646 1.0089 0.7844
& Real (0.1286) (0.1401) (0.2035) (0.1902)4 SDG default 1.1792 1.2671 1.4264* 1.4921
& Hypothetical (0.2054) (0.2451) (0.3035) (0.3666)Constant 6.3118*** 2.3176*** 7.0119*** 2.2381*** 19.3919*** 3.8080***
(0.5210) (0.2127) (0.8178) (0.2937) (7.3993) (1.6870)Observations 3,256 3,256 3,256 3,256 2,383 2,383Financial beliefs No No No No Yes YesDemographics No No No No Yes YesFinancial background No No No No Yes Yes
18

4.6 Confusion and misunderstanding do not explain our results
Table A.6 shows that voters of political parties with a stronger preference for sustainable
policies show more support for four SDGs. Especially, voters of the green party (GroenLinks)
and the animal party (Partij voor de Dieren) favor four SDGs (89.8% and 88.9% respectively).
On the other side, voters of parties like the Volkspartij voor Vrijheid en Democratie (VVD) or
the Partij voor de Vrijheid (PVV) with a sustainability score of zero show one of the lowest
acceptance rates for four SDGS. Nevertheless, across voters for all political parties more than
50% choose four SDGs (except for the party ‘Forum voor Democratie’). Even among those who
report to not have voted in the last national elections, 61.7% is in favor of four SDGs. Among
those who do not state the party they voted for, the majority of 66.9% chose four SDGs.
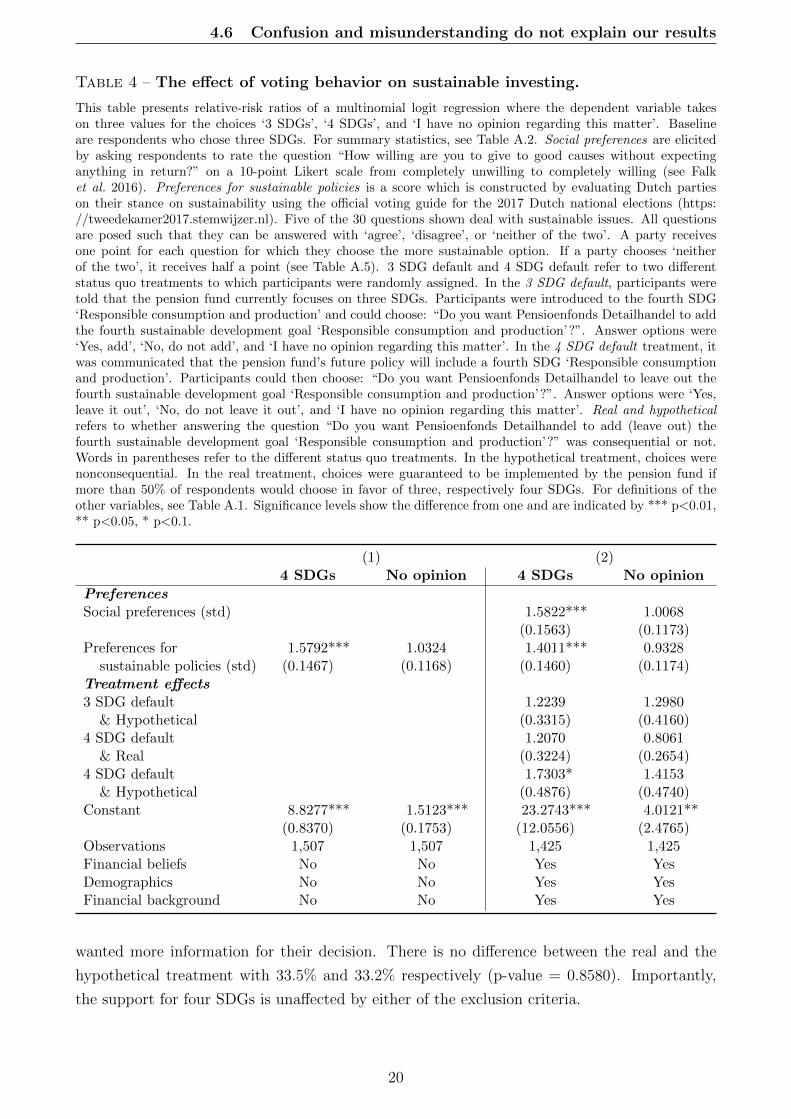
The first specification in Table 4 shows that a respondent who voted for a party with a
one standard deviation stronger preference for sustainable policies is 57.9% more likely to also
choose the more sustainable option in our experiment. When we include control variables
in specification (2), the effect size slightly decreases to 40.1% but stays highly significant.
These results show the external validity of the support for four sustainable development goals.
Participants took their choice seriously and chose more or less sustainability in line with how
they evaluated political parties on sustainability in the last national election. Remarkably, even
when we control for participants’ preferences for sustainable policies, the effect size of social
preferences barely changes compared to Tables 2 and 3. This underlines the importance of
strong social preferences as explanation for the choice to invest more sustainably.
Result 5: Respondents who voted for a party which cares for sustainability are more likely
to expand sustainable investing. This finding provides external validity consistent with a
preference-based explanation for sustainable investments.
4.6 Confusion and misunderstanding do not explain our results
The absence of a hypothetical gap could be explained by respondents being confused or lack-
ing information. We address this by re-analyzing our results, excluding: (1) Respondents who
started to vote, but dropped out of the survey before finishing; (2) Respondents who did not
understand the treatment and failed our comprehension question (see section 2); (3) Respon-
dents who report that they would have liked to receive more information before deciding on
whether to choose three or four SDGs.
We successively exclude each of the three types. The results are presented in Figure 4. The
first bar represents the choice distribution of all participants, without exclusion. The second
bar shows the choice distribution when respondents are excluded who did not complete the
survey. The dropout rates between the real (26.9%) and the hypothetical treatment (23.8%;
p-value = 0.0433) are statistically different. Yet, the effect size of 3.1 percentage points is
small, and the difference is likely to be significant because of our large sample size. The third
bar shows the choice distribution excluding participants who did not understand the treatment
they were in. This is the case for 14.0% in the real and 11.9% in the hypothetical treatment
(p-value = 0.0698). The fourth bar shows the distribution of choices excluding participants who
19
4.6 Confusion and misunderstanding do not explain our results
Table 4 – The effect of voting behavior on sustainable investing.
This table presents relative-risk ratios of a multinomial logit regression where the dependent variable takeson three values for the choices ‘3 SDGs’, ‘4 SDGs’, and ‘I have no opinion regarding this matter’. Baselineare respondents who chose three SDGs. For summary statistics, see Table A.2. Social preferences are elicitedby asking respondents to rate the question “How willing are you to give to good causes without expectinganything in return?” on a 10-point Likert scale from completely unwilling to completely willing (see Falket al. 2016). Preferences for sustainable policies is a score which is constructed by evaluating Dutch partieson their stance on sustainability using the official voting guide for the 2017 Dutch national elections (https://tweedekamer2017.stemwijzer.nl). Five of the 30 questions shown deal with sustainable issues. All questionsare posed such that they can be answered with ‘agree’, ‘disagree’, or ‘neither of the two’. A party receivesone point for each question for which they choose the more sustainable option. If a party chooses ‘neitherof the two’, it receives half a point (see Table A.5). 3 SDG default and 4 SDG default refer to two differentstatus quo treatments to which participants were randomly assigned. In the 3 SDG default, participants weretold that the pension fund currently focuses on three SDGs. Participants were introduced to the fourth SDG‘Responsible consumption and production’ and could choose: “Do you want Pensioenfonds Detailhandel to addthe fourth sustainable development goal ‘Responsible consumption and production’?”. Answer options were‘Yes, add’, ‘No, do not add’, and ‘I have no opinion regarding this matter’. In the 4 SDG default treatment, itwas communicated that the pension fund’s future policy will include a fourth SDG ‘Responsible consumptionand production’. Participants could then choose: “Do you want Pensioenfonds Detailhandel to leave out thefourth sustainable development goal ‘Responsible consumption and production’?”. Answer options were ‘Yes,leave it out’, ‘No, do not leave it out’, and ‘I have no opinion regarding this matter’. Real and hypotheticalrefers to whether answering the question “Do you want Pensioenfonds Detailhandel to add (leave out) thefourth sustainable development goal ‘Responsible consumption and production’?” was consequential or not.Words in parentheses refer to the different status quo treatments. In the hypothetical treatment, choices werenonconsequential. In the real treatment, choices were guaranteed to be implemented by the pension fund ifmore than 50% of respondents would choose in favor of three, respectively four SDGs. For definitions of theother variables, see Table A.1. Significance levels show the difference from one and are indicated by *** p<0.01,** p<0.05, * p<0.1.
(1) (2)4 SDGs No opinion 4 SDGs No opinion
PreferencesSocial preferences (std) 1.5822*** 1.0068
(0.1563) (0.1173)Preferences for 1.5792*** 1.0324 1.4011*** 0.9328
sustainable policies (std) (0.1467) (0.1168) (0.1460) (0.1174)Treatment effects3 SDG default 1.2239 1.2980
& Hypothetical (0.3315) (0.4160)4 SDG default 1.2070 0.8061
& Real (0.3224) (0.2654)4 SDG default 1.7303* 1.4153
& Hypothetical (0.4876) (0.4740)Constant 8.8277*** 1.5123*** 23.2743*** 4.0121**
(0.8370) (0.1753) (12.0556) (2.4765)Observations 1,507 1,507 1,425 1,425Financial beliefs No No Yes YesDemographics No No Yes YesFinancial background No No Yes Yes
wanted more information for their decision. There is no difference between the real and the
hypothetical treatment with 33.5% and 33.2% respectively (p-value = 0.8580). Importantly,
the support for four SDGs is unaffected by either of the exclusion criteria.
20

5 Additional findings
Result 6: Neither dropouts, confusion, nor a lack of information affect our results. There is
always a clear majority supporting more sustainable investments
Figure 4 – Controlling for possible confusion.
The graph presents the distribution of all respondents (leftmost bar) and of three restricted subsamples sepa-rately regarding the following question: ”Do you want Pensioenfonds Detailhandel to add (leave out) the fourthsustainable development goal ’Responsible consumption and production’?”. Answer options were ’Yes, add(leave it out)’, ’No, do not add (leave it out)’, and ’I have no opinion regarding this matter’. Words in paren-theses refer to the different status quo treatments which are looked at jointly here. In addition, the real andhypothetical treatments are looked at jointly. The second bar from the left (dark blue) presents the distributionof choices where respondents are excluded who dropped out of the survey after giving a choice on sustainableinvesting but before the end of the survey. The second bar from the right (medium blue) presents the distri-bution of choices where respondents are excluded wrongly answered the control question ”If a majority chooses’yes, add’ (’no, leave it out’), a. Pensioenfonds Detailhandel guarantees to add (leave out) the fourth SDG; b.Pensioenfonds Detailhandel cannot guarantee that it will add (leave out) the fourth SDG, but may include theresults of the survey in its choice.” The rightmost bar (light blue) presents the distribution of choices whererespondents are excluded who report that they would have liked to receive more information before decidingon whether to choose three or four SDGs. Error bars present 95% confidence intervals. Non-overlapping errorbars indicate a statistically significant difference at the 5% level between the treatments real and hypotheticalwithin each answer category.
5 Additional findings
5.1 Social signaling
Grimm (2010) finds that people often give socially desirable answers in a prosocial context.
Paulhus (1984) defines social desirability as consisting of two components, self-deception and
impression management. Impression management is also referred to as ‘other-deception’ and
refers to managing the impression that others have of oneself. Socially desirable answering can
be explained by the desire for social esteem and a positive self-image (see e.g. Benabou and
21
5.2 Pivotal voting
Tirole 2006; Ellingsen and Johannesson 2008; Tonin and Vlassopoulos 2013) and is especially
attractive in hypothetical situations (e.g. Lusk and Norwood 2009; Norwood and Lusk 2011;
Klink and Langen 2015). The fact that we do not find a hypothetical gap suggests that these
reputational concerns do not play a major role among respondents.
We are unaware of a test of social desirability which would have been short enough to fit
our survey.21 We therefore decided to focus on impression management and specifically test
for social signaling. We ask respondents to rate the question “How likely is it that you will
talk to your friends about this survey?” on a 10-point Likert scale from 1—very unlikely to
10—very likely. The question is a modification of the social signaling question asked in Riedl
and Smeets (2017) who find that sustainable investors talk more about their investments than
conventional investors to signal their prosocial behavior. We especially expect respondents in
the hypothetical treatment to be more likely to choose four SDGs if they show a bigger desire
for social signaling. We therefore specifically look at subjects with an above-median social
signaling desire (ratings of 3 and higher, 55.1% of the sample).
The results of testing for social signaling are presented in Figure A.2. If socially desirable
answering were the driver to choose four SDGs, we should observe a hypothetical gap among
those with a higher desire for social signaling. This is clearly not the case, as 75.8% of those in
the hypothetical and 78.3% of those in the real treatment chose four SDGs (p-value = 0.2833).
Also, the percentage of those in favor if three SDGs (Hypothetical: 7.7% vs Real: 9.7%; p-
value = 0.2131) does not differ across treatment groups. We only find a small difference between
treatment groups for those with no opinion (Hypothetical: 16.4% vs Real: 12.0%; p-value =
0.0210). Thus, we find no hypothetical gap, even for people who are more likely to engage in
social signaling.
5.2 Pivotal voting
There is a possibility that subjects in our experiment did not perceive their choice to be con-
sequential. They might believe that their vote is unlikely to be pivotal. In that case, the real
choice could simply be perceived as a hypothetical choice, which in turn could explain the
large support for more sustainable investments and the absence of a hypothetical gap. Several
aspects render it unlikely that this potential concern is driving our results.
First, voting theory shows that the use of a voting mechanism with a simple majority rule
is incentive-compatible if the choice is binary, consequential, and if subjects care about the
outcome (Cummings et al., 1997; Harrison, 2006a). The first two conditions are met as part of
the experimental setup. Further, we can expect that the third condition is met by the fact that
people’s pension money is at stake. Thus, the choices selected by our participants maximize
their personal utility function which implies that they report their preferences honestly.
Second, the paradox of voting predicts that rational people do not vote as their expected
benefits of casting the pivotal vote are lower than their expected costs (Downs, 1957). For
21 Multi-item scales for social desirability include Reynolds (1982), Reynolds (1982), or Stober (2001) Thesecomprise at least eleven survey questions, which was too long to fit our survey.
22

5.2 Pivotal voting
example, Mulligan and Hunter (2003) find that only one of every 89,000 votes casted in U.S.
Congressional elections, and one of 15,000 in state legislator elections were pivotal22. Neverthe-
less, turnout rates in political elections are usually quite high, which makes it at least difficult
to justify that voters do not care about their vote when it is unlikely to be pivotal.
Third, even though theory and field evidence suggest that people take voting seriously, it
is possible that in our experiment this was not the case. We therefore distinguish between
participants who expected to be more pivotal and those who expected to be less pivotal. If
participants only supported more sustainable investments when they perceived their vote not
to be pivotal, this would cast doubt on our finding that a majority prefers more sustainable
investments. Also, if people only voted for more sustainable investments because they felt
they were not pivotal, we would observe a hypothetical gap for participants who expected to
be more pivotal. We tackle this concern in two different ways. First, we asked participants to
estimate the percentage of participants who would choose three SDGs, four SDGs, or opt for ‘no
opinion’.23 Subjects who predicted that the share of those in favor of four SDGs is close to 50%
should perceive their vote to be more pivotal than subjects with a prediction far away from 50%.
Following the just outlined expectation, we would expect a hypothetical gap to arise for subjects
with a prediction close to 50%. We define “pivotal” voters as those who predict the share of
respondents choosing four SDGs to be between 40% and 60%. This leaves us with 458 “pivotal”
subjects in the real and 454 in the hypothetical treatment (32.0% of the entire sample). We find
no hypothetical gap as 73.6% of subjects in the real and 72.9% in the hypothetical treatment
chose four SDGs (p-value = 0.8186).24 Second, we asked subjects to estimate how many of the
25,000 invited people would participate in the experiment.25 The median estimate was 10,000
participants. We define a ‘pivotal’ voter as someone who estimates that less than 10,000 would
participate (meaning that the voter has a relatively higher probability to be pivotal). This
leaves us with 586 “pivotal” subjects in the real and 605 in the hypothetical treatment. Again,
we do not find a hypothetical gap as 72.5% in the real and 71.4% in the hypothetical treatment
choose four SDGs (p-value = 0.6672).26
As additional check, we look at the two above-mentioned definitions of a “pivotal” voter
jointly. There are 192 subjects in the real and 205 subjects in the hypothetical treatment who
predict the share of respondents choosing four SDGs to be between 40% and 60% while at
the same time estimating less than 10,000 would participate in the survey. We again find no
hypothetical gap (Percentage choosing four SDGs: Real 71.9% vs Hypothetical 75.6%; p-value
= 0.3990).
22 A pivotal vote in this case means that the candidate of that specific election tied for first or won by a singlevote.
23 Predictions of respondents in the real and in the hypothetical treatment are treated jointly as they do not differ.24 This finding is robust to altering the definition of a “pivotal” voter. We also do not find a hypothetical gap
when we look at those who predict the share of respondents choosing four SDGs to be between 45% and 55%as well as between 35% and 65%.
25 We gave 25,000 as reference point as one half of the 50,000 invited members was allocated to the real choicetreatment and the other half to the hypothetical choice treatment.
26 This finding is robust to altering the definition of a “pivotal” voter. We also do not find a hypothetical gapwhen we look at those who estimate that less than 8,000 (bottom 45%) as well as less than 11,000 (bottom65%) would participate.
23

5.3 Exclusion of non-sustainable companies
Taken together, we can rule out that participants support more sustainable investments,
because they think that their vote is not pivotal.
5.3 Exclusion of non-sustainable companies
Investing according to the SDGs offers different approaches. While our question on adding
a fourth SDG focused on engagement, we also elicited participants’ preferences for exclusion
policies. We told participants that exclusion means that the pension fund will refrain from
investing in non-sustainable companies. It was explicitly mentioned that the questions on the
exclusion policy in this part of the survey were of hypothetical nature but that the pension
fund is interested in learning about their opinion. Thus, respondents were no longer grouped
into real and hypothetical treatments. Specifically, respondents were asked to choose from a
list of topics. Multiple answers were allowed. Each item they could choose indicated that they
would want to exclude companies which relate to this item. For example, respondents could
state that they want their pension fund to exclude companies which produce tobacco or alcohol
(for a full list, see Table A.1). Respondents could also choose to not exclude any company.
Table A.7 presents the answer distribution of the exclusion question. Column (1) shows
the average answer over all respondents. In columns (2) to (4), respondents are split into the
three answer categories ‘4 SDGs’, ‘3 SDGs’, and ‘no opinion’ which correspond to whether
they chose three or four SDGs or did not have an opinion. It shows that the willingness to
exclude companies is in general high. Across all three answer categories, respondents chose to
exclude companies on seven of nine items with more than 50%. We observe the highest rates
of approval for exclusion due to corruption (86.9%), child labor (85.8%), and human rights
violations (85.3%).
Importantly, this table also shows that people do not simply choose more sustainable in-
vestments whenever given a choice. Only a minority is in favor of excluding companies that
produce alcohol (17.4%) and tobacco (44.2%). Even among those who chose four SDGs, those
numbers are with 18.6% and 47.5% clearly below the threshold of 50%. Given the strong pres-
sure that is currently being put on pension funds to divest from tobacco, it is remarkable to see
that these pension fund members decide to still keep their tobacco investments. Participants
take a strong stance against excluding tobacco and alcohol companies, even in a hypothetical
setting, where the costs of giving socially desirable answers are low.
6 Conclusion
The United Nations Sustainable Development Goals (SDGs) created societal and political pres-
sure for companies and investors to promote sustainability. How much are individuals willing
to support investments based on the SDGs? Are they willing to put their pension money on
the table to invest sustainably? We ran an experiment with a pension fund which granted its
members a real vote. We find that 66.7% of the participants are in favor of investing their
pension savings more sustainably which is driven by strong social preferences. We can rule out
24

6 Conclusion
financial beliefs, confusion, a lack of information, and social concerns as explanation for the
large support of sustainable investing.
Social preferences have a significant influence on many economic decisions. They are a key
to understanding what incentivizes people (Fehr and Fischbacher, 2002; Bandiera et al., 2005),
can decrease free riding problems (Fehr and Gachter, 2000), and explain why people are willing
to sacrifice resources to increase social welfare (Fehr and Schmidt, 1999; Bolton and Ockenfels,
2000; Charness and Rabin, 2002). While European investment managers elicit clients’ risk
preferences, most of them ignore social preferences (EUROSIF, 2016, p. 82). This raises
a simple question: Why the reluctance towards social preferences? While previous research
shows the importance of social preferences for some investors, it has been hard for institutional
investors to use these findings when deciding on behalf of their clients. For instance, Bollen
(2007); Barber et al. (2018); Hong and Kostovetsky (2012) and Hartzmark and Sussman (2018)
show that investors value sustainability. Yet, consider a pension fund manager: with aggregate-
level data, he will have trouble to identify the preferences for sustainable investments of his
clients. And even with findings on the individual level, the pension fund manager would not
know what to do. Take the findings of Riedl and Smeets (2017) who show that 16% of their
sample holds a sustainable mutual fund. The pension fund manager could now say that the
majority does not want to hold sustainable mutual funds. Case closed. Yet, Beshears et al.
(2008) show that inertia often keeps people from acting according to their true preferences.
Thus, fund managers have to elicit the social preferences of their clients themselves and act
accordingly.
We offer a simple toolbox for institutional investors to cater to the social preferences of their
clients. We demonstrate that individuals are indeed willing to put their pension savings on the
table to promote sustainability, in both a hypothetical and real choice.
The absence of the hypothetical gap does not imply that all institutional investors can elicit
true preferences for sustainable investments with hypothetical survey questions. Choices in our
experiment were identical in the hypothetical and real treatment, because participants have
strong social preferences. In other cases, social preferences might be weaker, and a hypothetical
gap could arise. For example, in countries where people have weaker social preferences. Yet,
importantly, our findings are not driven by specifically looking at people with strong preferences.
As the Netherlands are known for their large share of assets invested sustainably (EUROSIF,
2016), it could be that the Dutch population just has particularly strong social preferences which
drive sustainable investments and limit the generalizability of our findings. However, that is not
the case. Falk et al. (2018), whose question on social preferences we used in our survey, study
the global variation of social preferences. They find that the social preferences of the Dutch
population are 0.19 standard deviations below world average. At the same time, Germany
(−0.05) and the UK (+0.03) are close to the world average while the US (+0.41) ranges clearly
above. In other words, even though the Netherlands are one of the most sustainable investors
in the world, they show below-average levels of social preferences. Given the even stronger
25

6 Conclusion
social preferences in countries like the US, there is substantial growth potential for sustainable
investments in these markets.
Outside of the investment industry, our proposed method can inform decision-makers who
decide on behalf of others. Politicians could elicit social preferences to address key sustainable
policy questions such as a ban on plastic bags or creating restricted zones in inner cities which
cannot be accessed by cars. If politicians were to rely on real preferences, this could not only
help to objectively make better decisions but also can create a wider public support for the
outcome—even if it is costly. But for that to be true, politicians have to get real!
26

References
References
Ajzen, I., Brown, T. C. and Carvajal, F. (2004). Explaining the discrepancy betweenintentions and actions: The case of hypothetical bias in contingent valuation. Personalityand Social Psychology Bulletin, 30 (9), 1108–1121.
Almas, I., Cappelen, A. W. and Tungodden, B. (2016). Cutthroat capitalism versus cud-dly socialism: Are americans more meritocratic and efficiency-seeking than scandinavians?Working paper.
Alserda, G., Dellaert, B., Swinkels, L. and Van der Lecq, S. (2016). Pension riskpreferences. Netspar Industry Design Paper, 62.
Andreoni, J., Rao, J. M. and Trachtman, H. (2017). Avoiding the ask: A field experimenton altruism, empathy, and charitable giving. Journal of Political Economy, 125 (3), 625–653.
Arrow, K. J. (2012). Social choice and individual values, vol. 12. Yale university press.
Bandiera, O., Barankay, I. and Rasul, I. (2005). Social preferences and the responseto incentives: Evidence from personnel data. The Quarterly Journal of Economics, 120 (3),917–962.
Barber, B. M., Morse, A. and Yasuda, A. (2018). Impact investing. Working paper.
Benabou, R. and Tirole, J. (2006). Incentives and prosocial behavior. American EconomicReview, 96 (5), 1652–1678.
Berger, I. E. and Corbin, R. M. (1992). Perceived consumer effectiveness and faith inothers as moderators of environmentally responsible behaviors. Journal of Public Policy &Marketing, pp. 79–89.
Beshears, J., Choi, J., Clayton, C., Harris, C., Laibson, D. and Madrian, B. (2014).Optimal illiquidity. Paper for the Retirement Research Consortium, September, 26.
—, Choi, J. J., Laibson, D. and Madrian, B. C. (2008). How are preferences revealed?Journal of Public Economics, 92 (8-9), 1787–1794.
Bialkowski, J. and Starks, L. T. (2016). Sri funds: Investor demand, exogenous shocksand esg profiles. Working paper.
Blake, J. (1999). Overcoming the ‘value-action gap’in environmental policy: Tensions betweennational policy and local experience. Local Environment, 4 (3), 257–278.
Bollen, N. P. (2007). Mutual fund attributes and investor behavior. Journal of Financialand Quantitative Analysis, 42 (3), 683–708.
Bolton, G. E. and Katok, E. (1995). An experimental test for gender differences in benef-icent behavior. Economics Letters, 48 (3-4), 287–292.
— and Ockenfels, A. (2000). Erc: A theory of equity, reciprocity, and competition. AmericanEconomic Review, 90 (1), 166–193.
Brown, T. C., Champ, P. A., Bishop, R. C. and McCollum, D. W. (1996). Whichresponse format reveals the truth about donations to a public good? Land Economics, pp.152–166.
27
References
Bullock, W., Imai, K. and Shapiro, J. N. (2011). Statistical analysis of endorsementexperiments: Measuring support for militant groups in pakistan. Political Analysis, 19 (4),363–384.
Carroll, G. D., Choi, J. J., Laibson, D., Madrian, B. C. and Metrick, A. (2009).Optimal defaults and active decisions. The Quarterly Journal of Economics, 124 (4), 1639–1674.
Carson, R., Groves, T., List, J. and Machina, M. (2006). Probabilistic influence andsupplemental benefits: a field test of the two key assumptions behind using stated preferences.Unpublished manuscript, 2.
Carson, R. T. and Groves, T. (2007). Incentive and informational properties of preferencequestions. Environmental and Resource Economics, 37 (1), 181–210.
Champ, P. A. and Bishop, R. C. (2001). Donation payment mechanisms and contingentvaluation: an empirical study of hypothetical bias. Environmental and Resource Economics,19 (4), 383–402.
—, —, Brown, T. C. and McCollum, D. W. (1997). Using donation mechanisms to valuenonuse benefits from public goods. Journal of Environmental Economics and Management,33 (2), 151–162.
Charness, G. and Gneezy, U. (2010). Portfolio choice and risk attitudes: An experiment.Economic Inquiry, 48 (1), 133–146.
— and Rabin, M. (2002). Understanding social preferences with simple tests. The QuarterlyJournal of Economics, 117 (3), 817–869.
Cohn, A., Jessen, L., Klasjna, M. and Smeets, P. (2018). Distributional preferences ofthe top 5us. Working paper.
Croson, R. and Gneezy, U. (2009). Gender differences in preferences. Journal of EconomicLiterature, 47 (2), 448–74.
Cummings, R. G., Elliott, S., Harrison, G. W. and Murphy, J. (1997). Are hypothet-ical referenda incentive compatible? Journal of Political Economy, 105 (3), 609–621.
—, Harrison, G. W. and Rutstrom, E. E. (1995). Homegrown values and hypotheticalsurveys: Is the dichotomous choice approach incentive-compatible? American EconomicReview, 85 (1), 260.
— and Taylor, L. O. (1998). Does realism matter in contingent valuation surveys? LandEconomics, pp. 203–215.
— and — (1999). Unbiased value estimates for environmental goods: a cheap talk design forthe contingent valuation method. American Economic Review, 89 (3), 649–665.
De-Magistris, T., Gracia, A. and Nayga Jr, R. M. (2013). On the use of honesty primingtasks to mitigate hypothetical bias in choice experiments. American Journal of AgriculturalEconomics, 95 (5), 1136–1154.
DellaVigna, S., List, J. A. and Malmendier, U. (2012). Testing for altruism and socialpressure in charitable giving. The Quarterly Journal of Economics, 127 (1), 1–56.
28

References
Derwall, J., Guenster, N., Bauer, R. and Koedijk, K. (2005). The eco-efficiency pre-mium puzzle. Financial Analysts Journal, pp. 51–63.
Donkers, B., Lourenco, C. and Dellaert, B. G. (2012). Measuring and debiasing con-sumer pension risk attitudes. Netspar panel paper, 28.
Downs, A. (1957). An economic theory of political action in a democracy. Journal of PoliticalEconomy, 65 (2), 135–150.
Eckel, C. C. and Grossman, P. J. (1998). Are women less selfish than men?: Evidencefrom dictator experiments. The Economic Journal, 108 (448), 726–735.
Edmans, A. (2011). Does the stock market fully value intangibles? employee satisfaction andequity prices. Journal of Financial Economics, 101 (3), 621–640.
Ellingsen, T. and Johannesson, M. (2008). Pride and prejudice: The human side ofincentive theory. American Economic Review, 98 (3), 990–1008.
Ellsberg, D. (1961). Risk, ambiguity, and the savage axioms. The Quarterly Journal ofEconomics, pp. 643–669.
Ethier, R. G., Poe, G. L., Schulze, W. D. and Clark, J. (2000). A comparison of hypo-thetical phone and mail contingent valuation responses for green-pricing electricity programs.Land Economics, pp. 54–67.
EUROSIF (2016). European sri study 2016.
Falk, A., Becker, A., Dohmen, T., Enke, B., Huffman, D. and Sunde, U. (2018).Global evidence on economic preferences. The Quarterly Journal of Economics, 133 (4),1645–1692.
—, —, —, Huffman, D. and Sunde, U. (2016). The preference survey module: A validatedinstrument for measuring risk, time, and social preferences. Working paper.
Fehr, E. and Fischbacher, U. (2002). Why social preferences matter–the impact of non-selfish motives on competition, cooperation and incentives. The Economic Journal, 112 (478),C1–C33.
— and Gachter, S. (2000). Fairness and retaliation: The economics of reciprocity. Journalof Economic Perspectives, 14 (3), 159–181.
— and Schmidt, K. M. (1999). A theory of fairness, competition, and cooperation. TheQuarterly Journal of Economics, 114 (3), 817–868.
Feldman, J., Miyamoto, J. and Loftus, E. F. (1999). Are actions regretted more thaninactions? Organizational Behavior and Human Decision Processes, 78 (3), 232–255.
FeldmanHall, O., Mobbs, D., Evans, D., Hiscox, L., Navrady, L. and Dalgleish,T. (2012). What we say and what we do: the relationship between real and hypotheticalmoral choices. Cognition, 123 (3), 434–441.
Fisman, R., Jakiela, P. and Kariv, S. (2017). Distributional preferences and politicalbehavior. Journal of Public Economics, 155, 1–10.
Fowler III, A. R. and Close, A. G. (2012). It ain’t easy being green: Macro, meso, andmicro green advertising agendas. Journal of Advertising, 41 (4), 119–132.
29

References
Frey, B. S. and Meier, S. (2004). Social comparisons and pro-social behavior: Testing”conditional cooperation” in a field experiment. American Economic Review, 94 (5), 1717–1722.
Gingerich, D. W. (2010). Understanding off-the-books politics: Conducting inference onthe determinants of sensitive behavior with randomized response surveys. Political Analysis,18 (3), 349–380.
Gneezy, A., Gneezy, U., Nelson, L. D. and Brown, A. (2010). Shared social respon-sibility: A field experiment in pay-what-you-want pricing and charitable giving. Science,329 (5989), 325–327.
Gneezy, U. and List, J. A. (2006). Putting behavioral economics to work: Testing for giftexchange in labor markets using field experiments. Econometrica, 74 (5), 1365–1384.
Goda, G. S., Levy, M. R., Manchester, C. F., Sojourner, A. and Tasoff, J. (2015).The role of time preferences and exponential-growth bias in retirement savings. Tech. rep.,National Bureau of Economic Research.
Gracia, A., Loureiro, M. L. and Nayga Jr, R. M. (2011). Are valuations from nonhypo-thetical choice experiments different from those of experimental auctions? American Journalof Agricultural Economics, 93 (5), 1358–1373.
Grimm, P. (2010). Social desirability bias. Wiley International Encyclopedia of Marketing.
Guth, W., Schmidt, C. and Sutter, M. (2007). Bargaining outside the lab–a newspaperexperiment of a three-person ultimatum game. The Economic Journal, 117 (518), 449–469.
Harrison, G. W. (2006a). Experimental evidence on alternative environmental valuationmethods. Environmental and Resource Economics, 34 (1), 125–162.
— (2006b). Making choice studies incentive compatible. In Valuing environmental amenitiesusing stated choice studies, Springer, pp. 67–110.
—, Harstad, R. M. and Rutstrom, E. E. (2004). Experimental methods and elicitationof values. Experimental Economics, 7 (2), 123–140.
— and Rutstrom, E. E. (2008). Experimental evidence on the existence of hypothetical biasin value elicitation methods. Handbook of Experimental Economics Results, 1, 752–767.
Hartzmark, S. M. and Sussman, A. B. (2018). Do investors value sustainability? a naturalexperiment examining ranking and fund flows. Working paper.
Hong, H. and Kacperczyk, M. (2009). The price of sin: The effects of social norms onmarkets. Journal of Financial Economics, 93 (1), 15–36.
— and Kostovetsky, L. (2012). Red and blue investing: Values and finance. Journal ofFinancial Economics, 103 (1), 1–19.
Jennings, P. L., Mitchell, M. S. and Hannah, S. T. (2015). The moral self: A reviewand integration of the literature. Journal of Organizational Behavior, 36 (S1), S104–S168.
John, L. K., Loewenstein, G. and Prelec, D. (2012). Measuring the prevalence of ques-tionable research practices with incentives for truth telling. Psychological Science, 23 (5),524–532.
30

References
JP Morgan (2018). Sustainable investing is moving mainstream.
Kahneman, D., Knetsch, J. L. and Thaler, R. H. (1991). Anomalies: The endowmenteffect, loss aversion, and status quo bias. Journal of Economic Perspectives, 5 (1), 193–206.
Kerschbamer, R. and Muller, D. (2017). Social preferences and political attitudes: Anonline experiment on a large heterogeneous sample. Tech. rep.
Kessler, J. B., Milkman, K. L. and Zhang, C. Y. (2018). Getting the rich and powerfulto give. Working paper.
Klink, J. and Langen, N. (2015). Are animal welfare aspects of relevance in consumers’purchase decision? Proceedings in Food System Dynamics, pp. 328–346.
Kollmuss, A. and Agyeman, J. (2002). Mind the gap: why do people act environmen-tally and what are the barriers to pro-environmental behavior? Environmental EducationResearch, 8 (3), 239–260.
Kruger, P. (2015). Corporate goodness and shareholder wealth. Journal of Financial Eco-nomics, 115 (2), 304–329.
Kruger, P., Sautner, Z. and Starks, L. T. (2018). The importance of climate risks forinstitutional investors. Working paper.
List, J. A. (2001). Do explicit warnings eliminate the hypothetical bias in elicitation pro-cedures? evidence from field auctions for sportscards. American Economic Review, 91 (5),1498–1507.
— (2006). The behavioralist meets the market: Measuring social preferences and reputationeffects in actual transactions. Journal of Political Economy, 114 (1), 1–37.
— and Gallet, C. A. (2001). What experimental protocol influence disparities between actualand hypothetical stated values? Environmental and Resource Economics, 20 (3), 241–254.
— and Shogren, J. F. (1998a). Calibration of the difference between actual and hypotheticalvaluations in a field experiment. Journal of Economic Behavior & Organization, 37 (2),193–205.
— and — (1998b). The deadweight loss of christmas: comment. The American EconomicReview, 88 (5), 1350–1355.
— and — (2002). Calibration of willingness-to-accept. Journal of Environmental Economicsand Management, 43 (2), 219–233.
Loomis, J., Bell, P., Cooney, H., Asmus, C. et al. (2009). A comparison of actual andhypothetical willingness to pay of parents and non-parents for protecting infant health: thecase of nitrates in drinking water. Journal of Agricultural and Applied Economics, 41 (3),697–712.
Loomis, J. B. (2014). 2013 waea keynote address: Strategies for overcoming hypothetical biasin stated preference surveys. Journal of Agricultural and Resource Economics, pp. 34–46.
Lusk, J. L. and Norwood, F. B. (2009). Bridging the gap between laboratory experimentsand naturally occurring markets: an inferred valuation method. Journal of EnvironmentalEconomics and Management, 58 (2), 236–250.
31

References
McKinsey (2017). From ’why’ to ’why not’: Sustainable investing as the new normal.
Mukerji, S. and Tallon, J.-M. (2001). Ambiguity aversion and incompleteness of financialmarkets. The Review of Economic Studies, 68 (4), 883–904.
Mulligan, C. B. and Hunter, C. G. (2003). The empirical frequency of a pivotal vote.Public Choice, 116 (1-2), 31–54.
Murphy, J. J., Allen, P. G., Stevens, T. H. and Weatherhead, D. (2005). A meta-analysis of hypothetical bias in stated preference valuation. Environmental and ResourceEconomics, 30 (3), 313–325.
Nicolle, A., Fleming, S. M., Bach, D. R., Driver, J. and Dolan, R. J. (2011). Aregret-induced status quo bias. Journal of Neuroscience, 31 (9), 3320–3327.
Norwood, F. B. and Lusk, J. L. (2011). Social desirability bias in real, hypothetical, andinferred valuation experiments. American Journal of Agricultural Economics, 93 (2), 528–534.
O’Donoghue, T. and Rabin, M. (1998). Procrastination in preparing for retirement. Uni-versity of California-Berkeley Working Paper.
Osman, M. and Wiegmann, A. (2017). Explaining moral behavior. Experimental Psychology.
Paulhus, D. L. (1984). Two-component models of socially desirable responding. Journal ofPersonality and Social Psychology, 46 (3), 598.
Renneboog, L., Ter Horst, J. and Zhang, C. (2008). Socially responsible investments:Institutional aspects, performance, and investor behavior. Journal of Banking & Finance,32 (9), 1723–1742.
Reynolds, W. M. (1982). Development of reliable and valid short forms of the marlowe-crowne social desirability scale. Journal of Clinical Psychology, 38 (1), 119–125.
Rhodes, R. E. and de Bruijn, G.-J. (2013). How big is the physical activity intention–behaviour gap? a meta-analysis using the action control framework. British Journal of HealthPsychology, 18 (2), 296–309.
Riedl, A. and Smeets, P. (2017). Why do investors hold socially responsible mutual funds?The Journal of Finance, 72 (6), 2505–2550.
Salomon, E., Preston, J. L. and Tannenbaum, M. B. (2017). Climate change helplessnessand the (de) moralization of individual energy behavior. Journal of Experimental Psychology:Applied, 23 (1), 15.
Samuelson, W. and Zeckhauser, R. (1988). Status quo bias in decision making. Journalof Risk and Uncertainty, 1 (1), 7–59.
Stober, J. (2001). The social desirability scale-17 (sds-17): Convergent validity, discriminantvalidity, and relationship with age. European Journal of Psychological Assessment, 17 (3),222.
Terlau, W. and Hirsch, D. (2015). Sustainable consumption and the attitude-behaviour-gap phenomenon-causes and measurements towards a sustainable development. InternationalJournal on Food System Dynamics, 6 (3), 159–174.
32

REFERENCES
Tonin, M. and Vlassopoulos, M. (2013). Experimental evidence of self-image concerns asmotivation for giving. Journal of Economic Behavior & Organization, 90, 19–27.
Tversky, A. and Kahneman, D. (1991). Loss aversion in riskless choice: A reference-dependent model. The Quarterly Journal of Economics, 106 (4), 1039–1061.
Vermeir, I. and Verbeke, W. (2006). Sustainable food consumption: Exploring the con-sumer “attitude–behavioral intention” gap. Journal of Agricultural and Environmental ethics,19 (2), 169–194.
Willis Tower Watson (2018). Global pension assets study 2018.
33

A Tables
Appendix
A Tables
Table A.1 – Variable definition
Variable Description
PreferencesSocial preferences The participant’s response to the question “How willing are you
to give to good causes without expecting anything in return?” (1completely unwilling, . . . , 10 completely willing; Falk et al. 2016).
Preferences for sustainable poli-cies
Preference for sustainable policies is a score which is constructedby evaluating Dutch parties on their stance on sustainability us-ing the official voting guide for the 2017 Dutch national elections(https://tweedekamer2017.stemwijzer.nl). Five of the 30 ques-tions shown deal with sustainable issues. All questions are posedsuch that they can be answered with ‘agree’, ‘disagree’, or ‘nei-ther of the two’. A party receives one point for each question forwhich they choose the more sustainable option. If a party chooses‘neither of the two’, it receives half a point.
Social concernsSocial signaling The participant’s response to the question “How likely is it that
you will talk to your friends about this survey?” (1 very unlikely,. . . , 10 very likely; adaption from Riedl and Smeets 2017).
Financial beliefsExpected returns with 4 SDGs The participant’s response to the question “When do you think
the investment return is highest?” Answer options: ‘It is highestwith 3 SDGs’, ‘The return is equally high with 3 or 4 SDGs’, ‘Itis highest with 4 SDGs’, and ‘I do not know’.
Lower returns with 4 SDGs Dummy variable equal to one if the participant believes that thereturns is highest with three SDGs.
Equal returns with 3 or 4 SDGs Dummy variable equal to one if the participant believes that thereturns is equally high with three or four SDGs.
Higher returns with 4 SDGs Dummy variable equal to one if the participant believes that thereturns is highest with four SDGs.
Do not know Dummy variable equal to one if the participant reports to notknow when the return is the highest.
Willingness to payAccept lower returns The participant’s response to the question “Do you want Pen-
sioenfonds Detailhandel to opt for four SDGs if the return oninvestment would decrease?”. Answer options: ‘yes’, ‘no’, and ‘Ido not know’
TreatmentsReal Participants in the real treatment were informed that the ques-
tion “Do you want Pensioenfonds Detailhandel to add (leave out)the fourth sustainable development goal ‘Responsible consump-tion and production’?” was consequential. Words in parenthesesrefer to the different status quo treatments. Choices were guar-anteed to be implemented by the pension fund if more than 50%of respondents would choose in favor of three, respectively fourSDGs.
Hypothetical Participants in the hypothetical treatment were informed that thequestion “Do you want Pensioenfonds Detailhandel to add (leaveout) the fourth sustainable development goal ‘Responsible con-sumption and production’?” was not consequential. Words inparentheses refer to the different status quo treatments.
Continued on next page
34

A Tables
Table A.1—ContinuedVariable Description
3 SDG default Participants in the 3 SDG default treatment were told that thepension fund currently focuses on three SDGs. Participants wereintroduced to the fourth SDG ‘Responsible consumption and pro-duction’ and could answer the question: “Do you want Pensioen-fonds Detailhandel to add the fourth sustainable development goal‘Responsible consumption and production’?”. Answer options:‘Yes, add’, ‘No, do not add’, and ‘I have no opinion regarding thismatter’.
4 SDG default Participants in the 4 SDG default treatment were told that thepension fund’s future policy will include a fourth SDG ‘Responsi-ble consumption and production’. Participants could then choose:“Do you want Pensioenfonds Detailhandel to leave out the fourthsustainable development goal ‘Responsible consumption and pro-duction’?”. Answer options: ‘Yes, leave it out’, ‘No, do not leaveit out’, and ‘I have no opinion regarding this matter’.
DemographicsFemale Dummy variable equal to one if the participant reports being a
woman.Age The participant’s self-reported age.Highly educated Dummy variable equal to one if the participant reports having a
university degree or a degree from a university of applied sciences.Financial backgroundLow income Dummy variable equal to one if the participant’s reported monthly
net household income is below 2,500 euro.Middle income Dummy variable equal to one if the participant’s reported monthly
net household income is between 2,500 euro and 4,000.High income Dummy variable equal to one if the participant’s reported monthly
net household income is above 4,000 euro.Do not report Dummy variable equal to one if the investor does not disclose his
or her monthly net household income.ComprehensionUnderstodd treatment (Yes) Dummy variable equal to one if the participant correctly answers
the control question “If a majority chooses ‘Yes, add’ (‘Yes, leaveit out’), Pensioenfonds Detailhandel a. guarantees to add (leaveout) ’Sustainable consumption and production’ to (of) its sociallyresponsible investment policy as the fourth Sustainable Develop-ment Goal. The Board of Pensioenfonds Detailhandel has decidedto implement the outcome of this vote. b. cannot guarantee thatit will add (leave out) ‘Sustainable consumption and production’to (of) its socially responsible investment policy as the fourthSustainable Development Goal but may include the results of thesurvey in its choice.” Correct means answer ‘a’ if the participantis in the real choice treatment and ‘b’ if the participant is in thehypothetical choice treatment.
More information (Yes) Dummy variable equal to one if the participant answers the ques-tion “Would you rather have received more information to makeyour choice on adding (leaving out) the fourth SDG?” with ‘yes’.Answer options: ‘Yes’, ‘No’
Continued on next page
35

A Tables
Table A.1—ContinuedVariable Description
Exclusion policyExclusion The participant’s response to the question “Pensioenfonds Detail-
handel wants to know which companies it should exclude from itsinvestments (multiple answers possible). Companies... a. pro-ducing tobacco; b. producing controversial weapons (e.g. clus-ter bombs and landmines); c. producing alcohol; d. producingweapons (weapons other than controversial weapons); e. violatinghuman rights; f. using forced labor; g. having a bad influence onthe environment; h. involving in corruption, extortion or bribery;i. allowing the use of child labor; j. I do not want to excludecompanies.”
36

A Tables
Table A.2 – Summary statistics.
This table presents summary statistics for the survey respondents. Variable definitions are provided in TableA.1. Differences in the number of observations stem from the fact that not all participants in the experimentsanswered all survey questions.
Mean Median Std Dev Obs.
PreferencesSocial preferences (1–10) 6.1 6 2.5 2,614Preferences for sustainable policies (0–5) 2.5 4 2.1 1,558
Financial beliefsReturn expectation
Lower with 4 SDGs 16.3% 452Equal with 3 or 4 SDGs 24.7% 684Higher with 4 SDGs 15.4% 472Do not know 43.6% 1,210
Willingness to payAccept lower returns
Yes 42.3% 965No 39.0% 891do not know 18.7% 428
DemographicsFemale 61.5% 1,631Age 46.4 50 14.2 2,652Highly educated 29.7% 2,505
Financial backgroundNet income (monthly, per houshold) AC 2,868 AC 2,750 AC 1,694 1,991
Low income (AC 0 to AC 2,500) 35.3% 933Middle income (AC 2,500 to AC 4,000) 29.4% 776High income (above AC 4,000) 10.7% 282do not report 24.7% 653
ComprehensionUnderstood treatment (Yes) 87.0% 2,875More information (Yes) 33.4% 1,008
37

AT
able
s
Table A.3 – Randomization check.
This table presents a randomization check on the key characteristics between respondents in the real and in the hypothetical treatment. Differences in the number ofobservations stem from the fact that not all participants in the experiments answered all survey questions. P-values are from χ2 tests (a), Kruskal-Wallis tests (b).Variable definitions are provided in Table A.1.
Real Hypothetical p-valueMean Median Std Dev Obs. Mean Median Std Dev Obs.
DemographicsFemale 60.8% 1,295 62.4% 1,269 0.416a
Age 46.6 50 14.5 1,295 46.2 50 13.9 1,269 0.290b
Highly educated 29.9% 1,229 29.2% 1,190 0.739a
Financial backgroundNet income (monthly, per houshold) AC 2,837 AC 2,750 AC 1,690 969 AC 2,901 AC 2,750 AC 1,703 949 0.321b
Low income (AC 0 to AC 2,500) 36.6% 473 33.7% 426 0.124a
Middle income (AC 2,500 to AC 4,000) 28.3% 366 30.1% 381 0.313a
High income (above AC 4,000) 10.6% 130 11.2% 142 0.337a
do not report 25.0% 323 24.9% 315 0.963a
PreferencesSocial preferences (1–10) 6.1 7 2.5 1,280 6.1 6 2.4 1,249 0.631b
Preferences for sustainable policies (0–5) 2.5 4 2.1 772 2.5 4 2.1 735 0.463b
38

A Tables
Table A.4 – Comparison of the official 2017 Dutch parliamentary election resultsto the reported voting behavior of respondents in our sample.
This table presents the distribution of votes in the 2017 Dutch parliamentary elections within our sample andcompares it to the official election results. 2,647 respondents answered the question “Did you vote in the lastnational parliamentary election?”. Respondents were given the answer options ‘Yes’, ‘No’, and ‘I do not wantto say’. The last option was chosen by 139 respondents while 2,142 respondents reported to have voted. As afollow-up question, respondents were asked to name the party they voted for. They could also choose to keepthis information private (‘I do not want to say’) which 562 (26.2%) respondents did. The voting distributionof the remaining 1,580 respondents is reported below. The official 2017 parliamentary election results can befound online at https://www.verkiezingsuitslagen.nl/verkiezingen/detail/TK20170315.
Reported Official 2017voting behavior voter turnover
Voted in 2017 85.4% 81.6%
Voted for...Volkspartij voor Vrijheid en Democratie (VVD) 23.2% 21.3%Democraten 66 (D66) 14.4% 12.2%GroenLinks 14.0% 9.1%Christen-Democratisch Appel (CDA) 12.0% 12.4%SP (Socialistische Partij) 7.5% 9.1%Partij voor de Vrijheid (PVV) 5.3% 13.1%ChristenUnie 5.0% 3.4%Partij van de Arbeid (P.v.d.A.) 4.9% 5.7%Partij voor de Dieren 4.6% 3.2%50PLUS 2.8% 3.1%Staatkundig Gereformeerde Partij (SGP) 2.3% 2.1%Forum voor Democratie 2.1% 1.8%DENK 0.4% 2.1%Other 1.5% 1.5%
39

AT
able
s
Table A.5 – The preference for sustainable policies.
This table presents the preference for sustainable policies which is a score which is constructed by evaluating Dutch parties on their stance on sustainability using theofficial voting guide for the 2017 Dutch national elections (https://tweedekamer2017.stemwijzer.nl). Five of the 30 questions shown deal with sustainable issues. Allquestions are posed such that they can be answered with ‘agree’, ‘disagree’, or ‘neither of the two’. A party receives one point for each question for which they choosethe more sustainable option. If a party chooses ‘neither of the two’, it receives half a point. The score is calculated for each of the parties shown in Table A.4.
VVD PVV CDA D66 GroenLinks SP PvdAMileage tax The government must not tax the posses-
sion of the car, but the number of kilome-ters driven. (agree = 1 pt)
0 0 0 1 1 1 1
Infrastructure More money needs to be spent on the con-struction of new roads. (agree = 0 pts)
0 0 0 1 1 1 1
Coal-firedpower stations
All coal-fired power stations may remainopen for the time being. (agree = 0 pts)
0 0 0.5 1 1 1 1
VAT rate formeat
The high VAT rate of 21% must be appliedto meat. (agree = 1 pt)
0 0 0 0 1 0 0
Developmentaid
The Netherlands should spend moremoney for the development of poor coun-tries. (agree = 1 pt)
0 0 0 1 1 1 1
Total 0 0 0.5 4 5 4 4
Christen- Partij voor 50PLUS SGP DENK Forum voorUnie de Dieren Democratie
Mileage tax The government must not tax the posses-sion of the car, but the number of kilome-ters driven. (agree = 1 pt)
1 1 0 1 1 1
Infrastructure More money needs to be spent on the con-struction of new roads. (agree = 0 pts)
1 1 1 0 1 0
Coal-firedpower stations
All coal-fired power stations may remainopen for the time being. (agree = 0 pts)
1 1 1 0 1 0
VAT rate formeat
The high VAT rate of 21% must be appliedto meat. (agree = 1 pt)
0 1 0 0 0 0
Developmentaid
The Netherlands should spend moremoney for the development of poor coun-tries. (agree = 1 pt)
1 1 1 1 1 0
Total 4 5 3 2 4 1
40

A Tables
Table A.6 – Voting behavior, preferences, and sustainable investing.
This table presents the distribution of preferences and the choice on sustainable investing of respon-dents who are grouped according to their reported voting behavior in the Dutch national elections2017. The reported voting behavior refers to the question “Did you vote in the last national par-liamentary election?”. Respondents were given the answer options ‘Yes’, ‘No’, and ‘I do not wantto say’. As a follow-up question, respondents were asked to name the party they voted for. Theycould also choose to keep this information private. Preferences for sustainable policies is a score whichis constructed by evaluating Dutch parties on their stance on sustainability using the official votingguide for the 2017 Dutch national elections (https://tweedekamer2017.stemwijzer.nl). Five of the 30questions shown deal with sustainable issues. All questions are posed such that they can be answeredwith ‘agree’, ‘disagree’, or ‘neither of the two’. A party receives one point for each question for whichthey choose the more sustainable option. If a party chooses ‘neither of the two’, it receives half a point(see Table A.5). The distribution of choices ‘4 SDG’ and ‘3 SDG’ refers to the following question:“Do you want Pensioenfonds Detailhandel to add (leave out) the fourth sustainable development goal‘Responsible consumption and production’?” Answer options were ‘Yes, add (leave it out)’, ‘No, donot add (leave it out)’, and ‘I have no opinion regarding this matter’. Words in parentheses referto the different status quo treatments which are looked at jointly here as are real and hypotheticaltreatment.
Preferences for Percentage offor sustainable respondents
policies who chose4 SDGs 3 SDGs
GroenLinks 5 89.8% 5.1%Partij voor de Dieren 5 88.9% 2.8%Democraten 66 (D66) 4 85.0% 8.2%DENK 4 83.3% 0.0%SP (Socialistische Partij) 4 78.5% 6.0%Partij van de Arbeid (P.v.d.A.) 4 77.9% 6.5%ChristenUnie 4 76.0% 9.3%50PLUS 3 70.7% 7.3%Staatkundig Gereformeerde Partij (SGP) 2 72.2% 8.3%Forum voor Democratie 1 48.4% 32.3%Christen-Democratisch Appel (CDA) 0.5 74.3% 6.4%Volkspartij voor Vrijheid en Democratie (VVD) 0 71.1% 13.8%Partij voor de Vrijheid (PVV) 0 55.6% 16.1%Other - 60.8% 17.4%Do not report - 66.9% 11.9%Did not vote - 61.7% 8.7%
41

A Tables
Table A.7 – Approval ratings for various exclusion policies.
This table compares the approval ratings of respondents regarding exclusion policies. Exclusion refers to thefollowing question: “Pensioenfonds Detailhandel wants to know which companies it should exclude from itsinvestments (multiple answers possible). Companies... a. producing tobacco; b. producing controversialweapons (e.g. cluster bombs and landmines); c. producing alcohol; d. producing weapons (weapons otherthan controversial weapons); e. violating human rights; f. using forced labor; g. having a bad influence on theenvironment; h. involving in corruption, extortion or bribery; i. allowing the use of child labor; j. I do notwant to exclude companies.” Respondents who choose to not exclude any company could not select any of theanswer options ‘a’ through ‘i’. Column (1) shows the average of all respondents who answered the exclusionquestion. The categorization of respondents in columns (2) to (4) is done according to how they answered thequestion: “Do you want Pensioenfonds Detailhandel to add (leave out) the fourth sustainable development goal‘Responsible consumption and production’?”. Answer options were ‘Yes, add (leave it out)’, ‘No, do not add(leave it out)’, and ‘I have no opinion regarding this matter’. Words in parentheses refer to the different statusquo treatments which are looked at jointly here. Respondents are categorized into those who choose four SDGs,those who choose three SDGs, and those who report to have no opinion.
All 4 SDGs 3 SDGs Noopinion
Corruption 86.9% 90.9% 77.0% 76.0%Child labor 85.8% 90.9% 73.6% 71.1%Human rights violation 85.3% 90.8% 69.3% 71.5%Forced labor 83.0% 87.8% 70.5% 70.5%Controversial weapons 79.4% 84.7% 69.7% 63.2%Bad influence on environment 72.8% 79.0% 55.2% 57.6%Non-controversial weapons 70.4% 74.1% 57.1% 62.2%Tobacco 44.2% 47.5% 36.8% 33.7%Alcohol 17.4% 18.6% 13.0% 14.9%No exclusion 5.7% 3.2% 10.3% 13.6%
42

B Figures
B Figures
Figure A.1 – Percentage choosing 4 SDGs if uncertain about return.
The graph presents the percentage of participants choosing four SDGs if they answered ’I do not know’ tothe following question: “When do you think the investment return is highest?” Answer options were ‘It ishighest with 3 SDGs’, ‘The return is equally high with 3 or 4 SDGs’, ‘It is highest with 4 SDGs’, and ‘I do notknow’. 3 SDG default and 4 SDG default refer to two different status quo treatments to which participants wererandomly assigned. In the 3 SDG default, participants were told that the pension fund currently focuses on threeSDGs. Participants were introduced to the fourth SDG ‘Responsible consumption and production’ and couldchoose: “Do you want Pensioenfonds Detailhandel to add the fourth sustainable development goal ‘Responsibleconsumption and production’?”. Answer options were ‘Yes, add’, ‘No, do not add’, and ‘I have no opinionregarding this matter’. In the 4 SDG default treatment, it was communicated that the pension fund’s futurepolicy will include a fourth SDG ‘Responsible consumption and production’. Participants could then choose:“Do you want Pensioenfonds Detailhandel to leave out the fourth sustainable development goal ‘Responsibleconsumption and production’?”. Answer options were ‘Yes, leave it out’, ‘No, do not leave it out’, and ‘I haveno opinion regarding this matter’. The real and hypothetical choice treatments are look at jointly. Error barspresent 95% confidence intervals. Non-overlapping error bars indicate a statistically significant difference at the5% level.
43

B Figures
Figure A.2 – The effect of social signaling on sustainable investing.
This graph presents the distribution of real and hypothetical choices for respondents with a high desire forsocial signaling. Social signaling is elicited by asking respondents to rate the question “How likely is it that youwill talk to your friends about this survey?” on a 10-point Likert scale from very unlikely to very likely (seeRiedl and Smeets, 2017). Respondents are reported to have a high desire for social signaling if they rated thisquestion with a 3 or higher (55.1% of the sample). The categories shown in the graph refer to the followingquestion: “Do you want Pensioenfonds Detailhandel to add (leave out) the fourth sustainable development goal‘Responsible consumption and production’?”. Answer options were ‘Yes, add (leave it out)’, ‘No, do not add(leave it out)’, and ‘I have no opinion regarding this matter’. Words in parentheses refer to the different statusquo treatments which are looked at jointly here. The graph presents the distribution of real and hypotheticalchoices separately, which refers to whether answering the above-stated question was consequential or not. Inthe hypothetical treatment, choices were nonconsequential. In the real treatment, choices were guaranteed to beimplemented by the pension fund if more than 50% of respondents would choose in favor of three, respectivelyfour SDGs. Error bars present 95% confidence intervals. Non-overlapping error bars indicate a statisticallysignificant difference at the 5% level between the treatments real and hypothetical within each answer category.
44

C Survey
C Survey
Welcome!
Pensioenfonds Detailhandel invests your pension savings in a sustainable way. In doing
so, Pensioenfonds Detailhandel strives to achieve continuous improvements.
[Real treatment] That is why Pensioenfonds Detailhandel has decided to ask you about our
investment policy.
[Hypothetical treatment] Pensioenfonds Detailhandel is genuinely interested in your opinion
on how we invest.
Of the people who participate in this survey, 25 randomly selected individuals will receive a
VVV Gift Voucher worth 25 euros. Additionally, one randomly selected participant will
receive a VVV Gift Voucher worth 250 euros.
You will be entered in the prize draw if you complete the whole survey. Maastricht University
and Pensioenfonds Detailhandel guarantee that all payments will be made.
This survey takes around fifteen minutes to complete. Pensioenfonds Detailhandel will make
the results available in Autumn.
Thank you in advance for your participation!
Yours sincerely, Maastricht University and Pensioenfonds Detailhandel.
[Part 1]
What is socially responsible investment?
1. Are you familiar with the United Nation’s Sustainable Development Goals?
(a) Yes
(b) No
[Answer if yes or no:] The United Nation’s Sustainable Development Goals focus on seventeen
goals relating to the environment, the climate, poverty, and other themes. The next page
explains how Pensioenfonds Detailhandel uses these Sustainable Development Goals.
45

C Survey
[Randomly assign one of the following parts]
— Real & 3 SDG default —
— Real & 4 SDG default —
— Hypothetical & 3 SDG default —
— Hypothetical & 4 SDG default —
[For all treatments]
6. When do you think that the investment return is the highest?
[Info button: Investment return is the degree to which an investment earns money when
taking the level of risk into account. In other words, more money results in a greater
return. However, an investment that takes a greater risk to earn a certain amount results
in a lower risk-adjusted return.]
(a) The investment return is highest for three sustainable development goals.
(b) The investment return is highest for four sustainable development goals.
(c) The investment return remains the same for three or four sustainable development
goals.
(d) I don’t know
7. Would you want Pensioenfonds Detailhandel to opt for four Sustainable Development
Goals even if this decreased the risk-adjusted return?
(a) Yes
(b) No
(c) I don’t know
8. Predict which percentage of Pensioenfonds Detailhandel’s participants would also opt for
four Sustainable Development Goals even if this decreased the risk-adjusted return.
(a) percent
46

C Survey
[Part 2]
The following questions aim to clarify your opinion of investing in a socially responsible way.
As opposed to previous questions, your answers in this part may not lead to Pensioenfonds
Detailhandel taking direct action but can help us make decisions in the future.
How does Pensioenfonds Detailhandel currently make decisions regarding socially
responsible investments?
Pensioenfonds Detailhandel now implements its socially responsible investment policy in two
ways:
i. by excluding companies
ii. by entering into discussions with companies.
The next question concerns excluding companies as a method of investing in a socially respon-
sible way.
9. Pensioenfonds Detailhandel would like you to list which types of companies you think it
should exclude from investments (several answers possible). Companies that...
(a) produce tobacco
(b) produce controversial weapons such as cluster bombs and landmines
(c) produce alcohol
(d) produce weapons (other than controversial weapons)
(e) infringe on human rights
(f) use forced labour
(g) have a negative impact on the environment
(h) are involved in corruption, extortion or bribery
(i) allow child labour
47

C Survey
[Part 3]
We would also like to ask you some background questions.
10. How willing are you to give to good causes without expecting anything in return?
completely unwilling 1—10 very willing
11. I am...
(a) Male
(b) Female
(c) Other
12. In what year were you born?
(a) Year of birth
13. What is the highest level of education you have completed?
(a) Preparatory secondary vocational education (VMBO) or lower general secondary
education (MAVO or MULO)
(b) Higher general secondary education (HAVO)
(c) Pre-university education (HBS, HAVO, VWO) or pre-university education with
Latin and/or Greek (Gymnasium)
(d) Intermediate vocational education level 1 (MBO)
(e) Intermediate vocational education level 2 (MBO)
(f) Intermediate vocational education level 3 (MBO)
(g) Intermediate vocational education level 4 (MBO)
(h) Higher professional education (HBO)
(i) University (WO)
(j) Other:
(k) I did not follow any of the above types of education
14. Did you vote in the last national parliamentary elections?
(a) Yes
(b) No
(c) I prefer not to answer
48

C Survey
15. If ‘Yes’ in previous question: Did you vote in the last national parliamentary elections?
(a) VVD
(b) CDA
(c) D66
(d) ChristenUnie
(e) PVV
(f) GroenLinks
(g) SP
(h) PvdA
(i) Partij voor de Dieren
(j) 50PLUS
(k) SGP
(l) DENK
(m) Forum voor Democratie
(n) Other, specifically:
(o) I prefer not to answer
We have a few questions regarding your financial situation. We understand that this information
is sensitive and you can decide to skip these questions. However, as your answers to these
questions are very valuable, we hope you will answer them. We will handle your data with due
care.
49

C Survey
16. What is your household’s net monthly income?
[Info button: net = your and your partner’s income combined (if applicable) minus taxes
and contributions.]
(a) Less than ACI930
(b) Between AC 930 and AC 1,500
(c) Between AC 1,500 and AC 2,000
(d) Between AC 2,000 and AC 2,500
(e) Between AC 2,500 and AC 3,000
(f) Between AC 3,000 and AC 4,000
(g) Between AC 4,000 and AC 7,000
(h) Between AC 7,000 and AC 10,000
(i) Over AC 10,000
(j) I don’t know
(k) I prefer not to answer
17. How likely are you to discuss this survey with friends?
completely unlikely 1—10 very likely
18. We asked approximately 25,000 participants to complete this survey. How many people
do you think will complete the survey?
19. If you win a VVV Gift Voucher, we will contact you by e-mail. If you want to win the
prize, please tick the box.
� I want to win the prize.
20. If you would like to receive an e-mail with information about the results of this survey,
please tick the box.
� I would like to receive information.
21. Please fill in your e-mail address below.
Thank you for participating.
Yours sincerely, Maastricht University and Pensioenfonds Detailhandel.
50

D Treatment ’3 SDG Default’ (real and hypothetical)
D Treatment ’3 SDG Default’ (real and hypothetical)
Pensioenfonds Detailhandel currently focuses on three of the United Nations’ 17 Sustainable
Development Goals. These three Sustainable Development Goals are:
1. Climate action:
e.g. taking urgent action to combat climate change such as by ensuring that businesses
emit less CO2
2. Decent work and economic growth:
e.g. full employment for all women and men
3. Peace, justice, and strong institutions:
e.g. eradication of corruption and bribery
For more information on the Sustainable Development Goals, please click here: http://www.
sdgnederland.nl/sdgs/
What does it mean to invest according to the United Nations‘ Sustainable Devel-
opment Goals?
Pensioenfonds Detailhandel uses its influence in the companies in which it invests. In 2017, the
pension fund spoke with a total of 246 company boards to promote sustainability.
Royal Dutch Shell case:
Working in collaboration with other parties, Pensioenfonds Detailhandel has contacted
Shell on a number of occasions and made it clear that Shell has a lot of work ahead of it to
achieve the objectives of the Paris Climate Agreement (to become CO2 neutral by 2015)
and that it is urgent to do so.
The example of the diesel scandal in 2015:
Pensioenfonds Detailhandel contacted managers at Volkswagen (VW) in the aftermath
of the diesel scandal. Pensioenfonds Detailhandel’s involvement helped VW focus more
on its long-term emissions strategy.
51

D Treatment ’3 SDG Default’ (real and hypothetical)
[Real treatment]
You have been selected!
Pensioenfonds Detailhandel has decided to give you a say in how it determines its socially re-
sponsible investment policy.
But how does this work?
1. You can let Pensioenfonds Detailhandel know whether you agree with the current
policy that focuses on three Sustainable Development Goals, or whether you would like
to add a fourth one.
2. Your choice counts. If the majority of respondents chooses to add a fourth sus-
tainable development goal, it will happen. The board of Pensioenfonds Detailhandel
guarantees its implementation.
[Hypothetical treatment]
Pensioenfonds Detailhandel would like to know what your preferences are for socially respon-
sible investment.
But how does this work?
1. You can let Pensioenfonds Detailhandel know whether you agree with the current
policy that focuses on three Sustainable Development Goals, or whether you would like
to add a fourth one.
2. Pensioenfonds Detailhandel is genuinely interested in your opinion and may take
the results of the survey into account when making a decision.
Below, you find the fourth Sustainable Development Goal that you can add to the current policy.
Sustainable consumption and production: This Sustainable Development Goal ensures
that parties, such as Pensioenfonds Detailhandel, are obliged to do the following:
e.g. actively work against child labour, guarantee fair wages.
52

D Treatment ’3 SDG Default’ (real and hypothetical)
Please note: implementing Sustainable Development Goals means that financial returns are
not the only factor that is taken into consideration. Making investments with this in mind
means that it is important to take the impact on the environment and wider society into ac-
count.
The influence of your choice
If Pensioenfonds Detailhandel focuses on four Sustainable Development Goals, this means that
it will contact companies to discuss their sustainable business practices more often. The fund
will also enter into discussions with companies about the fourth Sustainable Development Goal,
in addition to the discussions it has about the other three Sustainable Development Goals.
As it is important that you understand this explanation, we will ask you a short question
to test your understanding on the next page.
On the next page you will be asked the following:
Do you want Pensioenfonds Detailhandel to add the fourth sustainable development goal
‘Responsible consumption and production’?
(a)Yes, add
(b) No, do not add
(c) I have no opinion regarding the matter
Which of the following statements is correct?
2. If a majority chooses ‘Yes, add’, Pensioenfonds Detailhandel
(a) guarantees to add ’Sustainable consumption and production’ to its socially respon-
sible investment policy as the fourth Sustainable Development Goal. The Board of
Pensioenfonds Detailhandel has decided to implement the outcome of this vote.
(b) cannot guarantee that it will add ‘Sustainable consumption and production’ to its
socially responsible investment policy as the fourth Sustainable Development Goal
but may include the results of the survey in its choice.
53

D Treatment ’3 SDG Default’ (real and hypothetical)
[Real treatment]
If a: That is correct. Pensioenfonds Detailhandel guarantees that it will add ’Sustainable
consumption and production’ to its socially responsible investment policy as the fourth Sus-
tainable Development Goal if the majority of participants chooses ‘Yes, add’. The Board of
Pensioenfonds Detailhandel has decided to implement the outcome of this vote.
If b: Your answer is incorrect. Pensioenfonds Detailhandel guarantees that it will add ’Sus-
tainable consumption and production’ to its socially responsible investment policy as the fourth
Sustainable Development Goal if the majority of participants chooses ‘Yes, add’. The Board of
Pensioenfonds Detailhandel has decided to implement the outcome of this vote.
[Hypothetical treatment]
If a: Your answer is incorrect. Pensioenfonds Detailhandel cannot guarantee that your choice
will lead to ’Sustainable consumption and production’ being added as the fourth Sustainable
Development Goal, but the fund is interested in your opinion.
If b: This is correct. Pensioenfonds Detailhandel cannot guarantee that your choice will
lead to ’Sustainable consumption and production’ being added as the fourth Sustainable De-
velopment Goal, but the fund is interested in your opinion.
Please note that this is your choice. When considering your decision, please do so carefully.
3. Do you want Pensioenfonds Detailhandel to add the fourth sustainable development goal
‘Responsible consumption and production’?
(a) Yes, add
(b) No, do not add
(c) I have no opinion regarding the matter
4. Would you have preferred receiving more information to make a decision regarding the
development goals?
(a) Yes
(b) No
5. Please indicate below which percentage of participants of this survey will choose which
answer regarding the question of adding the fourth Sustainable Development Goal.
(a) Yes, add: percent
(b) No, do not add: percent
(c) I have no opinion regarding the matter: percent
54

E Treatment ’4 SDG Default’ (real and hypothetical)
E Treatment ’4 SDG Default’ (real and hypothetical)
Pensioenfonds Detailhandel currently focuses on three of the United Nations’ 17 Sustainable
Development Goals. These three Sustainable Development Goals are:
1. Climate action:
e.g. taking urgent action to combat climate change such as by ensuring that businesses
emit less CO2
2. Decent work and economic growth:
e.g. full employment for all women and men
3. Peace, justice, and strong institutions:
e.g. eradication of corruption and bribery
The future policy also includes this fourth goal
4. Sustainable consumption and production
For more information on the Sustainable Development Goals, please click here: http://www.
sdgnederland.nl/sdgs/
What does it mean to invest according to the United Nations‘ Sustainable Devel-
opment Goals?
Pensioenfonds Detailhandel uses its influence in the companies in which it invests. In 2017, the
pension fund spoke with a total of 246 company boards to promote sustainability.
Royal Dutch Shell case:
Working in collaboration with other parties, Pensioenfonds Detailhandel has contacted
Shell on a number of occasions and made it clear that Shell has a lot of work ahead of it to
achieve the objectives of the Paris Climate Agreement (to become CO2 neutral by 2015)
and that it is urgent to do so.
The example of the diesel scandal in 2015:
Pensioenfonds Detailhandel contacted managers at Volkswagen (VW) in the aftermath
of the diesel scandal. Pensioenfonds Detailhandel’s involvement helped VW focus more
on its long-term emissions strategy.
55

E Treatment ’4 SDG Default’ (real and hypothetical)
[Real treatment]
You have been selected!
Pensioenfonds Detailhandel has decided to give you a say in how it determines its socially re-
sponsible investment policy.
But how does this work?
1. You can let Pensioenfonds Detailhandel know whether you agree with the future
policy that focuses on four Sustainable Development Goals, or whether you would like
to leave out the fourth one.
2. Your choice counts. If the majority of respondents chooses that the fourth sus-
tainable development goal must be left out, it will happen. The board of Pensioenfonds
Detailhandel guarantees its implementation.
[Hypothetical treatment]
Pensioenfonds Detailhandel would like to know what your preferences are for socially respon-
sible investment.
But how does this work?
1. You can let Pensioenfonds Detailhandel know whether you agree with the future
policy that focuses on four Sustainable Development Goals, or whether you would like
to leave out the fourth one.
2. Pensioenfonds Detailhandel is genuinely interested in your opinion and may take
the results of the survey into account when making a decision.
Below, you find the fourth Sustainable Development Goal that you can leave out from the
future policy.
Sustainable consumption and production: This Sustainable Development Goal ensures
that parties, such as Pensioenfonds Detailhandel, are obliged to do the following:
e.g. actively work against child labour, guarantee fair wages.
56

E Treatment ’4 SDG Default’ (real and hypothetical)
Please note: implementing Sustainable Development Goals means that financial returns are
not the only factor that is taken into consideration. Making investments with this in mind
means that it is important to take the impact on the environment and wider society into ac-
count.
The influence of your choice
If Pensioenfonds Detailhandel focuses on four Sustainable Development Goals, this means that
it will contact companies to discuss their sustainable business practices more often. The fund
will also enter into discussions with companies about the fourth Sustainable Development Goal,
in addition to the discussions it has about the other three Sustainable Development Goals.
As it is important that you understand this explanation, we will ask you a short question
to test your understanding on the next page.
On the next page you will be asked the following:
Do you want Pensioenfonds Detailhandel to leave out the fourth sustainable development goal
‘Responsible consumption and production’?
(a)Yes, leave it out
(b) No, do not leave it out
(c) I have no opinion regarding the matter
Which of the following statements is correct?
2. If a majority chooses ‘Yes, leave it out’, Pensioenfonds Detailhandel
(a) guarantees to leave out ’Sustainable consumption and production’ of its socially
responsible investment policy as the fourth Sustainable Development Goal. The
Board of Pensioenfonds Detailhandel has decided to implement the outcome of this
vote.
(b) cannot guarantee that it will leave out ‘Sustainable consumption and production’
of its socially responsible investment policy as the fourth Sustainable Development
Goal but may include the results of the survey in its choice.
57

E Treatment ’4 SDG Default’ (real and hypothetical)
[Real treatment]
If a: That is correct. Pensioenfonds Detailhandel guarantees that it will leave out ’Sustain-
able consumption and production’ of its socially responsible investment policy as the fourth
Sustainable Development Goal if the majority of participants chooses ‘Yes, leave it out’. The
Board of Pensioenfonds Detailhandel has decided to implement the outcome of this vote.
If b: Your answer is incorrect. Pensioenfonds Detailhandel guarantees that it will leave
out ’Sustainable consumption and production’ of its socially responsible investment policy as
the fourth Sustainable Development Goal if the majority of participants chooses ‘Yes, leave it
out’. The Board of Pensioenfonds Detailhandel has decided to implement the outcome of this
vote.
[Hypothetical treatment]
If a: Your answer is incorrect. Pensioenfonds Detailhandel cannot guarantee that it will
leave ‘Sustainable consumption and production’ out of its socially responsible investment pol-
icy as the fourth Sustainable Development Goal, but the fund is interested in your opinion.
If b: This is correct. Pensioenfonds Detailhandel cannot guarantee that it will leave ‘Sus-
tainable consumption and production’ out of its socially responsible investment policy as the
fourth Sustainable Development Goal, but the fund is interested in your opinion.
Please note that this is your choice. When considering your decision, please do so carefully.
3. Do you want Pensioenfonds Detailhandel to leave out the fourth sustainable development
goal ‘Responsible consumption and production’?
(a) Yes, leave it out
(b) No, do not leave it out
(c) I have no opinion regarding the matter
4. Would you have preferred receiving more information to make a decision regarding the
development goals?
(a) Yes
(b) No
58

E Treatment ’4 SDG Default’ (real and hypothetical)
5. Please indicate below which percentage of participants of this survey will choose which
answer regarding the question of adding the fourth Sustainable Development Goal.
(a) Yes, leave it out: percent
(b) No, do not leave it out: percent
(c) I have no opinion regarding the matter: percent
59