getting more from your engineering...
TRANSCRIPT

© 2012 HALLIBURTON. ALL RIGHTS RESERVED. © 2012 HALLIBURTON. ALL RIGHTS RESERVED.
Getting more from your Engineering Data
John Chapman
Regional Technical Manager

© 2012 HALLIBURTON. ALL RIGHTS RESERVED. 2
extracting information
from data
to make better decisions
Getting more from your Engineering Data?

© 2012 HALLIBURTON. ALL RIGHTS RESERVED. 3
extracting information
from data
to make better decisions
Getting more from your Engineering Data?
© 2012 HALLIBURTON. ALL RIGHTS RESERVED. 4
Getting more from your Engineering Data
Data Analytics
Big Data
As an industry, we plan new wells based on past drilling experiences and data
• Much of current historical analysis is based on the experience of the engineer, not on reliable data and consistent analytics
• For the data that is available, it is difficult to extract meaningful and timely knowledge from it

© 2012 HALLIBURTON. ALL RIGHTS RESERVED. 5
Getting more from your Engineering Data
“Data is not information, information is not knowledge…”
Clifford Stoll

© 2012 HALLIBURTON. ALL RIGHTS RESERVED. 6
Why Analytics?
Optimize planning new wells Minimize costs Reduce down-time
• The ability to easily access, review, interrogate, & visualize all relevant data (including historical real-time data) from offset wells.
• Quickly compare data from tens if not hundreds of wells in an area
• Identify patterns that preceded previous downtimes
Benchmarking activities Rate, manage, and improve performance
• Identify the best performing options in relation to a specific process; this could include any process of well planning, well construction, or well abandonment.
• Identify & rank underperforming units, service companies, wells etc.

© 2012 HALLIBURTON. ALL RIGHTS RESERVED. 7
Analytics
© 2012 HALLIBURTON. ALL RIGHTS RESERVED. 8
*available in v2
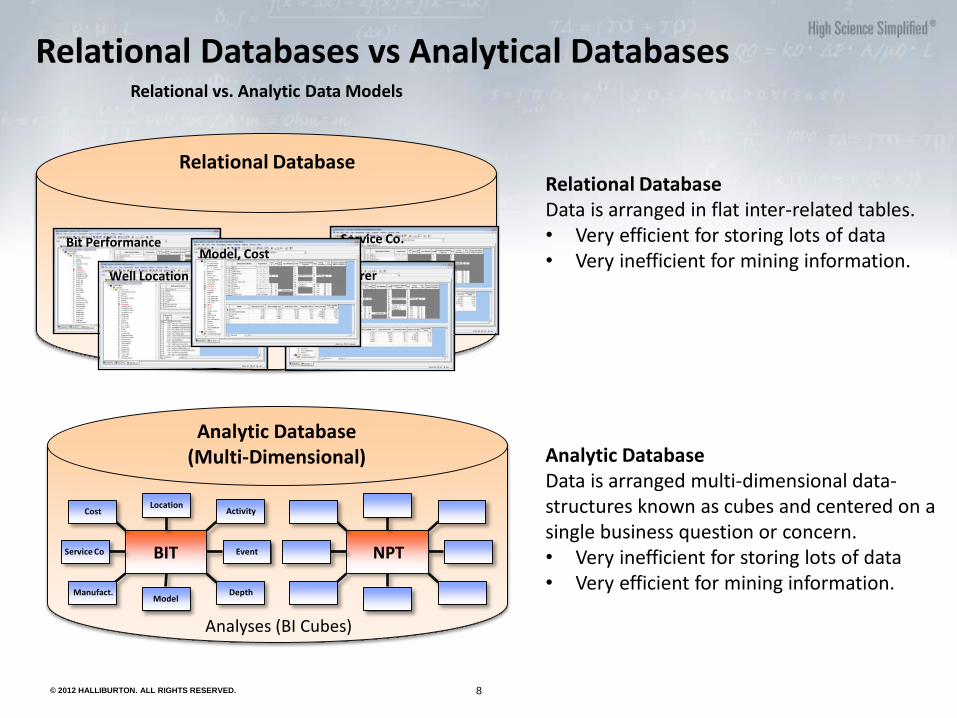
Relational Databases vs Analytical Databases
Relational Database Data is arranged in flat inter-related tables. • Very efficient for storing lots of data • Very inefficient for mining information.
Relational Database
Relational vs. Analytic Data Models
Analytic Database (Multi-Dimensional) Analytic Database
Data is arranged multi-dimensional data-structures known as cubes and centered on a single business question or concern. • Very inefficient for storing lots of data • Very efficient for mining information.
Analyses (BI Cubes)
Bit Performance
Well Location
Service Co.
Manufacturer
Model, Cost
BIT
Location Activity Cost
Service Co Event
Manufact. Model
Depth
NPT

© 2012 HALLIBURTON. ALL RIGHTS RESERVED. 9
Example of business intelligence models (analyses) for common drilling problems:
• NPT Analysis
• BHA Analysis
• Bit Analysis
• Safety Analysis
• Kick Analysis
• Mud Loss Analysis
• Asset Analysis
• Plan vs. Actual
• Rushmore Reports
• Max Activity Analysis
Common Analytical Models
© 2012 HALLIBURTON. ALL RIGHTS RESERVED. 10
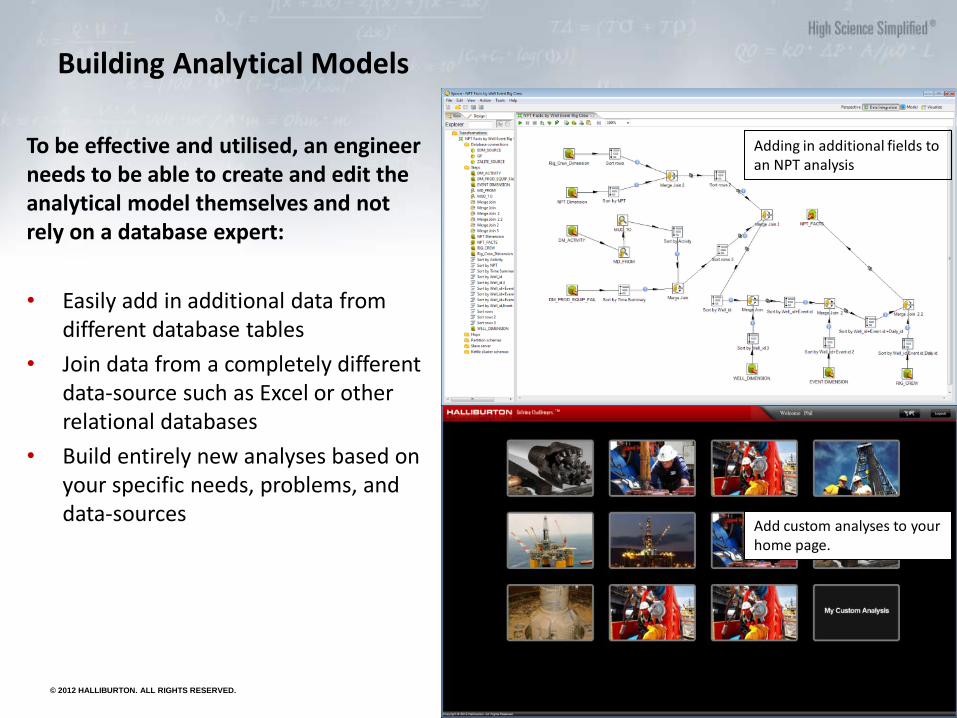
To be effective and utilised, an engineer needs to be able to create and edit the analytical model themselves and not rely on a database expert:
• Easily add in additional data from different database tables
• Join data from a completely different data-source such as Excel or other relational databases
• Build entirely new analyses based on your specific needs, problems, and data-sources
Adding in additional fields to an NPT analysis
Add custom analyses to your home page.
Building Analytical Models

© 2012 HALLIBURTON. ALL RIGHTS RESERVED. 11
End User: Usability, Portability, Filtration and Visualisation

© 2012 HALLIBURTON. ALL RIGHTS RESERVED. 12
BIG data

© 2012 HALLIBURTON. ALL RIGHTS RESERVED. 13
What is Big Data? Definitions
Velocity
Data acquisition rates from in-well sensing has increased in line with Moore’s Law with well-data rates doubling every 1.5 years1.
1) J. Vianney Koelman, JPT July 2011 2) Ahmed Abou-Sayed, JPT October 2012
Volume
Large Operators can have 50+ disparate relational data-stores. Super-majors can easily exceed 2TB of additional data-storage a day2.
Variety
Typically there is a complete lack of integration between structured, semi-structured, and un-structured data systems2.
Velocity
Volume
Variety

© 2012 HALLIBURTON. ALL RIGHTS RESERVED. 14
Velocity
Volume
Variety
What is Big Data? Challenges
Velocity
Traditional databases can not handle these data velocities, and will choke, and relational data-forms become increasingly unwieldy.
1) J. Vianney Koelman, JPT July 2011 2) Ahmed Abou-Sayed, JPT October 2012
Volume
Large data-sets such as real-time data are typically not stored at all or stored in non-relational formats that are impossible to analyze.
Variety
Joining disparate data-sources becomes ever more complex and critical interpretive & contextual data is not included in typical analyses.

© 2012 HALLIBURTON. ALL RIGHTS RESERVED. 15
Big Data & Analytics Workflow
Data Mining & Predictive Analytics Predictive Model Building & Real-Time Decision Making

© 2012 HALLIBURTON. ALL RIGHTS RESERVED. 16
Big Data & Analytics Workflow
Data Cleansing & Analysis Business Intelligence Data Models and Interactive Visualization
Data Mining & Predictive Analytics

© 2012 HALLIBURTON. ALL RIGHTS RESERVED. 17
Big Data Aggregation Real-Time & Historical Data Loading, Aligning, Filtering, Cleaning,
Transforming, Joining & Warehousing
Real-Time Data
Unstructured Data
Relational Databases
Historical Real-Time
Data
Big Data & Analytics Workflow
Data Mining & Predictive Analytics
Data Cleansing & Analysis

© 2012 HALLIBURTON. ALL RIGHTS RESERVED. 18
Big Data & Analytics Workflow
Data Mining & Predictive Analytics
Data Cleansing & Analysis
Big Data Aggregation
Real-Time Data
Contextual Data

© 2012 HALLIBURTON. ALL RIGHTS RESERVED. 19
Big Data and Analytics
1. Big Data Aggregation • Stream WITSML data directly into data-warehouse in relational
form
• Associate contextual engineering and real-time data
• Leverage existing EDM data-model for security and well
identification
2. Historical Data Modeling & Visualization • Drilling/engineering specific, problem-oriented data models
(Analyses)
• Handles drilling/engineering specific data such as runs,
activities, datums, units, time-vs-depth data etc.
• Easy-to-use, intuitive, interactive visualization of Real-Time data
for historical analysis
3. Predictive Analytics • Data mining & model-building for real-time data
• Easy-to-use segmentation, cluster analysis & data cleaning tools
• Single repository & tool for models, model scoring, analytical,
and raw real-time data
Data Mining & Predictive Analytics
Data Cleansing & Analysis
Big Data Aggregation
Real-Time Data
Contextual Data

© 2012 HALLIBURTON. ALL RIGHTS RESERVED. 20
Unscheduled top drive maintenance = NPT
Data Aggregation: Real Time Data Alone is not Enough
Symptoms
– Block position (top drive) static
– No rotation of the drill string
– Pumps on and pumping down-hole
Diagnosis
Off-bottom circulating
Scheduled top drive maintenance = Rig Repair
Safety Incident
© 2012 HALLIBURTON. ALL RIGHTS RESERVED. 21
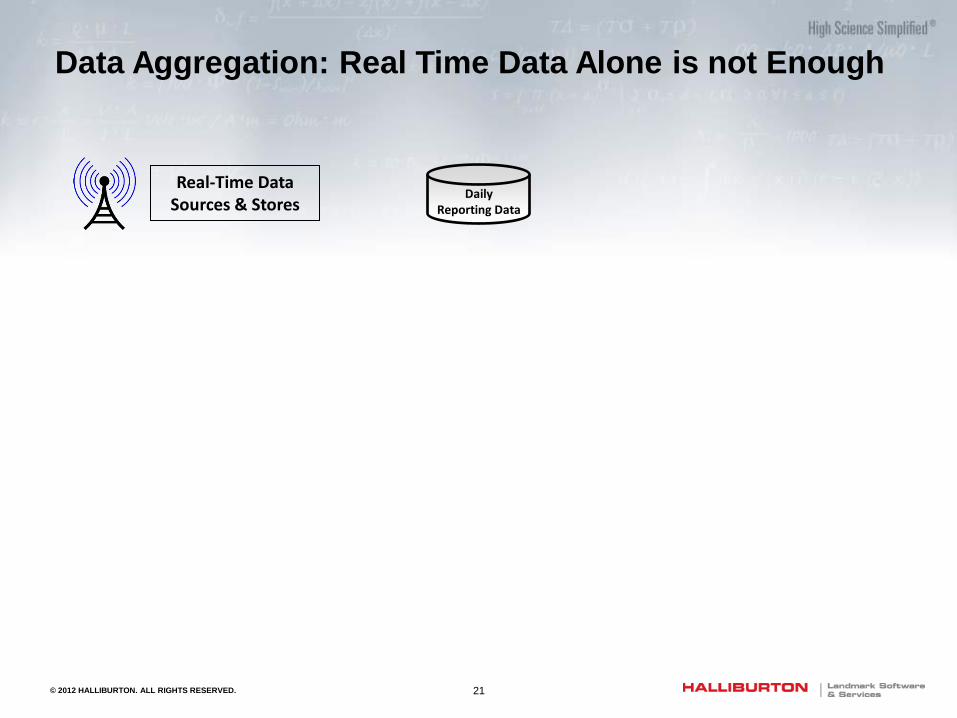
Data Aggregation: Real Time Data Alone is not Enough
Real-Time Data Sources & Stores
Daily Reporting Data

© 2012 HALLIBURTON. ALL RIGHTS RESERVED. 22
Data Aggregation: Real Time Data Alone is not Enough
Real-Time Data Sources & Stores EDM
Other
Other Contextual Data Stores
Other Other
• Bit Manufacturer • Bit Model • Mud Motor
Manufacturer • Rig Name • Rig Crew
• Costs • Safety Incidents

© 2012 HALLIBURTON. ALL RIGHTS RESERVED. 23
Data Aggregation: Real Time Data Alone is not Enough
Real-Time Data Sources & Stores EDM
Other
Other Contextual Data Stores
Other Other
Analytical Framework

© 2012 HALLIBURTON. ALL RIGHTS RESERVED. 24
Data Aggregation: Real Time Data Alone is not Enough
Real-Time Data Sources & Stores EDM
Other
Other Contextual Data Stores
Other Other
Zeta Data Services
WITSML ETL
DENSE
Data Warehouse
FTQS
MMS
Data Warehouse
Analytical Models
Contextual Data Storage
Big Data Storage
Zeta Data Model

© 2012 HALLIBURTON. ALL RIGHTS RESERVED. 25
Data Aggregation: Joining Disparate
Drilling/Engineering Data Sources is not Simple
Granularity Differences
Time vs Depth Data
Interpolating Special Data
Interpolating and Converting Instantaneous Events

© 2012 HALLIBURTON. ALL RIGHTS RESERVED. 26
Data Aggregation: Joining Disparate
Drilling/Engineering Data Sources is not Simple
Granularity Differences
– Data from real-time sensors is at sample rates of 1
data-point per second or less
– Contextual data from relational data sources is much
less, on the rate of per hour or per day
1 H
ou
r
12
Ho
urs
© 2012 HALLIBURTON. ALL RIGHTS RESERVED. 27
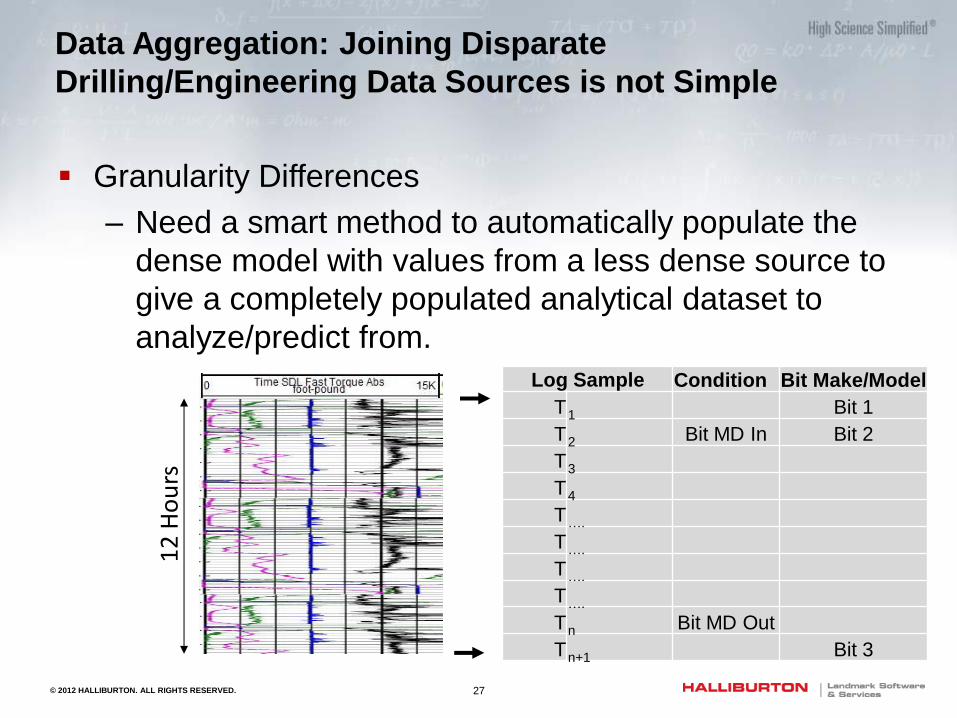
Data Aggregation: Joining Disparate
Drilling/Engineering Data Sources is not Simple
Granularity Differences
– Need a smart method to automatically populate the
dense model with values from a less dense source to
give a completely populated analytical dataset to
analyze/predict from.
12
Ho
urs
Log Sample Condition Bit Make/Model
T 1 Bit 1
T 2 Bit MD In Bit 2
T 3
T 4
T ….
T ….
T ….
T ….
T n Bit MD Out
T n+1 Bit 3

© 2012 HALLIBURTON. ALL RIGHTS RESERVED. 28
Data Aggregation: Joining Disparate
Drilling/Engineering Data Sources is not Simple
Granularity Differences
– Need a smart method to automatically populate the
dense model with values from a less dense source to
give a completely populated analytical dataset to
analyze/predict from
12
Ho
urs
Log Sample Condition Bit Make/Model
T 1 Bit 1
T 2 Bit MD In Bit 2
T 3 Bit 2
T 4 Bit 2
T …. Bit 2
T …. Bit 2
T …. Bit 2
T …. Bit 2
T n Bit MD Out Bit 2
T n+1 Bit 3

© 2012 HALLIBURTON. ALL RIGHTS RESERVED. 29
Data Analysis: Drilling Analytical Models
Interrogating Terabytes of data can be a time-consuming
and frustrating process – BI/OLAP-Cubes (multi-dimensional models) allow users to focus on specific
drilling/engineering challenges
– Data that can be joined in data-bases utilize the Analytics Engine for performance.
– All streaming in optimized using Hadoop MapReduce
Big Data
Relational Structure
Multi-Dimensional Data (Cubes)
Kick
ROP
Relational Structure
Contextual Data
Analytical Data Models

© 2012 HALLIBURTON. ALL RIGHTS RESERVED. 30
Data Analysis: Complex Joins & Common Data Model
Joining data for traditional Analytics is based on time
and/or contextual IDs
With drilling data we have a combination of time and
depth ranges across multiple data-sources as well as
contextual IDs
For example: – BHA run tables have Well ID, Wellbore ID, BHA Run ID, & Assembly ID
– Assembly tables have Well ID, Wellbore ID, Assembly ID
– Hole Section tables have Well ID, Wellbore ID, Hole Section ID, and
Assembly ID (but only for certain applications & depths of Hole Section
Annulus are not stored in the database)
– Sections can have hole start and end depths, BHA in & out depths, section
start and end times, BHA start & end times etc.
To be successful we need to join across not only all these multiple tables, with
multiple IDs, but also across multiple time and depth ranges.

© 2012 HALLIBURTON. ALL RIGHTS RESERVED. 31
Data Analysis: Complex Joins & Common Data Model

© 2012 HALLIBURTON. ALL RIGHTS RESERVED. 32
Data Analysis: Complex Joins & Common Data Model
In ZetaAnalytics we have built a system & workflow to combine all these
disparate drilling objects, and hide the complexity from the end-user
We have designed a Common Data Model consisting of standard
Dimensions for your common drilling objects that can be re-used with data
from any E&P data-store
Hole Sections
Bit
BHA
BHA Components
Costs
Equipment
Materials
Phases/Codes
Mud,
Formations
Well
Wellbore
NPT
Event
Perforation
Stimulation etc.
Logical dimensional data-models for wellbore & drill-string
© 2012 HALLIBURTON. ALL RIGHTS RESERVED. 33
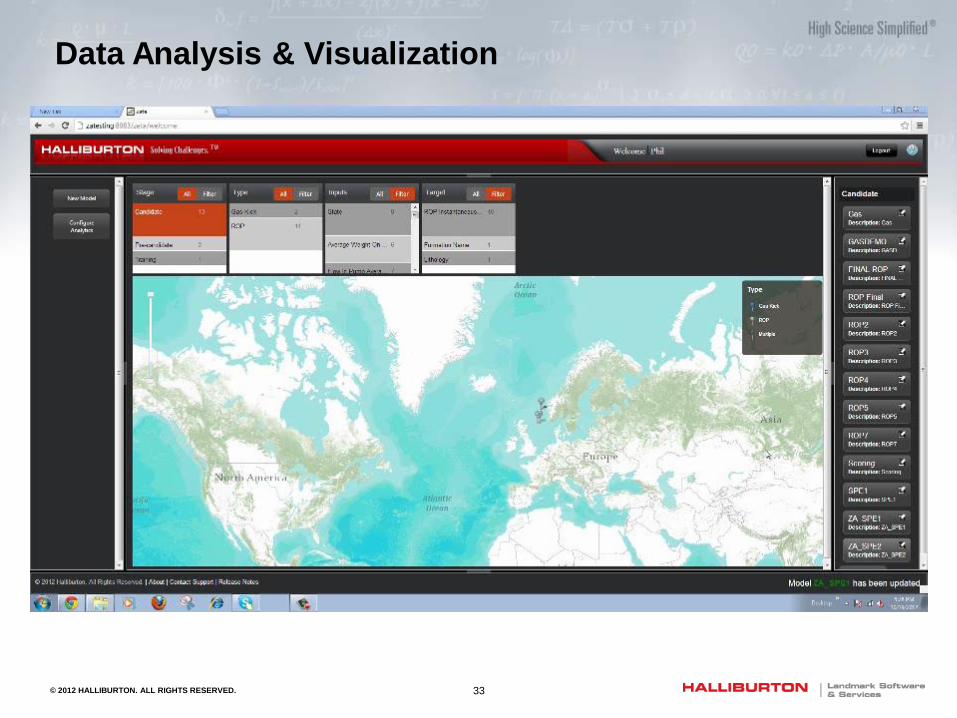
Data Analysis & Visualization
© 2012 HALLIBURTON. ALL RIGHTS RESERVED. 34
Summary
Now is the time for Analytics & Big Data in E&P
Traditional Analytical workflow and techniques will not
Succeed with our data
– Data Aggregation of disparate drilling & engineering
data sources requires complex joining
– Data Visualization needs to be built around Drilling
& Engineering data and workflows
– Data Mining needs to take into account the nature
of our data and the skills of our users
Landmark will continue to innovate in the field of Big
Data & Analytics