getting started with systematic reviews - mcmaster...
TRANSCRIPT

W. Scott Richardson, M.D.AU/UGA Medical PartnershipThree Owl Learning Institute
Getting Started with Systematic Reviews

Conflicts of Interest• I have no financial ties with industry that
pose a conflict of interest regarding the content of this presentation
• I will not be discussing “off label” uses of any medications or devices
• Image copyrights are retained by their original creators, publishers, etc.

Session Aims
• Why bother … ?• Structure & function• Critical appraisal• Forest plots• Heterogeneity• Further learning about
systematic reviews
EBCP: Here is Why• We can’t make well-informed decisions
without information• Not all information is created equal• Misinformation can be worse than no
information• Better information → better informed
decisions → better outcomes

Individual randomized trials of treatment … • Each trial is one
experiment, one new chance to get closer to the ‘truth’
• One trial ~ one race• Often, more than one
trial is done• Will all trial results
agree (even by chance)?

As trials accumulate … • Seldom is one trial
definitive (“One ring to rule them all …”)
• In science, as experiments accrue, knowledge is built cumulatively
• Is there a scientific way to combine results of individual trials?
• Yes! Systematic reviews (we’ll abbreviate “SRs”)

‘Narrative’ vs. ‘Systematic’
• Address disorder as a whole – overview
• Or, tell a ‘story’• Variety of questions• No methods section• No formal pooling• Thus, may be
cumulative but not comprehensive
• Address focused question (e.g. effect of therapy, accuracy of diagnostic test)
• Methods section• Formal pooling, when
appropriate• Thus, cumulative and
comprehensive
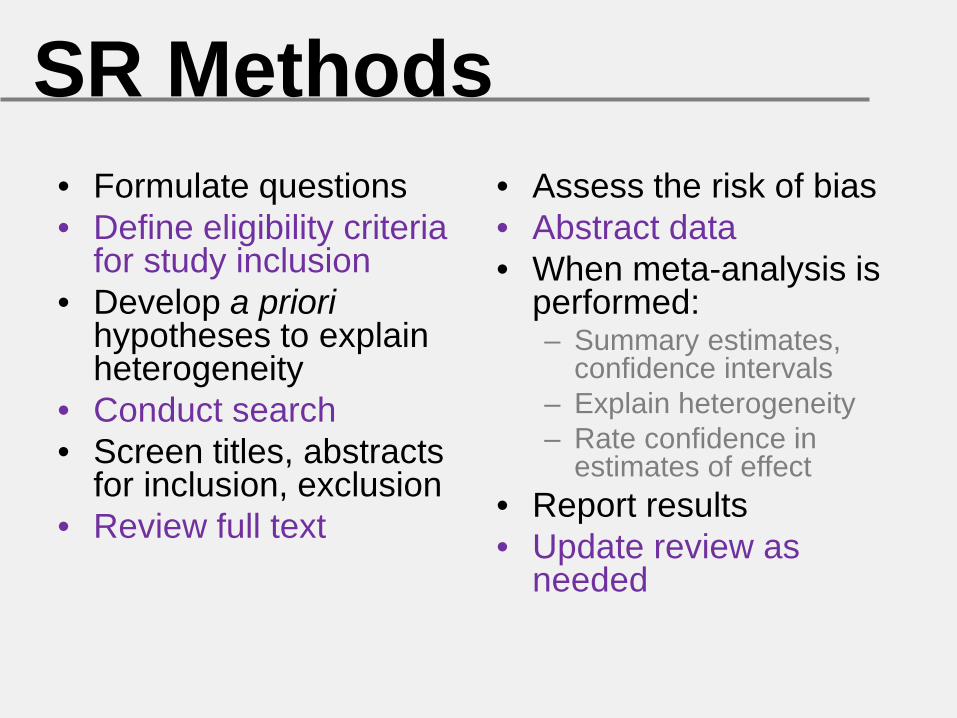
SR Methods• Formulate questions• Define eligibility criteria
for study inclusion• Develop a priori
hypotheses to explain heterogeneity
• Conduct search• Screen titles, abstracts
for inclusion, exclusion• Review full text
• Assess the risk of bias• Abstract data• When meta-analysis is
performed:– Summary estimates,
confidence intervals– Explain heterogeneity– Rate confidence in
estimates of effect• Report results• Update review as
needed
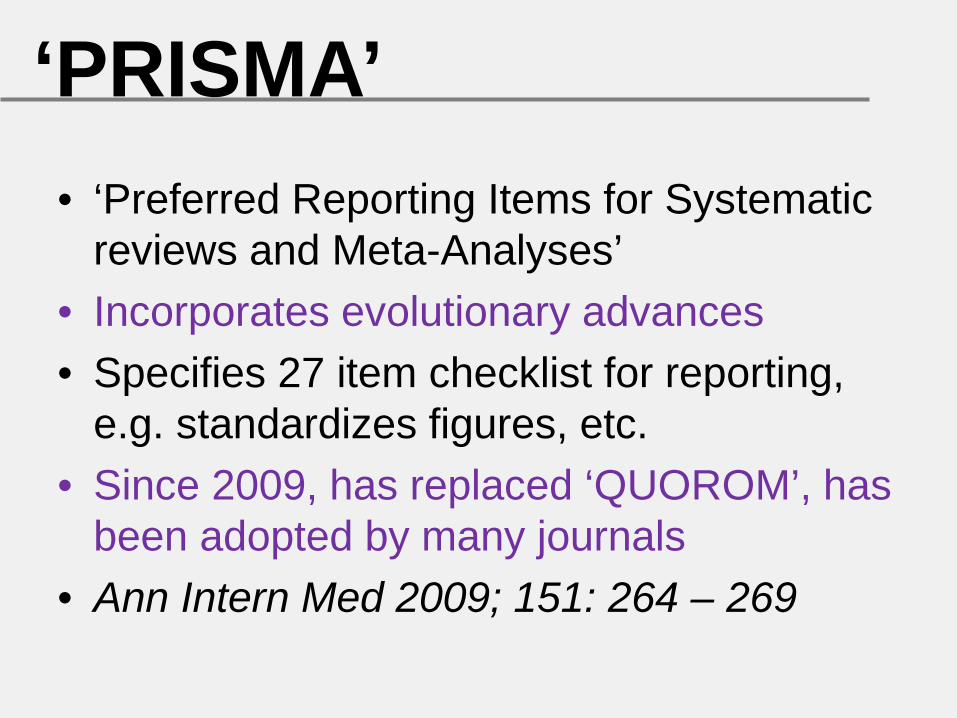
‘PRISMA’• ‘Preferred Reporting Items for Systematic
reviews and Meta-Analyses’• Incorporates evolutionary advances• Specifies 27 item checklist for reporting,
e.g. standardizes figures, etc. • Since 2009, has replaced ‘QUOROM’, has
been adopted by many journals• Ann Intern Med 2009; 151: 264 – 269

Finding SRs• Cochrane Library
– CDSR – Cochrane Database of Systematic Reviews
– DARE – Database of Abstracts of Reviews of Effects
• PubMed– Publication types– Clinical queries
• Work with your librarians

Critical Appraisal of SRsCredibility:• Sensible question?• Exhaustive search? • Selection, assessments
reproducible?• Present results ready for
application?• Address confidence in
estimates of effect?
Confidence in Estimates:• Risk of bias?• Consistent across
studies?• Effect: RR, OR, WMD • Precision: 95% CI• Apply to my patient?• Reporting bias?• Reasons to increase
confidence rating?
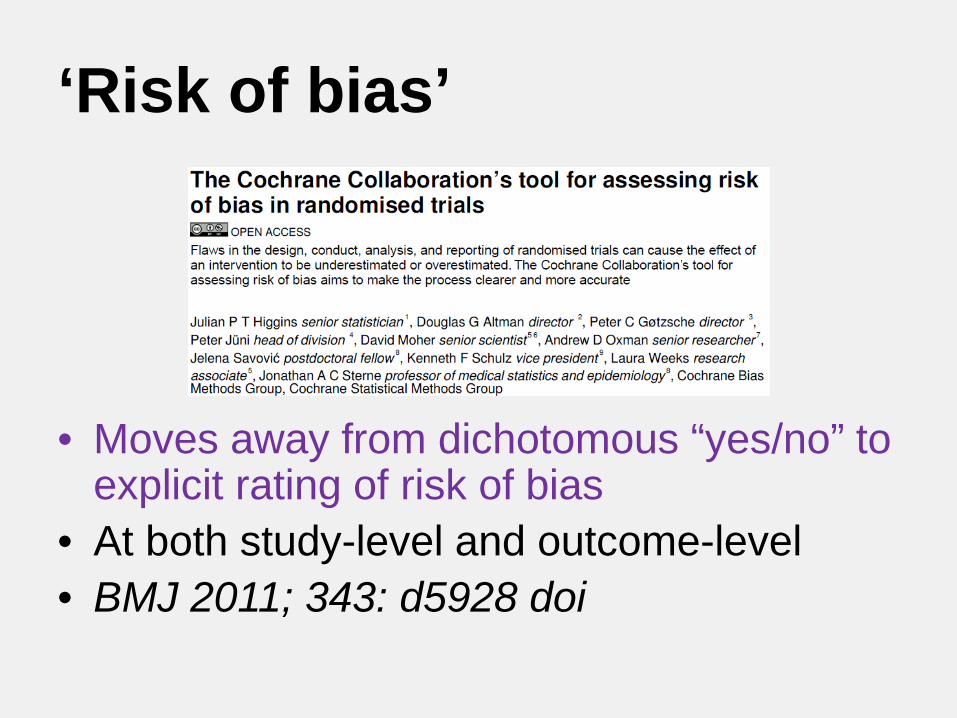
‘Risk of bias’
• Moves away from dichotomous “yes/no” to explicit rating of risk of bias
• At both study-level and outcome-level• BMJ 2011; 343: d5928 doi
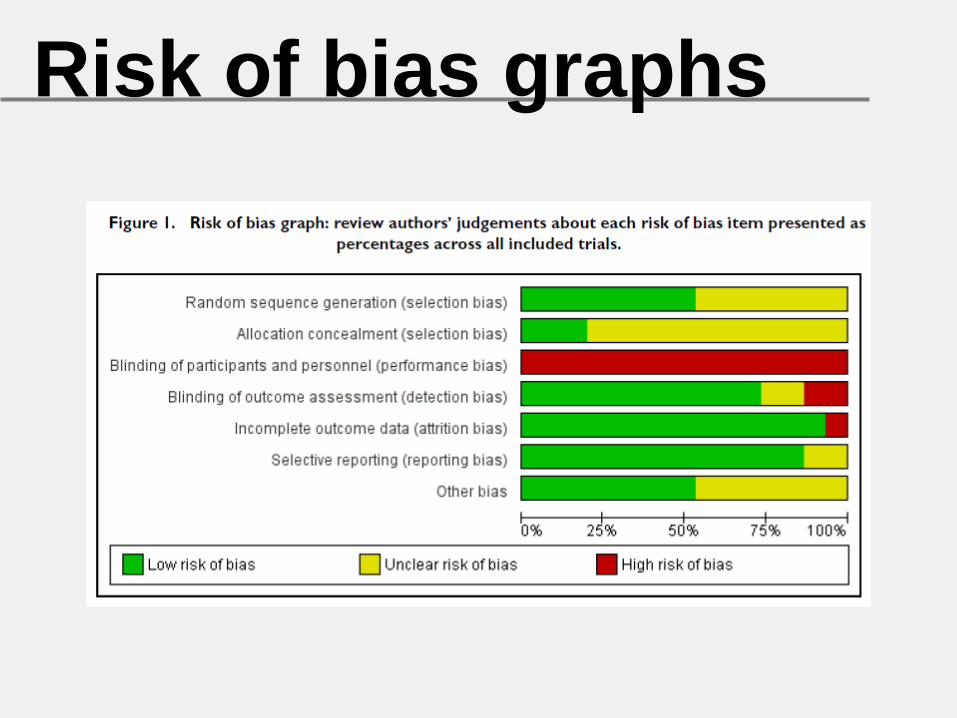
Risk of bias graphs

Reporting Biases• Selective reporting of
studies– Delayed (or never)– Location, language
• Selective reporting of outcomes, times
• Selective reporting of analyses
• UG 3/e Box 23-2
• Empirical evidence• Distort the ‘body of
evidence’ in the literature
• Can lead to wrong conclusions about the benefits and harms

Forest Plot – a

Forest plot – b

Forest plot – c

Are you happy pooling?
10.5
Relative Risk (95% CI)
0.73 (0.49, 1.07)
0.74 (0.59, 0.94)
0.76 (0.51, 1.12)
0.71 (0.56, 0.90)
0.73 (0.61, 0.88)

Are you happy pooling?
10.5
Relative Risk (95% CI)
0.44 (0.30, 0.65)
0.45 (0.36, 0.60)
1.25 (0.84, 1.84)
1.17 (0.92, 1.49)
0.73 (0.61, 0.88)

What criteria were you using?
• similarity of point estimates– less similar, less happy
• overlap of confidence intervals– less overlap, less happy
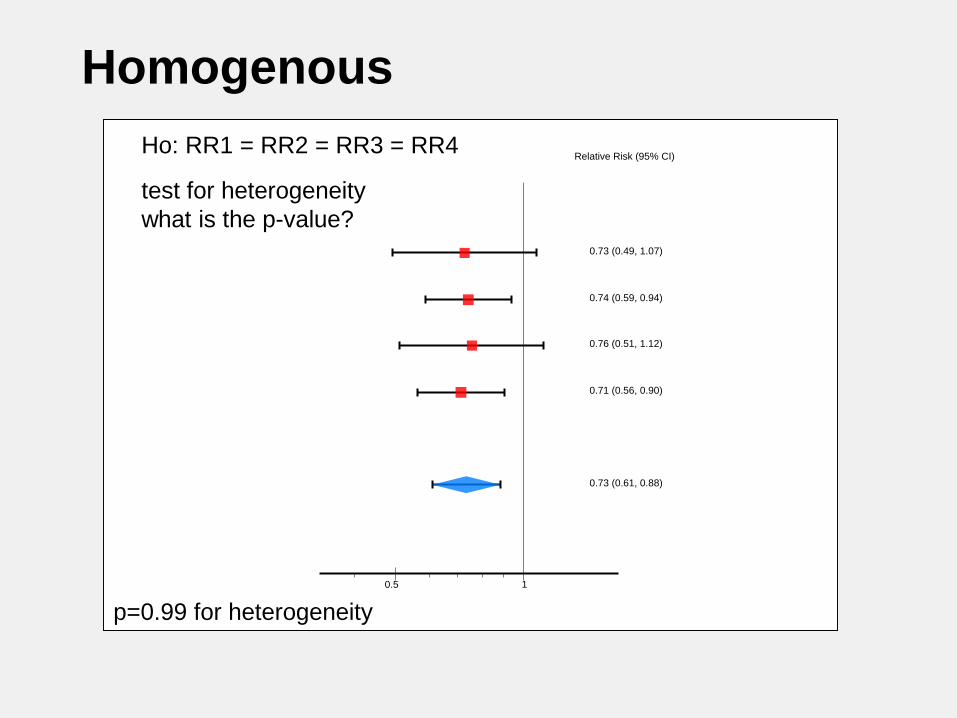
Homogenous
10.5
Relative Risk (95% CI)
0.73 (0.49, 1.07)
0.74 (0.59, 0.94)
0.76 (0.51, 1.12)
0.71 (0.56, 0.90)
0.73 (0.61, 0.88)
test for heterogeneity what is the p-value?
Ho: RR1 = RR2 = RR3 = RR4
p=0.99 for heterogeneity
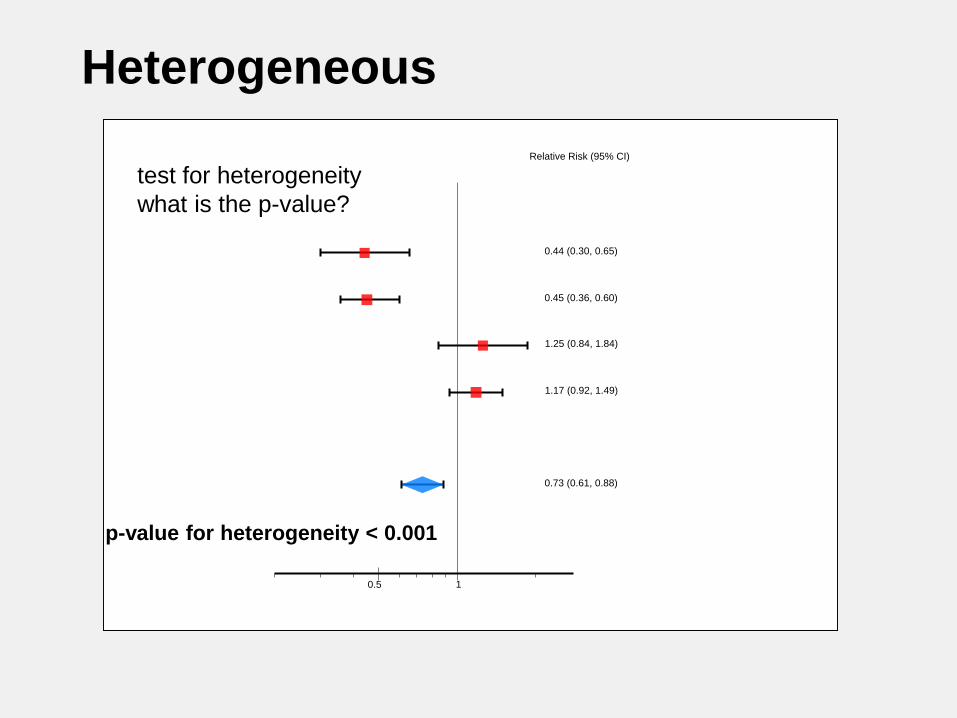
Heterogeneous
10.5
Relative Risk (95% CI)
0.44 (0.30, 0.65)
0.45 (0.36, 0.60)
1.25 (0.84, 1.84)
1.17 (0.92, 1.49)
0.73 (0.61, 0.88)
p-value for heterogeneity < 0.001
test for heterogeneity what is the p-value?

I2 Interpretation
No worries0%Only a
little concerned
Getting concerned
Very concerned
100%Why are we
pooling?

Homogenous
10.5
Relative Risk (95% CI)
0.73 (0.49, 1.07)
0.74 (0.59, 0.94)
0.76 (0.51, 1.12)
0.71 (0.56, 0.90)
0.73 (0.61, 0.88)
p=0.99 for heterogeneity
I2=0%
What is the I2 ?

Heterogeneous
10.5
Relative Risk (95% CI)
0.44 (0.30, 0.65)
0.45 (0.36, 0.60)
1.25 (0.84, 1.84)
1.17 (0.92, 1.49)
0.73 (0.61, 0.88)
p-value for heterogeneity < 0.001I2=89%
What is the I2 ?
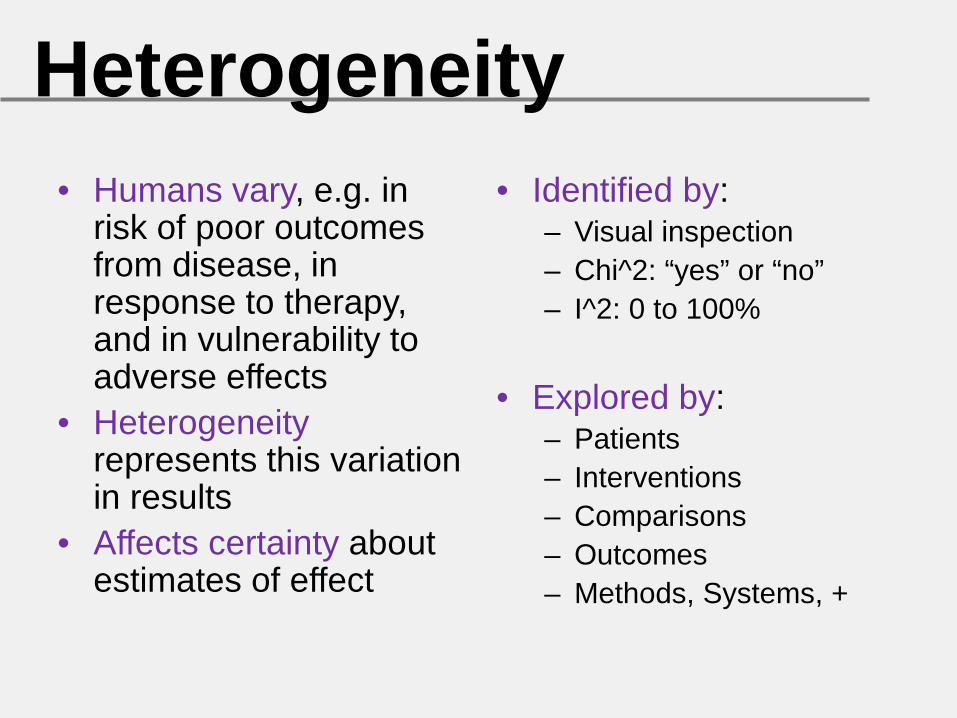
Heterogeneity• Humans vary, e.g. in
risk of poor outcomes from disease, in response to therapy, and in vulnerability to adverse effects
• Heterogeneityrepresents this variation in results
• Affects certainty about estimates of effect
• Identified by:– Visual inspection– Chi^2: “yes” or “no”– I^2: 0 to 100%
• Explored by:– Patients– Interventions– Comparisons– Outcomes– Methods, Systems, +

How quickly do systematic reviews go out of date?
• Survival analysis• 100 systematic
reviews, 1995 – 2005• Searched for ‘update
signals’ (i.e. new trial evidence)
• Ann Intern Med 2007

Learning more about SRs
Next steps• In your groups, work
through SR package• Build skills in areas:
– Finding SRs– Appraising SRs critically– Interpreting results– Applying results– Explaining to others
Further steps• Subgroup analyses• Cumulative meta-analysis• Individual patient-data
meta-analysis• Network meta-analysis• Translating SR evidence
into action

Taking SRs home …• When well-made and current, SRs
synthesize the body of research evidence that can guide important decisions
• SRs have limits, yet we should start with them: ‘how well does this work?’
• We can (and must!) appraise SRs for risk of bias, estimates of effect, and confidence in these estimates

Thank You