getting to a return on investment for transportation training
DESCRIPTION
Getting to a Return on Investment for Transportation Training. Presented by: Victoria Beale, JD, SPHR Ohio LTAP Center Director August 1, 2012 – Grapevine, Texas National LTAP Association Conference. Why an ROI for training?. - PowerPoint PPT PresentationTRANSCRIPT

Getting to a Return on Investment for Transportation Training
Presented by: Victoria Beale, JD, SPHROhio LTAP Center Director
August 1, 2012 – Grapevine, TexasNational LTAP Association Conference
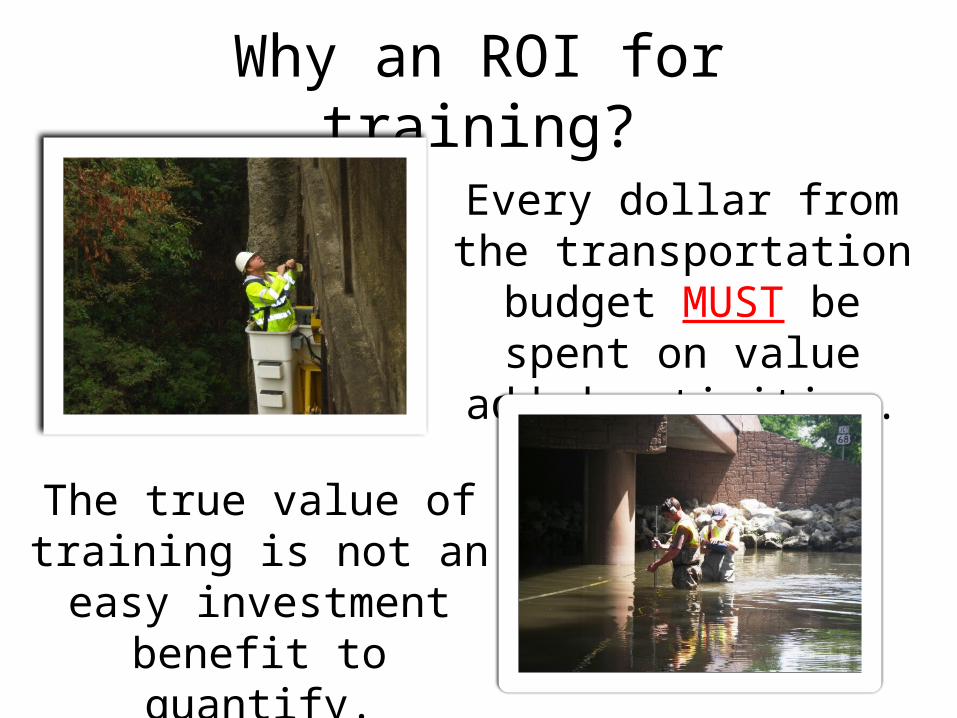
Why an ROI for training?
Every dollar from the transportation budget
MUST be spent on value added activities.
The true value of training is not an easy investment
benefit to quantify.

The Ohio PerspectiveDetermined we needed to have a systematic
method to provide quantifiable, data driven cost savings to executive leadership on the value of
our training programs.

Our Foundation - Kirkpatrick
Kirkpatrick levels
Leve
l 1 To what degree participants react favorably to the learning event. Le
vel 2 To what degree
participants acquire the intended knowledge, skills and attitudes based on their participation in the learning event.
Leve
l 3 To what degree participants apply what they learned during training when they are back on the job.
Leve
l 4 To what degree targeted outcomes occur as a result of the learning event(s) and subsequent reinforcement.
Leve
l 5 To what degree the investment in training saves the agency money in its core business functions.
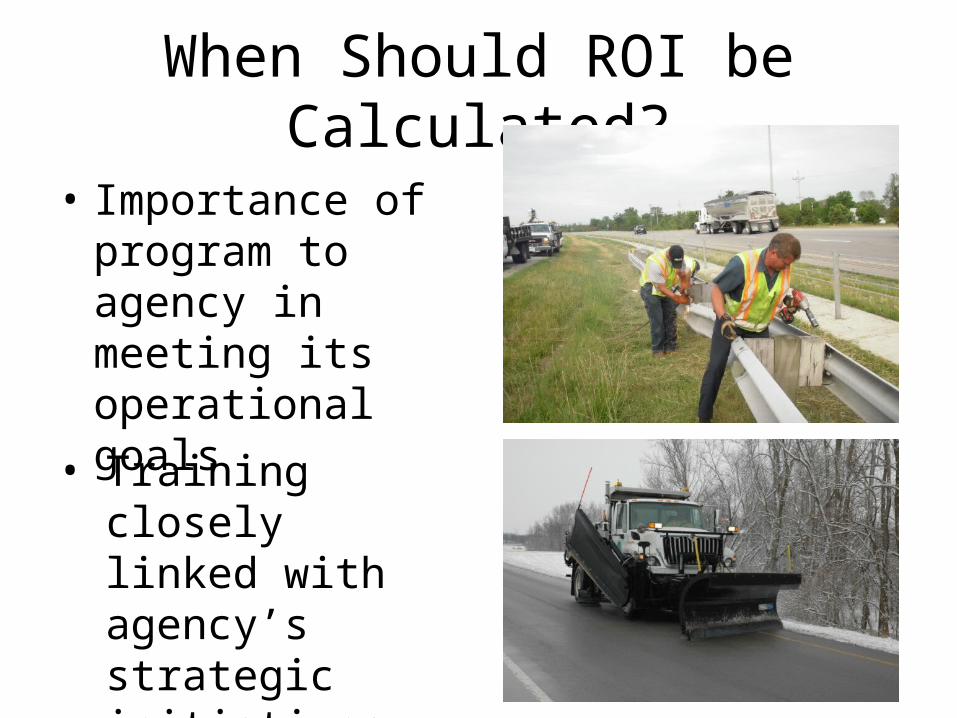
When Should ROI be Calculated?
• Importance of program to agency in meeting its operational goals
• Training closely linked with agency’s strategic initiatives

• Programs which are expensive to implement
When Should ROI be Calculated? (cont’d)
• Programs with a large target audience

The Kirkpatrick Levels Explained
ROIResults
Transfer
Learning
Reactions

Kirkpatrick – Level 1
• Often referred to as ‘smile sheet’ feedback
• Measures a participant’s immediate reaction to the training attended

Kirkpatrick – Level 1 Focus Areas
Pacing of course materials
Content objectives
Instructor knowledge and discussion facilitation/responsiveness
Perceived impact
General questioning (what was liked, what could be changed, etc.)
Kirkpatrick – Level 1 Results
Measures short-term success of the training delivered.
Kirkpatrick – Level 1
So they liked the training. Did they learn anything?

Kirkpatrick – Level 2• Knowledge
assessments conducted while training is occurring
• Measures immediate understanding and short-term retention of training information
Kirkpatrick – Level 2 Examples
Written testing
Role play/simulation
Activities and games
Kirkpatrick – Level 2 Results
Confirms to the trainer and the
training program that learning
occurred.
Kirkpatrick – Level 2
So learning occurred. Are they actually going to apply it?

Kirkpatrick – Level 3• 60 day follow-
up to both participant and manager
• Ask for specific examples of how participant is now applying the information in his/her work

Kirkpatrick – Level 3 Examples•Recommended as a low-cost method to collect data from participants around the state at 60 days or longer after the participant has completed the training to determine applicability of training information to the participants job functions.Follow Up Survey
•Recommended as a method to collect individual data throughout the state from participants on the application of training learned to their assigned work tasks. Interview•Recommended as a method to collect group data throughout the state from participants on the application of training learned to their assigned work tasks. Focus Group•Recommend the observation technique in conjunction with other work site audit procedures, such as QARs, in order to determine whether or not the training was applied.Observation
•Recommend "Individual Implementation Plans”. Each participant completes a plan for 3 – 5 specific things they will implement or undertake as a direct result of the training experience. The plan is given to each supervisor and the program manager does a follow up on selected participants as a spot check.
Work Review
Kirkpatrick – Level 3 Results
Confirms that the participant is applying what
he/she learned in the training to his/her job responsibilities within the agency.
Kirkpatrick – Level 3
So they are applying it. To what degree are the targeted outcomes from the training occurring as a result of the participants applying the information
learned?

Kirkpatrick – Level 4
Must be customized to the business process
and performance measures specific to
the topic area.

Kirkpatrick – Level 4 Examples
Borrowed MetricsSurvey
Focus Groups
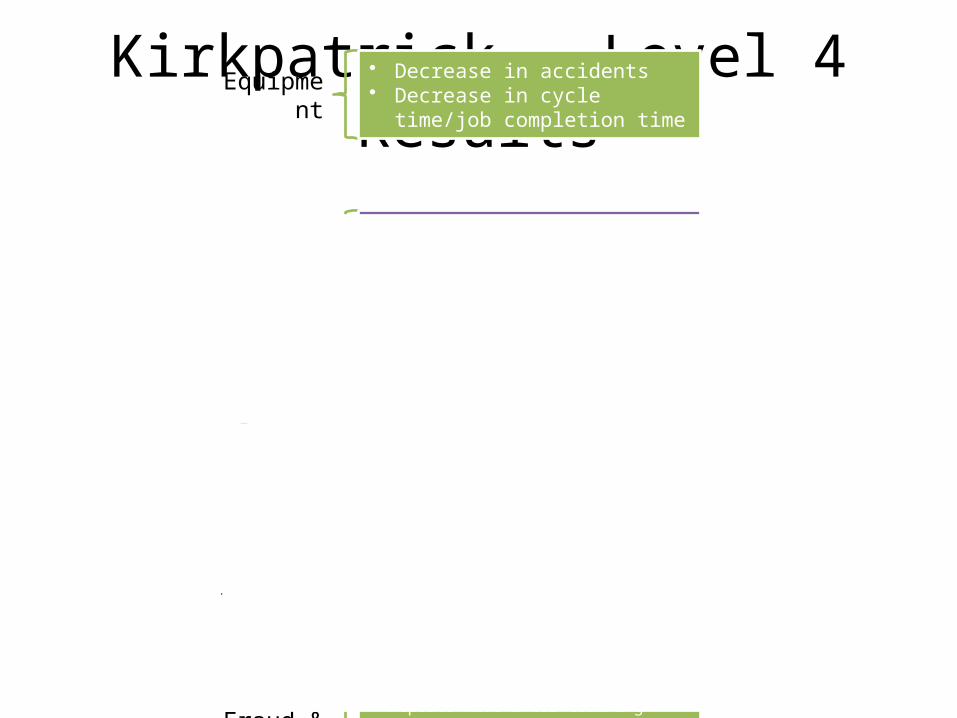
Kirkpatrick – Level 4 ResultsEquipment• Decrease in accidents• Decrease in cycle time/job
completion time
Highway Workers
• Liability avoidance after vs. before training received• Work zone safety incidents before vs. after• Reduction in number/cost of change orders due to
increased flexible work force
Safety• Decrease in injuries, lost time
and severity of accidents
New Manager Training
• Errors made in payroll process, purchasing, etc. for those trained vs. those not trained
Fraud & Ethics
• Reports made after training began vs. before and funds saved from possible continued violations

Level 4 Examples
Timekeeper Training to Reduce Errors

Level 4 – Example 1
Sep-10 Oct-10 Nov-100
2
4
6
8
10
12
14
16
Time Keeper Errors
Group A - Experimental GroupGroup B - Control Group
Num
ber o
f Err
ors
Used a Control Group and an Experimental Group
Great Statistical Method to Obtain Measureable
Improvements from Training

Level 4 – Example 1 (cont’d)
Cost to correct errors before training Cost to correct errors after training $-
$1,000,000.00
$2,000,000.00
$3,000,000.00
$4,000,000.00
$5,000,000.00
$6,000,000.00
$5,563,777.44
$855,965.76
Cost Savings on Payroll Errors Attributed to Training
Annual Cost

Level 4 Examples (cont’d)
Mechanics Training

Level 4 – Example 2
2008 2009 2010 2011 2012 2013 2014 2015 2016 $-
$10,000.00
$20,000.00
$30,000.00
$40,000.00
$50,000.00
$60,000.00
$70,000.00
$80,000.00
$90,000.00
$100,000.00
Trend Analysis for Trucks Repair/Transit Costs
Repair/Transit Costs
Estimated Repair/Transit Costs
Year
Repa
ir Co
sts
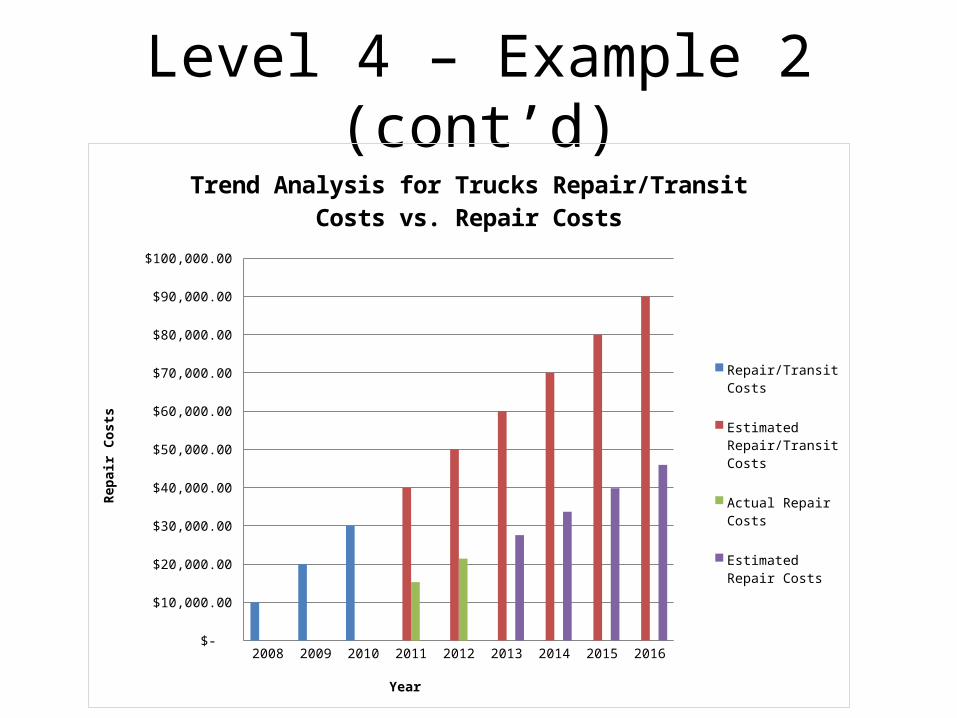
Level 4 – Example 2 (cont’d)
2008 2009 2010 2011 2012 2013 2014 2015 2016 $-
$10,000.00
$20,000.00
$30,000.00
$40,000.00
$50,000.00
$60,000.00
$70,000.00
$80,000.00
$90,000.00
$100,000.00
Trend Analysis for Trucks Repair/Transit Costs vs. Repair Costs
Repair/Transit Costs
Estimated Repair/Transit Costs
Actual Repair Costs
Estimated Repair Costs
Year
Repa
ir Co
sts

Level 4 Examples (cont’d)
Supervisor Training on Handling Staff Issues
Any supervisor worth his salt would rather deal with people who attempt too much than with those who
try too little. - Lee Iacocca
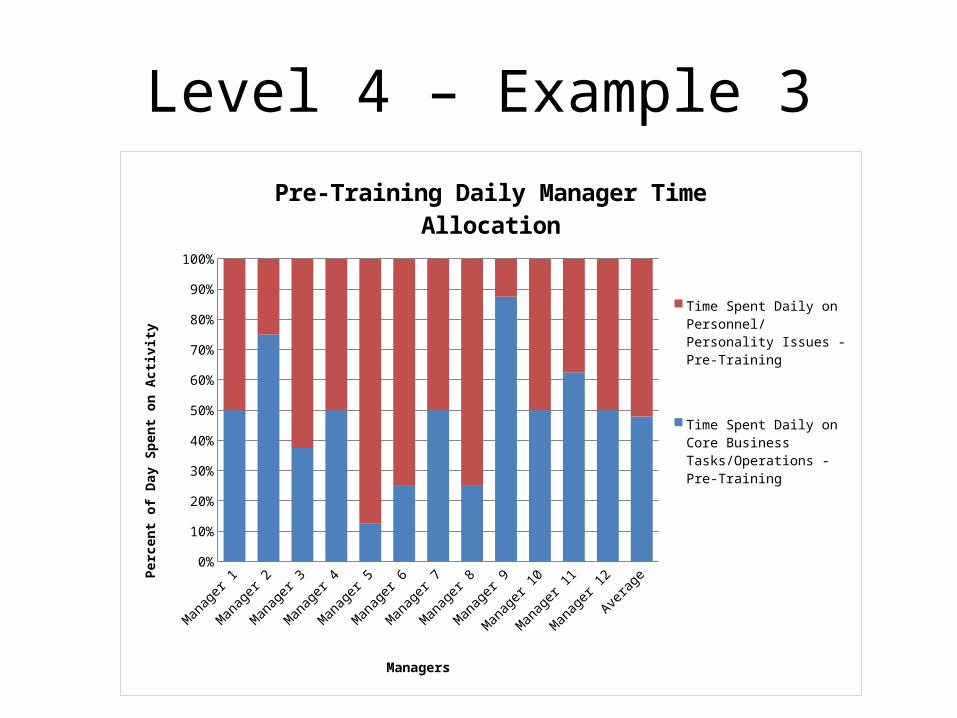
Level 4 – Example 3
Manag
er 1
Manag
er 2
Manag
er 3
Manag
er 4
Manag
er 5
Manag
er 6
Manag
er 7
Manag
er 8
Manag
er 9
Manag
er 10
Manag
er 11
Manag
er 12
Averag
e0%
10%
20%
30%
40%
50%
60%
70%
80%
90%
100%
Pre-Training Daily Manager Time Allocation
Time Spent Daily on Person-nel/Personality Issues - Pre-Training
Time Spent Daily on Core Business Tasks/Operations - Pre-Training
Managers
Perc
ent o
f Day
Spe
nt o
n Ac
tivity

Level 4 – Example 3 (cont’d)
Manag
er 1
Manag
er 2
Manag
er 3
Manag
er 4
Manag
er 5
Manag
er 6
Manag
er 7
Manag
er 8
Manag
er 9
Manag
er 10
Manag
er 11
Manag
er 12
Averag
e0%
10%
20%
30%
40%
50%
60%
70%
80%
90%
100%
Post Training Daily Manager Time Allocation
Time Spent Daily on Personnel/Personality Issues - Post-Training
Time Spent Daily on Core Business Tasks/Operations - Post-Training
Managers
Perc
ent o
f Day
Spe
nt o
n Ac
tivity
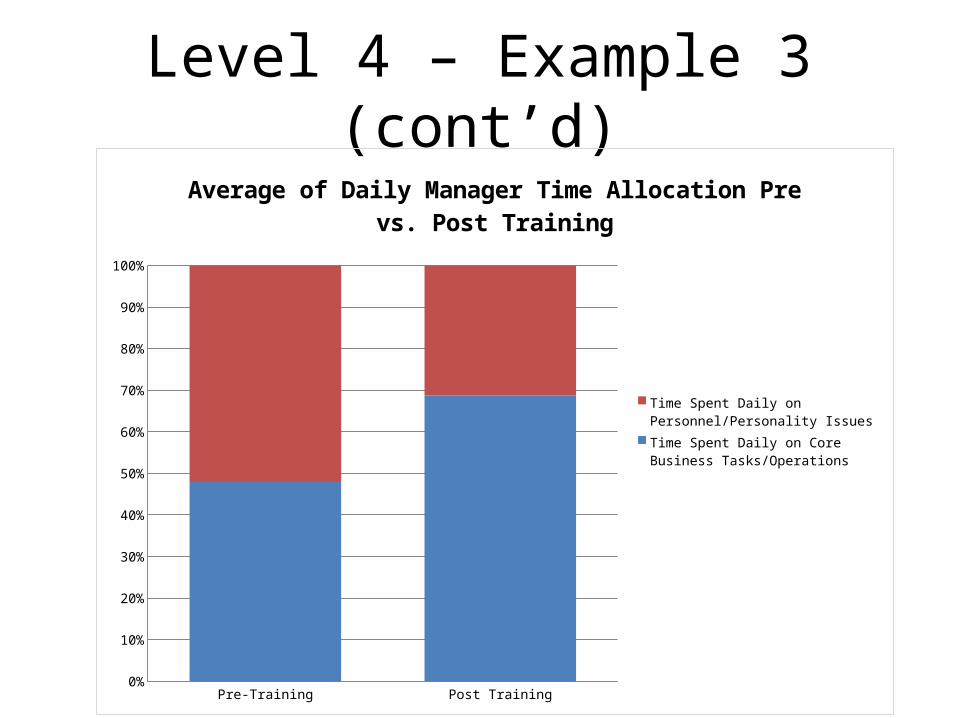
Level 4 – Example 3 (cont’d)
Pre-Training Post Training0%
10%
20%
30%
40%
50%
60%
70%
80%
90%
100%
Average of Daily Manager Time Allocation Pre vs. Post Training
Time Spent Daily on Personnel/Personality Issues Time Spent Daily on Core Business Tasks/Operations
Kirkpatrick – Level 4
So the training was customized to and impacted business process and performance measures.
The training saved the agency money. Was the savings more than the cost of the training?
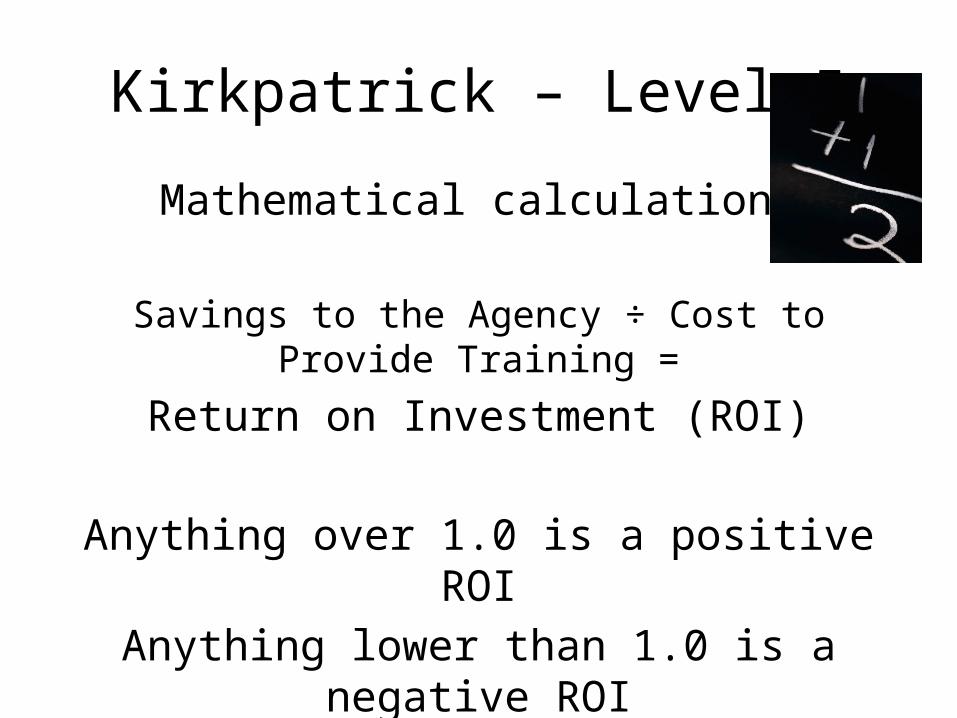
Kirkpatrick – Level 5
Mathematical calculation:
Savings to the Agency ÷ Cost to Provide Training =
Return on Investment (ROI)
Anything over 1.0 is a positive ROIAnything lower than 1.0 is a negative ROI
Level 4 Examples with ROI Applied
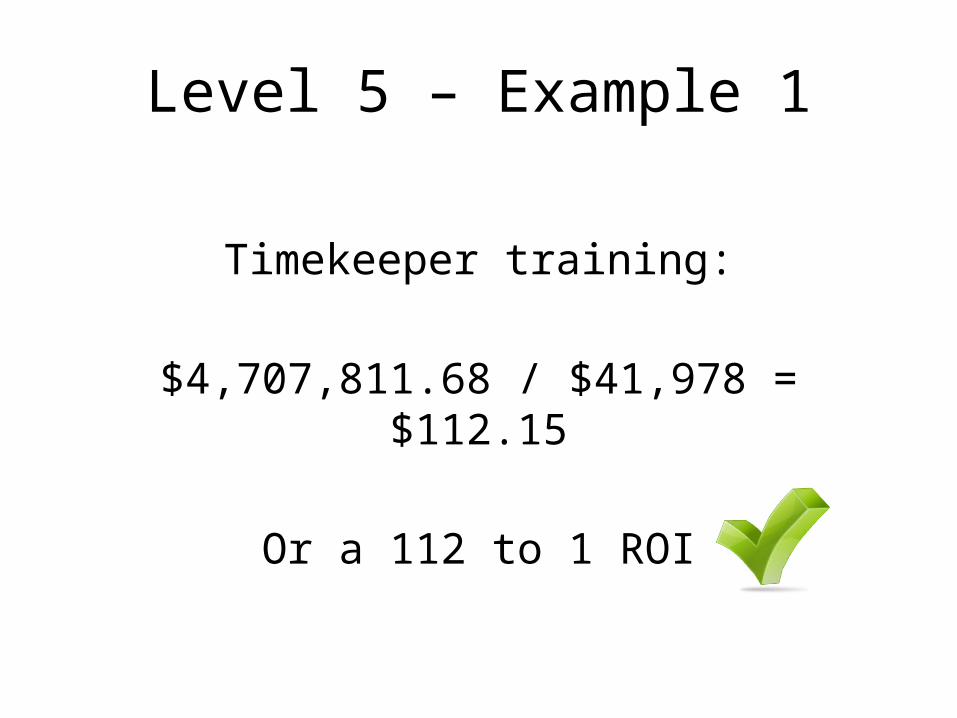
Level 5 – Example 1
Timekeeper training:
$4,707,811.68 / $41,978 = $112.15
Or a 112 to 1 ROI

Level 5 – Example 2
Mechanics Training:
$3,026,276 / $117,553 = $25.74
Or a 26 to 1 ROI
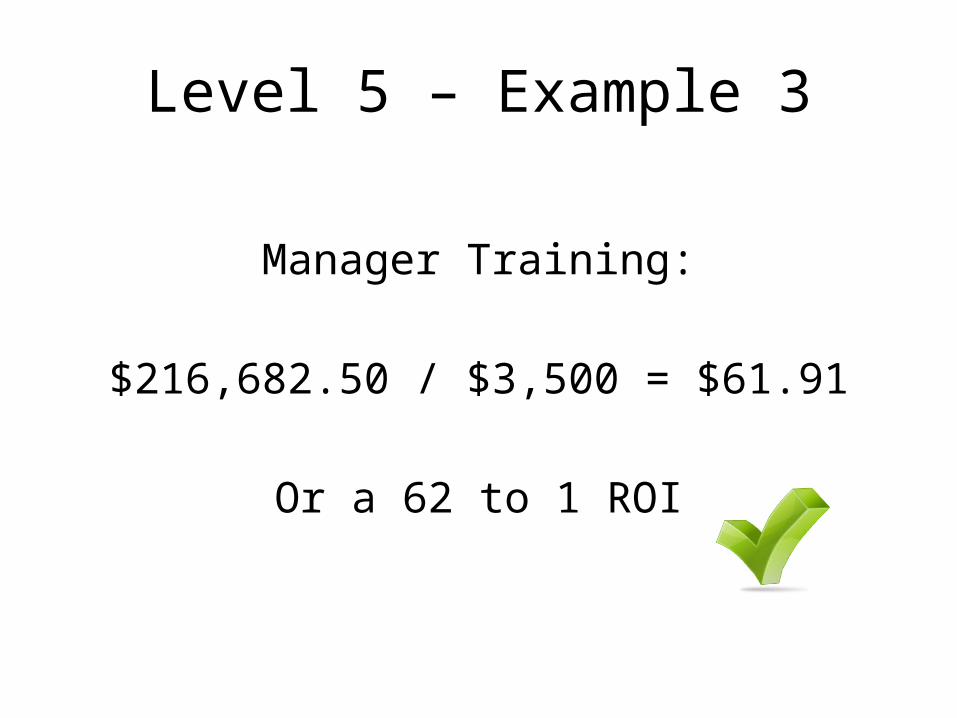
Level 5 – Example 3
Manager Training:
$216,682.50 / $3,500 = $61.91
Or a 62 to 1 ROI
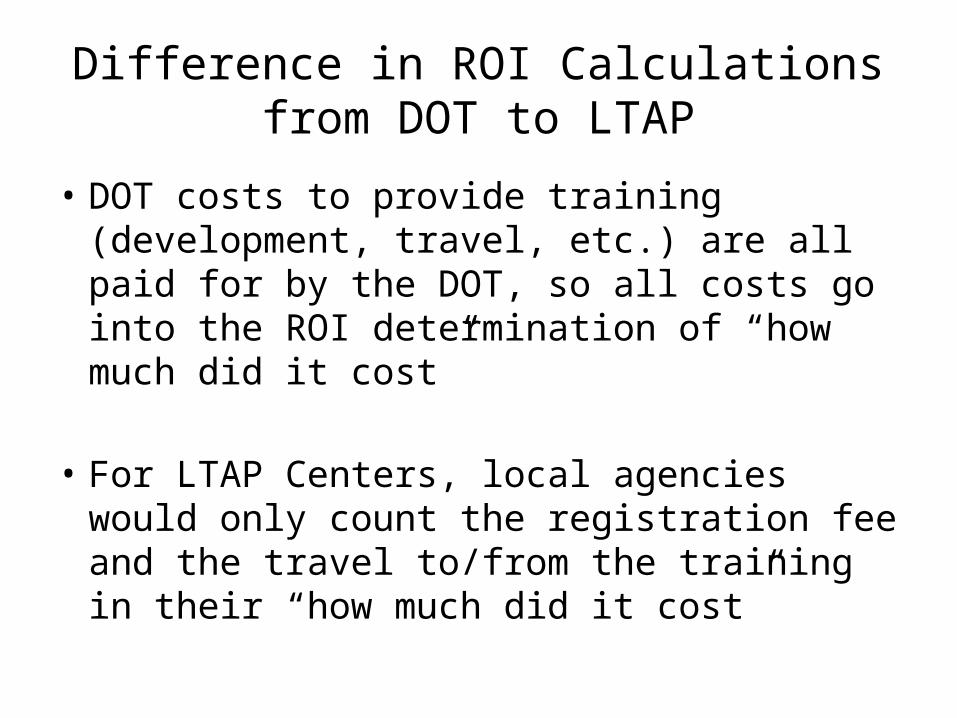
Difference in ROI Calculations from DOT to LTAP
• DOT costs to provide training (development, travel, etc.) are all paid for by the DOT, so all costs go into the ROI determination of “how much did it cost”
• For LTAP Centers, local agencies would only count the registration fee and the travel to/from the training in their “how much did it cost”

So how can we apply ROI calculations to our LTAP Training?
Need to collect the pieces of the puzzle:
Pay Range for Participant
Amount of Time
Participants Spends on This Type of Work
Before and After
Knowledge Assessment

Before and After Assessment
Each increase in knowledge / skill level from before to after is calculated at 10% for formula purposes.

Time Spent on Type of Work
“During the next 12 months, I anticipate that approximately _______ percent of my total work
time/effort will relate to the topics/items discussed in this training session.”
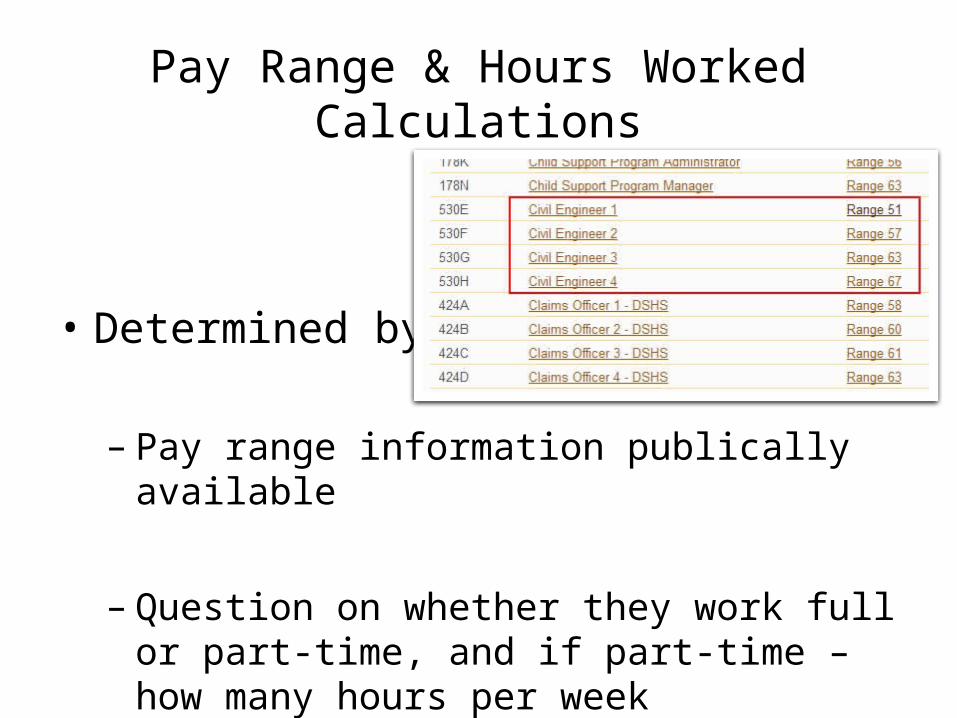
Pay Range & Hours Worked Calculations
• Determined by:
– Pay range information publically available
– Question on whether they work full or part-time, and if part-time – how many hours per week
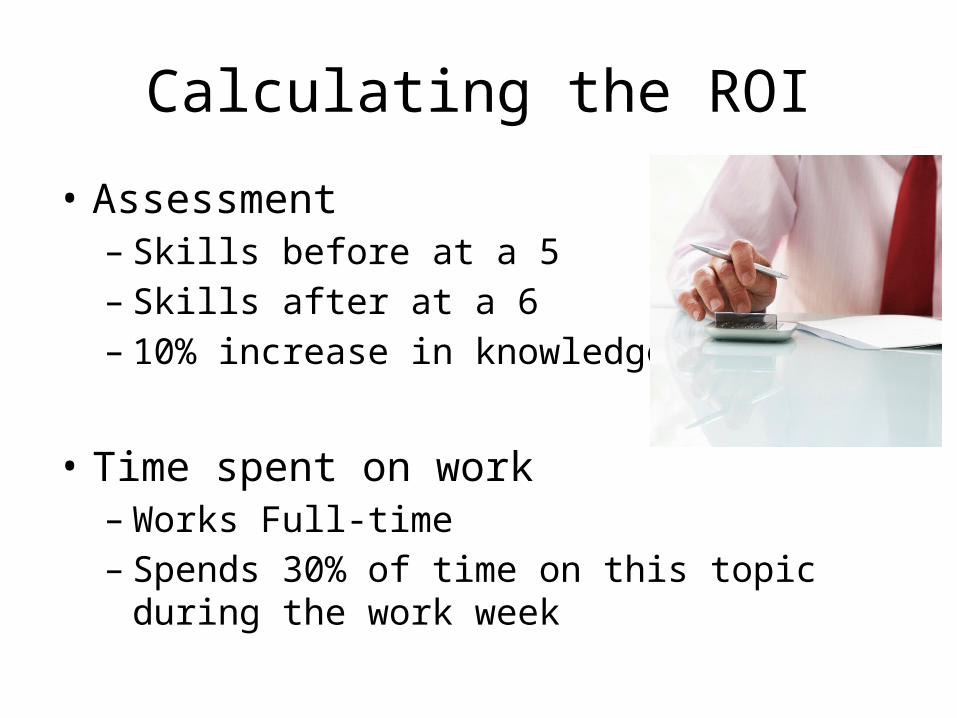
Calculating the ROI
• Assessment– Skills before at a 5– Skills after at a 6– 10% increase in knowledge base
• Time spent on work– Works Full-time – Spends 30% of time on this topic during the work
week

Calculating the ROI (cont’d)
• Hourly rate– $11.00 per hour average for this pay range– Include 33% fringe and benefits
• Calculation:– 10% less time of the 30% spent on the topic
• 12 hours (30% of work week) x 10% less time = 1.2 hours of efficiency per week
– $11 + $3.63 = $14.63 fully loaded payroll cost• 1.2 hours x $14.63 = $17.56 payroll dollars saved in one
week

Calculating the ROI (cont’d)
• $17.56 x 52 weeks = $913.12 saved per year
• Cost of training - $105 (impact costs)– $50 attendance fee– Cost of Vehicle to and from the training $55.00
(100 miles roundtrip at .55 per mile)
• $913.12 / $105 = 8.7 Return on Investment
Where are we now?
• Need to have the ROI methodology (formula) validated.

The BIG Questions
They can tell us they improved their skills and are applying them (and their supervisors can confirm they are applying them), but how do we know that the application of the skills is REALLY saving the agency money? How do we measure the reduction in time to complete the work that we have hypothesized equals 10% time savings for each point of knowledge improvement?
Use DOT Data to Verify
• Training in a lot of cases is on same subjects – just a different focus for the locals
• Use the DOT time tracking data – the famous Ohio 502s and our TMS system
• Every hour of every day is coded to a work type in TMS

Using DOT Data to Verify (cont’d)
• All training has also been tracked, with extensive training that has occurred for the last ten years
• Proving/Disproving of methodology will then allow us to know whether or not it can be applied to the LTAP training data to reach ROI for the locals
RFP Issued for Research
• Issued twice – one proposal rejected first time, no proposals the second time
• Options –– Hire intern(s) to crunch the data– Look to Research’s task order consultant to
perform the analysis to prove/disprove methodology
ROI Methodology Must Be Established
Data driven information MUST be the foundation for proving the worth of our
programs

Questions