getting to eden - fishingfuture.org · the gods-+ eden an ideal future empty nets ... getting to...
TRANSCRIPT
1
GETT ING TO EDENBuilding an ideal future for the global fish food system through collective action

2
GETT ING TO EDENBuilding an ideal future for the global fish food system through collective action
CONTENTS Page
0 BACKGROUND 1
1 F ISH SUPPLY IN 2030: 4
BUSINESS-AS-USUAL SCENARIOS
2 F ISH REQUIREMENTS IN 2030:
A QUANT ITAT IVE P ICTURE OF GLOBAL F ISH NEEDS 6
2.1 Approaches for estimating future fish requirements 8
2.2 Projections 9
2.3 Results comparison 10
3 BR IDG ING THE GAP:
PATHWAYS TO MEET ING GLOBAL NEEDS 12
3.1 Waste reduction potential 14
3.2 Wild catch increase potential 16
3.3 Aquaculture growth potential 18
4 THE NEED FOR COLLECT IVE ACT ION 22
4.1 Options for consideration 25
5 KEY UNCERTA INT IES 30
6 SUMMARY AND CONCLUSION 31
7 REFERENCES 32
8 APPENDICES 34
8.1 Appendix 1. Estimating fish requirements 35
8.2 Appendix 2. Estimating waste 38

1
BACKGROUND
Fishing for a Future is an initiative that brings stakeholders together to discuss problems facing the global fish food system. Its purpose is to support collective creation of time-bound solutions.
During the initiative’s first global workshop, which was held in October 2013 at the Rockefeller Foundation Bellagio Center, 14 high-level representatives from the private sector, nongovernmental organizations (NGOs) and philanthropic organizations defined five potential future scenarios for the fish food system. The scenarios were framed around two key dimensions of uncertainty: “climate change and environmental impacts” and “economic growth and openness of markets.” Participants agreed that “Eden,” one of the five possible futures, was both desirable and potentially achievable.
ECONOMIC GROWT H A ND OPENNESS OF MA RKETS
ECONOMIC GROWT H A ND OPENNESS OF MA RKETS + -
+
CLI
MA
TE
CH
AN
GE
AN
DEN
VIR
ON
MEN
TAL
IMPA
CTS
CLI
MA
TE
CH
AN
GE
AN
DEN
VIR
ON
MEN
TAL
IMPA
CTS
-
EDEN
+
LOST OPPORTUNITY
-
HOT WATER
-
EMPTY NETS
-
+
F ISH FORTHE GODS
-
+
EDEN
An Ideal Future
EMPT Y NET S
The Decline of Fisheries and Rise of Aquaculture
F ISH FOR T HE GODS
The Decline of Aquaculture and Rise of Fisheries for the Wealthy
LOST OPPORT UNIT Y
A Failure to Grow Aquaculture and Fisheries for All
HOT WAT ERFailure of the Fish Food System
AquacultureWild capture

2
GET T ING TO EDEN / BACKGROUND
EDEN WAS BROADLY CHARACTERIZED AS FOLLOWS:
> Global fish production has in-creased to meet the needs of a growing and wealthier population.
> Wild-catch production has grown moderately, with global stocks be-ing managed sustainably.
> Aquaculture production has grown markedly, but not at the expense of the environment.
> Wealth created through increased fish production, distribution and retailing has been distributed equi-tably.
AT THE WORKSHOP, THE KEY CONCLUSION WAS THAT TO REACH THE PREFERRED STATE OR “EDEN” FOR THE WORLD’S F ISH FOOD SYSTEM, WE NEED TO TAKE THE FOLLOWING STEPS:
This document has been prepared in response to the recommendations of the Bellagio workshop. It summarizes our efforts to meet these four objectives. The main purpose of the document is to foster debate and alignment among stakeholders on quantitative goals for the fish food system and to identify and stimulate the collective action needed to achieve these goals.
Build a quantitative picture of our preferred future state, Eden
1
Identify the approaches we need for reaching Eden
2
Quantify the contribution that each approach can make to Eden
3
Identify how we can work together to get to Eden
4

3

1
F ISH SUPPLY IN 2030: BUSINESS-AS-USUAL SCENARIOS
5
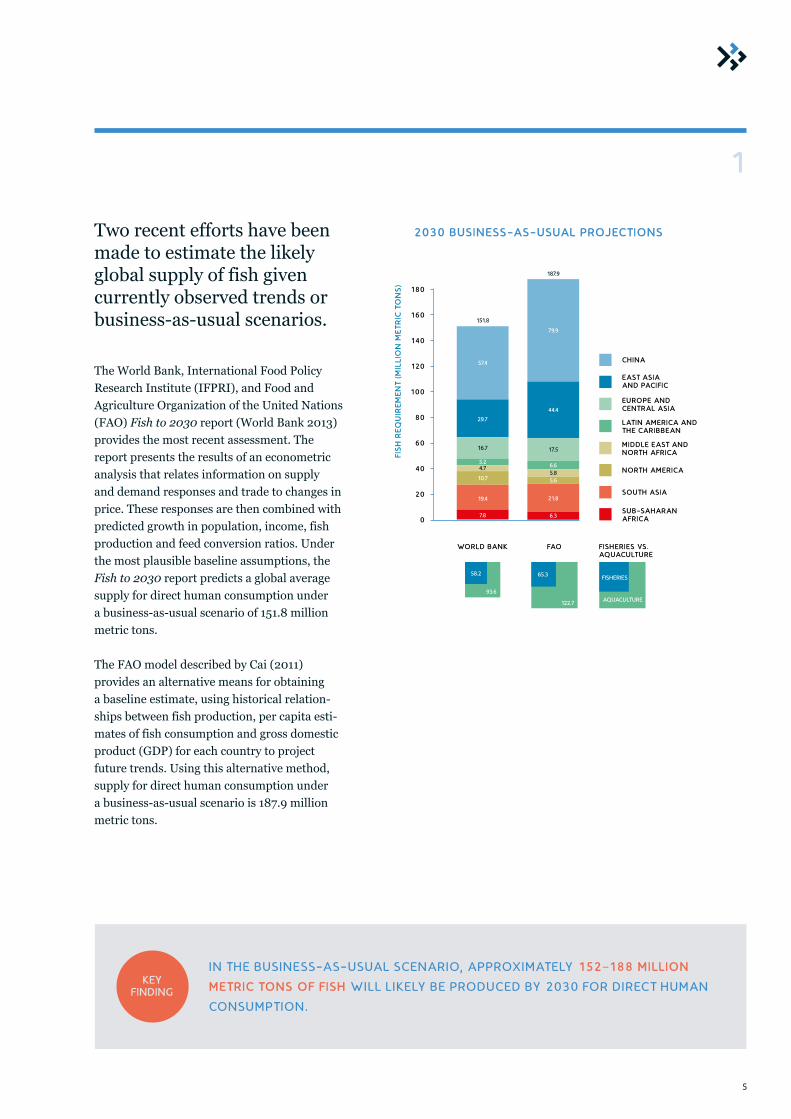
Two recent efforts have been made to estimate the likely global supply of fish given currently observed trends or business-as-usual scenarios.
The World Bank, International Food Policy Research Institute (IFPRI), and Food and Agriculture Organization of the United Nations (FAO) Fish to 2030 report (World Bank 2013) provides the most recent assessment. The report presents the results of an econometric analysis that relates information on supply and demand responses and trade to changes in price. These responses are then combined with predicted growth in population, income, fish production and feed conversion ratios. Under the most plausible baseline assumptions, the Fish to 2030 report predicts a global average supply for direct human consumption under a business-as-usual scenario of 151.8 million metric tons.
The FAO model described by Cai (2011) provides an alternative means for obtaining a baseline estimate, using historical relation-ships between fish production, per capita esti-mates of fish consumption and gross domestic product (GDP) for each country to project future trends. Using this alternative method, supply for direct human consumption under a business-as-usual scenario is 187.9 million metric tons.
WORLD BANK FAO F ISHERIES VS. AQUACULTURE
2030 BUSINESS-AS-USUAL PROJECT IONS
180
160
140
120
100
80
60
40
20
0
CHINA
EAST ASIA AND PAC IF IC
EUROPE AND CENTRAL ASIA LAT IN AMERICA AND THE CARIBBEAN
MIDDLE EAST AND NORTH AFRICA
NORTH AMERICA
SOUTH ASIA
SUB-SAHARAN AFRICA
FISHERIES
AQUACULTURE
79.9
187.9
44.4
17.5
6.65.85.6
21.8
6.37.8
19.4
10.7
4.75.2
16.7
29.7
57.4
151.8
58.2
93.6
65.3
122.7
1
KEY F INDING
IN T HE BUSINESS-AS-USUAL SCENARIO, APPROXIMAT ELY 152–188 MILL ION
METRIC TONS OF F ISH WILL L IKELY BE PRODUCED BY 2030 FOR DIRECT HUMAN
CONSUMPT ION.
FIS
H R
EQU
IRE
ME
NT
(MIL
LIO
N M
ETR
IC T
ON
S)

F ISH REQUIREMENTS IN 2030: A QUANT ITAT IVE PICTURE OF GLOBAL F ISH NEEDS
2
7
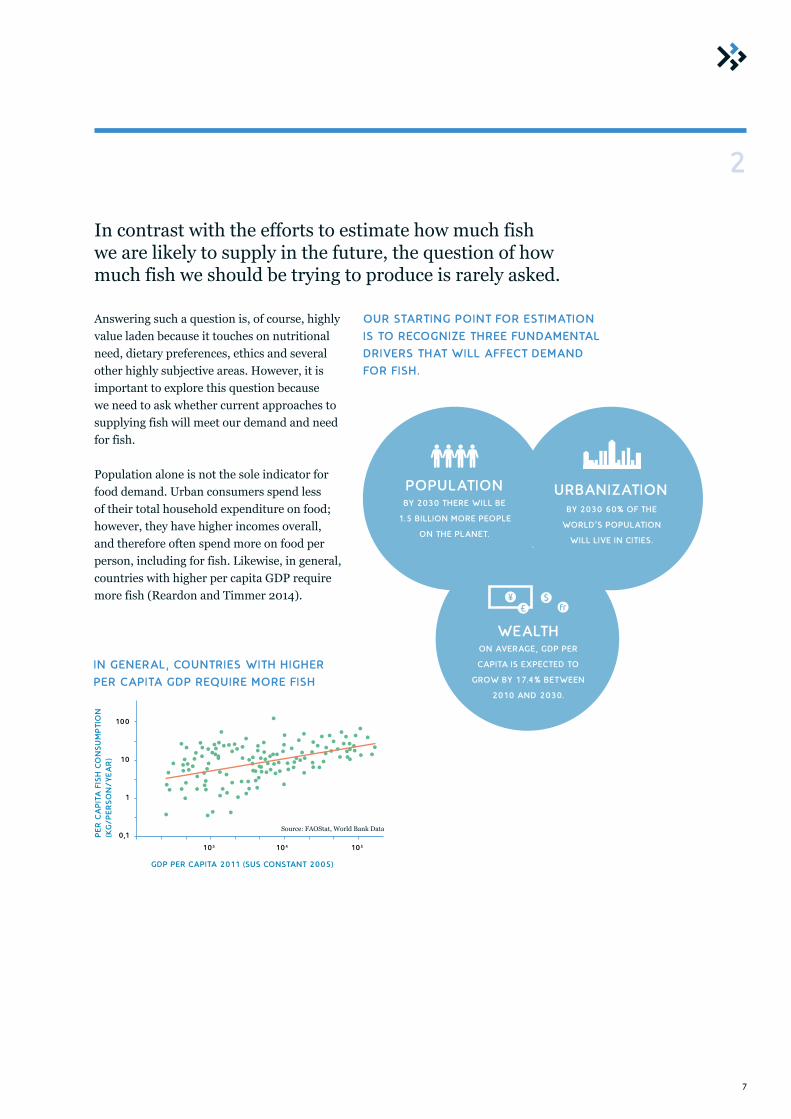
ON AVERAGE, GDP PER
CAPITA IS EXPECTED TO
GROW BY 17.4% BETWEEN
2010 AND 2030.
WEALTH
BY 2030 60% OF THE
WORLD’S POPULAT ION
WILL L IVE IN C IT IES.
URBANIZAT IONBY 2030 THERE WILL BE
1.5 BILL ION MORE PEOPLE
ON THE PLANET.
POPULAT ION
Answering such a question is, of course, highly value laden because it touches on nutritional need, dietary preferences, ethics and several other highly subjective areas. However, it is important to explore this question because we need to ask whether current approaches to supplying fish will meet our demand and need for fish.
Population alone is not the sole indicator for food demand. Urban consumers spend less of their total household expenditure on food; however, they have higher incomes overall, and therefore often spend more on food per person, including for fish. Likewise, in general, countries with higher per capita GDP require more fish (Reardon and Timmer 2014).
IN GENERAL, COUNTRIES WITH H IGHER
PER CAPITA GDP REQUIRE MORE F ISH
103 104 105
Source: FAOStat, World Bank Data
GDP PER CAPITA 2011 (SUS CONSTANT 2005)
100
10
1
0,1PE
R C
AP
ITA
FIS
H C
ON
SU
MP
TIO
N
(KG
/PE
RS
ON
/Y
EA
R)
In contrast with the efforts to estimate how much fish we are likely to supply in the future, the question of how much fish we should be trying to produce is rarely asked.
2
OUR START ING POINT FOR EST IMAT ION
IS TO RECOGNIZE THREE FUNDAMENTAL
DRIVERS THAT WILL AFFECT DEMAND
FOR F ISH.
8
GET T ING TO EDEN / F ISH REQUIREMENT S IN 2030 : A QUA NT ITAT IVE P ICT URE OF GLOBA L F ISH NEEDS
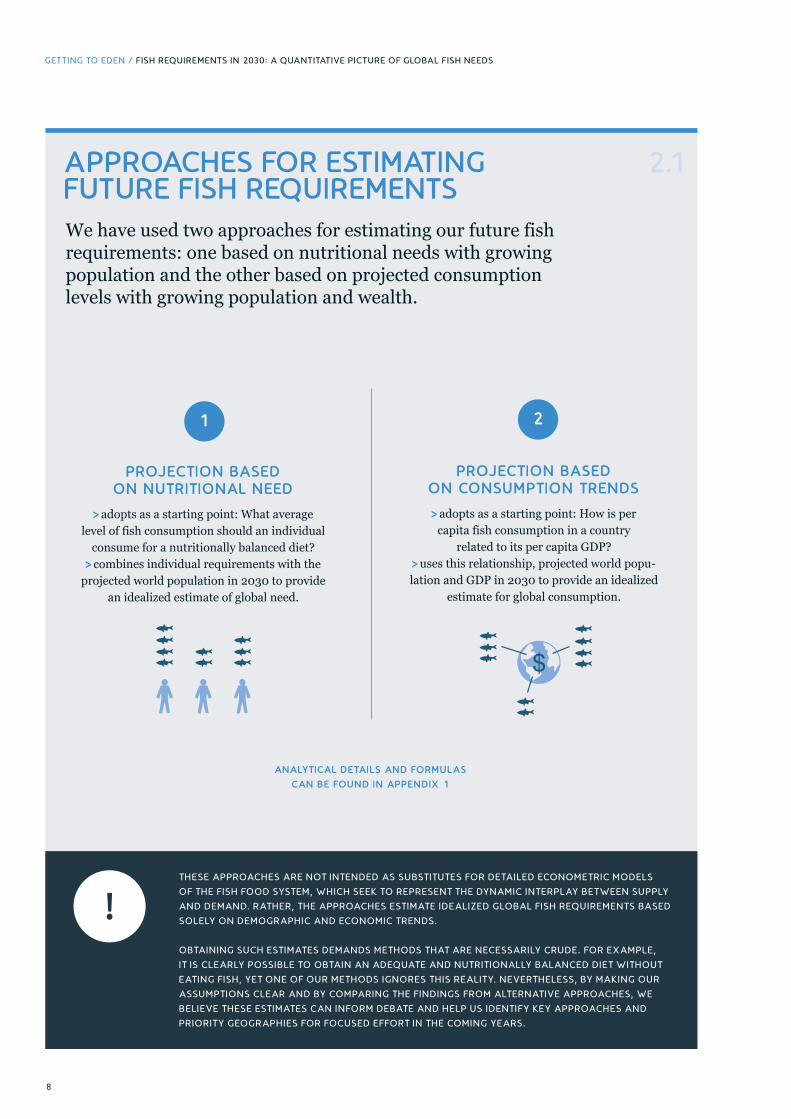
APPROACHES FOR EST IMAT ING FUTURE F ISH REQUIREMENTS We have used two approaches for estimating our future fish requirements: one based on nutritional needs with growing population and the other based on projected consumption levels with growing population and wealth.
T HESE A PPROACHES A RE NOT INT ENDED AS SUBST IT UT ES FOR DETA ILED ECONOMET RIC MODELS
OF T HE F ISH FOOD SYST EM, WHICH SEEK TO REPRESENT T HE DYNA MIC INT ERPLAY BET WEEN SUPPLY
A ND DEMA ND. RAT HER, T HE A PPROACHES EST IMAT E IDEAL IZED GLOBAL F ISH REQUIREMENT S BASED
SOLELY ON DEMOGRA PHIC A ND ECONOMIC T RENDS.
OBTA IN ING SUCH EST IMAT ES DEMA NDS MET HODS T HAT A RE NECESSA RILY CRUDE . FOR EXA MPLE,
IT IS CLEA RLY POSSIBLE TO OBTA IN A N ADEQUAT E A ND NUT R IT IONALLY BALA NCED D IET WIT HOUT
EAT ING F ISH, YET ONE OF OUR MET HODS IGNORES T H IS REAL IT Y. NEVERT HELESS, BY MA K ING OUR
ASSUMPT IONS CLEA R A ND BY COMPA RING T HE F INDINGS F ROM ALT ERNAT IVE A PPROACHES, WE
BEL IEVE T HESE EST IMAT ES CA N INFORM DEBAT E A ND HELP US IDENT I F Y KEY A PPROACHES A ND
PR IORIT Y GEOGRA PHIES FOR FOCUSED EF FORT IN T HE COMING YEA RS.
PROJECT ION BASED ON CONSUMPT ION TRENDS
> adopts as a starting point: How is per capita fish consumption in a country
related to its per capita GDP? > uses this relationship, projected world popu-lation and GDP in 2030 to provide an idealized
estimate for global consumption.
PROJECT ION BASED ON NUTRIT IONAL NEED
> adopts as a starting point: What average level of fish consumption should an individual
consume for a nutritionally balanced diet? > combines individual requirements with the
projected world population in 2030 to provide an idealized estimate of global need.
ANALYT ICAL DETA ILS AND FORMULAS
CAN BE FOUND IN APPENDIX 1
1 2
2.1

9
For these countries, we maintained consumption at their current levels, while bringing others up to the baseline. This resulted in an overall requirement of 228.4 million metric tons in 2030. Estimates based on consumption trends indicate an overall requirement of 238.5 million metric tons. Although the two methods predict similar overall requirements, how this demand is distrib-uted among countries and regions differs markedly. This is especially true for China, where the projected consumption method, which incorporates the effects of increased wealth, predicts a re-quirement of more than 100 million metric tons, compared to 49 million based on idealized need.
PROJECT IONS
In terms of estimates of nutritional need, some countries already consume more than our chosen average consumption assumption of an ideal diet in which 20% of protein is from fish.
F ISH REQUIREMENT (M ILL ION METRIC TONS)
CHINA
EAST ASIA AND PAC IF IC
EUROPE AND CENTRAL ASIA
LAT IN AMERICA AND THE CARIBBEAN
MIDDLE EAST AND NORTH AFRICA
NORTH AMERICA
SOUTH ASIA
SUB-SAHARAN AFRICA
WORLD TOTAL
0 10 20 30 40 50 60 70 80 90 100
2.2
KEY F INDING
OVERALL EST IMAT ES OF F ISH REQUIREMENT S FOR DIRECT HUMAN CONSUMPT ION
F ROM T HE T WO APPROACHES ARE BET WEEN 228 AND 238 MILL ION METRIC
TONS, BUT WIT H MARKED DIF F ERENCES IN T HE PREDICT ED GEOGRAPHIC
DIST RIBUT ION OF DEMAND, ESPECIALLY FOR CHINA .
NUTRIONAL NEED PROJECTED CONSUMPT ION
10
125
100
75
50
25
0
250
225
200
175
150
CHINA EAST ASIA &
PAC IF IC
WORLD
125
100
75
50
25
0
250
225
200
175
150
CHINA EAST ASIA &
PAC IF IC
WORLD
125
100
75
50
25
0
250
225
200
175
150
CHINA EAST ASIA &
PAC IF IC
WORLD
125
100
75
50
25
0
250
225
200
175
150
CHINA EAST ASIA &
PAC IF IC
WORLD
FAO EST IMATES OF PERCENTAGE GROWTH
IN DEMAND BETWEEN 2015 AND 2030.
RESULTS COMPARISON
125
100
75
50
25
0
250
225
200
175
150
CHINA
7.6
4.9
7.1
7.5
EAST ASIA &
PAC IF IC
EUROPE &
CENTRAL ASIA
LAC
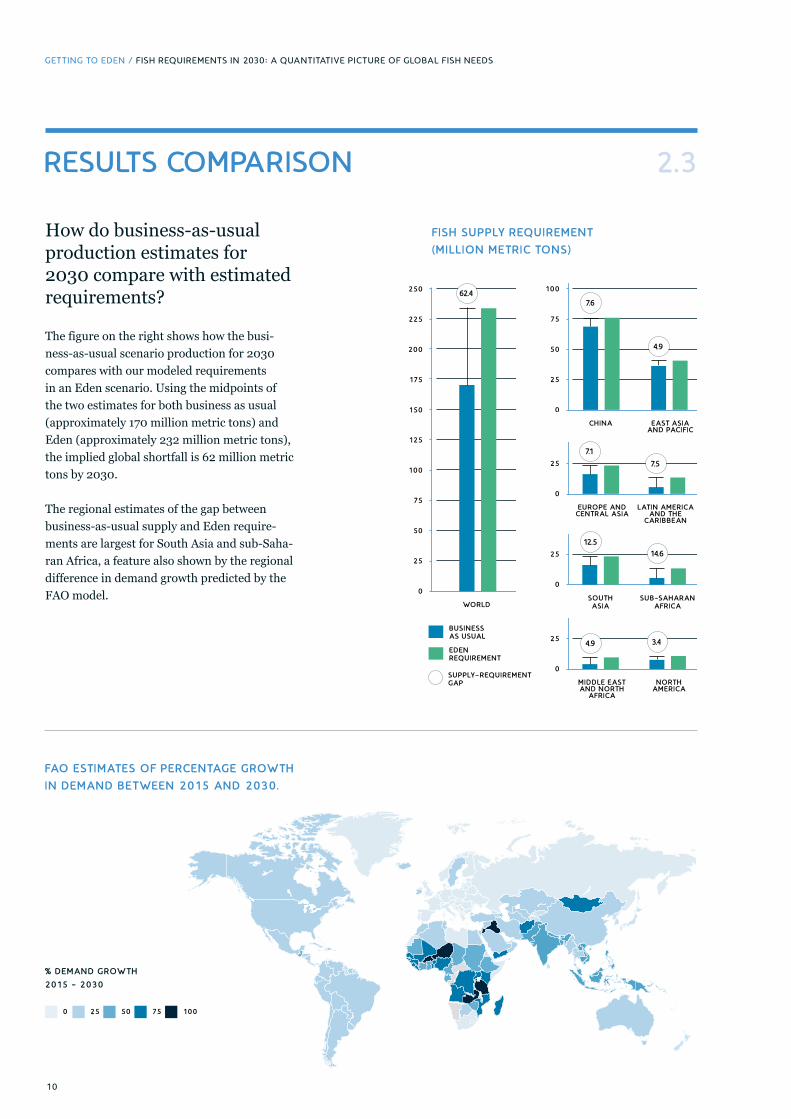
F ISH SUPPLY REQUIREMENT
(M ILL ION METRIC TONS)
How do business-as-usual production estimates for 2030 compare with estimated requirements?
The figure on the right shows how the busi-ness-as-usual scenario production for 2030 compares with our modeled requirements in an Eden scenario. Using the midpoints of the two estimates for both business as usual (approximately 170 million metric tons) and Eden (approximately 232 million metric tons), the implied global shortfall is 62 million metric tons by 2030. The regional estimates of the gap between business-as-usual supply and Eden require-ments are largest for South Asia and sub-Saha-ran Africa, a feature also shown by the regional difference in demand growth predicted by the FAO model.
2.3
EAST ASIA AND PAC IF IC
CHINA
LAT IN AMERICA AND THE
CARIBBEAN
EUROPE AND CENTRAL ASIA
SOUTH ASIA
SUB-SAHARAN AFRICA
MIDDLE EAST AND NORTH
AFRICA
NORTH AMERICA
WORLD
7.6
7.1
12.5
4.9
14.6
7.5
4.9
3.4
% DEMAND GROWTH
2015 - 2030
75500 25 100
GET T ING TO EDEN / F ISH REQUIREMENT S IN 2030 : A QUA NT ITAT IVE P ICT URE OF GLOBA L F ISH NEEDS
62.4
BUSINESS AS USUAL
EDEN REQUIREMENT
SUPPLY–REQUIREMENT GAP
11
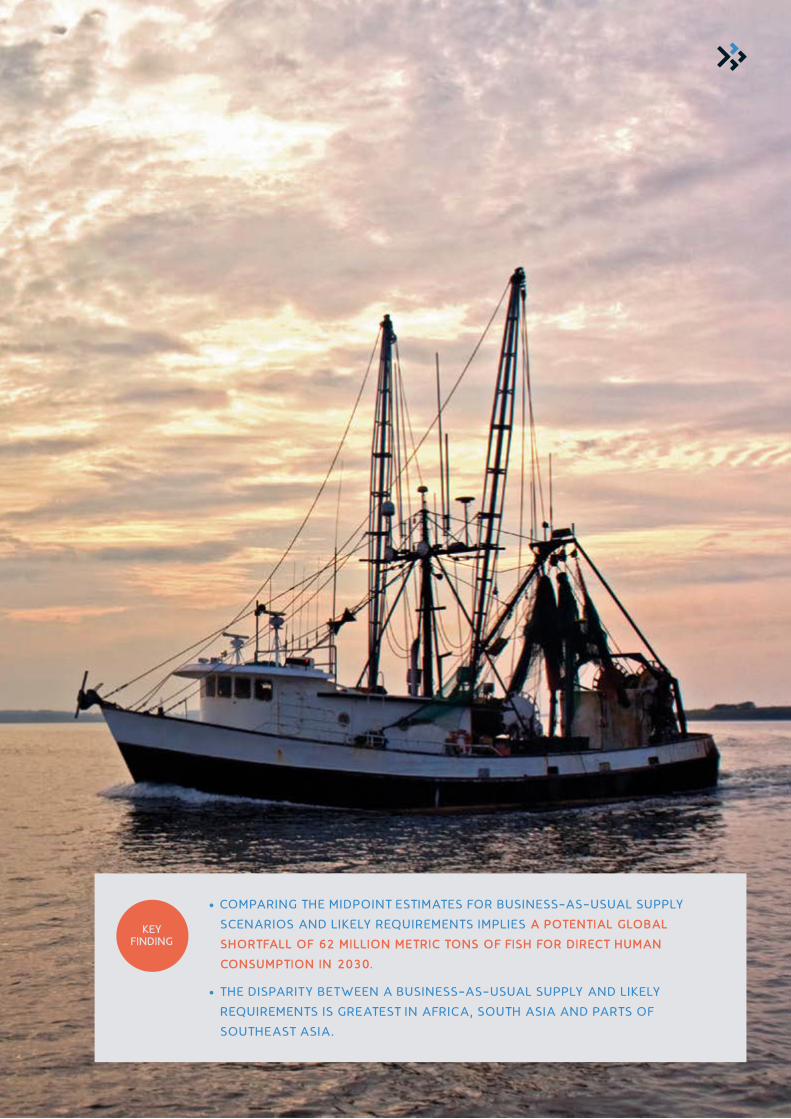
KEY F INDING
COMPARING T HE M IDPOINT EST IMAT ES FOR BUSINESS-AS-USUAL SUPPLY
SCENARIOS AND L IKELY REQUIREMENT S IMPL IES A POTENT IAL GLOBAL
SHORTFALL OF 62 MILL ION METRIC TONS OF F ISH FOR DIRECT HUMAN
CONSUMPT ION IN 2030.
T HE DISPARIT Y BET WEEN A BUSINESS-AS-USUAL SUPPLY AND L IKELY
REQUIREMENT S IS GREAT EST IN AF RICA, SOUT H ASIA AND PART S OF
SOUT HEAST ASIA .
12
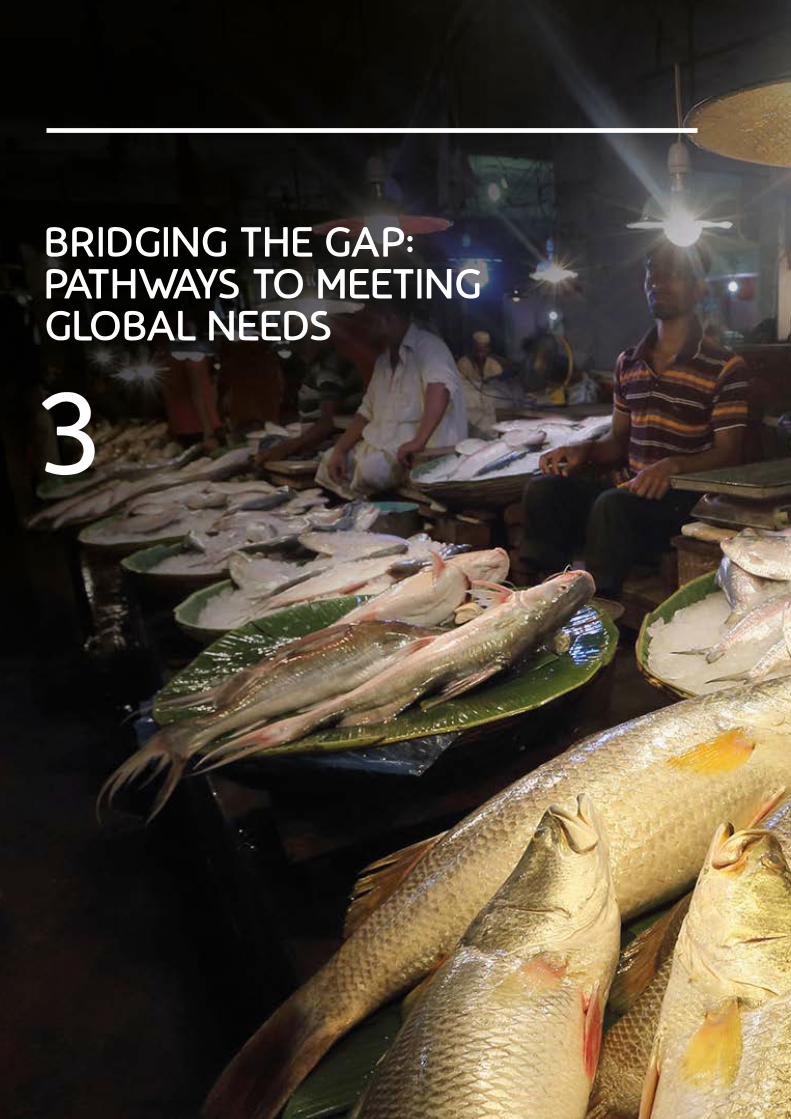
BRIDGING THE GAP: PATHWAYS TO MEET ING GLOBAL NEEDS
3

13
ENHANCING F ISHERIES > How much could we increase wild catch?
SUSTAINING AQUACULTURE
> How big is the gap aqua- culture will need to fill?
REDUCING WASTE
> How much could we reduce waste?
WORLD F ISH REQUIREMENT/SUPPLY (M ILL ION METRIC TONS)
BUSINESS AS USUAL
SUPPLY REQUIREMENT GAP
0 25 50 75 100 125 150 175 200 225 250
62.4
EDEN REQUIREMENT
There are three basic approaches for shifting the global fish food system into a higher production trajectory: 1. Reduce waste across the fish food system. 2. Increase wild catch by fishing stocks at optimum levels. 3. Increase aquaculture production.
3
HOW MUCH CAN EACH OF THESE SOURCES CONTRIBUTE AND WHERE?

14
The FAO estimates that roughly one-third of food produced for human consumption is lost or wasted globally – about 1.3 billion metric tons per year (FAO 2011). Participants at Bellagio identified reducing waste in the fish food system as a key opportunity.
Unfortunately, however, there is no global dataset from which waste reduction potentials across geographies and supply chain stages can easily be estimated. For example, a recent study for Asia-Pacific Economic Cooperation (APEC) economies, which account for 70% of global fish production, concluded that “The overall picture that emerges is of a highly fragmented and variable dataset, from which relatively limited inferences can be drawn.” Nathan Associates (2015) This finding is in line with other studies, emphasizing the inadequacy of our knowledge about losses within the global fish food system. As a crude estimate of potential for loss reduction, we adopted a simple modeling approach that combined regional estimates from the FAO of loss at each stage in the fish supply chains with 2012 data on fish production. (See Appendix 2 for a sum-mary of the approach)
3.1WASTE REDUCT ION POTENT IAL
GET T ING TO EDEN / BR IDGING T HE GA P: PAT HWAYS TO MEET ING GLOBA L NEEDS
CONSUMPT ION
DISTRIBUT ION
PROCESSING
PRODUCT ION
POSTHARVEST HANDLING AND STORAGE
LOSS STAGE
TOTAL FOOD LOSS
0 91 2 3 4 5 6 7 8
EAST ASIA AND PAC IF ICEXCLUDING CHINA
EUROPE AND CENTRAL ASIA
LAT IN AMERICA AND THE CARIBBEAN
MIDDLE EAST AND NORTH AFRICA
NORTH AMERICA
SOUTH ASIA
SUB-SAHARAN AFRICA
CHINA
0 182 204 226 248 2610 28 3212 3014 16 34 36
GLOBAL TOTAL
1.3
1.8
0.3 0.7 1.4 1.6
2.10.6
0.4
0.4
0.4
0.4
0.50.30.30.3
0.3
1.7
1.2
0.8 0.50.6
6.3 4.1 3.8 7.812.6
1.4 1.1 3.5
0.7 0.9 3.3 2.4
> These results suggest an annual global loss of approximately 35 million metric tons. It must be stressed, however, that this is a directional estimate at best. To develop appropriate waste reduction strategies, further work is needed to better understand and quantify waste streams at national and regional levels and in key supply chains.

15
Adopting a plausible set of assumptions1 about how percentage loss by stage by region might be reduced with focused effort, our model suggests that a total savings of approximately 15 million metric tons could be achieved. However, to validate this opportunity and to realize such savings, a systematic and comprehensive effort to map opportunities and act on the findings will be needed.
EST IMATED GLOBAL WASTE REDUCT ION OPPORTUNITY IN F ISH
PRODUCT ION AND DISTR IBUT ION IN METRIC TONS OF F ISH.
THEMAT IC OR GEOGRAPHY PRODUCT ION
POSTHARVEST HANDLING
AND STORAGE PROCESSING DISTRIBUT ION CONSUMPT ION GRAND TOTAL
CH INA 679,064 502,953 463,837 1,285,362 1,247,925 4,179,141
EAST ASIA AND PAC IF IC
EXCLUDING CH INA931,021 696,262 494,558 1,585,864 299,719 4,007,423
EUROPE AND
CENTRAL ASIA219,233 13,001 354,648 349,551 690,006 1,626,439
LAT IN AMER ICA AND
THE CAR IBBEAN93,056 128,464 119,096 100,586 0 441,204
MIDDLE EAST AND
NORTH AFR ICA83,647 87,647 81,882 83,903 533 337,612
NORTH AMER ICA 152,406 54 81,592 213,925 1,249,236 1,697,209
SOUTH ASIA 311,755 381,342 233,903 777,609 0 1,704,609
SUB-SAHARAN
AFR ICA110,976 191,991 117,765 568,139 0 988,871
GRAND TOTAL 2,581,158 2,001,710 1,947,280 4,964,940 3,487,419 14,982,507
3.1
KEY F INDING
BASED ON CRUDE REGIONAL EST IMATES BY LOSS STAGE, TOTAL GLOBAL FOOD LOSS
IN F ISHERIES AND AQUACULTURE IS APPROXIMATELY 35 MILLION METRIC TONS.
CHINA AND OTHER EAST ASIAN COUNTRIES SUFFER THE LARGEST OVERALL LOSSES.
LOSSES AT THE DISTRIBUT ION STAGE DOMINATE OVERALL, OWING TO HIGH LEVELS
IN LESS DEVELOPED COUNTRIES.
APPROXIMATELY 15 MILLION METRIC TONS (40%) OF CURRENT LOSSES MIGHT
REALIST ICALLY BE SAVED, BUT A SYSTEMAT IC AND COMPREHENSIVE EFFORT WILL
BE NEEDED TO CAPTURE THIS OPPORTUNITY.
1 | See Appendix 2.

16
OCEAN PROSPERITY ROADMAP STUDY
(COSTELLO ET AL . 2015):
Using a database of 4373 fisheries represent-ing 77% of global catch, it is estimated that global marine fish production could rise by 14%, providing an additional 12 million metric tons. In contrast, current trends indicate a 5 million metric ton decline by 2025 under a business-as-usual scenario.
SUNKEN BILL IONS REV IS IT ED REPORT
(RAGNARSON 2015):
Using a bio-economic model of the global fishery, it is estimated that global marine fish production could be increased by almost 13% over 2012 levels—approximately 10.4 million metric tons.
For both estimates, these increases would require us to reduce fishing for stocks that are currently overfished (F > FMSY) and increase fishing on those that are currently underfished (F < FMSY).
THE SIZE OF THE C IRCLE IS THE MAXIMUM SUSTAINABLE Y IELD OF STOCKS IN THE REGION THAT ARE CONTAINED IN THE RAM LEGACY DATABASE .
ALTHOUGH THE RESULTS FOR EUROPE MAY APPEAR SURPRISING, THEY ARISE BECAUSE MOST OF THE OVERF ISHED STOCKS ARE SMALL, AND THERE ARE SEVERAL LARGE, UNDEREXPLOITED STOCKS. (SOURCE: H ILBORN & COSTELLO, PERS.COMM)
3.2WILD CATCH INCREASE POTENT IAL
GET T ING TO EDEN / BR IDGING T HE GA P: PAT HWAYS TO MEET ING GLOBA L NEEDS
28+72
75+17+8
65+27+8
74+26
75+2567+33 57+38+5
32+56+12
78+22
57+43
72+4+2460+40
92+8
79+21
PROPORT ION OF MSY THAT WOULD BE ACHIEVED AT CURRENT EXPLOITA-T ION RATES.
PROPORT ION OF MSY THAT WOULD BE ACHIEVED BY F ISHING UNDEREX-PLOITED STOCKS HARDER.
PROPORT ION OF MSY THAT WOULD BE ACHIEVED BY REDUC ING OVER-F ISHING.
THE POTENTIAL TO INCREASE HARVEST BY IMPROVING MANAGEMENT OF ASSESSED STOCKS.
How much more fish from ocean wild catch could we expect if all fish stocks globally were fished at their maximum sustain-able yield (MSY)? Two recent studies have attempted to answer this question.
MARINE F ISHERIES
OPT IMAL F ISHING
OVERF ISHING
UNDERF ISHING
3277
623 1345
766722
7485
1116
1995
227
460 6969
4511
992
11526
17
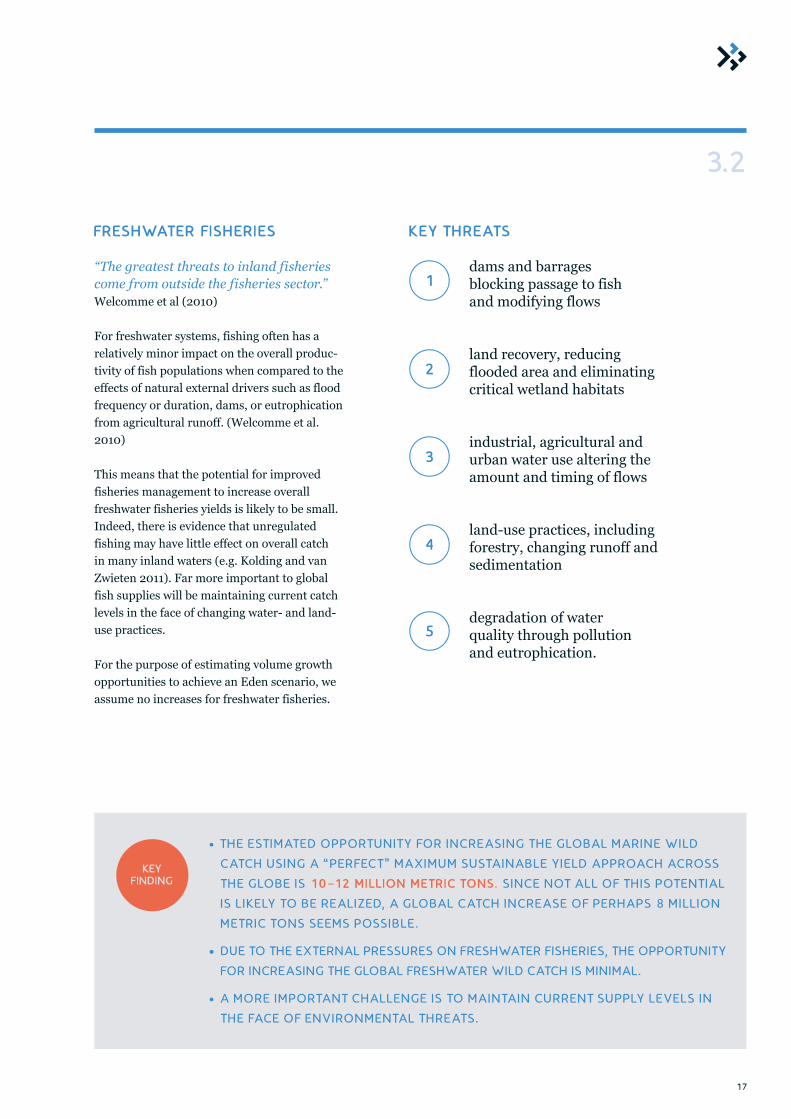
FRESHWATER F ISHERIES
“The greatest threats to inland fisheries come from outside the fisheries sector.”Welcomme et al (2010) For freshwater systems, fishing often has arelatively minor impact on the overall produc-tivity of fish populations when compared to theeffects of natural external drivers such as floodfrequency or duration, dams, or eutrophicationfrom agricultural runoff. (Welcomme et al. 2010)
This means that the potential for improved fisheries management to increase overall freshwater fisheries yields is likely to be small. Indeed, there is evidence that unregulated fishing may have little effect on overall catch in many inland waters (e.g. Kolding and van Zwieten 2011). Far more important to global fish supplies will be maintaining current catch levels in the face of changing water- and land-use practices.
For the purpose of estimating volume growth opportunities to achieve an Eden scenario, we assume no increases for freshwater fisheries.
3.2
KEY THREATS
dams and barrages blocking passage to fish and modifying flows
land recovery, reducing flooded area and eliminating critical wetland habitats
industrial, agricultural and urban water use altering the amount and timing of flows
land-use practices, including forestry, changing runoff and sedimentation
degradation of water quality through pollution and eutrophication.
KEY F INDING
T HE EST IMAT ED OPPORT UNIT Y FOR INCREASING T HE GLOBAL MARINE WILD
CATCH USING A “PERF ECT ” MAXIMUM SUSTA INABLE YIELD APPROACH ACROSS
T HE GLOBE IS 10–12 MILL ION METRIC TONS. SINCE NOT ALL OF T H IS POT ENT IAL
IS L IKELY TO BE REALIZED, A GLOBAL CATCH INCREASE OF PERHAPS 8 M ILL ION
MET RIC TONS SEEMS POSSIBLE .
DUE TO THE EXTERNAL PRESSURES ON FRESHWATER F ISHERIES, THE OPPORTUNITY
FOR INCREASING THE GLOBAL FRESHWATER WILD CATCH IS MINIMAL.
A MORE IMPORTANT CHALLENGE IS TO MAINTA IN CURRENT SUPPLY LEVELS IN
T HE FACE OF ENVIRONMENTAL T HREAT S.
1
2
3
4
5
18
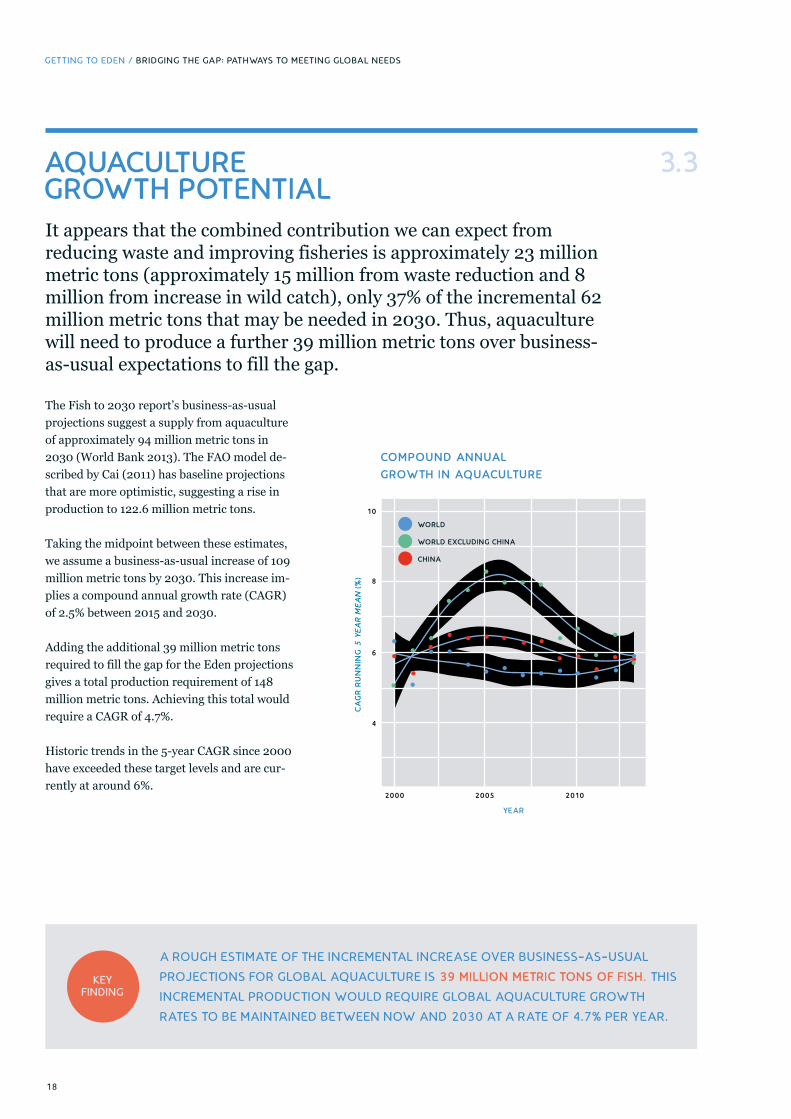
The Fish to 2030 report’s business-as-usual projections suggest a supply from aquaculture of approximately 94 million metric tons in 2030 (World Bank 2013). The FAO model de-scribed by Cai (2011) has baseline projections that are more optimistic, suggesting a rise in production to 122.6 million metric tons. Taking the midpoint between these estimates, we assume a business-as-usual increase of 109 million metric tons by 2030. This increase im-plies a compound annual growth rate (CAGR) of 2.5% between 2015 and 2030.
Adding the additional 39 million metric tons required to fill the gap for the Eden projections gives a total production requirement of 148 million metric tons. Achieving this total would require a CAGR of 4.7%.
Historic trends in the 5-year CAGR since 2000 have exceeded these target levels and are cur-rently at around 6%.
3.3AQUACULTURE GROWTH POTENT IAL
GET T ING TO EDEN / BR IDGING T HE GA P: PAT HWAYS TO MEET ING GLOBA L NEEDS
It appears that the combined contribution we can expect from reducing waste and improving fisheries is approximately 23 million metric tons (approximately 15 million from waste reduction and 8 million from increase in wild catch), only 37% of the incremental 62 million metric tons that may be needed in 2030. Thus, aquaculture will need to produce a further 39 million metric tons over business-as-usual expectations to fill the gap.
KEY F INDING
A ROUGH EST IMATE OF THE INCREMENTAL INCREASE OVER BUSINESS-AS-USUAL
PROJECT IONS FOR GLOBAL AQUACULTURE IS 39 MILLION METRIC TONS OF F ISH. THIS
INCREMENTAL PRODUCT ION WOULD REQUIRE GLOBAL AQUACULTURE GROWTH
RATES TO BE MAINTAINED BETWEEN NOW AND 2030 AT A RATE OF 4.7% PER YEAR.
10
8
6
4
2000 2005 2010
COMPOUND ANNUAL
GROWTH IN AQUACULTURE
YEAR
CA
GR
RU
NN
ING
5 Y
EA
R M
EA
N (
%)
WORLD
CHINA
WORLD EXCLUDING CHINA
19
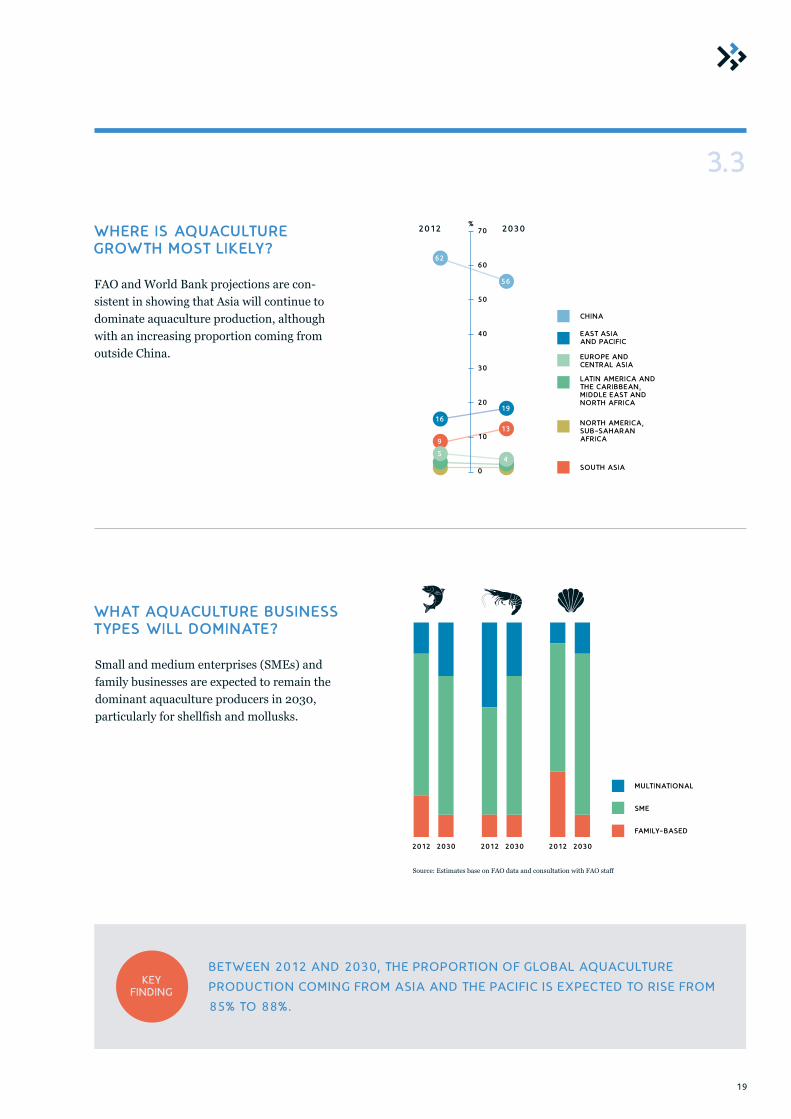
WHERE IS AQUACULTURE GROWTH MOST L IKELY?
3.3
KEY F INDING
BET WEEN 2012 AND 2030, T HE PROPORT ION OF GLOBAL AQUACULT URE
PRODUCT ION COMING F ROM ASIA AND T HE PACIF IC IS EXPECT ED TO RISE F ROM
85% TO 88%.
19
1316
9
54
%2012 2030
56
62
CHINA
EAST ASIA AND PAC IF IC
EUROPE AND CENTRAL ASIA LAT IN AMERICA AND THE CARIBBEAN, MIDDLE EAST AND NORTH AFRICA
NORTH AMERICA,SUB-SAHARAN AFRICA
SOUTH ASIA
70
60
50
40
30
20
10
0
FAO and World Bank projections are con-sistent in showing that Asia will continue to dominate aquaculture production, although with an increasing proportion coming from outside China.
WHAT AQUACULTURE BUSINESS TYPES WILL DOMINATE?
MULT INAT IONAL
SME
FAMILY-BASED
2012 2012 20122030 2030 2030
Small and medium enterprises (SMEs) and family businesses are expected to remain the dominant aquaculture producers in 2030, particularly for shellfish and mollusks.
Source: Estimates base on FAO data and consultation with FAO staff

20
AQUACULTURE IN AFRICA: A KEY CHALLENGE? Despite high growth rates for aquaculture in many countries on the African continent, this growth is from a very low base. Both FAO and World Bank projections indicate that produc-tion on the continent in 2030 is likely to be only a few percent of the world’s total.
World Bank baseline projections also suggest that, accounting for imports, there will be a 1% decline in per capita fish consumption in Africa by 2030 to 5.6 kilograms per person per year, well below desirable levels.
3.3
GET T ING TO EDEN / BR IDGING T HE GA P: PAT HWAYS TO MEET ING GLOBA L NEEDS
KEY F INDING
T HE CHALLENGE OF MEET ING T HE DEMAND FOR F ISH ON T HE AF RICAN
CONT INENT IS PART ICULARLY ACUT E . BUSINESS-AS-USUAL PROJECT IONS OF
AQUACULT URE GROWT H WILL BE INSUF F IC IENT TO REVERSE A DECL IN ING T REND
IN PER CAPITA F ISH CONSUMPT ION F ROM AN ALREADY INADEQUAT E BASE .
SUPPLY-DEMAND GAP
100(100)
SUPPLY-DEMAND GAP (%)
36
100
24
(59)
(38) (72)(64)
(64)
(69)
(92)(93) (34)
(73)(4)
(1)
22
(86)
(65)
(83)
(80)
(48)
(57)
(72)
(66)
(73)
(49)
9(71)
(75)
(63)
(65) (72)
(65)
61
(20)
74
(53)
100
(44)
(33)
(50)
(39)
(43)
(42)(41)
(56)(46)
(47)
(54)
21
SUPPLY-DEMAND GAP

THE NEED FOR COLLECT IVE ACT ION
4
23
THE PRODUCT IONCHALLENGE
HOW DO WE PRODUCE
ENOUGH F ISH TO MEET FUTURE
DEMAND AND NEED?
THE SUSTA INABIL IT Y
CHALLENGEHOW DO WE ENSURE THAT
THE F ISH FOOD SYSTEM IS
BOTH ECONOMICALLY AND
ECOLOGICALLY
SUSTAINABLE?
THE D ISTR IBUT ION CHALLENGE
HOW DO WE ENSURE THAT
THE F ISH IS AFFORDABLE AND
AVAILABLE FOR ALL AND THAT
THE ECONOMIC AND NUTRIT IONAL
BENEF ITS FROM THE SECTOR
ARE EQUITABLY
SHARED?
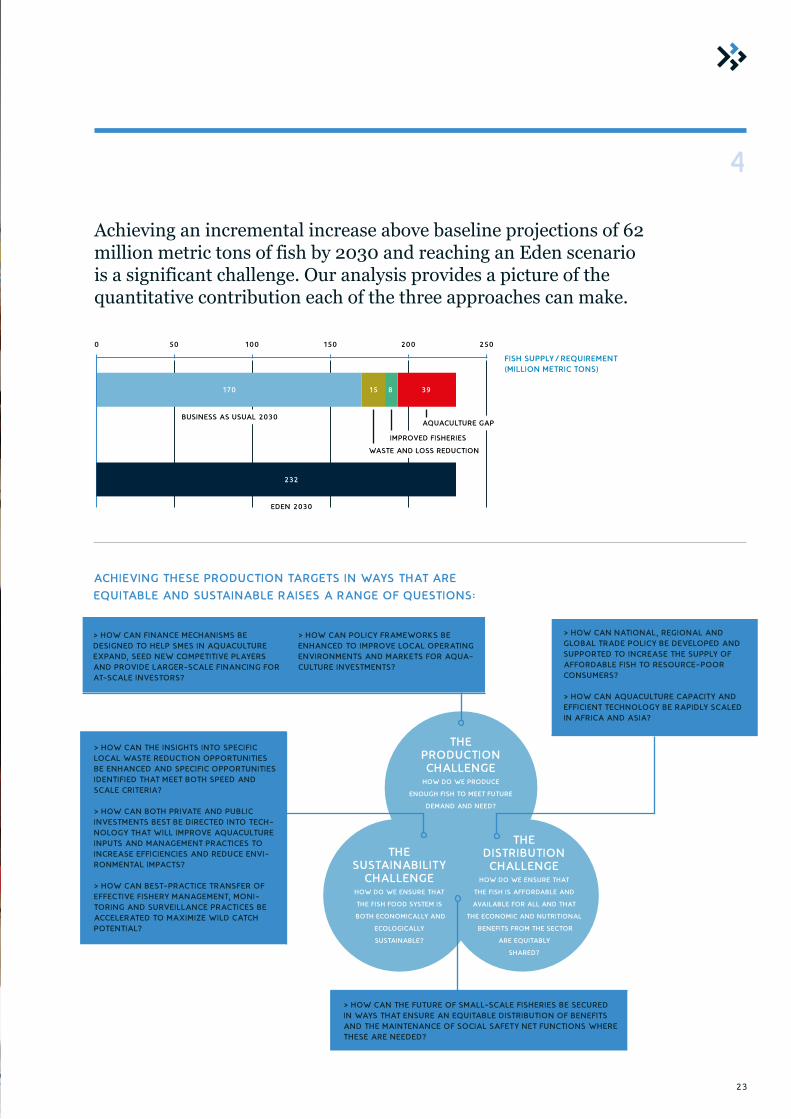
Achieving an incremental increase above baseline projections of 62 million metric tons of fish by 2030 and reaching an Eden scenario is a significant challenge. Our analysis provides a picture of the quantitative contribution each of the three approaches can make.
ACHIEV ING THESE PRODUCT ION TARGETS IN WAYS THAT ARE
EQUITABLE AND SUSTA INABLE RA ISES A RANGE OF QUEST IONS:
4
> HOW CAN F INANCE MECHANISMS BE DESIGNED TO HELP SMES IN AQUACULTURE EXPAND, SEED NEW COMPET IT IVE PLAYERS AND PROVIDE LARGER-SCALE F INANCING FOR AT-SCALE INVESTORS?
> HOW CAN POLICY FRAMEWORKS BE ENHANCED TO IMPROVE LOCAL OPERAT ING ENVIRONMENTS AND MARKETS FOR AQUA-CULTURE INVESTMENTS?
> HOW CAN THE INSIGHTS INTO SPEC IF IC LOCAL WASTE REDUCT ION OPPORTUNIT IES BE ENHANCED AND SPEC IF IC OPPORTUNIT IES IDENT IF IED THAT MEET BOTH SPEED AND SCALE CRITERIA?
> HOW CAN BOTH PRIVATE AND PUBLIC INVESTMENTS BEST BE DIRECTED INTO TECH-NOLOGY THAT WILL IMPROVE AQUACULTURE INPUTS AND MANAGEMENT PRACT ICES TO INCREASE EFF IC IENC IES AND REDUCE ENVI-RONMENTAL IMPACTS?
> HOW CAN BEST-PRACT ICE TRANSFER OF EFFECT IVE F ISHERY MANAGEMENT, MONI-TORING AND SURVEILLANCE PRACT ICES BE ACCELERATED TO MAXIMIZE WILD CATCH POTENT IAL?
> HOW CAN NAT IONAL, REGIONAL AND GLOBAL TRADE POLICY BE DEVELOPED AND SUPPORTED TO INCREASE THE SUPPLY OF AFFORDABLE F ISH TO RESOURCE-POOR CONSUMERS?
> HOW CAN AQUACULTURE CAPACITY AND EFF IC IENT TECHNOLOGY BE RAPIDLY SCALED IN AFRICA AND ASIA?
> HOW CAN THE FUTURE OF SMALL-SCALE F ISHERIES BE SECURED IN WAYS THAT ENSURE AN EQUITABLE DISTRIBUT ION OF BENEF ITS AND THE MAINTENANCE OF SOCIAL SAFETY NET FUNCT IONS WHERE THESE ARE NEEDED?
F ISH SUPPLY / REQUIREMENT (MILL ION METRIC TONS)
BUSINESS AS USUAL 2030
EDEN 2030
WASTE AND LOSS REDUCT ION
IMPROVED F ISHERIES
AQUACULTURE GAP
232
39815170
0 50 100 150 200 250
24
GET T ING TO EDEN / T HE NEED FOR COLLECT IVE ACT ION
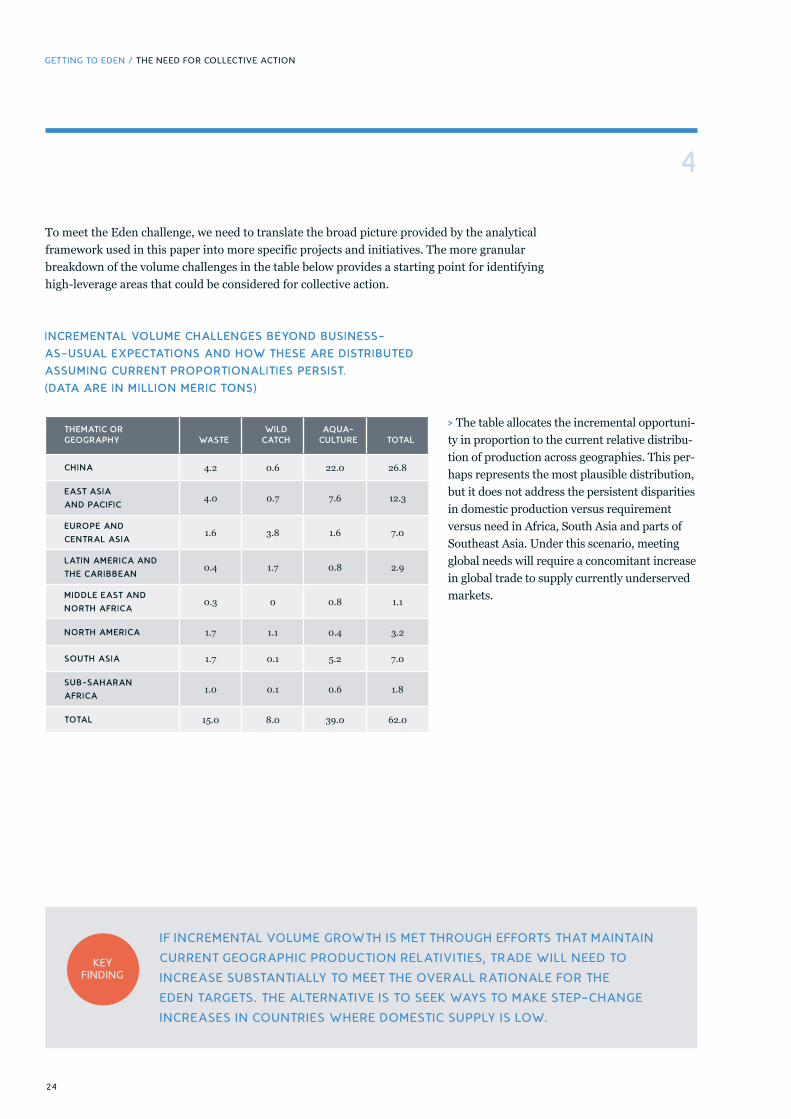
To meet the Eden challenge, we need to translate the broad picture provided by the analytical framework used in this paper into more specific projects and initiatives. The more granular breakdown of the volume challenges in the table below provides a starting point for identifying high-leverage areas that could be considered for collective action.
> The table allocates the incremental opportuni-ty in proportion to the current relative distribu-tion of production across geographies. This per-haps represents the most plausible distribution, but it does not address the persistent disparities in domestic production versus requirement versus need in Africa, South Asia and parts of Southeast Asia. Under this scenario, meeting global needs will require a concomitant increase in global trade to supply currently underserved markets.
INCREMENTAL VOLUME CHALLENGES BEYOND BUSINESS-
AS-USUAL EXPECTAT IONS AND HOW THESE ARE DISTR IBUTED
ASSUMING CURRENT PROPORT IONALIT IES PERSIST.
(DATA ARE IN M ILL ION MERIC TONS)
THEMAT IC OR GEOGRAPHY WASTE
WILD CATCH
AQUA- CULTURE TOTAL
CH INA 4.2 0.6 22.0 26.8
EAST ASIA
AND PAC IF IC4.0 0.7 7.6 12.3
EUROPE AND
CENTRAL ASIA1.6 3.8 1.6 7.0
LAT IN AMER ICA AND
THE CAR IBBEAN0.4 1.7 0.8 2.9
MIDDLE EAST AND
NORTH AFR ICA0.3 0 0.8 1.1
NORTH AMER ICA 1.7 1.1 0.4 3.2
SOUTH ASIA 1.7 0.1 5.2 7.0
SUB-SAHARAN
AFR ICA1.0 0.1 0.6 1.8
TOTAL 15.0 8.0 39.0 62.0
4
KEY F INDING
I F INCREMENTAL VOLUME GROWT H IS MET T HROUGH EF FORT S T HAT MAINTA IN
CURRENT GEOGRAPHIC PRODUCT ION RELAT IVIT IES, T RADE WILL NEED TO
INCREASE SUBSTANT IALLY TO MEET T HE OVERALL RAT IONALE FOR T HE
EDEN TARGET S. T HE ALT ERNAT IVE IS TO SEEK WAYS TO MAKE ST EP-CHANGE
INCREASES IN COUNT RIES WHERE DOMEST IC SUPPLY IS LOW.
25
4.1OPT IONS FOR CONSIDERAT ION
Consultations to date have yielded several ideas for consideration:
1. GLOBAL MAPPING AND IDENT IF ICAT ION OF WASTE REDUCT ION OPPORTUNIT IES
INDICAT IVE GLOBAL VOLUME OPPORTUNITY:
15 M ILL ION METR IC TONS PER ANNUM
INDICAT IVE VALUE OPPORTUNIT Y:
USD 15–30 B ILL ION PER ANNUM
THE CHALLENGE
As noted in the recent international confer-ence “No more food to waste: Global action to stop food losses and food waste and loss,”2 there is no robust data at either regional or global scales that would allow rapid capture of high-leverage waste and loss reduction opportunities. Data on the true waste and loss situation across the global value system is scarce and largely anecdotal. Best-practice solutions and technologies cannot easily be im-plemented without creating a solid data-driven understanding of the nature and scale of waste and loss in specific contexts.
COLLECT IVE ACT ION APPROACH
To address this knowledge gap and progress towards implementable solutions, two collec-tive action approaches could be pursued. These proposals align closely with the recommenda-tions from the “No more food to waste” confer-ence and would require a collaborative effort of multilateral organizations, national policy agencies, NGOs and private sector actors to guide the effort.
Option 1: A global-scale primary research effort that uses quantitative surveys of actors across the value chain (at the catch, processing, distribution and retail stages) and consum-ers in order to create a comprehensive global opportunity map.
A possible research approach could include fo-cusing the quantitative mapping on eight rep-resentative countries that meet a set of criteria such as scale of opportunity (as per our initial analysis), market structure, stage of market maturity, and archetypes of local waste and loss management practices. From the mapping results of these eight countries, extrapolations of opportunities in other countries or regions could be made.
> Estimated time to complete: 18 months
Option 2: Option 1 would provide a com-prehensive global waste and loss reduction opportunity map. To move to implementation, however, additional work would be needed to identify replicable best practices and technol-ogies.
Option 2 would address this issue by limiting work to two or three countries, but combining the quantitative survey-based opportunity mapping with a collation of best practices and technologies that can be implemented rapidly in these countries to capture the waste and loss reduction potential. In addition, specific pilot projects for implementation could be designed and launched.
> Estimated time to complete: 12 months
Reaching Eden will require collective effort that cuts across stakeholder groups and geographies. The objective of this paper is to stimulate discussion of concrete collective action opportunities.
2 | No more food to waste: Global action to stop food losses and food waste and loss.
16–19 June 2015, The Hague, Netherlands. www.nomorefoodtowaste.nl

26
2. ACCELERATE GROWTH OF AQUACULTURE AND ENHANCE AQUACULTURE F INANCE MECH-ANISMS
INDICAT IVE GLOBAL VOLUME OPPORTUNITY:
40 M ILL ION METR IC TONS PER ANNUM
INDICAT IVE VALUE OPPORTUNIT Y:
USD 80–120 B ILL ION PER ANNUM
THE CHALLENGE
A common impediment to accelerating the growth of aquaculture in many countries is the lack of a supportive policy and enabling environment. Challenges include lack of clarity about aquaculture zoning and permitting poli-cies and decision making, inappropriate or in-adequate environmental regulations, and lack of infrastructure. As a consequence, attracting financial investment is problematic for SMEs and large-scale aquaculture enterprises.
To address this challenge, SME-level fund-ing mechanisms need to be strengthened. Approaches such as customized insurance products, collateralized debt or project aggre-gation to better allocate risk must be explored. Large-scale project finance and corporate-level financing via blue bonds through multilateral or private banks can inject new capital into the sector, but require a strategic funding com-mitment and familiarity of lenders with the aquaculture sector.
COLLECT IVE ACT ION APPROACH
To accelerate SME funding, a readiness fund should be established. Key inputs would be na-tional and regional dialogues with key constit-uencies to assess local finance needs, market gaps and funding risks.
Designing and implementing such a readiness fund would require a partnership between a
range of financial institutions (for example, the World Bank, regional development banks, specialized private banks, insurance firms and private investors), national governments and SME aquaculture operators.
> Estimated time to complete: 12–18 months
To strengthen large-scale aquaculture project finance and initiate corporate-level blue bond launches, both strategic funding commitments from lenders and familiarity with the aquacul-ture sector in finance institutions would need to be enhanced.
Creating a global prospectus for large-scale aquaculture finance could be a useful vehicle for achieving this. This prospectus could, for example, profile overall market structures and economics; showcase selected large-scale aquaculture investments that meet minimum economic returns, environmental standards and social criteria; outline risks; and provide indicative estimates for finance opportuni-ties. It could also identify current large-scale aquaculture projects that are in a funding or advanced planning stage.
In roundtable discussions with finance insti-tutions and policy stakeholders, the prospec-tus—together with current aquaculture project investment opportunities—would be presented to unlock capital for the sector.
The development of such a global aquaculture investment prospectus would require the col-laboration of multilateral funding institutions, commercial banks, large-scale aquaculture project owners and NGOs.
> Estimated time to complete: 12 months
4.1
GET T ING TO EDEN / T HE NEED FOR COLLECT IVE ACT ION
27
4.1
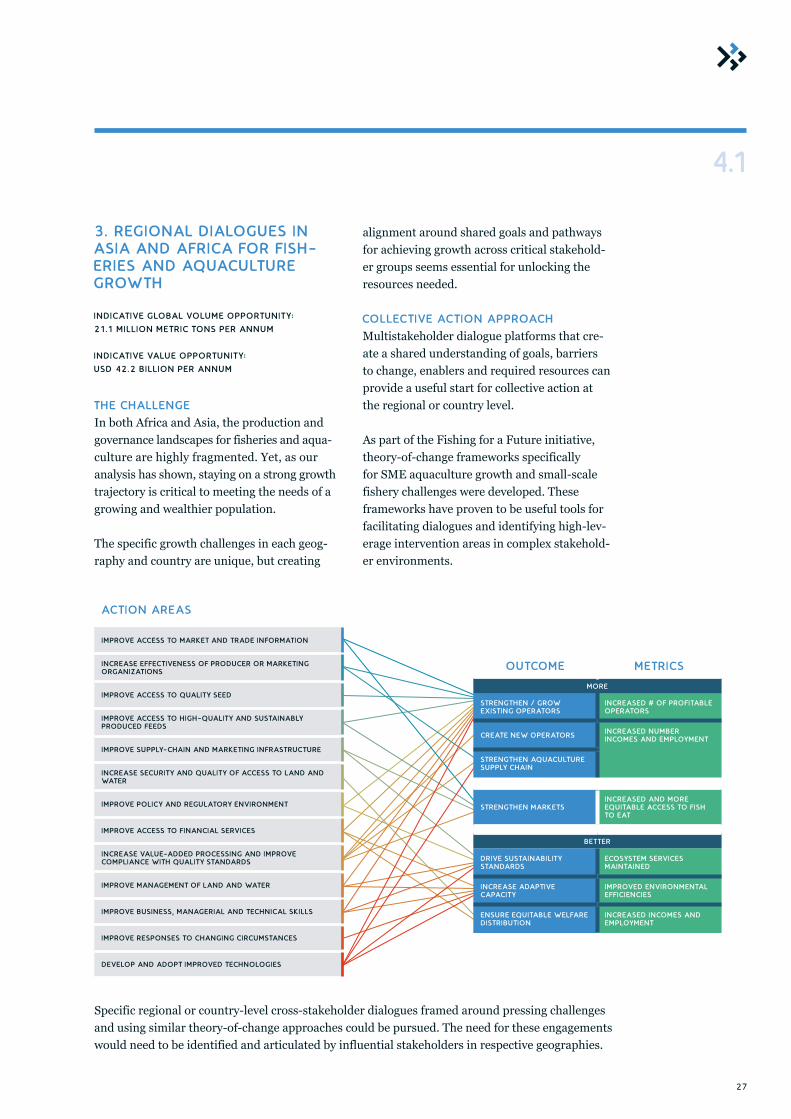
3. REGIONAL DIALOGUES IN ASIA AND AFRICA FOR F ISH-ERIES AND AQUACULTURE GROWTH
INDICAT IVE GLOBAL VOLUME OPPORTUNITY:
21.1 M ILL ION METR IC TONS PER ANNUM
INDICAT IVE VALUE OPPORTUNIT Y:
USD 42.2 B I LL ION PER ANNUM
THE CHALLENGE
In both Africa and Asia, the production and governance landscapes for fisheries and aqua- culture are highly fragmented. Yet, as our analysis has shown, staying on a strong growth trajectory is critical to meeting the needs of a growing and wealthier population.
The specific growth challenges in each geog-raphy and country are unique, but creating
alignment around shared goals and pathways for achieving growth across critical stakehold-er groups seems essential for unlocking the resources needed.
COLLECT IVE ACT ION APPROACH
Multistakeholder dialogue platforms that cre-ate a shared understanding of goals, barriers to change, enablers and required resources can provide a useful start for collective action at the regional or country level.
As part of the Fishing for a Future initiative, theory-of-change frameworks specifically for SME aquaculture growth and small-scale fishery challenges were developed. These frameworks have proven to be useful tools for facilitating dialogues and identifying high-lev-erage intervention areas in complex stakehold-er environments.
Specific regional or country-level cross-stakeholder dialogues framed around pressing challenges and using similar theory-of-change approaches could be pursued. The need for these engagements would need to be identified and articulated by influential stakeholders in respective geographies.
IMPROVE ACCESS TO MARKET AND TRADE INFORMAT ION
INCREASE EFFECT IVENESS OF PRODUCER OR MARKET ING ORGANIZAT IONS
IMPROVE ACCESS TO QUALITY SEED
IMPROVE ACCESS TO HIGH-QUALITY AND SUSTAINABLY PRODUCED FEEDS
IMPROVE SUPPLY-CHAIN AND MARKET ING INFRASTRUCTURE
INCREASE SECURITY AND QUALITY OF ACCESS TO LAND AND WATER
IMPROVE POLICY AND REGULATORY ENVIRONMENT
IMPROVE ACCESS TO F INANCIAL SERVICES
INCREASE VALUE-ADDED PROCESSING AND IMPROVE COMPLIANCE WITH QUALITY STANDARDS
IMPROVE MANAGEMENT OF LAND AND WATER
IMPROVE BUSINESS, MANAGERIAL AND TECHNICAL SKILLS
IMPROVE RESPONSES TO CHANGING C IRCUMSTANCES
DEVELOP AND ADOPT IMPROVED TECHNOLOGIES
ACT ION AREAS
STRENGTHEN / GROW EXIST ING OPERATORS
INCREASED # OF PROF ITABLE OPERATORS
CREATE NEW OPERATORS INCREASED NUMBER INCOMES AND EMPLOYMENT
STRENGTHEN AQUACULTURE SUPPLY CHAIN
STRENGTHEN MARKETSINCREASED AND MORE EQUITABLE ACCESS TO F ISH TO EAT
BETTER
DRIVE SUSTAINABIL ITY STANDARDS
ECOSYSTEM SERVICES MAINTAINED
INCREASE ADAPT IVE CAPACITY
IMPROVED ENVIRONMENTAL EFF IC IENC IES
ENSURE EQUITABLE WELFARE DISTRIBUT ION
INCREASED INCOMES AND EMPLOYMENT
MORE
OUTCOME METRICS
28
4. DEVELOPING A FRAMEWORK FOR SCALING BEST PRACT ICES IN SMALL-SCALE F ISHERIES MANAGEMENT
INDICAT IVE GLOBAL VOLUME OPPORTUNITY:
2 M ILL ION METR IC TONS PER ANNUM
INDICAT IVE VALUE OPPORTUNIT Y:
USD 4 B I LL ION PER ANNUM3
THE CHALLENGE
Small-scale fisheries provide a crucial social and economic function for coastal communi-ties in many developing regions of the world. Strengthening their governance to ensure that they meet economic and social needs in a sustainable manner remains a top priority for many governments. Examples of successful projects to support such governance reform exist, but they have proved resource intensive and highly context specific.
Although there is general agreement that there is no one-size-fits-all approach for reforming small-scale fisheries, there remains an urgent need to find scalable models.
COLLECT IVE ACT ION APPROACH
Developing a data-driven small-scale fisheries archetype system could provide the framework for linking a possible suite of best-practice
solutions to small-scale fisheries with similar characteristics. The basis for such a global archetyping effort would be a survey-based quantitative (statistical) analysis of the under-lying factors that define archetypes, support-ed by a series of validation discussions. The survey work could be carried out across six to eight countries, predominantly in developing coastal fishery communities in Africa and Asia Pacific. Following the statistical work, emerg-ing archetypes would be profiled, validated and expanded upon with NGO, policy, philanthro-py and private sector stakeholders.
As a result, a data-driven framework would emerge, providing a starting point for prioritiz-ing proven solutions that have shown tangible results for small-scale fisheries that share certain contextual characteristics.
An effort of this kind would require support from development agencies, NGOs, the private sector and governments.
> Estimated time to complete: 18 months
4.1
GET T ING TO EDEN / T HE NEED FOR COLLECT IVE ACT ION
3 | Assumes (1) 25% of the potential 8 million metric ton opportunity increase for
fisheries could be captured by the small-scale sector; and (2) an average landed price
of USD 2 per kilogram of fish.
29
4.1
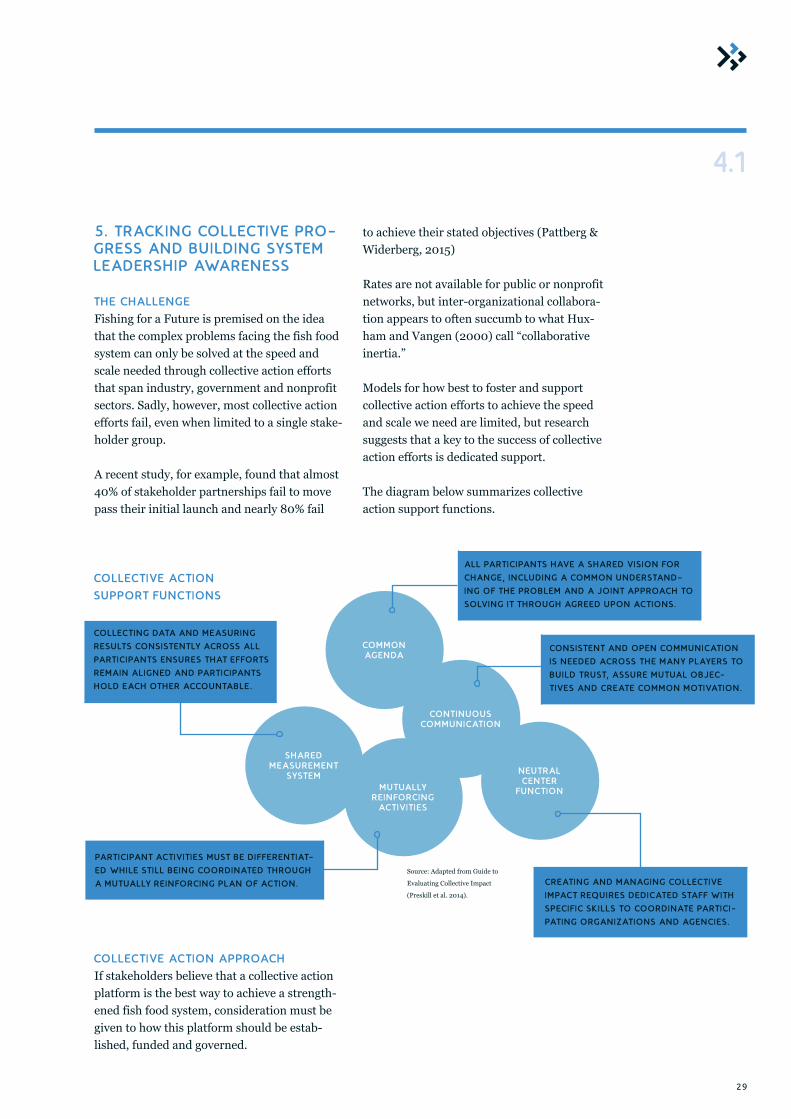
5. TRACKING COLLECT IVE PRO-GRESS AND BUILDING SYSTEM LEADERSHIP AWARENESS
THE CHALLENGE
Fishing for a Future is premised on the idea that the complex problems facing the fish food system can only be solved at the speed and scale needed through collective action efforts that span industry, government and nonprofit sectors. Sadly, however, most collective action efforts fail, even when limited to a single stake-holder group.
A recent study, for example, found that almost 40% of stakeholder partnerships fail to move pass their initial launch and nearly 80% fail
to achieve their stated objectives (Pattberg & Widerberg, 2015)
Rates are not available for public or nonprofit networks, but inter-organizational collabora-tion appears to often succumb to what Hux-ham and Vangen (2000) call “collaborative inertia.”
Models for how best to foster and support collective action efforts to achieve the speed and scale we need are limited, but research suggests that a key to the success of collective action efforts is dedicated support.
The diagram below summarizes collective action support functions.
COLLECT IVE ACT ION
SUPPORT FUNCT IONS
COLLECT ING DATA AND MEASURING
RESULTS CONSISTENTLY ACROSS ALL
PART IC IPANTS ENSURES THAT EF FORTS
REMA IN AL IGNED AND PART IC IPANTS
HOLD EACH OTHER ACCOUNTABLE .
PART IC IPANT ACT IV IT I ES MUST BE D I F FERENT IAT-
ED WHILE ST I LL BE ING COORDINATED THROUGH
A MUTUALLY RE INFORC ING PLAN OF ACT ION.
ALL PART IC IPANTS HAVE A SHARED V IS ION FOR
CHANGE, INCLUDING A COMMON UNDERSTAND-
ING OF THE PROBLEM AND A JOINT APPROACH TO
SOLV ING IT THROUGH AGREED UPON ACT IONS.
CONSISTENT AND OPEN COMMUNICAT ION
IS NEEDED ACROSS THE MANY PLAYERS TO
BU ILD TRUST, ASSURE MUTUAL OBJEC-
T IVES AND CREATE COMMON MOT IVAT ION.
CREAT ING AND MANAGING COLLECT IVE
IMPACT REQUIRES DEDICATED STAFF W ITH
SPEC I F IC SK ILLS TO COORDINATE PART IC I-
PAT ING ORGANIZAT IONS AND AGENC IES .
COLLECT IVE ACT ION APPROACH
If stakeholders believe that a collective action platform is the best way to achieve a strength-ened fish food system, consideration must be given to how this platform should be estab-lished, funded and governed.
SHAREDMEASUREMENT
SYSTEMMUTUALLY
RE INFORC INGACT IV IT I ES
CONT INUOUSCOMMUNICAT ION
NEUTRALCENTER
FUNCT ION
COMMON AGENDA
Source: Adapted from Guide to
Evaluating Collective Impact
(Preskill et al. 2014).

30
CL IMATE CHANGE AND OTHER
ENV IRONMENTAL PRESSURES
Strong negative effects of climate change or other environmental pressures on the fish food system would make a strong case to argue even more forcefully for investment in aqua-culture. The potential for disruption of wild catches as a consequence of ocean acidifica-tion and other oceanographic changes is high. Climate-proofed investments in aquaculture, which is an inherently more controllable pro-duction system, would need to be made.
ECONOMIC GROWTH AND
THE OPENNESS OF MARKETS
If economic growth were to rapidly slow or fish trade were to be hampered by trade barriers and protectionism, one might expect overall fish consumption to fall. Examining overall patterns of trade and economic activity from 1976–2011 and comparing them to levels of fish trade, production and consumption pro-vides one test of this hypothesis.
Overall trade growth and fish trade growth are correlated, as are fish consumption growth and production growth (data not shown). Catego-rizing the level of overall trade into 18 periods of high (>10%), low (0%–10%) and negative
(<0%) annual growth (lasting 1–6 years) and looking at how closely the level of general eco-nomic activity and fish consumption, as well as consumption, are correlated, we find little evidence of correlation.
In the context of this paper, we interpret these results as positive. They suggest that the pro-posal to increase production volumes to reach Eden is robust in terms of possible impacts from short-term trade volatility and levels of economic activity.
The preferred state or Eden pathway presented in this paper outlines how we can collectively steer the fish food system into a desirable future. The Eden scenario was developed, however, in the light of uncertainties about two key drivers of change: “climate change and environmental impacts” and “economic growth and openness of markets.” We have treated these as givens and as-sumed that any negative impacts they might have on the system can be compensated for. How reasonable is this assumption?
THE RELAT IONSHIP BETWEEN GROWTH RATES
FOR GLOBAL TRADE AND F ISH CONSUMPT ION FOR
18 T IME PERIODS, CLASSIF IED AS H IGH, MEDIUM
OR LOW GROWTH. (NOTE: T IME PERIODS VARY IN
LENGTH FROM 1 TO 6 YEARS.)
5KEY UNCERTA INT IES
GET T ING TO EDEN / T HE NEED FOR COLLECT IVE ACT ION
25%
20%
15%
10%
5%
0%
-5%
-10%
-15%
-20%
-25%
F ISH CONSUMPT ION
F ISH PRODUCT ION
GLOBAL TRADE
1 2 3 4 5 6 7 8 9 10 11 12 13 14 15 16 17 18
AV
ER
AG
E G
RO
WTH
RA
TE
PE
R P
ER
IOD
31
Based on these analyses, the world’s requirement for fish for direct human consumption in 2030 will be approximately 232 million metric tons. This global need exceeds the trajec-tory of today’s production system, which would likely produce around 170 million tons in 2030. To close the 62-million-ton gap (a 37% deficit relative to what is needed), three pathways are available: reducing waste, improving fisheries and growing aquaculture.
A dedicated effort to reduce waste and loss along the value system and continued efforts to bring fisheries as close as possible to harvest-ing at maximum sustainable yield rates could contribute 15 million and 8 million metric tons, respectively. The remainder will need to come from an incremental increase in aqua-culture production over current expectations of 39 million metric tons. To achieve this, aquaculture will need to maintain a constant annual 4.7% growth rate from 2015 to 2030. This growth must be achieved in ways that are commercially viable for small- and large-scale producers, equitable in terms of distributing the value created, and environmentally sus-tainable.
Mobilizing, allocating and aligning the resources that are needed to meet this global challenge will require a collective effort. Several options
for such collective effort are summarized in this paper, but further discussion is needed to arrive at a complete list. To do this, we need to ask what is already happening, whether there are current efforts that require additional sup-port, and whether there are additional efforts that need to be put in place. In answering these questions, we need to consider investments and projects undertaken by policymakers, private companies, banks, NGOs and philan-thropic organizations.
In conclusion, we believe that these analyses tell us that despite the challenge, an Eden state for the global fish food system is achievable. To get there, however, we must set ourselves on the right path now and pursue it together.
ACKNOWLEDGEMENTS
We thank the following for providing analyses, data, and insights that supported preparation of this document: Juning Cai, Chris Costello, Yvette DieiOuadi, Ray Hilborn, Mike Philips, Rohana Subasinghe, Jogeir Toppe, Andrew Thorne Lyman and Sarah Walpole.
6SUMMARY AND CONCLUSION

32
Cai J. 2011. Preliminary notes on forecasting country’s future demand for fish. FAO Aqua-culture Newsletter 47:16-17.
Costello et al. 2015. The potential for global fish recovery: How effective fisheries manage-ment can increase abundance, yield and value. In Ocean Prosperity Roadmap: Fisheries and Beyond. California Environmental Associates. Retrieved from http://bit.ly/1HTbZ4H
[FAO] Food and Agriculture Organization of the United Nations. 1989. Yield and nutritional value of the commercially more important fish species. FAO Fisheries Technical Paper No. 309. Rome: FAO.
[FAO] Food and Agriculture Organization of the United Nations. 2011. Global food losses and food waste. Rome: FAO.
Huxham C and Vangen S. 2000. Leadership in the shaping and implementation of collab-oration agendas: How things happen in a (not quite) joined-up world. Academy of Manage-ment Journal 43:1159-75.
Kolding J and van Zwieten PAM. 2011. The tragedy of our legacy: How do global manage-ment discourses affect small scale fisheries in the south. Forum for Development Studies 38:267-297.
Institute of Medicine. 2005. Dietary Reference Intakes for Energy, Carbohydrate, Fiber, Fat, Fatty Acids, Cholesterol, Protein and Amino Acids. Washington, DC: National Academies Press.
Nathan Associates. 2015. APEC Fisheries post-harvest losses summary report. Septem-ber 2015.
Park SH and Ungson GR. 2001. Interfirm ri-valry and managerial complexity: A conceptual framework of alliance failure. Organization Science 12:37-53.
Preskill H, Parkhurst M, and Juster JS. 2014. Guide to Evaluating Collective Impact. FSG. Retrieved from http://www.fsg.org/publications/guide-evaluating-collective-im-pact#download-area
Ragnarson E. 2015. The Sunken Billions Revisited: Progress and Challenges in Global Marine Fisheries. Preliminary results from forthcoming World Bank Study. Environment and Natural Resources. June 2015. World Bank. Retrieved from http://bit.ly/1JnC6YC
Reardon T, and Timmer CP. 2014. Five inter-linked transformations in the Asian agrifood economy: Food security implications. Global Food Security 3:108-117.
Walpole SC, Prieto-Merino D, Edwards P, Cleland J, Stevens G and Roberts I. 2012. The weight of nations: An estimation of adult hu-man biomass. BMC Public Health 12:439.
Welcomme RL, Cowx IG, Coates D, Béné C, Funge-Smith S, Halls A and Lorenzen K. 2010. Inland capture fisheries. Philosophical Trans-actions of the Royal Society B: Biological Sciences 365:2881-96.
World Bank. 2013. Fish to 2030: Prospects for fisheries and aquaculture. World Bank Report 83177-GLB. Washington, DC: The World Bank.
7
GET T ING TO EDEN / T HE NEED FOR COLLECT IVE ACT ION
REFERENCES

33

34
APPENDICES
8
35
8.1
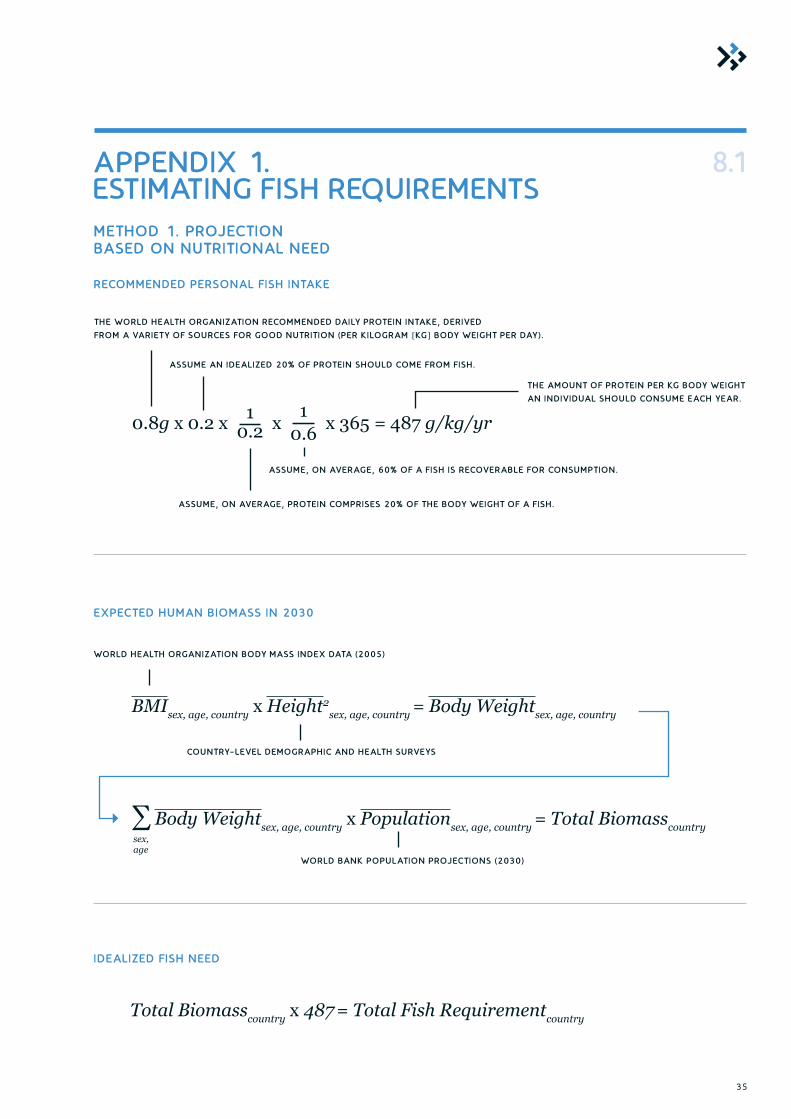
RECOMMENDED PERSONAL F ISH INTAKE
METHOD 1. PROJECT ION BASED ON NUTRIT IONAL NEED
EXPECTED HUMAN BIOMASS IN 2030
IDEAL IZED F ISH NEED
Total Biomasscountry x 487 = Total Fish Requirementcountry
BMIsex, age, country x Height2sex, age, country = Body Weightsex, age, country
0.8g x 0.2 x 10.2 x 1
0.6 x 365 = 487 g/kg/yr
∑ Body Weightsex, age, country x Populationsex, age, country = Total Biomasscountry
WORLD HEALTH ORGANIZAT ION BODY MASS INDEX DATA (2005)
THE WORLD HEALTH ORGANIZAT ION RECOMMENDED DA ILY PROTE IN INTAKE, DER IVED
FROM A VARIETY OF SOURCES FOR GOOD NUTR IT ION (PER K I LOGRAM [KG] BODY WEIGHT PER DAY).
ASSUME AN IDEAL IZED 20% OF PROTE IN SHOULD COME FROM F ISH .
ASSUME, ON AVERAGE, 60% OF A F ISH IS RECOVERABLE FOR CONSUMPT ION.
ASSUME, ON AVERAGE, PROTE IN COMPRISES 20% OF THE BODY WEIGHT OF A F ISH .
THE AMOUNT OF PROTE IN PER KG BODY WEIGHT
AN INDIV IDUAL SHOULD CONSUME EACH YEAR.
COUNTRY-LEVEL DEMOGRAPH IC AND HEALTH SURVEYS
WORLD BANK POPULAT ION PROJECT IONS (2030)
sex,age
APPENDIX 1. EST IMAT ING F ISH REQUIREMENTS

36
DATA SOURCES AND RAT IONALE FOR ASSUMPT IONS
The United States Institute of Medicine recommends that adults get a minimum of 0.8 grams of protein for every kilogram of body weight per day (Institute of Medicine 2005).
The average protein content per 100 grams for all finfish and shellfish products in the United States Department of Agriculture National Nutrient Database is 19.88 grams.(http://ndb.nal.usda.gov, accessed July 2014)
The average recovery of edible flesh in an assessment in the 1980s of commercially important finfish was 54.9% (FAO 1989). We assume moderate progress in filleting and other technologies to bring the proportion to 60%.
We assume the fish protein requirement is also an adequate proxy for other essential micronutrients provided by fish.
8.1
HUMAN BIOMASS
F ISH INTAKE
Data sources for body mass index and height, and the detailed methodology for cal-culating mean adult body weight, are described in Walpole et al. (2014); adult body weight data was derived from the datasets and results assembled for the same paper.
Average child body weight was derived using a country-specific weight-at-age growth curve and the population-at-age estimates from the World Bank population projections (see note 4 above). Country-specific weight at age was estimated by using the function-al form of the Canadian Pediatric Endocrine Group growth charts for boys and girls (http://cpeg-gcep.net), with the estimated adult weight as the asymptote.
Population projections for 2030 were extracted from the World Bank Health Nutrition and Population Statistics: Population estimates and projections database (http://databank.worldbank.org, accessed July 2014).
1
2
3
1
2
3
4
GET T ING TO EDEN / A PPENDICES

37
8.1
This approach uses a simple econometric model that takes time series data on per capita estimates of fish consumption and GDP in each country to estimate the relationship between them.
The basic panel model is described by the equation below. Country is treated as a fixed effect.
Using this model and projected GDP, it is possible to estimate per capita fish consumption in 2030 for each country. Multiplying these estimates by projected population gives total consump-tion by country.
METHOD 2. PROJECT ION BASED ON TRENDS IN CONSUMPT ION
Fish Consumptioncountry, yr = β x GDPcountry, yr+ αcountry, yr + µcountry, yr
Where α = Unknown intercept for each country β = Coefficient for GDP µ = Error term yr = Year
DATA SOURCES AND RAT IONALE FOR ASSUMPT IONS
This approach and the underlying assumptions have been developed by the FAO and are further described in Cai (2011).
Time series data on GDP is from the World Bank database (www.databank.worldbank.org); fish consumption estimates were obtained from FAO food balance sheets (www.faostat.fao.org).
Population and GDP estimates for 2030 were obtained from the United Nations Population Division and International Monetary Fund, respectively.
F ISH INTAKE
1
2
3
38
GET T ING TO EDEN / A PPENDICES
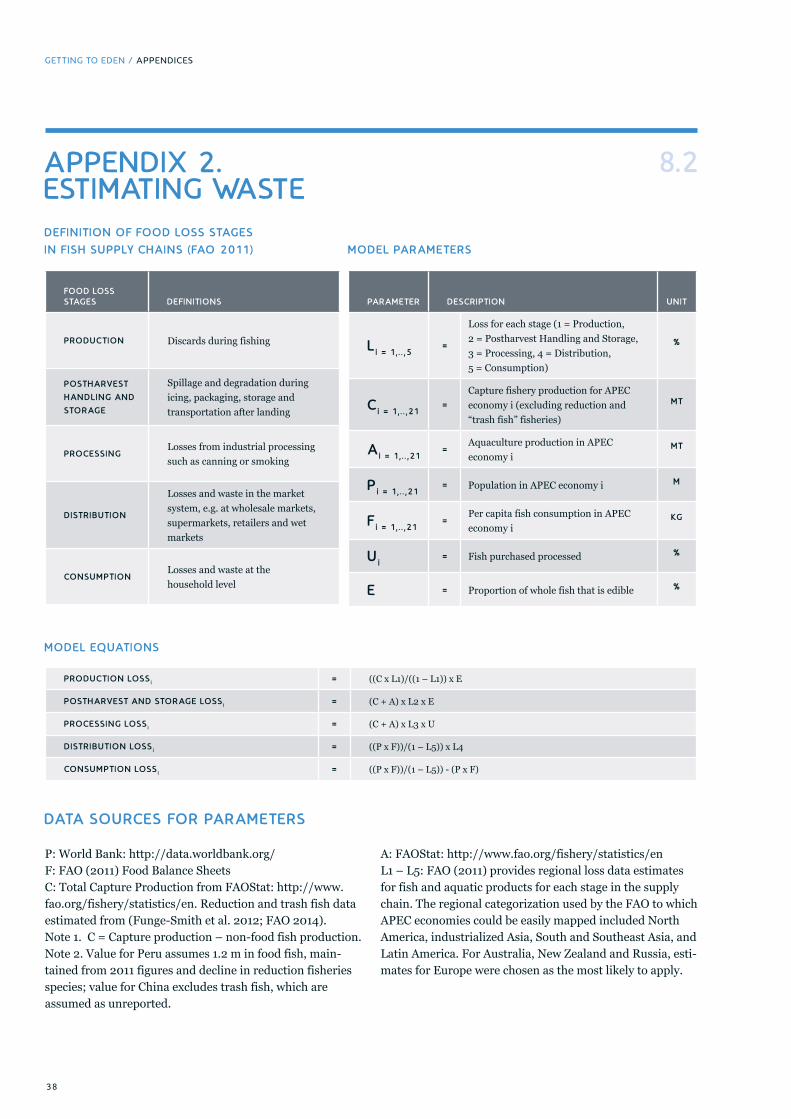
DATA SOURCES FOR PARAMETERS
P: World Bank: http://data.worldbank.org/F: FAO (2011) Food Balance SheetsC: Total Capture Production from FAOStat: http://www.fao.org/fishery/statistics/en. Reduction and trash fish data estimated from (Funge-Smith et al. 2012; FAO 2014). Note 1. C = Capture production – non-food fish production. Note 2. Value for Peru assumes 1.2 m in food fish, main-tained from 2011 figures and decline in reduction fisheries species; value for China excludes trash fish, which are assumed as unreported.
A: FAOStat: http://www.fao.org/fishery/statistics/enL1 – L5: FAO (2011) provides regional loss data estimates for fish and aquatic products for each stage in the supply chain. The regional categorization used by the FAO to which APEC economies could be easily mapped included North America, industrialized Asia, South and Southeast Asia, and Latin America. For Australia, New Zealand and Russia, esti-mates for Europe were chosen as the most likely to apply.
DEF IN IT ION OF FOOD LOSS STAGES
IN F ISH SUPPLY CHA INS (FAO 2011)
MODEL EQUAT IONS
APPENDIX 2. EST IMAT ING WASTE
IN PROGRESS
8.2
FOOD LOSS STAGES DEF INIT IONS
PRODUCT ION Discards during fishing
POSTHARVEST
HANDL ING AND
STORAGE
Spillage and degradation during icing, packaging, storage and transportation after landing
PROCESSINGLosses from industrial processing such as canning or smoking
DISTR IBUT ION
Losses and waste in the market system, e.g. at wholesale markets, supermarkets, retailers and wet markets
CONSUMPT IONLosses and waste at the household level
PARAMETER DESCRIPT ION UNIT
L i = 1, . .,5=
Loss for each stage (1 = Production, 2 = Postharvest Handling and Storage, 3 = Processing, 4 = Distribution, 5 = Consumption)
%
C i = 1, . .,21=
Capture fishery production for APEC economy i (excluding reduction and “trash fish” fisheries)
MT
A i = 1, . .,21=
Aquaculture production in APEC economy i
MT
P i = 1, . .,21= Population in APEC economy i M
F i = 1, . .,21=
Per capita fish consumption in APEC economy i
KG
U i = Fish purchased processed %
E = Proportion of whole fish that is edible %
PRODUCT ION LOSSi = ((C x L1)/((1 – L1)) x E
POSTHARVEST AND STORAGE LOSSi = (C + A) x L2 x E
PROCESSING LOSSi = (C + A) x L3 x U
DISTR IBUT ION LOSSi = ((P x F))/(1 – L5)) x L4
CONSUMPT ION LOSSi = ((P x F))/(1 – L5)) - (P x F)
MODEL PARAMETERS
39
PARAMETER DESCRIPT ION UNIT
L i = 1, . .,5=
Loss for each stage (1 = Production, 2 = Postharvest Handling and Storage, 3 = Processing, 4 = Distribution, 5 = Consumption)
%
C i = 1, . .,21=
Capture fishery production for APEC economy i (excluding reduction and “trash fish” fisheries)
MT
A i = 1, . .,21=
Aquaculture production in APEC economy i
MT
P i = 1, . .,21= Population in APEC economy i M
F i = 1, . .,21=
Per capita fish consumption in APEC economy i
KG
U i = Fish purchased processed %
E = Proportion of whole fish that is edible %
PRODUCT ION LOSSi = ((C x L1)/((1 – L1)) x E
POSTHARVEST AND STORAGE LOSSi = (C + A) x L2 x E
PROCESSING LOSSi = (C + A) x L3 x U
DISTR IBUT ION LOSSi = ((P x F))/(1 – L5)) x L4
CONSUMPT ION LOSSi = ((P x F))/(1 – L5)) - (P x F)
BR IEF ING PA PERS
01 SUSTA IN ING F ISH STOC KS
What are the key levers for improving capture fisheries governance to sustain the resource base – how do these change for different types of fishery?
02 SUSTA IN ING AQUAC ULT URE GROWT H
How do we sustain the growth in aquaculture that is needed?
03 COP ING W IT H C L IMAT E C HA NGE
How can we climate proof our fish production systems?
04 T HE W EA LT H TO W ELFA RE CONT INUUM
What economic roles are wild capture fisheries best placed to play and under what circumstances?
05 T HE F UT URE OF DEMA ND
How will the demand for fish evolve and what are the implications of anticipated changes?
06 MEET ING NEEDS
How can the fish food system best meet the needs of resource-poor consumers to address food and nutrition security challenges?
REPORT S
BELLAG IO WORKSHOP SY NT HES IS REPORT
Toward a global action network for the fish food system.
GET T ING TO EDEN
Building an ideal future for the global fish food system through collective action.
PLEASE SEND ALL COMMENTS TO BP.FEEDBACK@F ISH INGFUTURE .ORG
A LL REPORT S A RE AVA ILA BLE FOR DOW NLOA D AT
WWW.F ISH INGF UT URE .ORG

40
WWW.F ISH INGF UT URE .ORG
F ISHER IES A ND AQUAC ULT URE
IN T HE 21ST C ENT URY:
A N IN IT IAT IV E FOR GLOBA L ACT ION
IN IT IAT IV E SEC RETA R IAT:
Dr. Stephen J. HallWorldFish, Penang, MalaysiaEmail: [email protected]
Andreas SchafferThe Earth Observatory of Singapore, SingaporeEmail: [email protected]
Paper made fromrecycled material
100% RECYCLED