gfia economic impact report
DESCRIPTION
Report detailing the economic impact of Gerald R. Ford International Airport.TRANSCRIPT

Paul Isely, Ph.D., and Gerry Simons, Ph.D.
1/31/2015
THE ECONOMIC IMPACT OF
THE GERALD R. FORD
INTERNATIONAL AIRPORT
1/31/2015
1
THE ECONOMIC IMPACT OF THE GERALD
R. FORD INTERNATIONAL AIRPORT
EXECUTIVE SUMMARY
The Gerald R. Ford International Airport supports or contributes:
40,311 additional jobs in West Michigan.
$3.1 billion in economic output, equivalent to 5.8% of the Muskegon and
Grand Rapids-Wyoming MSAs.
Visitors from outside the region who directly spend $418 million.
Construction that creates 271 jobs during an average year for the last 25
years.
Businesses and governmental units, located at the airport, which contribute
$212 million directly to the West Michigan economy
To the economic efforts of 65% of firms that responded to surveys.
An estimated 6,500 households located within one hour of the airport that
would have chosen not to live there without an airport like the Gerald R.
Ford International Airport.

1/31/2015
2
TABLE OF CONTENTS
EXECUTIVE SUMMARY .............................................................................................................. 1
BACKGROUND ............................................................................................................................. 4
VISITORS ....................................................................................................................................... 6
Survey Summary ........................................................................................................................ 7
Economic Effect ........................................................................................................................ 10
AIRPORT-DEPENDENT BUSINESSES ................................................................................... 12
Ongoing Business ..................................................................................................................... 12
Capital Construction Projects .................................................................................................. 13
NON-AIRPORT-DEPENDENT BUSINESSES ......................................................................... 15
Survey Summary ...................................................................................................................... 15
Economic Effect ........................................................................................................................ 18
Catalytic Effect ......................................................................................................................... 20
CONCLUSION ............................................................................................................................. 21
REFERENCES ............................................................................................................................. 22
APPENDICES .............................................................................................................................. 23
Appendix A ................................................................................................................................ 23
Appendix B ................................................................................................................................ 25
Appendix C ................................................................................................................................ 27

1/31/2015
3
FIGURES
Figure 1: GFIA Total Enplaned and Deplaned Passengers ........................................................ 4
Figure 2: GFIA Air Carrier Operations ........................................................................................ 4
Figure 3: How Far Respondents Live from GFIA ........................................................................ 7
Figure 4: Would Locals Live Here If GFIA Did Not Exist? ......................................................... 8
Figure 5: Duration of Stay by Visitors .......................................................................................... 8
Figure 6: Visitors’ Purpose of Travel ............................................................................................ 9
Figure 7: Visitors’ Average Daily Spending ................................................................................. 9
Figure 8: Business Survey Respondents by Zip Code ................................................................ 16
Figure 9: Number of Full-Time Employees ................................................................................ 16
Figure 10: Number of Part-Time Employees.............................................................................. 17
Figure 11: GFIA’s Impact on Businesses .................................................................................... 18
TABLES
Table 1: Nonstop Flight Destinations from GFIA ........................................................................ 5
Table 2: Average Daily Spending per Visitor per Day ............................................................... 10
Table 3: Estimated Total Direct Spending by Visitors .............................................................. 10
Table 4: Total Impact of Visitors ................................................................................................. 11
Table 5: Impact of Airport-Dependent Firms ............................................................................. 13
Table 6: Average Annual Construction Impact .......................................................................... 14
Table 7: Business Survey Respondents by Sector ...................................................................... 17
Table 8: Employment in West Michigan .................................................................................... 18
Table 9: GFIA’s Impact on Non-Airport-Dependent Firms ....................................................... 19
Table 10: Household Earnings of Individuals Dependent on GFIA ......................................... 20

1/31/2015
4
BACKGROUND
A study of the economic effect of what is now the Gerald R Ford International
Airport (GFIA) was last conducted two decades ago (Vertalka, 1995). Twenty years
later, GFIA serves more passengers (see Figure 1) with fewer air carrier operations
(see Figure 2).
Figure 1: GFIA Total Enplaned and Deplaned Passengers Source: Kent County Department of Aeronautics
Figure 2: GFIA Air Carrier Operations Source: Kent County Department of Aeronautics
During this same time period, the civilian labor force of Kent County alone increased
by approximately 13%, while the nominal per capita personal income increased by
over 66% (Federal Reserve Bank of St. Louis, 2015). The influence of an airport on
0
500,000
1,000,000
1,500,000
2,000,000
2,500,000
1994 1996 1998 2000 2002 2004 2006 2008 2010 2012
0
4,000
8,000
12,000
16,000
20,000
24,000
28,000
1994 1996 1998 2000 2002 2004 2006 2008 2010 2012
1/31/2015
5
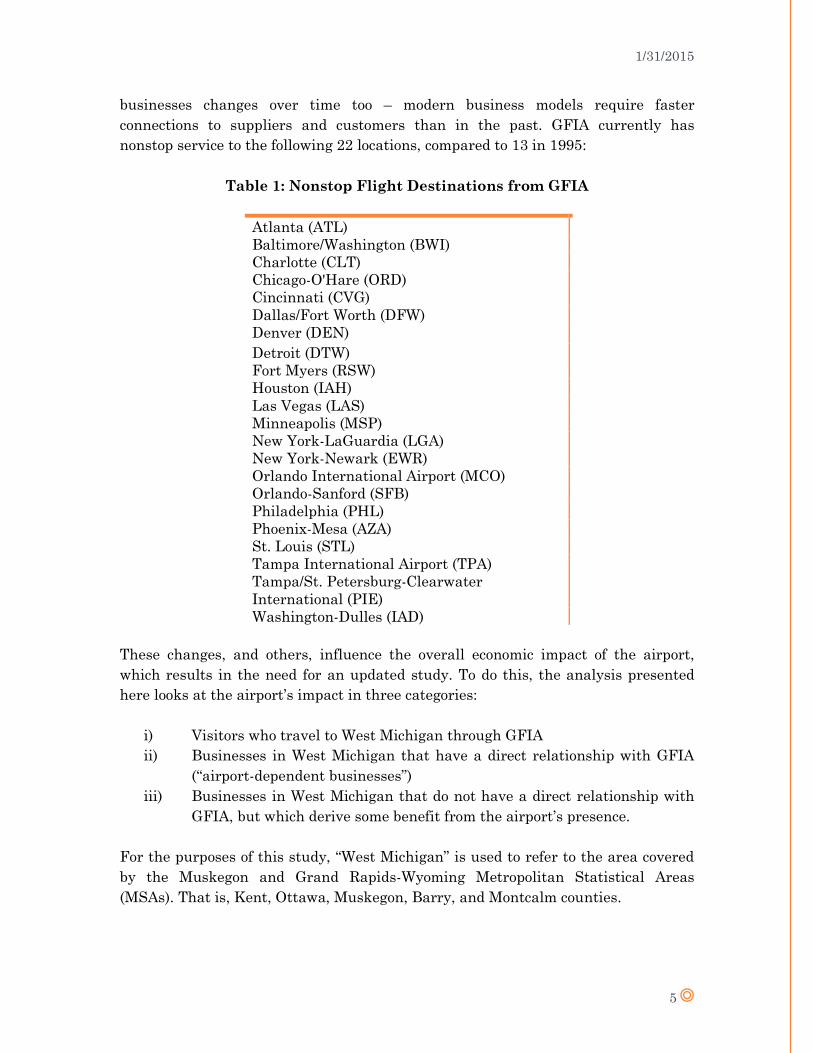
businesses changes over time too – modern business models require faster
connections to suppliers and customers than in the past. GFIA currently has
nonstop service to the following 22 locations, compared to 13 in 1995:
Table 1: Nonstop Flight Destinations from GFIA
Atlanta (ATL)
Baltimore/Washington (BWI)
Charlotte (CLT)
Chicago-O'Hare (ORD)
Cincinnati (CVG)
Dallas/Fort Worth (DFW)
Denver (DEN)
Detroit (DTW)
Fort Myers (RSW)
Houston (IAH)
Las Vegas (LAS)
Minneapolis (MSP)
New York-LaGuardia (LGA)
New York-Newark (EWR)
Orlando International Airport (MCO)
Orlando-Sanford (SFB)
Philadelphia (PHL)
Phoenix-Mesa (AZA)
St. Louis (STL)
Tampa International Airport (TPA)
Tampa/St. Petersburg-Clearwater
International (PIE)
Washington-Dulles (IAD)
These changes, and others, influence the overall economic impact of the airport,
which results in the need for an updated study. To do this, the analysis presented
here looks at the airport’s impact in three categories:
i) Visitors who travel to West Michigan through GFIA
ii) Businesses in West Michigan that have a direct relationship with GFIA
(“airport-dependent businesses”)
iii) Businesses in West Michigan that do not have a direct relationship with
GFIA, but which derive some benefit from the airport’s presence.
For the purposes of this study, “West Michigan” is used to refer to the area covered
by the Muskegon and Grand Rapids-Wyoming Metropolitan Statistical Areas
(MSAs). That is, Kent, Ottawa, Muskegon, Barry, and Montcalm counties.
1/31/2015
6
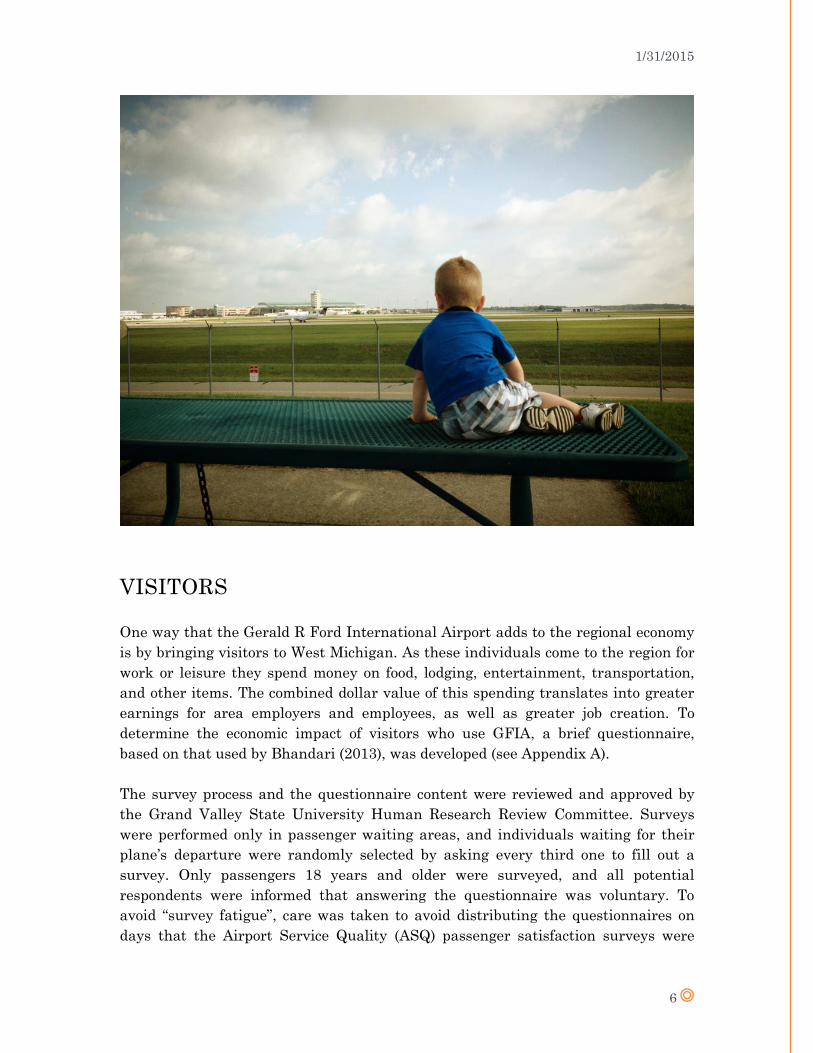
VISITORS
One way that the Gerald R Ford International Airport adds to the regional economy
is by bringing visitors to West Michigan. As these individuals come to the region for
work or leisure they spend money on food, lodging, entertainment, transportation,
and other items. The combined dollar value of this spending translates into greater
earnings for area employers and employees, as well as greater job creation. To
determine the economic impact of visitors who use GFIA, a brief questionnaire,
based on that used by Bhandari (2013), was developed (see Appendix A).
The survey process and the questionnaire content were reviewed and approved by
the Grand Valley State University Human Research Review Committee. Surveys
were performed only in passenger waiting areas, and individuals waiting for their
plane’s departure were randomly selected by asking every third one to fill out a
survey. Only passengers 18 years and older were surveyed, and all potential
respondents were informed that answering the questionnaire was voluntary. To
avoid “survey fatigue”, care was taken to avoid distributing the questionnaires on
days that the Airport Service Quality (ASQ) passenger satisfaction surveys were

1/31/2015
7
being conducted. The surveys were undertaken at random times and days of the
week during August and September 2014. More than 95% of those asked were
willing to help with the survey and, after discarding those with improper or
incomplete responses, this process resulted in 300 completed questionnaires.
Survey Summary
To determine the economic effect of spending by individuals who use GFIA,
questionnaire respondents who live relatively close by had to be differentiated from
visitors to the area. This was accomplished by the survey question “Do you live
within about one hour’s drive from this airport?” If the respondent answered “yes”
then they were considered “locals”. If they answered “no” they were considered
“visitors”. The results are seen in Figure 3.
Figure 3: How Far Respondents Live from GFIA
Respondents were asked to answer a different set of questions depending on
whether they were classified as local or visitor. For local respondents, the primary
question was “Would you have chosen to live where you do if the airport did not
exist?” This provides an indication of people with jobs or lifestyles that require an
airport such as GFIA. The implication here is that the absence of the airport would
result in their economic output being produced somewhere else. This information is
relevant when addressing the “catalytic” effect of businesses below.
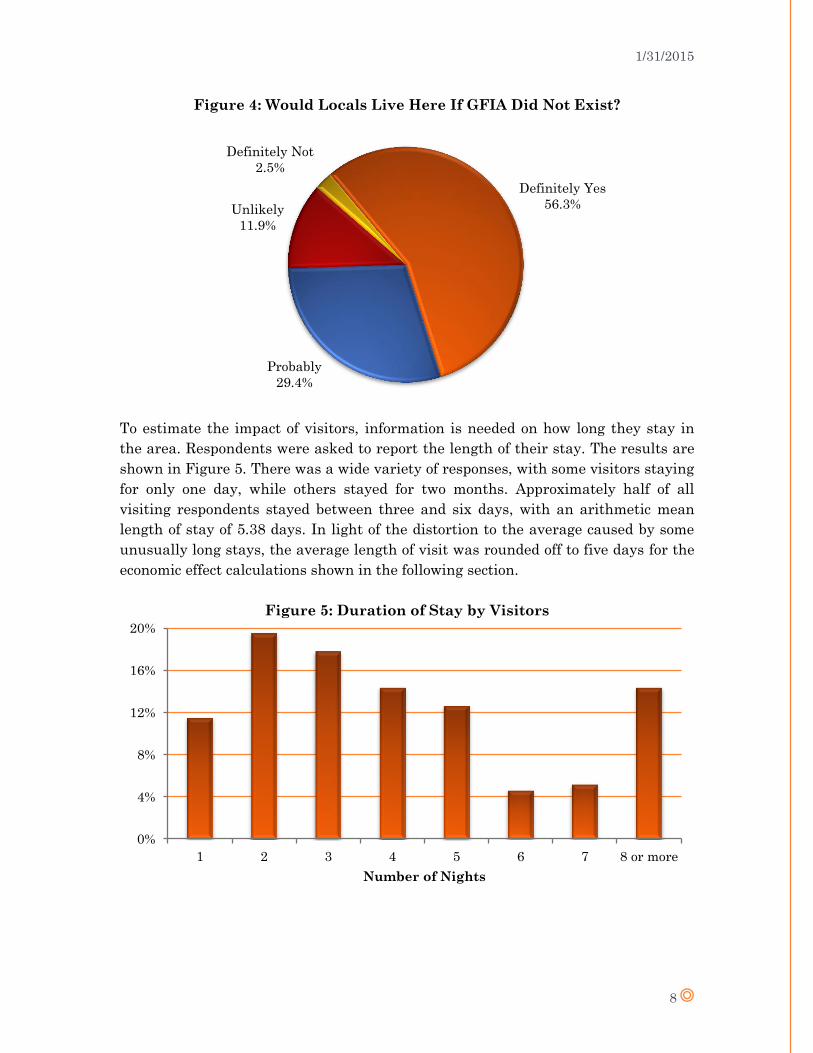
As seen in Figure 4, 14.4% of local respondents indicated that they would be unlikely
to or that they definitely would not live where they do if GFIA did not exist.
Not within one
hour's drive
47.5% Within one
hour's drive
52.5%
1/31/2015
8
Figure 4: Would Locals Live Here If GFIA Did Not Exist?
To estimate the impact of visitors, information is needed on how long they stay in
the area. Respondents were asked to report the length of their stay. The results are
shown in Figure 5. There was a wide variety of responses, with some visitors staying
for only one day, while others stayed for two months. Approximately half of all
visiting respondents stayed between three and six days, with an arithmetic mean
length of stay of 5.38 days. In light of the distortion to the average caused by some
unusually long stays, the average length of visit was rounded off to five days for the
economic effect calculations shown in the following section.
Figure 5: Duration of Stay by Visitors
Definitely Yes
56.3%
Probably
29.4%
Unlikely
11.9%
Definitely Not
2.5%
0%
4%
8%
12%
16%
20%
1 2 3 4 5 6 7 8 or more
Number of Nights
1/31/2015
9
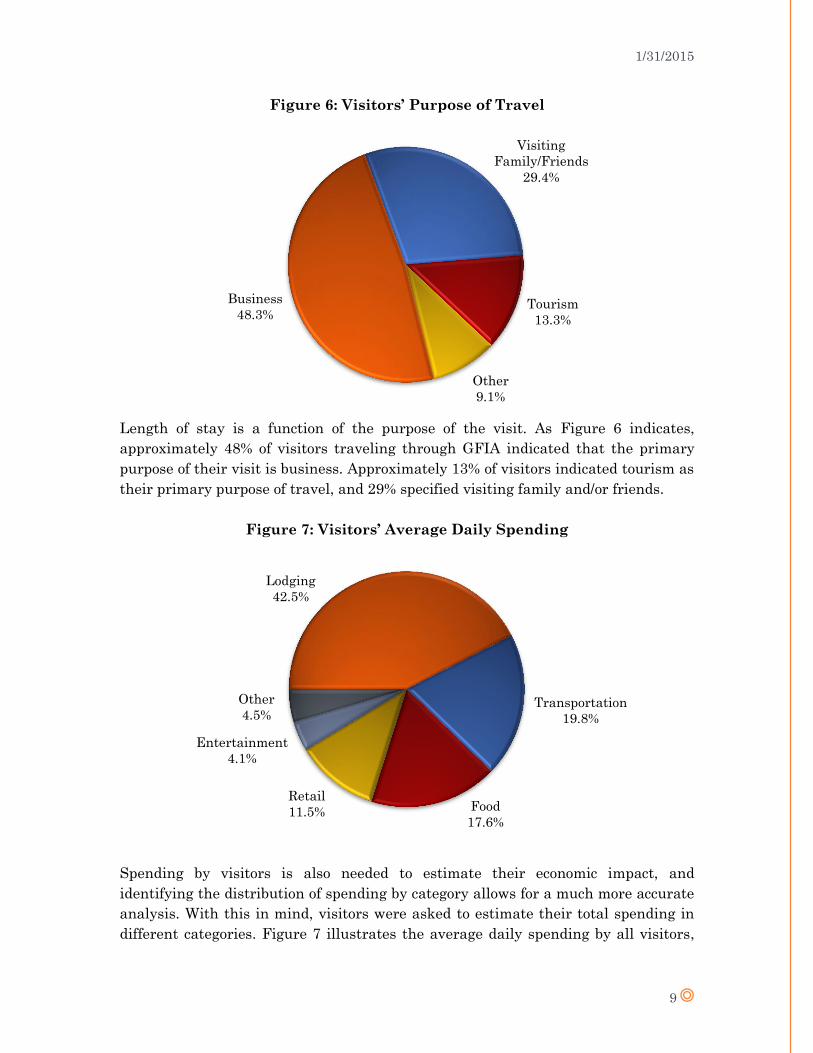
Figure 6: Visitors’ Purpose of Travel
Length of stay is a function of the purpose of the visit. As Figure 6 indicates,
approximately 48% of visitors traveling through GFIA indicated that the primary
purpose of their visit is business. Approximately 13% of visitors indicated tourism as
their primary purpose of travel, and 29% specified visiting family and/or friends.
Figure 7: Visitors’ Average Daily Spending
Spending by visitors is also needed to estimate their economic impact, and
identifying the distribution of spending by category allows for a much more accurate
analysis. With this in mind, visitors were asked to estimate their total spending in
different categories. Figure 7 illustrates the average daily spending by all visitors,
Business
48.3%
Visiting
Family/Friends
29.4%
Tourism
13.3%
Other
9.1%
Lodging
42.5%
Transportation
19.8%
Food
17.6%
Retail
11.5%
Entertainment
4.1%
Other
4.5%

1/31/2015
10
broken up by percentage across the categories. Respondents were directly asked to
estimate their spending for Lodging, Transportation, Food, Retail, and
Entertainment. “Other” refers to any spending that survey respondents did not
attribute to these specific categories. The largest component of visitor spending was
lodging, accounting for approximately 43% of total expenditures by visitors. This is
more than double the next largest category, transportation, which accounts for about
20% of visitors’ expenditures.
Economic Effect
To control for outliers in the questionnaire responses, the top and bottom 5% of
reported expenditures were removed, and averages for the remaining data were
calculated by category of spending. These values are shown in Table 2.
Table 2: Average Daily Spending per Visitor per Day
Activity Spending
Lodging $66.52
Transportation $30.92
Food $27.57
Retail $18.02
Entertainment $6.43
Other $7.07
Total $156.54
Because survey responses came from passengers waiting to enplane, the amount of
direct spending by visitors to West Michigan can be estimated from the total number
of enplaned passengers at GFIA (1,124,969 in 2013), the survey responses for the
proportion of passengers who are visitors, the average length of visit, and the
average daily spending by visitors. The results are summarized in Table 3.
Table 3: Estimated Total Direct Spending by Visitors
Activity Spending
Lodging $177,764,754
Transportation $82,638,974
Food $73,670,111
Retail $48,159,715
Entertainment $17,182,311
Other $18,903,558
Total $418,319,422

1/31/2015
11
Direct spending by visitors also leads to indirect and induced spending. For example,
a visitor to Grand Rapids purchases meals at local restaurants (direct spending).
These restaurants must then purchase more supplies from local food distributors
(indirect spending). Restaurant owners and employees receive more income from the
spending of visitors, and they spend some of that greater income in area stores
(induced spending). The dollar amount, and effect on employment, of indirect and
induced spending can be estimated using the Regional Input-Output Modeling
System (RIMS II) multipliers developed by the U.S. Department of Commerce’s
Bureau of Economic Analysis1. In this way, the total impact of visitors to the West
Michigan area can be calculated. These effects are shown in Table 4.
Table 4: Total Impact of Visitors
Category Impact
Direct Spending $418,319,422
Indirect and Induced Spending $233,067,227
Total Output $651,386,649
Total Earnings $186,759,821
Total Employment 7,541
Thus, the estimated annual effect of visitors coming to West Michigan through GFIA
is approximately $651 million in additional production of goods and services, $187
million in additional earnings, and 7500 in additional employment. Adjusted for
inflation, this increase in output represents a 69% increase from the estimate in the
1995 report, on a 43% increase in enplaned passengers.
1 Please note that the BEA does not endorse any estimates or conclusions concerning the
study presented here.
1/31/2015
12
AIRPORT-DEPENDENT BUSINESSES
Airport-dependent businesses – tenants and off-site businesses with a direct
relationship with GFIA – also add to the local and regional economy. This is the
clearest effect of the airport, as there would be no direct substitute for the jobs and
output generated by those businesses. In addition, GFIA undertakes capital
construction projects. These one-off projects, such as the completion of the Terminal
Area and Parking Improvement Program in 2009, have a different economic impact
than ongoing business relationships, so these two categories are analyzed
separately.
Ongoing Business
To determine the economic impact of airport-dependent businesses, a brief
questionnaire was developed (see Appendix B). The survey process and the
questionnaire content were reviewed and approved by the Grand Valley State
University Human Research Review Committee. Initially, the survey was mailed to
50% of GFIA tenants and 61 businesses that were identified by the Kent County
Department of Aeronautics as having a direct relationship with GFIA. However,
1/31/2015
13
even after follow-up attempts, the response rate to the questionnaire was too low to
be reliable. As a result, databases from Demographics Now, LexisNexis, and On the
Map were used to estimate the number of workers for the majority of these locations.
Local and national norms were used to estimate the number of workers for locations
where no data were available. The number of workers was then used to estimate
output using BEA RIMS II multipliers.
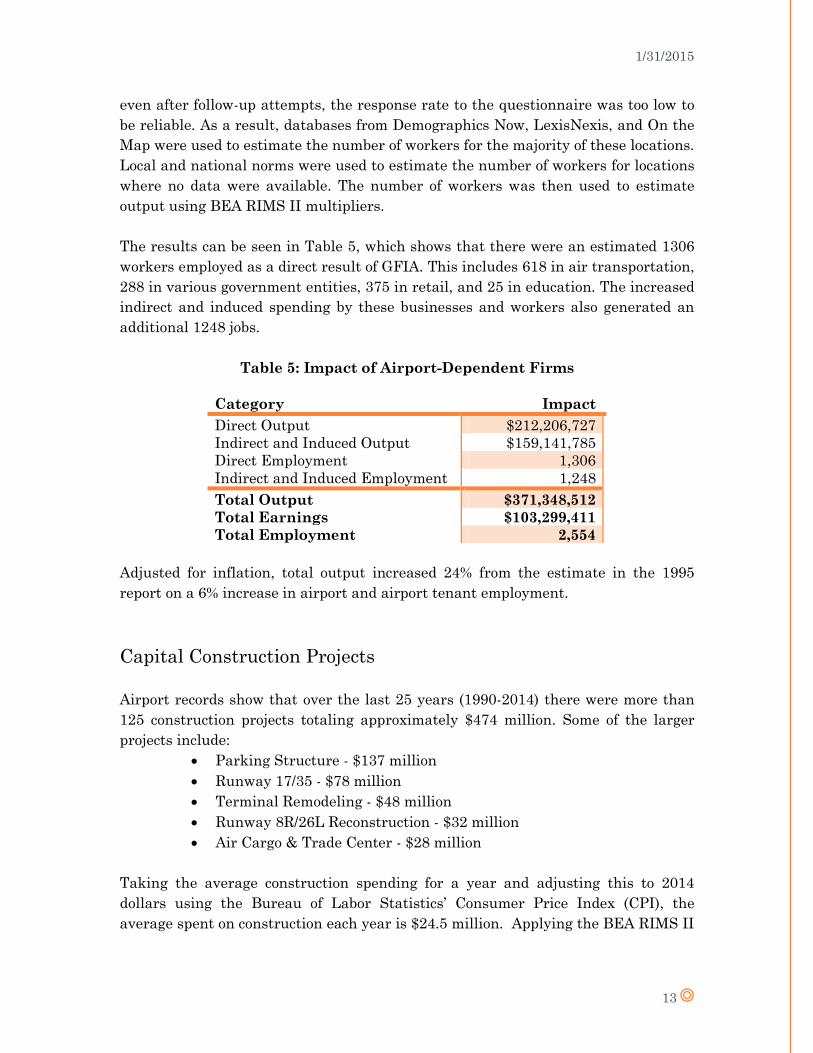
The results can be seen in Table 5, which shows that there were an estimated 1306
workers employed as a direct result of GFIA. This includes 618 in air transportation,
288 in various government entities, 375 in retail, and 25 in education. The increased
indirect and induced spending by these businesses and workers also generated an
additional 1248 jobs.
Table 5: Impact of Airport-Dependent Firms
Category Impact
Direct Output $212,206,727
Indirect and Induced Output $159,141,785
Direct Employment 1,306
Indirect and Induced Employment 1,248
Total Output $371,348,512
Total Earnings $103,299,411
Total Employment 2,554
Adjusted for inflation, total output increased 24% from the estimate in the 1995
report on a 6% increase in airport and airport tenant employment.
Capital Construction Projects
Airport records show that over the last 25 years (1990-2014) there were more than
125 construction projects totaling approximately $474 million. Some of the larger
projects include:
Parking Structure - $137 million
Runway 17/35 - $78 million
Terminal Remodeling - $48 million
Runway 8R/26L Reconstruction - $32 million
Air Cargo & Trade Center - $28 million
Taking the average construction spending for a year and adjusting this to 2014
dollars using the Bureau of Labor Statistics’ Consumer Price Index (CPI), the
average spent on construction each year is $24.5 million. Applying the BEA RIMS II
1/31/2015
14
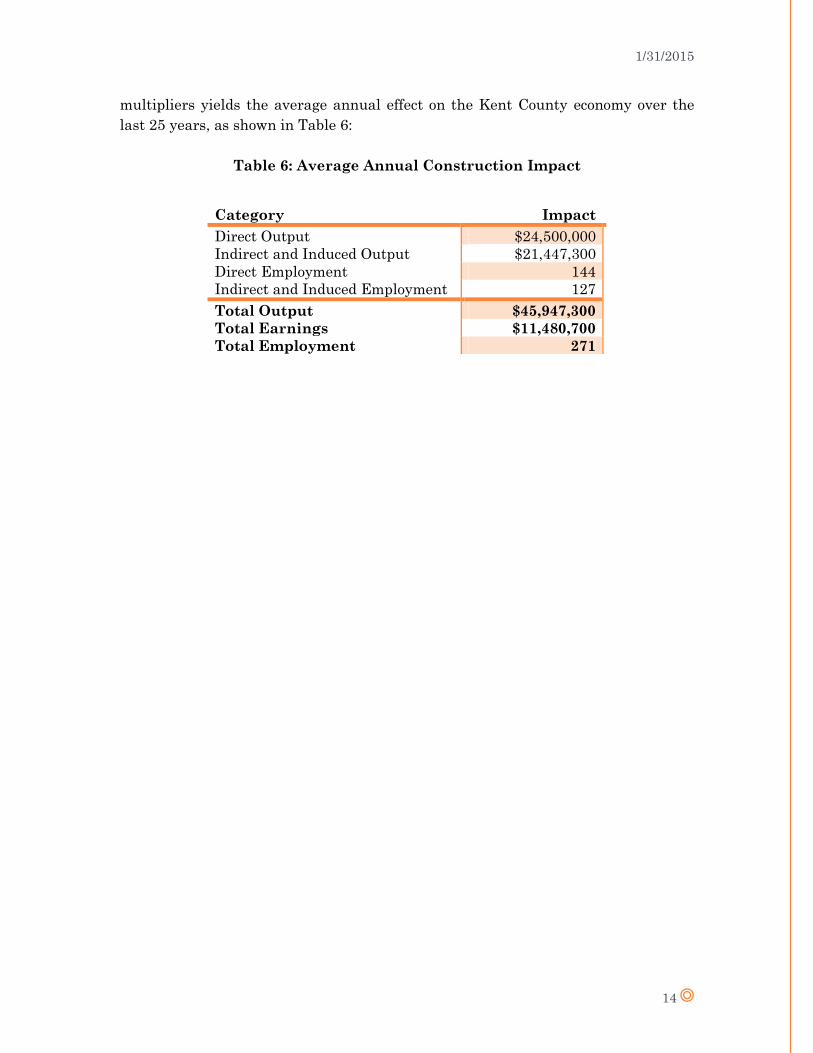
multipliers yields the average annual effect on the Kent County economy over the
last 25 years, as shown in Table 6:
Table 6: Average Annual Construction Impact
Category Impact
Direct Output $24,500,000
Indirect and Induced Output $21,447,300
Direct Employment 144
Indirect and Induced Employment 127
Total Output $45,947,300
Total Earnings $11,480,700
Total Employment 271

1/31/2015
15
NON-AIRPORT-DEPENDENT BUSINESSES
Survey Summary
A brief questionnaire was also developed to determine the economic impact of
businesses that do not have a direct relationship with GFIA (see Appendix C). The
survey process and the questionnaire content were reviewed and approved by the
Grand Valley State University Human Research Review Committee. The survey was
mailed to 800 firms, with 50 or more employees, in Kent, Ottawa, Muskegon, and
Allegan counties. From this sample there was a 20% response rate.
To determine if this is a representative sample, key statistics are compared to the
overall population of firms in West Michigan. The results can be seen in Figures 8 -
10 and Tables 7 and 8. The distribution of firms that responded by size, location, and
industry match closely to the results expected from a random draw of firms, with
one primary exception. The number of firms in the manufacturing sector was over

1/31/2015
16
sampled. However, when compared to overall jobs and economic impact the sample
of manufacturing firms more closely matches the baseline population. As a result,
the sample results are applied to the population of firms to determine the economic
effect.
Figure 8: Business Survey Respondents by Zip Code
Figure 9: Number of Full-Time Employees (Median = 68)
0%
2%
4%
6%
8%
10%
12%
49010
49080
49301
49315
49321
49328
49331
49341
49348
49401
49404
49417
49418
49422
49423
49424
49426
49428
49435
49437
49440
49441
49442
49444
49445
49453
49456
49464
49503
49504
49505
49506
49507
49508
49509
49512
49518
49519
49525
49534
49544
49546
49548
0%
5%
10%
15%
20%
25%
30%
35%
40%
0-50 51-100 101-150 151-200 201 or more
1/31/2015
17
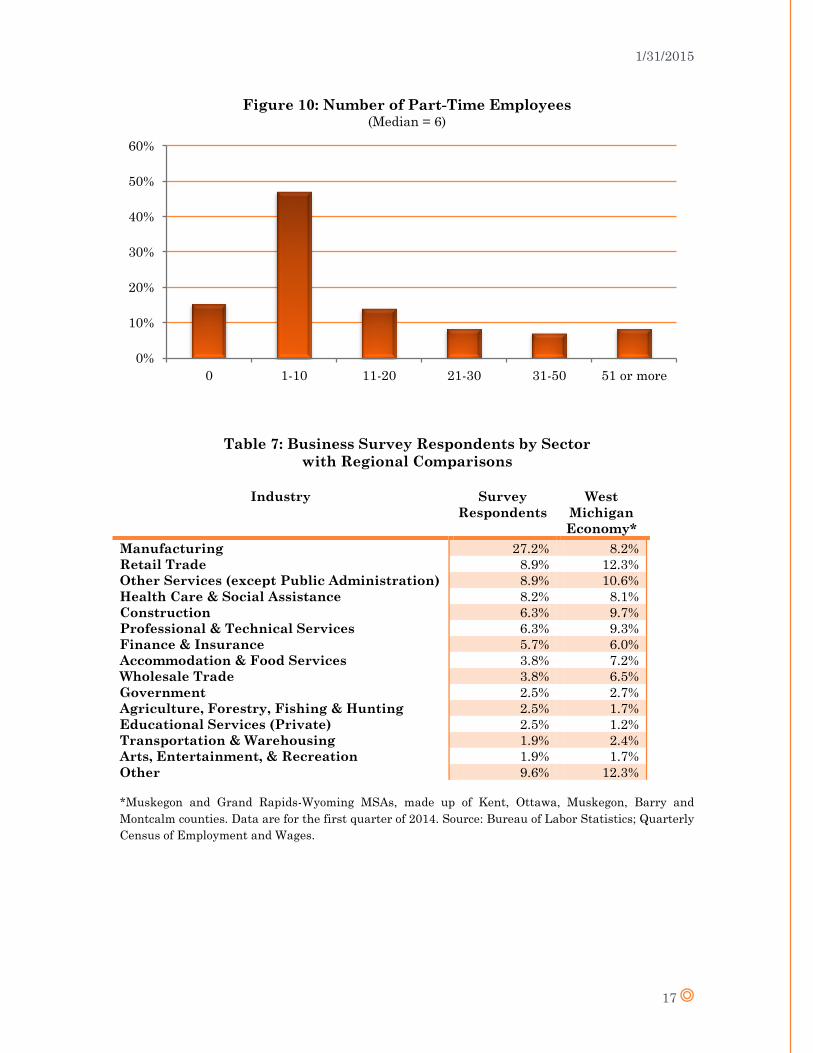
Figure 10: Number of Part-Time Employees (Median = 6)
Table 7: Business Survey Respondents by Sector
with Regional Comparisons
Industry Survey
Respondents
West
Michigan
Economy*
Manufacturing 27.2% 8.2%
Retail Trade 8.9% 12.3%
Other Services (except Public Administration) 8.9% 10.6%
Health Care & Social Assistance 8.2% 8.1%
Construction 6.3% 9.7%
Professional & Technical Services 6.3% 9.3%
Finance & Insurance 5.7% 6.0%
Accommodation & Food Services 3.8% 7.2%
Wholesale Trade 3.8% 6.5%
Government 2.5% 2.7%
Agriculture, Forestry, Fishing & Hunting 2.5% 1.7%
Educational Services (Private) 2.5% 1.2%
Transportation & Warehousing 1.9% 2.4%
Arts, Entertainment, & Recreation 1.9% 1.7%
Other 9.6% 12.3%
*Muskegon and Grand Rapids-Wyoming MSAs, made up of Kent, Ottawa, Muskegon, Barry and
Montcalm counties. Data are for the first quarter of 2014. Source: Bureau of Labor Statistics; Quarterly
Census of Employment and Wages.
0%
10%
20%
30%
40%
50%
60%
0 1-10 11-20 21-30 31-50 51 or more
1/31/2015
18
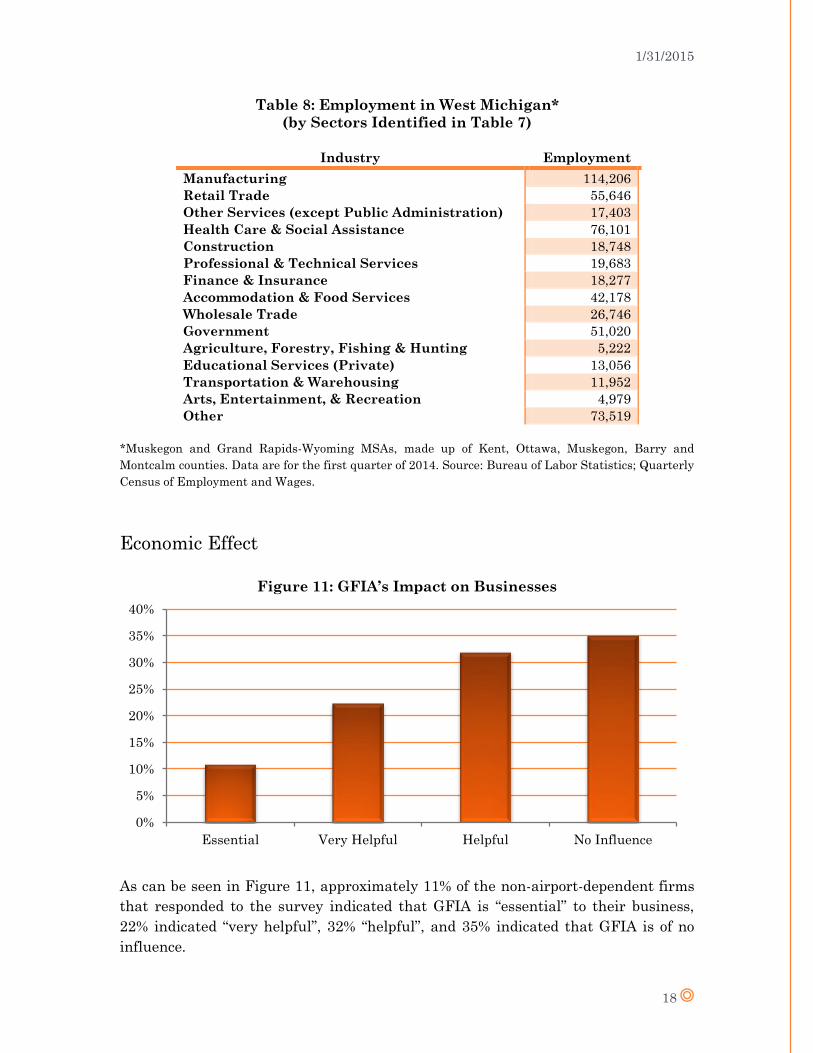
Table 8: Employment in West Michigan*
(by Sectors Identified in Table 7)
Industry Employment
Manufacturing 114,206
Retail Trade 55,646
Other Services (except Public Administration) 17,403
Health Care & Social Assistance 76,101
Construction 18,748
Professional & Technical Services 19,683
Finance & Insurance 18,277
Accommodation & Food Services 42,178
Wholesale Trade 26,746
Government 51,020
Agriculture, Forestry, Fishing & Hunting 5,222
Educational Services (Private) 13,056
Transportation & Warehousing 11,952
Arts, Entertainment, & Recreation 4,979
Other 73,519
*Muskegon and Grand Rapids-Wyoming MSAs, made up of Kent, Ottawa, Muskegon, Barry and
Montcalm counties. Data are for the first quarter of 2014. Source: Bureau of Labor Statistics; Quarterly
Census of Employment and Wages.
Economic Effect
Figure 11: GFIA’s Impact on Businesses
As can be seen in Figure 11, approximately 11% of the non-airport-dependent firms
that responded to the survey indicated that GFIA is “essential” to their business,
22% indicated “very helpful”, 32% “helpful”, and 35% indicated that GFIA is of no
influence.
0%
5%
10%
15%
20%
25%
30%
35%
40%
Essential Very Helpful Helpful No Influence
1/31/2015
19
On average, these respondents indicated that 6.8% of their revenue could be
attributed to the existence of GFIA. Because the impact of visitors has already been
calculated, the responses from arts, entertainment, recreation, accommodation, and
food services firms are removed, thereby avoiding double counting. The result is that
6.6% of the revenue from firms that do not have a direct relationship with GFIA can
be attributed to the presence of the airport.
Current Gross Domestic Product (GDP) is not available at the county level.
However, using the data for the Grand Rapids-Wyoming and Muskegon MSAs, the
GDP for Kent, Ottawa, Muskegon, Barry and Montcalm counties combined was
$53.37 billion in 2013. Excluding arts, entertainment, recreation, accommodation,
and food services firms gives a GDP of $51.82 billion. If the businesses that
responded to the survey are representative of all firms in this region, then the above
6.6% amounts to an effect of approximately $3.4 billion per year due to the existence
of GFIA.
This type of calculation should be used with care as it is influenced by non-response
bias. In other words, if a firm does not use the airport it is more likely to not fill out
a survey about the airport. Therefore, it is likely that among those that did not
respond, there is a higher proportion of firms with none of their revenue attributed
to the airport. This implies that the above estimate of $3.4 billion is too high.
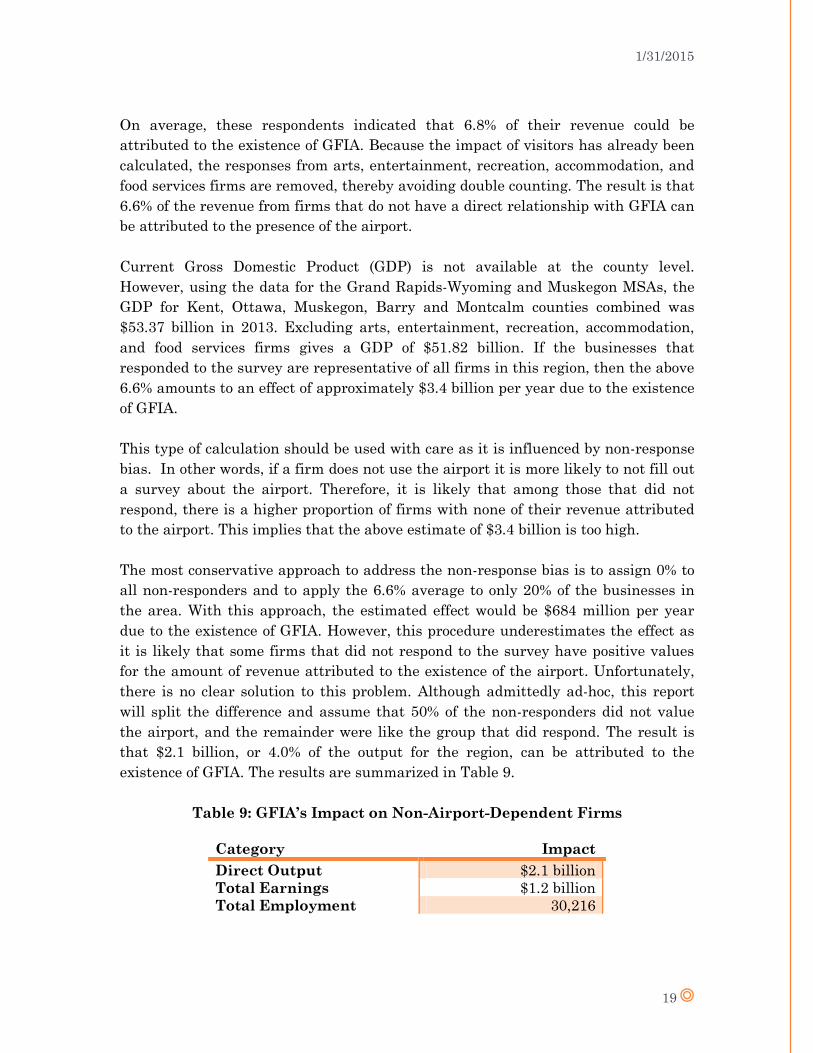
The most conservative approach to address the non-response bias is to assign 0% to
all non-responders and to apply the 6.6% average to only 20% of the businesses in
the area. With this approach, the estimated effect would be $684 million per year
due to the existence of GFIA. However, this procedure underestimates the effect as
it is likely that some firms that did not respond to the survey have positive values
for the amount of revenue attributed to the existence of the airport. Unfortunately,
there is no clear solution to this problem. Although admittedly ad-hoc, this report
will split the difference and assume that 50% of the non-responders did not value
the airport, and the remainder were like the group that did respond. The result is
that $2.1 billion, or 4.0% of the output for the region, can be attributed to the
existence of GFIA. The results are summarized in Table 9.
Table 9: GFIA’s Impact on Non-Airport-Dependent Firms
Category Impact
Direct Output $2.1 billion
Total Earnings $1.2 billion
Total Employment 30,216
1/31/2015
20
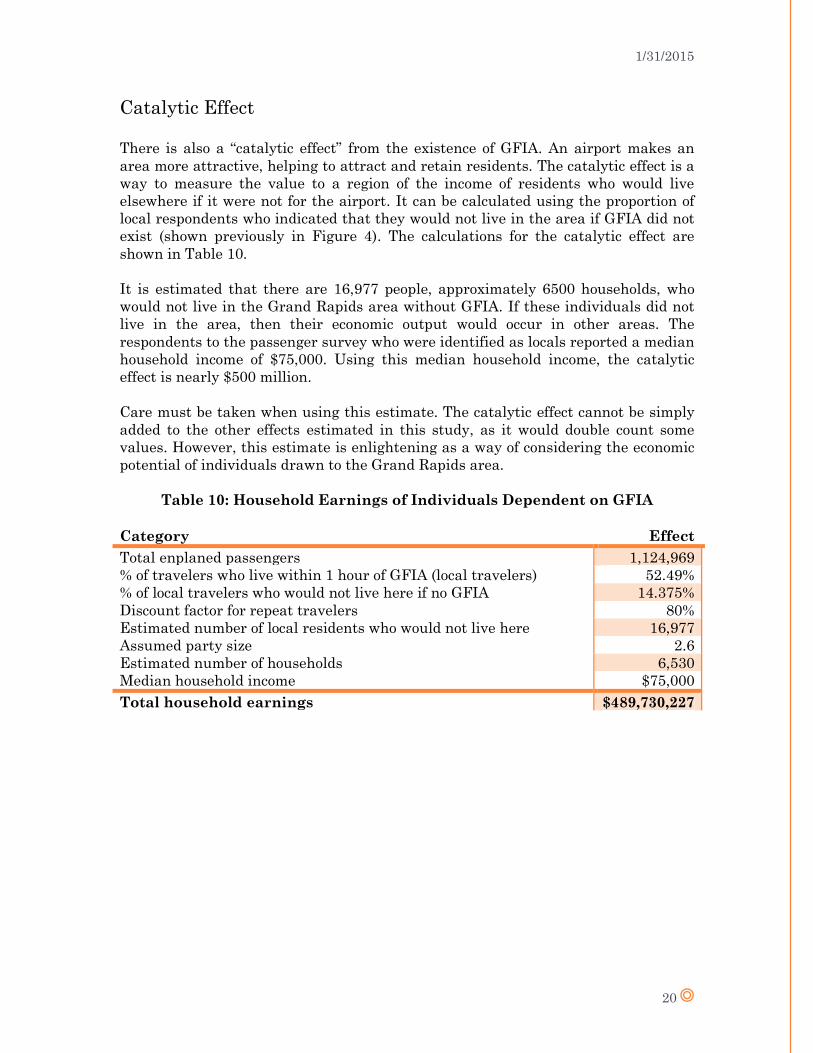
Catalytic Effect
There is also a “catalytic effect” from the existence of GFIA. An airport makes an
area more attractive, helping to attract and retain residents. The catalytic effect is a
way to measure the value to a region of the income of residents who would live
elsewhere if it were not for the airport. It can be calculated using the proportion of
local respondents who indicated that they would not live in the area if GFIA did not
exist (shown previously in Figure 4). The calculations for the catalytic effect are
shown in Table 10.
It is estimated that there are 16,977 people, approximately 6500 households, who
would not live in the Grand Rapids area without GFIA. If these individuals did not
live in the area, then their economic output would occur in other areas. The
respondents to the passenger survey who were identified as locals reported a median
household income of $75,000. Using this median household income, the catalytic
effect is nearly $500 million.
Care must be taken when using this estimate. The catalytic effect cannot be simply
added to the other effects estimated in this study, as it would double count some
values. However, this estimate is enlightening as a way of considering the economic
potential of individuals drawn to the Grand Rapids area.
Table 10: Household Earnings of Individuals Dependent on GFIA
Category Effect
Total enplaned passengers 1,124,969
% of travelers who live within 1 hour of GFIA (local travelers) 52.49%
% of local travelers who would not live here if no GFIA 14.375%
Discount factor for repeat travelers 80%
Estimated number of local residents who would not live here 16,977
Assumed party size 2.6
Estimated number of households 6,530
Median household income $75,000
Total household earnings $489,730,227

1/31/2015
21
CONCLUSION
Gerald R. Ford International Airport has an important role in the economy of West
Michigan. Three of the economic effect categories do not overlap, so these impacts
can be added together. Visitors and airport-dependent businesses are the most direct
effects of the airport. The non-airport-dependent business category is not as clearly
observable, but this category was designed to exclude businesses around the airport
or businesses that would be directly related to visitors, so that the effects could be
added to that of the first two sections. The other two categories of impacts – capital
construction projects and catalytic effects – cannot be added to the non–airport-
dependent business section because there are overlaps that would double count. The
end result is that GFIA supports an estimated 40,311 jobs across Kent, Ottawa,
Muskegon, Barry and Montcalm counties, with 25% of these jobs directly related to
visitors, the airport, and airport-dependent businesses. The total output resulting
from the added employment is approximately $3.1 billion. The effect is more than
5.8% of the economic output of the Muskegon and Grand Rapids-Wyoming MSAs.
1/31/2015
22
REFERENCES
Bhandari, D. (2013). “Economic Impacts of Albuquerque Airport System on the New
Mexico Economy.” University of New Mexico Bureau of Business and
Economic Research, Albuquerque, NM.
Federal Reserve Bank of St. Louis. (2015). “Federal Reserve Economic Data.” Web.
30 Jan. 2015.
Karlsson, J., Ludders, J., Wilde, D., Mochrie, D., and C. Seymour. (2008). “Airport
Cooperative Research Program (ACRP) Synthesis 7. Airport Economic Impact
Methods and Models: A Synthesis of Airport Practice.” Transportation
Research Board, Washington, D.C.
Vertalka, S. (1995). “Community Benefits Assessment of Kent County International
Airport to the Grand Rapids Area.” Bureau of Transportation Planning,
Michigan Department of Transportation, Lansing, MI.
1/31/2015
23
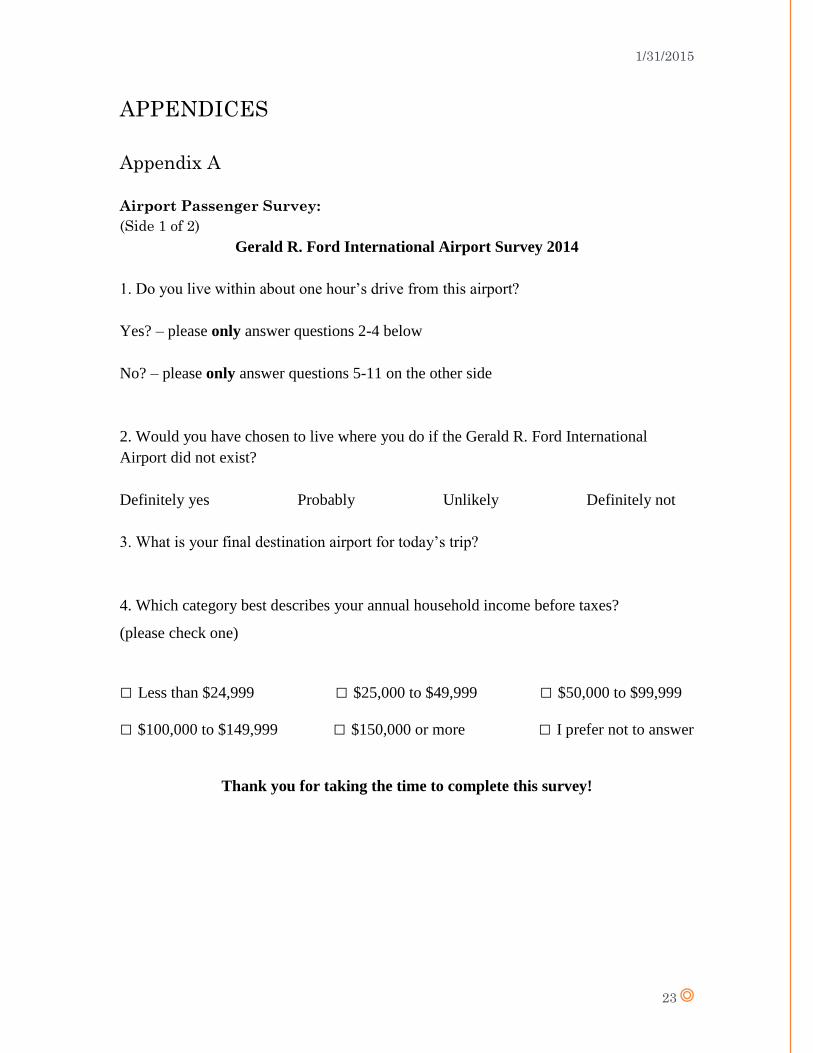
APPENDICES
Appendix A
Airport Passenger Survey:
(Side 1 of 2)
Gerald R. Ford International Airport Survey 2014
1. Do you live within about one hour’s drive from this airport?
Yes? – please only answer questions 2-4 below
No? – please only answer questions 5-11 on the other side
2. Would you have chosen to live where you do if the Gerald R. Ford International
Airport did not exist?
Definitely yes Probably Unlikely Definitely not
3. What is your final destination airport for today’s trip?
4. Which category best describes your annual household income before taxes?
(please check one)
□ Less than $24,999 □ $25,000 to $49,999 □ $50,000 to $99,999
□ $100,000 to $149,999 □ $150,000 or more □ I prefer not to answer
Thank you for taking the time to complete this survey!

1/31/2015
24
(Side 2 of 2)
5. What is your final destination airport for today’s trip?
6. What was the primary purpose of your visit to this area? Business, tourism,
other (please specify):
7. In what area did you stay? Grand Rapids, Holland, other (please specify):
8. How many nights did you stay? 5. How many people in your party?
9. If Gerald R. Ford International Airport did not exist, would you still have made
the trip? (please circle one)
Definitely yes Probably Unlikely Definitely not
10. Please estimate the total amount your entire party spent on your visit for:
Ground transportation (car rental, gas, taxi, etc.): $
Entertainment (golf, concerts, etc.): $
Retail spending on goods/services: $ Lodging: $
Food and drink: $ Other: $
11. Which category best describes your annual household income before taxes?
(please check one)
□ Less than $24,999 □ $25,000 to $49,999 □ $50,000 to $99,999
□ $100,000 to $149,999 □ $150,000 or more □ I prefer not to answer
1/31/2015
25
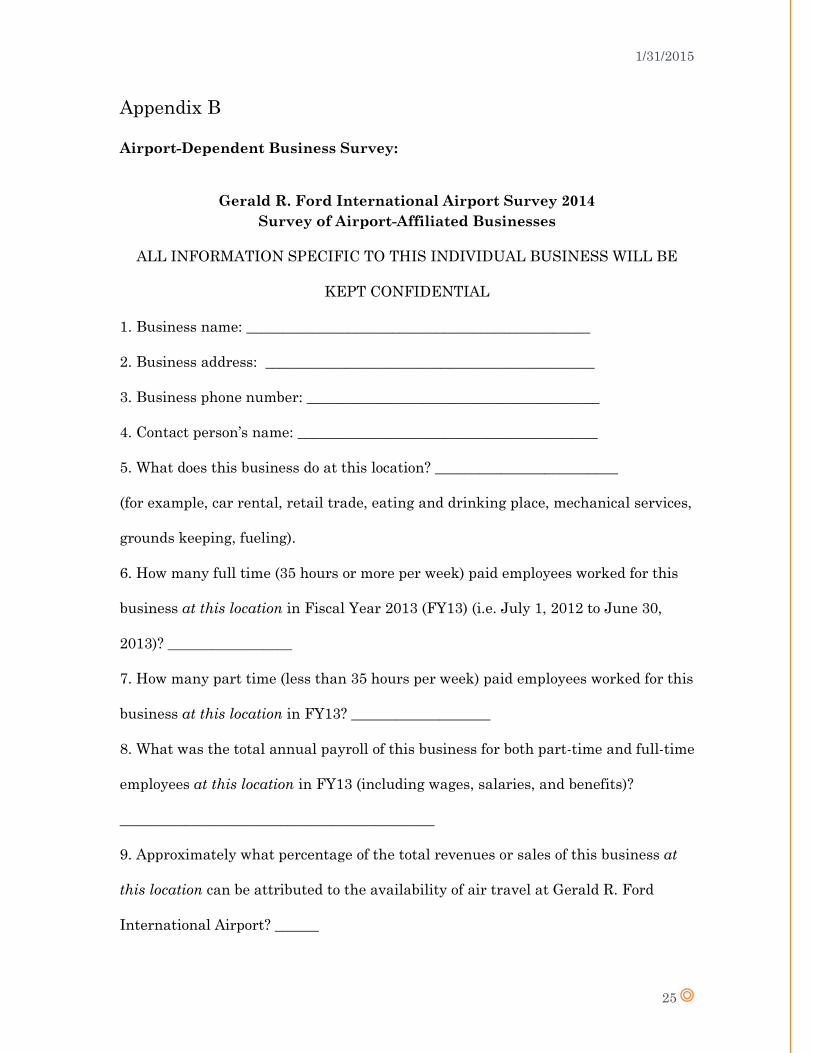
Appendix B
Airport-Dependent Business Survey:
Gerald R. Ford International Airport Survey 2014
Survey of Airport-Affiliated Businesses
ALL INFORMATION SPECIFIC TO THIS INDIVIDUAL BUSINESS WILL BE
KEPT CONFIDENTIAL
1. Business name: _______________________________________________
2. Business address: _____________________________________________
3. Business phone number: ________________________________________
4. Contact person’s name: _________________________________________
5. What does this business do at this location? _________________________
(for example, car rental, retail trade, eating and drinking place, mechanical services,
grounds keeping, fueling).
6. How many full time (35 hours or more per week) paid employees worked for this
business at this location in Fiscal Year 2013 (FY13) (i.e. July 1, 2012 to June 30,
2013)? _________________
7. How many part time (less than 35 hours per week) paid employees worked for this
business at this location in FY13? ___________________
8. What was the total annual payroll of this business for both part-time and full-time
employees at this location in FY13 (including wages, salaries, and benefits)?
___________________________________________
9. Approximately what percentage of the total revenues or sales of this business at
this location can be attributed to the availability of air travel at Gerald R. Ford
International Airport? ______
1/31/2015
26
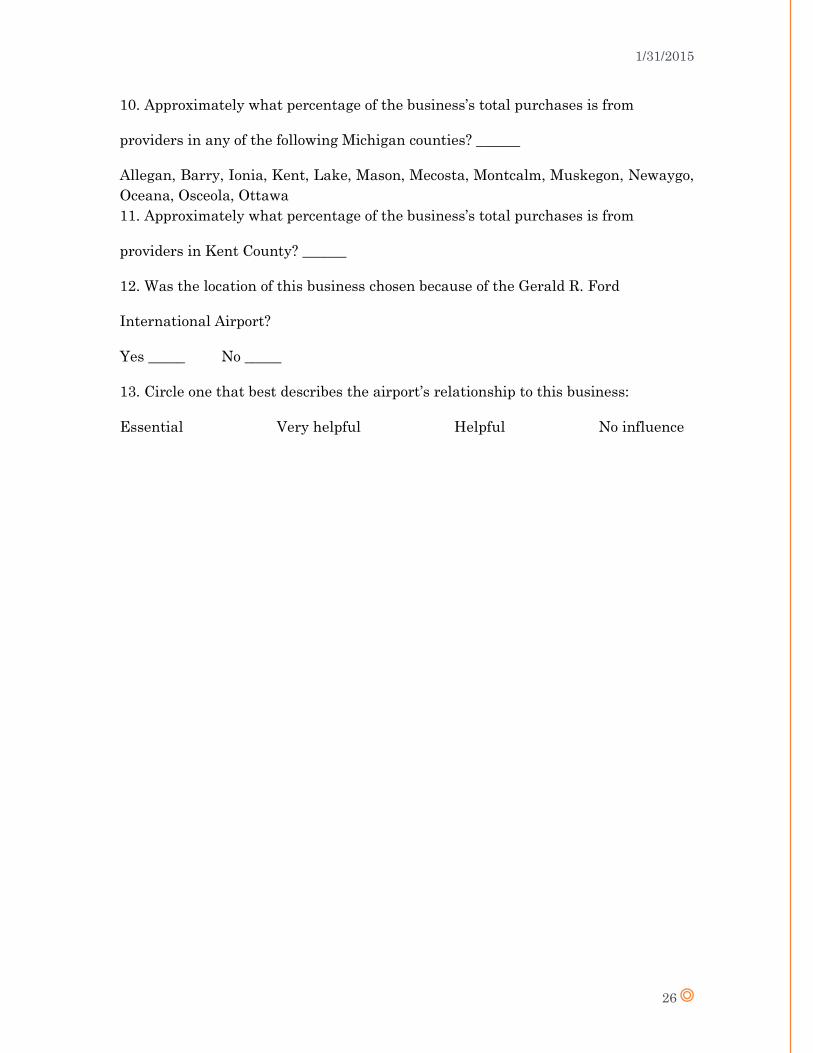
10. Approximately what percentage of the business’s total purchases is from
providers in any of the following Michigan counties? ______
Allegan, Barry, Ionia, Kent, Lake, Mason, Mecosta, Montcalm, Muskegon, Newaygo,
Oceana, Osceola, Ottawa
11. Approximately what percentage of the business’s total purchases is from
providers in Kent County? ______
12. Was the location of this business chosen because of the Gerald R. Ford
International Airport?
Yes _____ No _____
13. Circle one that best describes the airport’s relationship to this business:
Essential Very helpful Helpful No influence

1/31/2015
27
Appendix C
Non-Airport-Dependent Business Survey:
Gerald R. Ford International Airport Survey 2014
Survey of Businesses
1. What is the Zip Code for this business at this location? _____________________
2. How many full time (35 hours or more per week) paid employees worked for this
business at this location in your last fiscal year? ________________________
3. How many part time (less than 35 hours per week) paid employees worked for this
business at this location in your last fiscal year? ________________________
4. Approximately what proportion of the total revenues or sales of this business can
be attributed to the availability of air travel at Gerald R. Ford International Airport?
_______
5. Please indicate the category of business done at this location: ____________
(for example, motor vehicle manufacturing, construction, real estate, lodging, rail
transportation, oil and gas extraction, food services, wholesale trade, machinery
manufacturing, retail trade, furniture manufacturing, etc.)
6. Was the location of this business chosen because of the Gerald R. Ford
International Airport? Yes _____ No _____
7. Circle one that best describes the Gerald R. Ford International Airport’s
relationship to this business: Essential Very helpful Helpful
No influence