ggd-87-82fs asylum: approval rates for selected … seventy-seven percent of the asylum applications...
TRANSCRIPT

.I .I. .-. _l-----.~__- _ United Stakes General Accountin# Of&e / 317% ‘GA!0 Fact Sheet for the Honorable
s \ Arlen Specter,‘United States Senate
Junk 1987 ASYLUM
Approval Rates for Selected Applicants
133178

.
B-224935
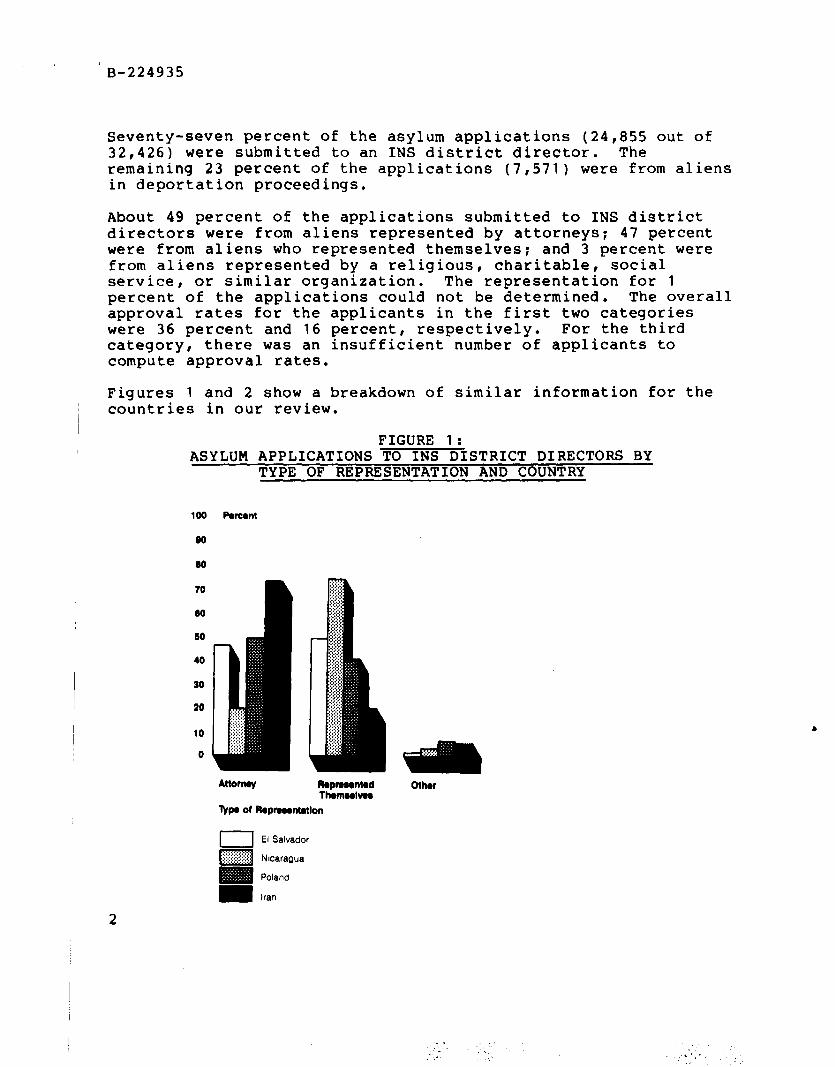
Seventy-seven percent of the asylum applications (24,855 out of 32,426) were submitted to an INS district director. The remaining 23 percent of the applications (7,571) were from aliens in deportation proceedings.
About 49 percent of the applications submitted to INS district directors were from aliens represented by attorneys; 47 percent were from aliens who represented themselves; and 3 percent were from aliens represented by a religious, charitable, social service, or similar organization. The representation for 1 percent of the applications could not be determined. The overall approval rates for the applicants in the first two categories were 36 percent and 16 percent, respectively. For the third category, there was an insufficient number of applicants to compute approval rates.
Figures 1 and 2 show a breakdown of similar information for the countries in our review.
FIGURE 1: ASYLUM APPLICATIONS TO INS DISTRICT DIRECTORS BY
TYPE OF REPRESENTATION AND COUNTRY
100
00
00
70
80
10
40
30
30
10
0
Pucrnt
Att0rw Ropmwnwd Thrmwlw~
l)rpa of RopmwnWon
Other
El Salvador @ggj Nicaragua
Poland
m Iran
2

GAO llnited State% General Accounting Office Washington, DC 20548
General Government Division
B-224935
June 4,1987
The Honorable Arlen Specter United States Senate
Dear Senator Specter:
In response to your request, we issued a briefing report’ on the judging of claims for asylum in the United States by the Department of Justice (DOJ) and the Department of State. The Refugee Act of 1980 authorizes the Attorney General to grant asylum to aliens. The Attorney General requests the Department of State to provide an advisory opinion on the applicant’s eligibility.
Your office subsequently requested that we provide additional data on asylum applicants in total and separately for those applying from El Salvador, Nicaragua, Poland, and Iran. You asked us to provide data on approval rates for those who, at the time they applied for asylum, were (1) represented by attorneys, private or public groups, or themselves and (2) detained or released on an immigration bond or on their own recognizance. The scope and methodology used in collecting and analyzing the data presented in this fact sheet are the same as described in our January 9, 1987, report. Essen- tially we reviewed 1,450 asylum applications taken from, and projected to, a universe of 32,426 applications on which the Department of State gave an advisory opinion in calendar year 1984. For ease of presentation, we use applicants and applications interchangeably, even though an application may involve more than one individual. We computed the sampling errors associated with estimates of the variables in our study. Our projections, with resulting upper and lower limits, calculated at the 95 percent confidence level, are in the appendix.
APPLICANT REPRESENTATION
An alien seeking asylum may apply to the DOJ Immigration and Naturalization Service (INS) district director having jurisdiction over the alien’s place of residence or, if the alien has been placed in deportation proceedings, to an immigration judge in the DOJ Executive Office for Immigration Review.
‘Asvl urn : Uniform ADplication of Standards Uncertain--Few Denied Applicants Deported (GAO/GGD-87-33BR, Jan. 9, 1987).

B-224935
FIGURE 2: INS DISTRICT DIRECTORS' ASYLUM APPROVAL RATES
BY TYPE OF REPRESENTATION AND COUNTRY
100 Psrcont
60
60
70
60
SO
40
30
20
I 10
0
Attorney Ropnwntsd Thomwlvos
Vps of Rspnsontrtlon
Other
El Salvador
Nicaragua
m Poland
Iran
aNot computed for Iran see table 1.1 bNot computed for Poland and Iran. see table 1.1
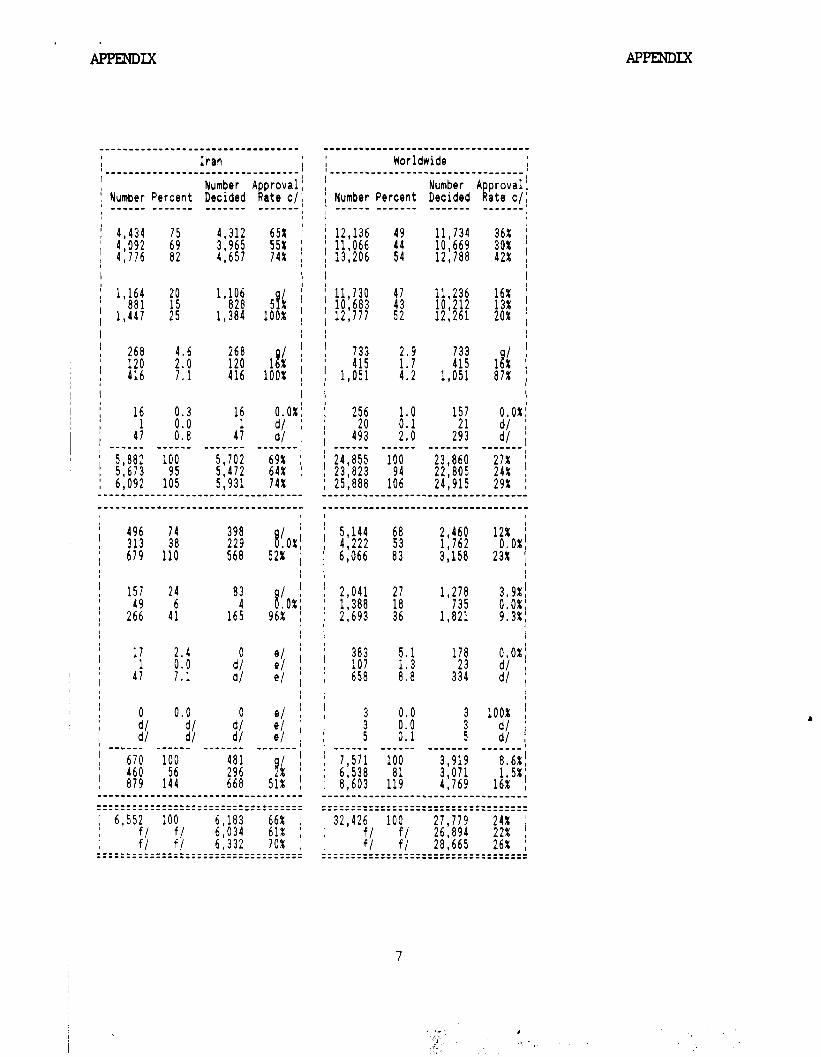
Of the 7,571 asylum applications submitted to immigration judges, about 68 percent were from aliens represented by attorneys and 12 percent of these applications were approved. Twenty-seven percent of the applicants represented themselves; 4 percent of their applications were approved. Five percent of the applicants were represented by religious or social groups; none of these applications were approved.
Similar statistics for the countries in our review are included
3

B-224935
in table I.1 in the appendix. As shown by adding the totals for these 4 countries, 76 percent of the 5,014 aliens who applied for asylum to immigration judges were from El Salvador.
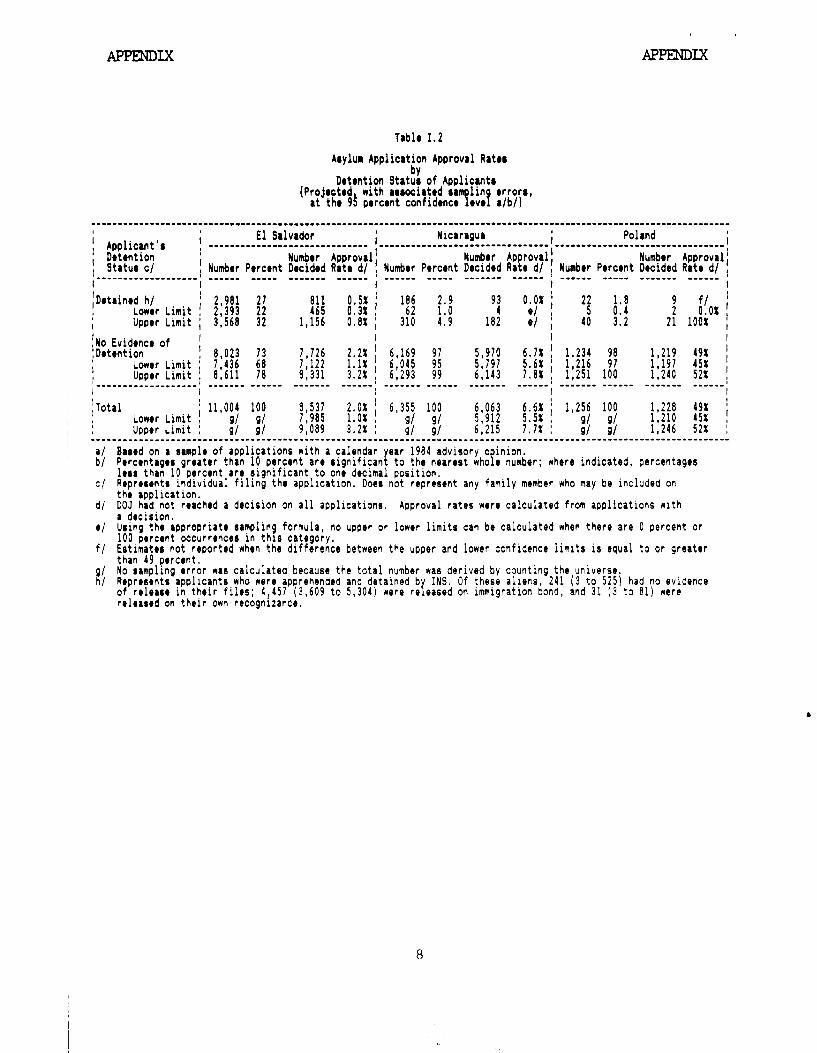
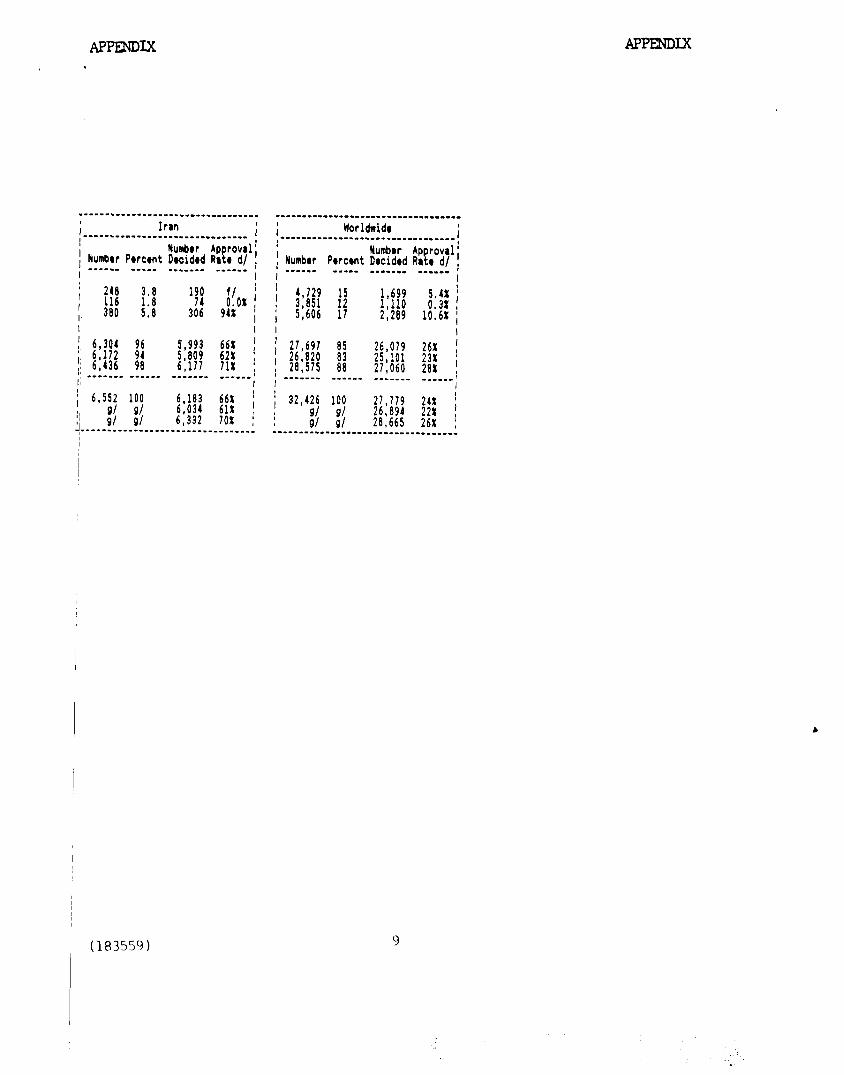
APPLICANTS DETAINED
Aliens who are considered by INS to be in the country illegally are served an "order to show cause" why they should not be deported. The order contains the factual allegations and the charges against the alien and initiates the deportation process. Pending a determination of deportability, aliens may be arrested and taken into custody. The INS district director, at his/her discretion, may maintain custody of the alien or release the alien on bond or on his/her own recognizance.
Of the 32,426 asylum applications, 4,729 or about 15 percent were from aliens who were being detained by INS or had been detained and subsequently released. (Most of these aliens, 4,488, had been released on bond or on their own recognizance.) The approval rate for these applications was 5 percent. The applications of those who had no record of detention had an approval rate of 26 percent. (See table I.2 in the appendix.)
Similar statistics for individual countries in our review are also included in table 1.2. As shown by adding the totals for these 4 countries, 87 percent of 3,437 aliens detained were from El Salvador and fewer than 1 percent of the cases decided were approved for asylum.
As arranged with your office, unless you publicly announce the contents of this fact sheet earlier, we plan no further distribution until 7 days from the date of issuance. At that time, we will send copies to interested parties and make copies available to others upon request. If there are any questions concerning the contents of this document please call me at (202) 275-8389.
Sincftrely yqra~s,
Arnold P. J@es Senior Associate Director
4

CONTENTS --------
Page
APPENDIX
TABLES
I.1
I.2
DOJ
Asylum Application Approval Rates by Type of Representation 6
Asylum Application Approval Rates by Detention Status of Applicants 8
ABBREVIATIONS
Department of Justice
Immigration and Naturalization Service

APPEXDIX Table I.1
Asylum Application Approvrl Rater
APPENDIX
Typo of R$rrrtntrtion (Projoctod with wocirttd srlnplinp errora,
at thr 93 prront confidrncr WI a/b) -_--------------_--_____________________-----.---....-.---..-.-.....--..---..---------.-..----------------------------- :Appliclnt’r ; El Salv&r ;Raprc*tntrtion , i Nicaragua , Poland i _---._--________________________ _______---______-__-I____________ ‘--.___----______-._.------------- b typr of
~DJJ Agency Nunbor
[ Numbrr Percent Dtcidtd A provrl’ k!
Numbor A provrl! ti
Number Approval: ,~~~~~--.~~~~~~~,
ata C/i Numbrr Ptrcrnt Dtcidrd Rata c/, w--m-- ~.~~~~~
rtr c/i Numbrr Pwcmt Decided ..I...- .m..we.. ..I... . ..-.a- mwml-m- -~~~~~~, -vemmm --wmewq -ma-ww- m~vemw-,
IINS District Diiwtor: I I 1 , Attorney , Loner Limit
1 3r330 2,133
f3 5% 3;942
1,;;; f51 5: i58 14% ;
, Upptr Limit I 3,942 56 1,406 677 51 666 g: I 1 'Ra rerontrd / TRmrt1v.r
1 I I
) 3,699 51 4,352 6.6X1 496 42
12 55%
, Lowar Limit 3,071 435 44% , Upurr Limit , 4,322
il m 4:19a 4,050 4,114
;-;:I . , 556
if 552 66%
1 Othar Ropra- j I , I I I ontrtion h/ , 47 0.0%: 1.1%’ 112 2.9 112 5.6X' 6.1 , Lowor Limit ; : Upper Limit I 1295 2o.oxj 28596 9:; 2;:
0.0%' 12.0x/
Ii 102 1:;
I I I 47 0.0x; 0 OXI
dl t 88 10; d/ ' 21 1:E
4 djj
---*-*- _______I 21 d/; _---_- --__-- ---e-s- --s----
%i !‘K 50% j
5:951 (208 , g: I ------t----------------------------------------------------------------------------------------------------------------
; Immigration Judy@: , Attorney 1 2,685 70 897
0.5x; 0.2x; 259 , Low Limit 2,117 51 535 114 13' '64;
: Uooor Limit ; 3,252 89 1,258 0.q 404 99 283
:Rc rostntod j I
I Tiamolvar j sis 121 469 0.2x: 139
, Lowor Limit
P’ 117
201 : Upper Limit 1,304 I 35 735 0.0X’ 0.4x; 2:: 59 2:;
/ Other Repro- j I I I
I sentrtion h/ i 212 , Lowar Limit ; Upper Limit ; 32
!*3 121 46
10:4 26; 1092 5
13
I j Missing I ~ ~ : Lower Limit j
3 100% j 0 el j I
Data 3 :+I
i I Uooor Limit I 5 0:i l :I iI
8 / dl dl el ii dd/ e/ I dl
~ iTotal ..--w...-.-*..* I ~~.~~~ 3,835 ------ 100 ~~~~~~- ------- ----_-
1:94e 313 155
------ loo -------
%
--__---' 7.1%'
0.0%;
--WV-- 64 -mm-e* 100
1 Lowtr Limit i 3,206 : Upprr Limit 4,464 153 362 I!! 491 21% 935 163;
~ ;Grand Total ~ 11,004 !OO Lower Limit fi fl
8,537 f8;; 6,355, 100 1.985 . I 65’% f/ . ;-iii 11255, loo
#;I Cl *
49% i 45x ,
a/ Barrd on a sample of applications with a calendar year 1984 advisory opinion. b/ osrcentages grsatrr than 10 percent are significant to the nearest whole number; where indicated, percentages
lass than 10 percent are significant to one decimal position. c/ DOJ had not reached a decision on all applications.
a decision. Approval rates rcere calculated from applications nith
d/ Uein 3%
the appropriate sampling formula, no upper or lower limits can be calculated when there are 0 percent or I 0 percent occurrences in this categor
e/ There were no cases in this category and t erefore a rate could not be calculated. I? f/ Yo sampling error was caiculated because the grand total number was derived by counting the universe. g/ Estimates not reported nhen the difference oetween the upper and lower confidence limits is equal t!, CI~
reatcr than 49 percent hi !elig;ous, charitable, ;oclal service or slmiliar organization.
6
‘
APPENDIX APPENDIX
I Iran I I ___I_____-__---____-_____________ I Number Approval: [ Number Percent Decided Rate cl!
-SW--- -~~-~~~ ______- _-____- I I / 4,434 ; 4,092 di f’lt3 I 4,116 02 4:651
._.__I. ._.___-_-_.__---------------
I Worldwide 1
I --------_------------------------. I
j Number Percent Number Approval: Decided Rate C/i
------ ----_-- -e----- ----w-v
I 11,236 10,212
16% 1 13%
12,261 20% f
I I
I
I 496 it 398 I 313 229 P(o,i I , 619 110 568 52% ; I !
I I
133 415
1,051 I
?I 0.0x;
293 :\ 1
__-__-- ._____--- -__________________
I I
2,460 12% I 1,162 3,158
0.0%) 23% I
4 I
I I I I
1 I ‘I f*d 1:1
411 !*a ‘2 I 41 658 010 334
! bv55:1 loo I fl f 1
x3 66% ;
6’332 / ;A: I ------__-_-----______1_____________ ----.----------____________________
j 1,571 100
j f:% lea 3';;; 4)69
; 32,42;, 100 21,119 I;: i I I fi :/ xi 26% j -----------------,---1-----,__,__,, ---------__-_-_-____---------------
7
APFENDIX
fablr I.2
APPENDIX
hylun Application Approval Rate8
Dotontion Stat!! of Applicant6 (Projected with arrocirted ee lin orrora,
at thr 93 percent confidence?evef a/b/)
El Salvador I Nicaragua # ,
! Aoolicmt’r I I I Poland , ----._1-.1.__-______.--------- I .__________I_._____------.-.-----,--------------------------------.
811 0.5% 465
;j: . ; I
'3 i-09 4:9
i VOX 1,156 , 310 21 lOOi
a/ Baaed on a trmplo of applications with a calendar ear 1984 advisory o inion. b/ Percentagea greater than 10 percent are rignifican to the nearest who e number; where indicated, percentages I e
less than 10 percent are significant to one decimal position. c/ Roprrtrnte individual filing thr application. Does not represent any family member who may be included on
the application. d/ DOJ had not reached a decision on all applications. Approval rates were calculated from applications with
a decision. e/ Uting the appropriate sampling formula, no upper or lower limits can be calculated when there are 0 percent or
100 percent occurrences in this category. f/ Estimates not reported when the difference between the upper and lower confidence limits is eaual to or greater
than 49 percent. g/ No sampling error was calculated because the total number was derived by counting-the,univerge: h/ Represents applicants who were apprehended and detained by INS. Of these a: liens, 241 (3 to 525) had no evidence
of release in their files: 4,451 (3,609 to 5,304) were released on immigration bond, and 31 (3 to 81) were released on their own recognizance.
.
APmIx .
APEZNDIX
------.------------_I--I------------ -----..I.-----.--.---.-.-.-..----.-
I Ir8n ; i Worldwide -----.-.-I-.-----_-____________ i 1
Number Approvali 1 Number Percrnt Decided Rate d/ I
i .------1-..-----.-----.-----.----
Number Ap rovrl/ e
I -*--.m em*-- -_-__-- **w**s , Number Percent Decidrd Ra e d/ I
I I ~~~~.~ ssmIm . . . . . . . I_.__. I I ct h!
I 380 5:e I
I I I
61177 {,;9; ;;; 71% , 1 27,691 85 26,079 26% I ; l l 26,820 20,515 88 83 25,101 27,060 23% 28% ----I-* -v-.-m --v--w- *-mese 18 --w---- me..mes --m-ems ______ ;
‘~ I I I
:i IJ
6,552 100
01 III ; 32,126 100 91 91 / ii' :I'
21,779 2hX
28,665 26,894 26% 22%
/
/ -,------__----____----------------- --------.--_---____-_______I_______
~ (183550) 9

I
.

Requests for copies of GAO reports should be sent to:
US. General Accounting Office Post Office Box 60 16 Gaithersburg, Maryland 20877
Telephone 202-276-6241
The first five copies of each report are free. Additional copies are $2.00 each.
There is a 26% discount on orders for 100 or more copies mailed to a single address.
Orders must be prepaid by cash or by check or money order made out to the Superintendent of Documents.

United States General Accountin Offke Washington, D.C. 2 8 648
Offkial Business Pesalty for Private Use $300
Address Correction Requested
I. GlOO