ghana statistical servicestatsghana.gov.gh/docfiles/gdp/quarterlygdp_2011_3rd_quarter.pdf · ghana...
TRANSCRIPT

GHANA STATISTICAL SERVICEStatistics for Development and Progress
Statistical Bulletin
January 2012
Ghana Statistical Service (GSS)P.O. Box GP 1098, Accrawww. statsghana.gov.gh
Quarterly Gross Domestic ProductThird quarter: 2011

Quarterly Gross Domestic Product3rd quarter: 2011
CONTENTS
HIGHLIGHTS FOR THE THIRD QUARTER 2011 ……………………………………………………………........................................………..2
NOTES ……………………………………………………………………………….……………………………………………………………………………..4
TABLES ………………………………………………………………………………………………………………………………………………………………..7
For technical enquiries contact:
Ghana Statistical Service (GSS), Head OfficeNational Accounts and Economic Indicators DivisionTel No: +233-24-3628234Email: [email protected]
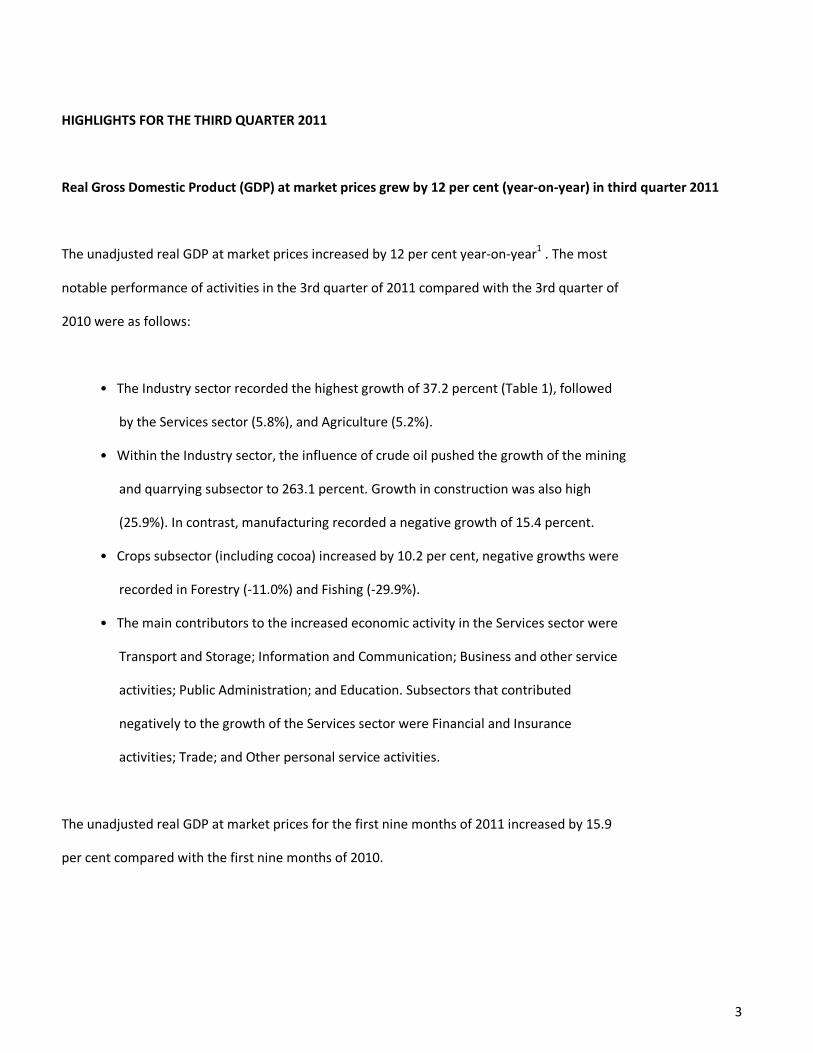
HIGHLIGHTS FOR THE THIRD QUARTER 2011
Real Gross Domestic Product (GDP) at market prices grew by 12 per cent (year-on-year) in third quarter 2011
The unadjusted real GDP at market prices increased by 12 per cent year-on-year1 . The most
notable performance of activities in the 3rd quarter of 2011 compared with the 3rd quarter of
2010 were as follows:
• The Industry sector recorded the highest growth of 37.2 percent (Table 1), followed
by the Services sector (5.8%), and Agriculture (5.2%).
• Within the Industry sector, the influence of crude oil pushed the growth of the mining
and quarrying subsector to 263.1 percent. Growth in construction was also high
(25.9%). In contrast, manufacturing recorded a negative growth of 15.4 percent.
• Crops subsector (including cocoa) increased by 10.2 per cent, negative growths were
recorded in Forestry (-11.0%) and Fishing (-29.9%).
• The main contributors to the increased economic activity in the Services sector were
Transport and Storage; Information and Communication; Business and other service
activities; Public Administration; and Education. Subsectors that contributed
negatively to the growth of the Services sector were Financial and Insurance
activities; Trade; and Other personal service activities.
The unadjusted real GDP at market prices for the first nine months of 2011 increased by 15.9
per cent compared with the first nine months of 2010.
3
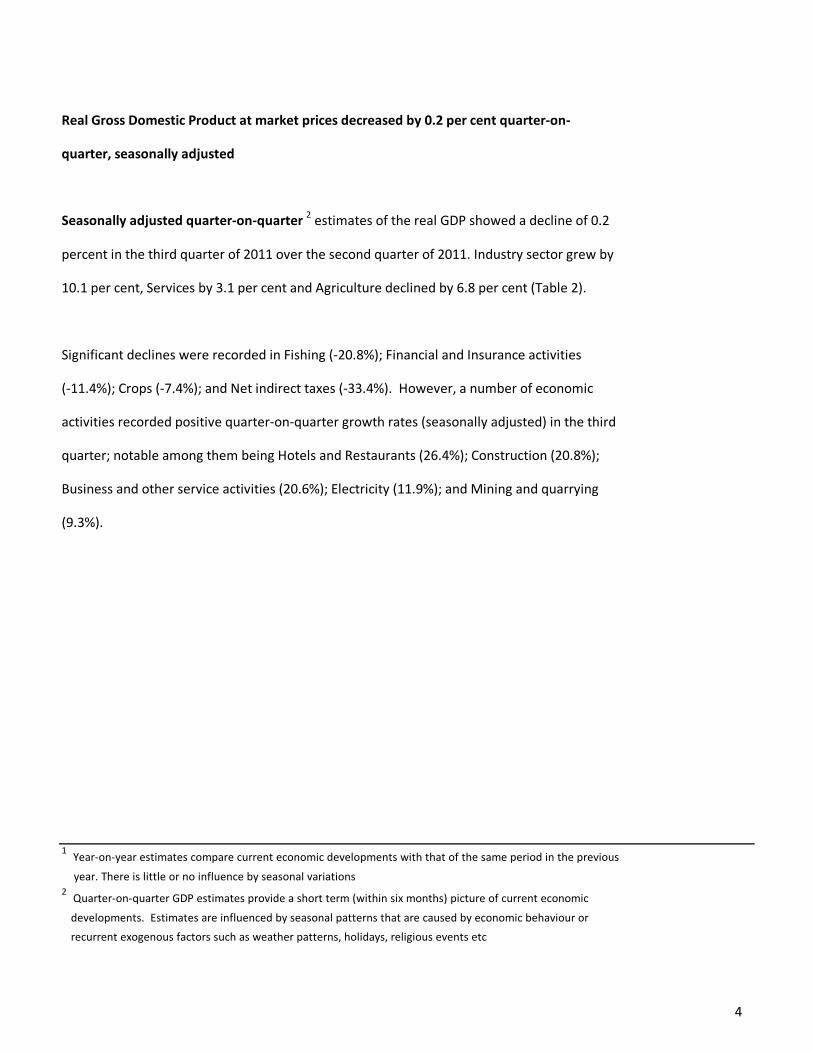
Real Gross Domestic Product at market prices decreased by 0.2 per cent quarter-on-
quarter, seasonally adjusted
Seasonally adjusted quarter-on-quarter 2 estimates of the real GDP showed a decline of 0.2
percent in the third quarter of 2011 over the second quarter of 2011. Industry sector grew by
10.1 per cent, Services by 3.1 per cent and Agriculture declined by 6.8 per cent (Table 2).
Significant declines were recorded in Fishing (-20.8%); Financial and Insurance activities
(-11.4%); Crops (-7.4%); and Net indirect taxes (-33.4%). However, a number of economic
activities recorded positive quarter-on-quarter growth rates (seasonally adjusted) in the third
quarter; notable among them being Hotels and Restaurants (26.4%); Construction (20.8%);
Business and other service activities (20.6%); Electricity (11.9%); and Mining and quarrying
(9.3%).
1 Year-on-year estimates compare current economic developments with that of the same period in the previous year. There is little or no influence by seasonal variations
2 Quarter-on-quarter GDP estimates provide a short term (within six months) picture of current economic developments. Estimates are influenced by seasonal patterns that are caused by economic behaviour or recurrent exogenous factors such as weather patterns, holidays, religious events etc
4
NOTES
Forthcoming issues Issue Expected date of publication
Fourth quarter of 2011 March 28, 2012First quarter of 2012 June 27, 2012
Explanatory notes
Introduction
Sources and methods
Methodology
Seasonal adjustment
5
Short-term indicators are used to estimate the quarterly GDP (ref Quarterly National Accounts Manual: Concepts, Data sources, and Compilation - IMF) where Annual GDP estimates are calculated independently from the quarterly estimates. Other than that, annual GDP estimates are derived as the sum of the GDP for the four quarters.
The quarterly value added and GDP estimates have been seasonally adjusted. Seasonal adjustment is the process of estimating and removing seasonal effects from time series to reveal non-seasonal features. This process is to provide a clearer view of short term movements and trends and also to allow earlier identification of turning points
Gross domestic product (GDP) is Ghana’s official measure of economic growth.There are three different approaches that can be taken to calculate GDP; the production approach, the expenditure approach, and the income approach. The approach used to calculate Ghana’s GDP on a quarterly basis is the production approach. For more information about GDP and the national accounts, go to Statistical Service website (www.statsghana.gov.gh).
This Statistical Release contains independently compiled quarterly estimates of the gross domestic product (GDP) for the period of third quarter of 2009 to third quarter of 2011. The estimates are based on the 1993 System of National Accounts (SNA), International Standard Industrial Classification Revision 4 published by the United Nations and other international organizations and Quarterly National Accounts Manual: Concepts, data sources, and compilation by International Monetary Fund (IMF). This means that the methodology, concepts and classifications, are in accordance with the guidelines and recommendations of an internationally agreed system of national accounts. The estimates of real GDP are expressed in terms of a 2006 base year.
Revision policy
6
Annual: introduction of annual data following the release of the latest annual national accounts each year. Irregular: for example, methodological changes. Note that as far as possible, revisions of this nature are incorporated to coincide with the annual cycle of revisions outlined above.
Revisions to the previously published series may be made each quarter. The frequency and cause of these revisions are as follows:
Quarterly: additional data becoming available for the latest quarters, which is used to replace existing estimates; revisions to quarterly data (e.g. revisions to the Balance of Payments, Fiscal data, VAT data), which will be incorporated as soon as possible to maintain consistency between published macro-economic statistics.
Tables
Table 1 - Quarterly Value Added by Activity and Gross Domestic Product at Constant 2006 Prices
Table 2 - Saesonally adjusted Quarterly Value Added at Constant 2006 Prices
Table 3 - Quarterly Value Added by Activity and Gross Domestic Product at Constant 2006 Prices
Table 4 - Percentage change (quarter-on-quarter) in the Quarterly Value Added
Table 5 - Percentage change (year-on-year) in the Quarterly Value Added
Table 6 - Seasonally adjusted Quarterly Gross Value Added at Constant 2006 Prices (GHc Million)
Table 7 - Percentage change (quarter-on-quarter) in the seasonally adjusted Quarterly Value Added
Table 8 - Percentage change (year-on-year) in the seasonally adjusted Quarterly Value Added
7
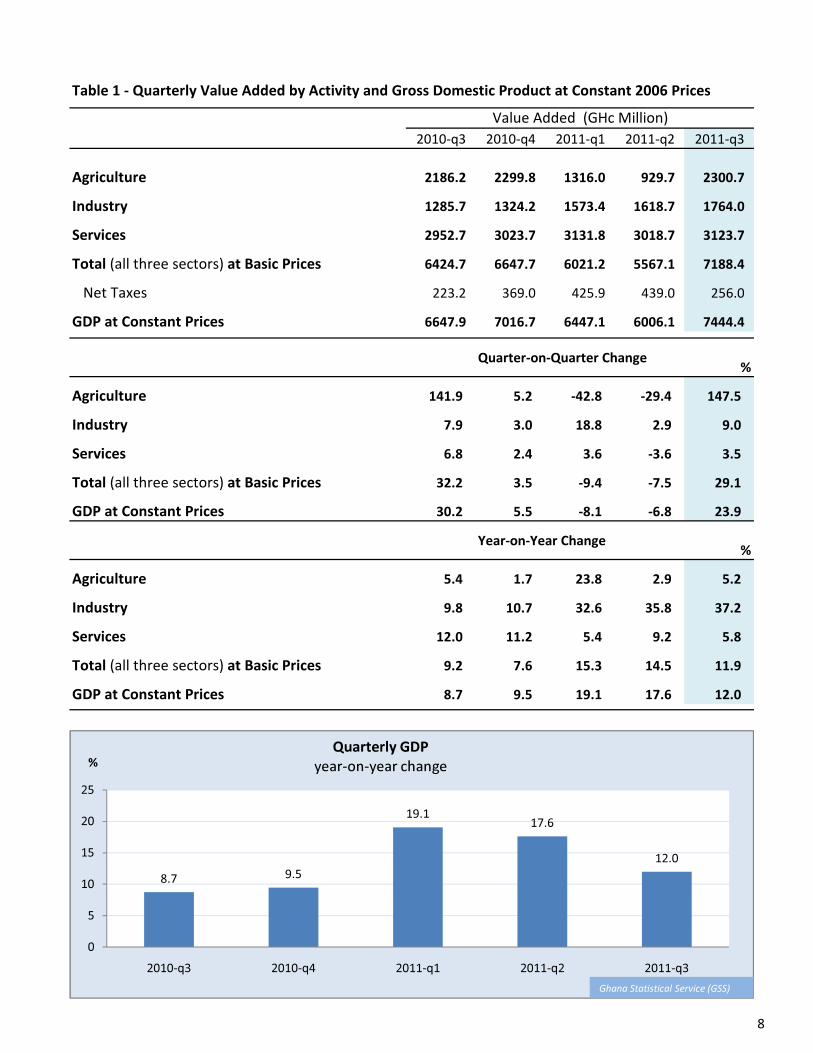
Table 1 - Quarterly Value Added by Activity and Gross Domestic Product at Constant 2006 Prices
2010-q3 2010-q4 2011-q1 2011-q2 2011-q3
Agriculture 2186.2 2299.8 1316.0 929.7 2300.7 Industry 1285.7 1324.2 1573.4 1618.7 1764.0 Services 2952.7 3023.7 3131.8 3018.7 3123.7 Total (all three sectors) at Basic Prices 6424.7 6647.7 6021.2 5567.1 7188.4 Net Taxes 223.2 369.0 425.9 439.0 256.0 GDP at Constant Prices 6647.9 7016.7 6447.1 6006.1 7444.4
Quarter-on-Quarter Change %Agriculture 141.9 5.2 -42.8 -29.4 147.5 Industry 7.9 3.0 18.8 2.9 9.0 Services 6.8 2.4 3.6 -3.6 3.5 Total (all three sectors) at Basic Prices 32.2 3.5 -9.4 -7.5 29.1
Value Added (GHc Million)
GDP at Constant Prices 30.2 5.5 -8.1 -6.8 23.9 Year-on-Year Change %
Agriculture 5.4 1.7 23.8 2.9 5.2 Industry 9.8 10.7 32.6 35.8 37.2 Services 12.0 11.2 5.4 9.2 5.8 Total (all three sectors) at Basic Prices 9.2 7.6 15.3 14.5 11.9 GDP at Constant Prices 8.7 9.5 19.1 17.6 12.0
8.7 9.5
19.1 17.6
12.0
0
5
10
15
20
25
2010-q3 2010-q4 2011-q1 2011-q2 2011-q3
%Quarterly GDP
year-on-year change
Ghana Statistical Service (GSS)
8
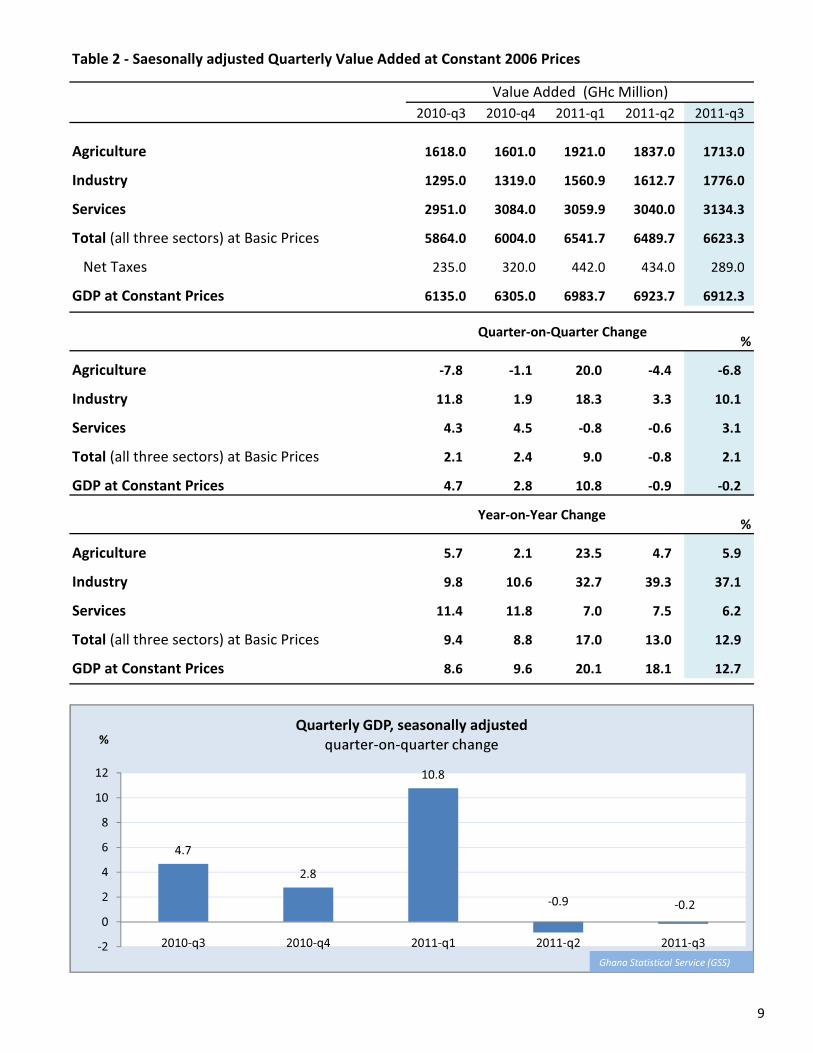
Table 2 - Saesonally adjusted Quarterly Value Added at Constant 2006 Prices
2010-q3 2010-q4 2011-q1 2011-q2 2011-q3
Agriculture 1618.0 1601.0 1921.0 1837.0 1713.0 Industry 1295.0 1319.0 1560.9 1612.7 1776.0 Services 2951.0 3084.0 3059.9 3040.0 3134.3 Total (all three sectors) at Basic Prices 5864.0 6004.0 6541.7 6489.7 6623.3 Net Taxes 235.0 320.0 442.0 434.0 289.0 GDP at Constant Prices 6135.0 6305.0 6983.7 6923.7 6912.3
Quarter-on-Quarter Change %Agriculture -7.8 -1.1 20.0 -4.4 -6.8 Industry 11.8 1.9 18.3 3.3 10.1 Services 4.3 4.5 -0.8 -0.6 3.1 Total (all three sectors) at Basic Prices 2.1 2.4 9.0 -0.8 2.1 GDP at Constant Prices 4.7 2.8 10.8 -0.9 -0.2
Value Added (GHc Million)
GDP at Constant Prices 4.7 2.8 10.8 -0.9 -0.2 Year-on-Year Change %
Agriculture 5.7 2.1 23.5 4.7 5.9 Industry 9.8 10.6 32.7 39.3 37.1 Services 11.4 11.8 7.0 7.5 6.2 Total (all three sectors) at Basic Prices 9.4 8.8 17.0 13.0 12.9 GDP at Constant Prices 8.6 9.6 20.1 18.1 12.7
4.7 2.8
10.8
-0.9 -0.2
-202468
1012
2010-q3 2010-q4 2011-q1 2011-q2 2011-q3
%Quarterly GDP, seasonally adjusted
quarter-on-quarter change
Ghana Statistical Service (GSS)
9
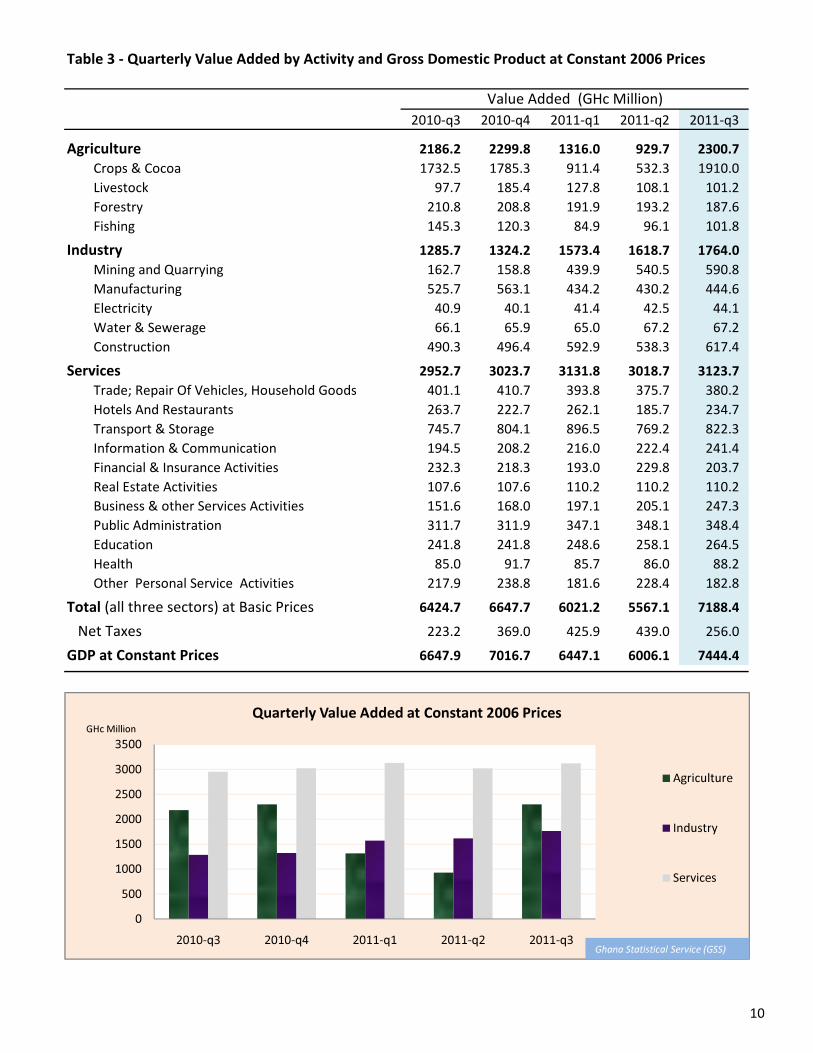
Table 3 - Quarterly Value Added by Activity and Gross Domestic Product at Constant 2006 Prices
2010-q3 2010-q4 2011-q1 2011-q2 2011-q3Agriculture 2186.2 2299.8 1316.0 929.7 2300.7
Crops & Cocoa 1732.5 1785.3 911.4 532.3 1910.0 Livestock 97.7 185.4 127.8 108.1 101.2 Forestry 210.8 208.8 191.9 193.2 187.6 Fishing 145.3 120.3 84.9 96.1 101.8
Industry 1285.7 1324.2 1573.4 1618.7 1764.0 Mining and Quarrying 162.7 158.8 439.9 540.5 590.8 Manufacturing 525.7 563.1 434.2 430.2 444.6 Electricity 40.9 40.1 41.4 42.5 44.1 Water & Sewerage 66.1 65.9 65.0 67.2 67.2 Construction 490.3 496.4 592.9 538.3 617.4
Services 2952.7 3023.7 3131.8 3018.7 3123.7 Trade; Repair Of Vehicles, Household Goods 401.1 410.7 393.8 375.7 380.2 Hotels And Restaurants 263.7 222.7 262.1 185.7 234.7 Transport & Storage 745.7 804.1 896.5 769.2 822.3 Information & Communication 194.5 208.2 216.0 222.4 241.4 Financial & Insurance Activities 232.3 218.3 193.0 229.8 203.7 Real Estate Activities 107.6 107.6 110.2 110.2 110.2
Value Added (GHc Million)
Real Estate Activities 107.6 107.6 110.2 110.2 110.2 Business & other Services Activities 151.6 168.0 197.1 205.1 247.3 Public Administration 311.7 311.9 347.1 348.1 348.4 Education 241.8 241.8 248.6 258.1 264.5 Health 85.0 91.7 85.7 86.0 88.2 Other Personal Service Activities 217.9 238.8 181.6 228.4 182.8
Total (all three sectors) at Basic Prices 6424.7 6647.7 6021.2 5567.1 7188.4 Net Taxes 223.2 369.0 425.9 439.0 256.0 GDP at Constant Prices 6647.9 7016.7 6447.1 6006.1 7444.4
0500
100015002000250030003500
2010-q3 2010-q4 2011-q1 2011-q2 2011-q3
GHc MillionQuarterly Value Added at Constant 2006 Prices
Agriculture
Industry
Services
Ghana Statistical Service (GSS)
10
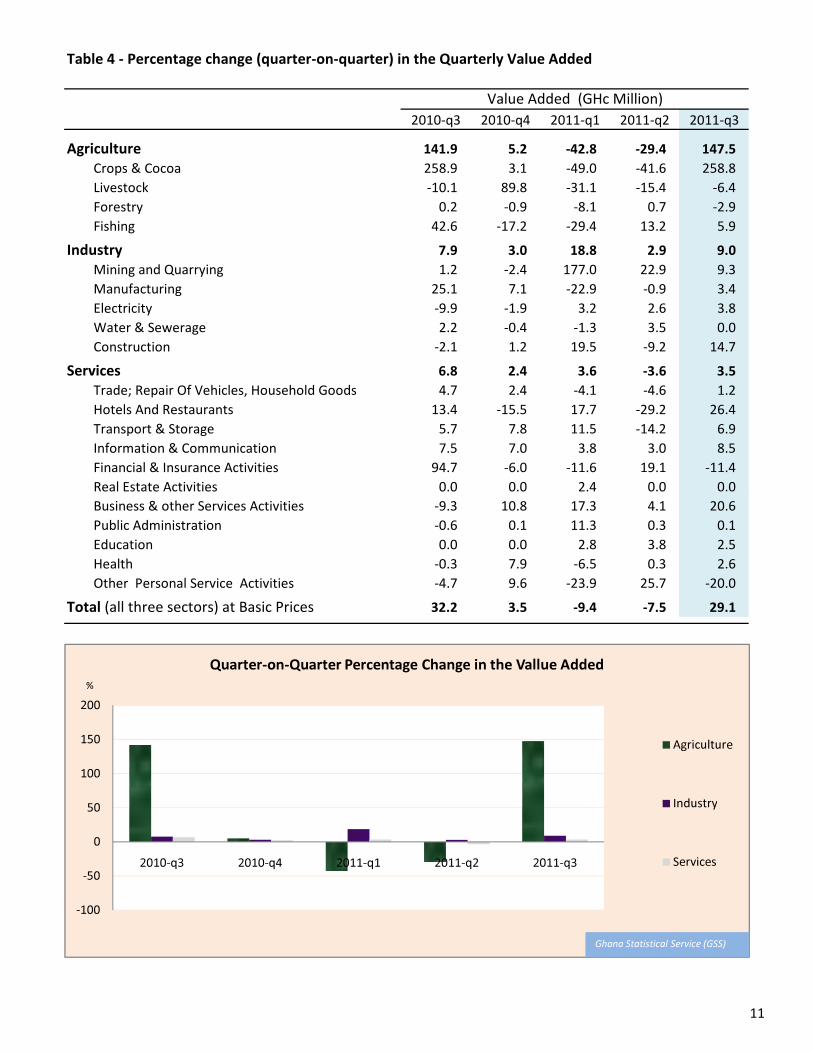
Table 4 - Percentage change (quarter-on-quarter) in the Quarterly Value Added
2010-q3 2010-q4 2011-q1 2011-q2 2011-q3Agriculture 141.9 5.2 -42.8 -29.4 147.5
Crops & Cocoa 258.9 3.1 -49.0 -41.6 258.8 Livestock -10.1 89.8 -31.1 -15.4 -6.4 Forestry 0.2 -0.9 -8.1 0.7 -2.9 Fishing 42.6 -17.2 -29.4 13.2 5.9
Industry 7.9 3.0 18.8 2.9 9.0 Mining and Quarrying 1.2 -2.4 177.0 22.9 9.3 Manufacturing 25.1 7.1 -22.9 -0.9 3.4 Electricity -9.9 -1.9 3.2 2.6 3.8 Water & Sewerage 2.2 -0.4 -1.3 3.5 0.0 Construction -2.1 1.2 19.5 -9.2 14.7
Services 6.8 2.4 3.6 -3.6 3.5 Trade; Repair Of Vehicles, Household Goods 4.7 2.4 -4.1 -4.6 1.2 Hotels And Restaurants 13.4 -15.5 17.7 -29.2 26.4 Transport & Storage 5.7 7.8 11.5 -14.2 6.9 Information & Communication 7.5 7.0 3.8 3.0 8.5 Financial & Insurance Activities 94.7 -6.0 -11.6 19.1 -11.4 Real Estate Activities 0.0 0.0 2.4 0.0 0.0
Value Added (GHc Million)
Real Estate Activities 0.0 0.0 2.4 0.0 0.0 Business & other Services Activities -9.3 10.8 17.3 4.1 20.6 Public Administration -0.6 0.1 11.3 0.3 0.1 Education 0.0 0.0 2.8 3.8 2.5 Health -0.3 7.9 -6.5 0.3 2.6 Other Personal Service Activities -4.7 9.6 -23.9 25.7 -20.0
Total (all three sectors) at Basic Prices 32.2 3.5 -9.4 -7.5 29.1
-100
-50
0
50
100
150
200
2010-q3 2010-q4 2011-q1 2011-q2 2011-q3
%
Quarter-on-Quarter Percentage Change in the Vallue Added
Agriculture
Industry
Services
Ghana Statistical Service (GSS)
11
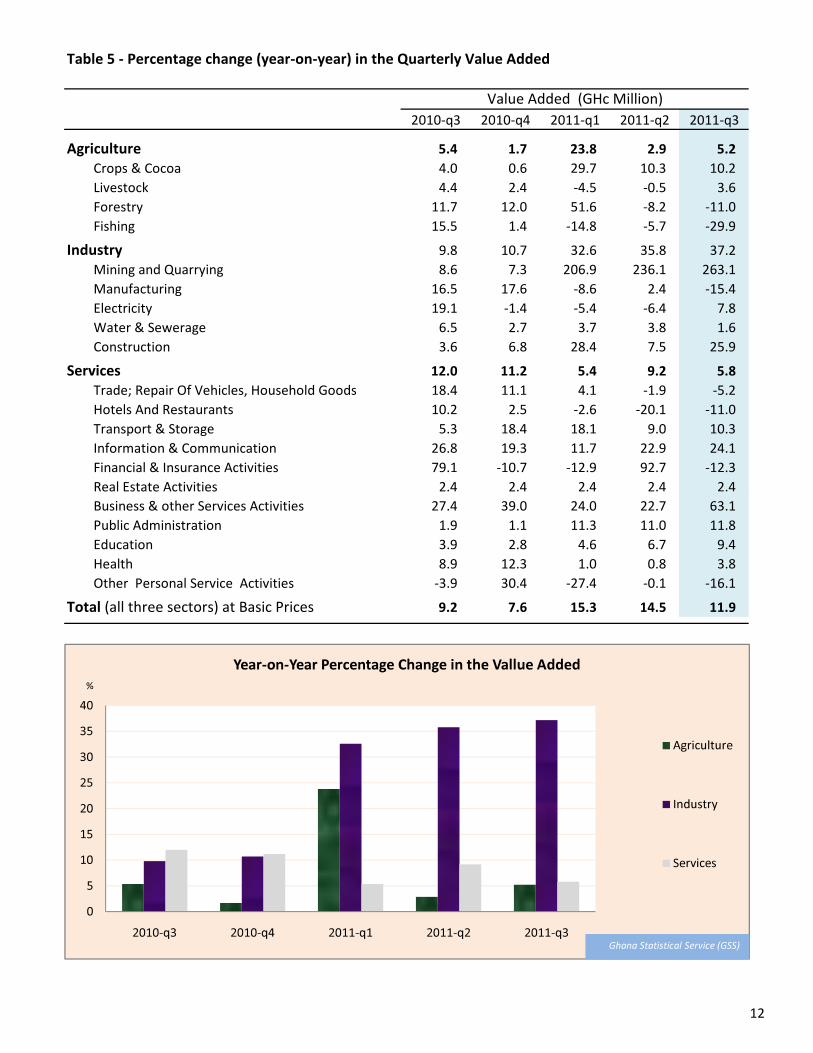
Table 5 - Percentage change (year-on-year) in the Quarterly Value Added
2010-q3 2010-q4 2011-q1 2011-q2 2011-q3Agriculture 5.4 1.7 23.8 2.9 5.2
Crops & Cocoa 4.0 0.6 29.7 10.3 10.2 Livestock 4.4 2.4 -4.5 -0.5 3.6 Forestry 11.7 12.0 51.6 -8.2 -11.0 Fishing 15.5 1.4 -14.8 -5.7 -29.9
Industry 9.8 10.7 32.6 35.8 37.2 Mining and Quarrying 8.6 7.3 206.9 236.1 263.1 Manufacturing 16.5 17.6 -8.6 2.4 -15.4 Electricity 19.1 -1.4 -5.4 -6.4 7.8 Water & Sewerage 6.5 2.7 3.7 3.8 1.6 Construction 3.6 6.8 28.4 7.5 25.9
Services 12.0 11.2 5.4 9.2 5.8 Trade; Repair Of Vehicles, Household Goods 18.4 11.1 4.1 -1.9 -5.2 Hotels And Restaurants 10.2 2.5 -2.6 -20.1 -11.0 Transport & Storage 5.3 18.4 18.1 9.0 10.3 Information & Communication 26.8 19.3 11.7 22.9 24.1 Financial & Insurance Activities 79.1 -10.7 -12.9 92.7 -12.3 Real Estate Activities 2.4 2.4 2.4 2.4 2.4
Value Added (GHc Million)
Real Estate Activities 2.4 2.4 2.4 2.4 2.4 Business & other Services Activities 27.4 39.0 24.0 22.7 63.1 Public Administration 1.9 1.1 11.3 11.0 11.8 Education 3.9 2.8 4.6 6.7 9.4 Health 8.9 12.3 1.0 0.8 3.8 Other Personal Service Activities -3.9 30.4 -27.4 -0.1 -16.1
Total (all three sectors) at Basic Prices 9.2 7.6 15.3 14.5 11.9
05
10152025303540
2010-q3 2010-q4 2011-q1 2011-q2 2011-q3
%
Year-on-Year Percentage Change in the Vallue Added
Agriculture
Industry
Services
Ghana Statistical Service (GSS)
12
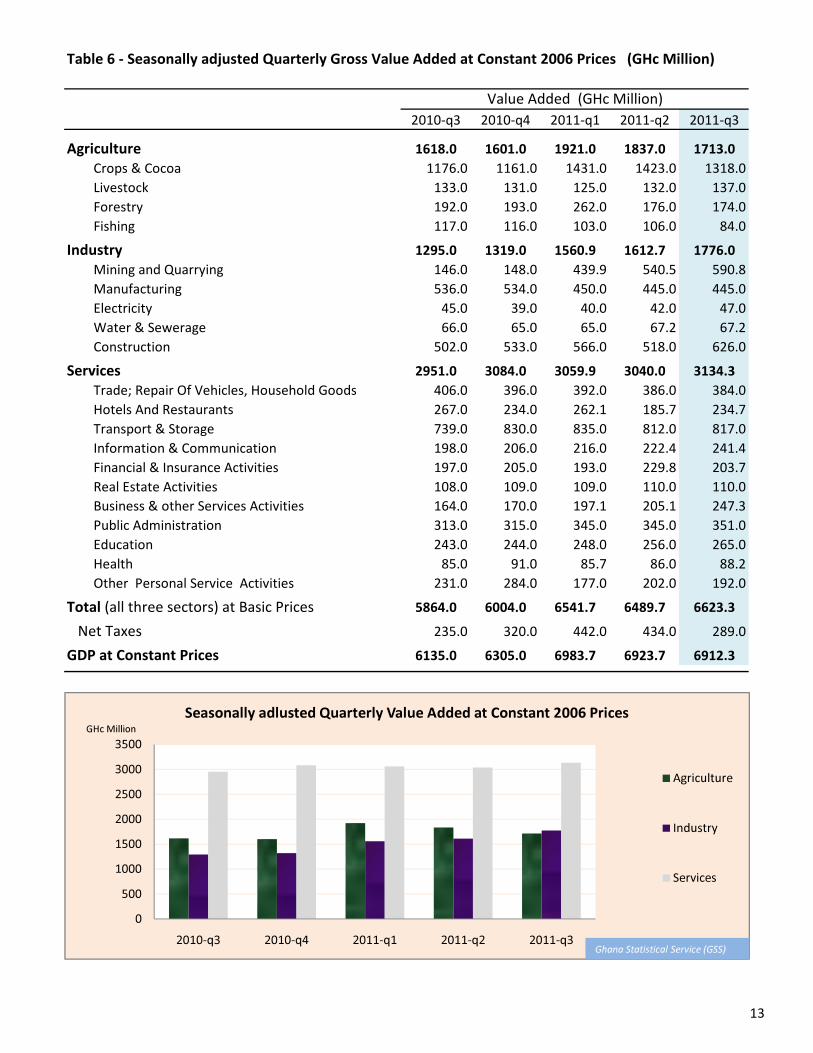
Table 6 - Seasonally adjusted Quarterly Gross Value Added at Constant 2006 Prices (GHc Million)
2010-q3 2010-q4 2011-q1 2011-q2 2011-q3Agriculture 1618.0 1601.0 1921.0 1837.0 1713.0
Crops & Cocoa 1176.0 1161.0 1431.0 1423.0 1318.0Livestock 133.0 131.0 125.0 132.0 137.0Forestry 192.0 193.0 262.0 176.0 174.0Fishing 117.0 116.0 103.0 106.0 84.0
Industry 1295.0 1319.0 1560.9 1612.7 1776.0Mining and Quarrying 146.0 148.0 439.9 540.5 590.8Manufacturing 536.0 534.0 450.0 445.0 445.0Electricity 45.0 39.0 40.0 42.0 47.0Water & Sewerage 66.0 65.0 65.0 67.2 67.2Construction 502.0 533.0 566.0 518.0 626.0
Services 2951.0 3084.0 3059.9 3040.0 3134.3Trade; Repair Of Vehicles, Household Goods 406.0 396.0 392.0 386.0 384.0Hotels And Restaurants 267.0 234.0 262.1 185.7 234.7Transport & Storage 739.0 830.0 835.0 812.0 817.0Information & Communication 198.0 206.0 216.0 222.4 241.4Financial & Insurance Activities 197.0 205.0 193.0 229.8 203.7Real Estate Activities 108.0 109.0 109.0 110.0 110.0
Value Added (GHc Million)
Real Estate Activities 108.0 109.0 109.0 110.0 110.0Business & other Services Activities 164.0 170.0 197.1 205.1 247.3Public Administration 313.0 315.0 345.0 345.0 351.0Education 243.0 244.0 248.0 256.0 265.0Health 85.0 91.0 85.7 86.0 88.2Other Personal Service Activities 231.0 284.0 177.0 202.0 192.0
Total (all three sectors) at Basic Prices 5864.0 6004.0 6541.7 6489.7 6623.3 Net Taxes 235.0 320.0 442.0 434.0 289.0GDP at Constant Prices 6135.0 6305.0 6983.7 6923.7 6912.3
0500
100015002000250030003500
2010-q3 2010-q4 2011-q1 2011-q2 2011-q3
GHc MillionSeasonally adlusted Quarterly Value Added at Constant 2006 Prices
Agriculture
Industry
Services
Ghana Statistical Service (GSS)
13
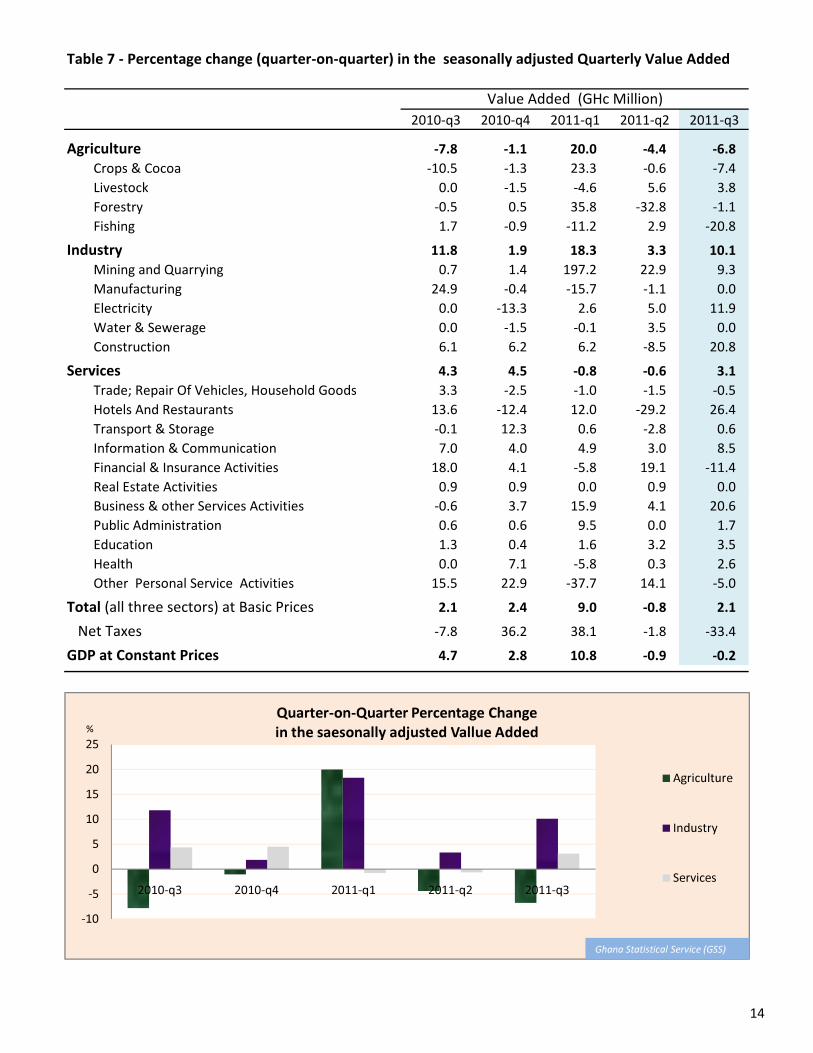
Table 7 - Percentage change (quarter-on-quarter) in the seasonally adjusted Quarterly Value Added
2010-q3 2010-q4 2011-q1 2011-q2 2011-q3Agriculture -7.8 -1.1 20.0 -4.4 -6.8
Crops & Cocoa -10.5 -1.3 23.3 -0.6 -7.4 Livestock 0.0 -1.5 -4.6 5.6 3.8 Forestry -0.5 0.5 35.8 -32.8 -1.1 Fishing 1.7 -0.9 -11.2 2.9 -20.8
Industry 11.8 1.9 18.3 3.3 10.1 Mining and Quarrying 0.7 1.4 197.2 22.9 9.3 Manufacturing 24.9 -0.4 -15.7 -1.1 0.0 Electricity 0.0 -13.3 2.6 5.0 11.9 Water & Sewerage 0.0 -1.5 -0.1 3.5 0.0 Construction 6.1 6.2 6.2 -8.5 20.8
Services 4.3 4.5 -0.8 -0.6 3.1 Trade; Repair Of Vehicles, Household Goods 3.3 -2.5 -1.0 -1.5 -0.5 Hotels And Restaurants 13.6 -12.4 12.0 -29.2 26.4 Transport & Storage -0.1 12.3 0.6 -2.8 0.6 Information & Communication 7.0 4.0 4.9 3.0 8.5 Financial & Insurance Activities 18.0 4.1 -5.8 19.1 -11.4 Real Estate Activities 0.9 0.9 0.0 0.9 0.0
Value Added (GHc Million)
Real Estate Activities 0.9 0.9 0.0 0.9 0.0 Business & other Services Activities -0.6 3.7 15.9 4.1 20.6 Public Administration 0.6 0.6 9.5 0.0 1.7 Education 1.3 0.4 1.6 3.2 3.5 Health 0.0 7.1 -5.8 0.3 2.6 Other Personal Service Activities 15.5 22.9 -37.7 14.1 -5.0
Total (all three sectors) at Basic Prices 2.1 2.4 9.0 -0.8 2.1 Net Taxes -7.8 36.2 38.1 -1.8 -33.4 GDP at Constant Prices 4.7 2.8 10.8 -0.9 -0.2
-10-505
10152025
2010-q3 2010-q4 2011-q1 2011-q2 2011-q3
%Quarter-on-Quarter Percentage Change in the saesonally adjusted Vallue Added
Agriculture
Industry
Services
Ghana Statistical Service (GSS)
14
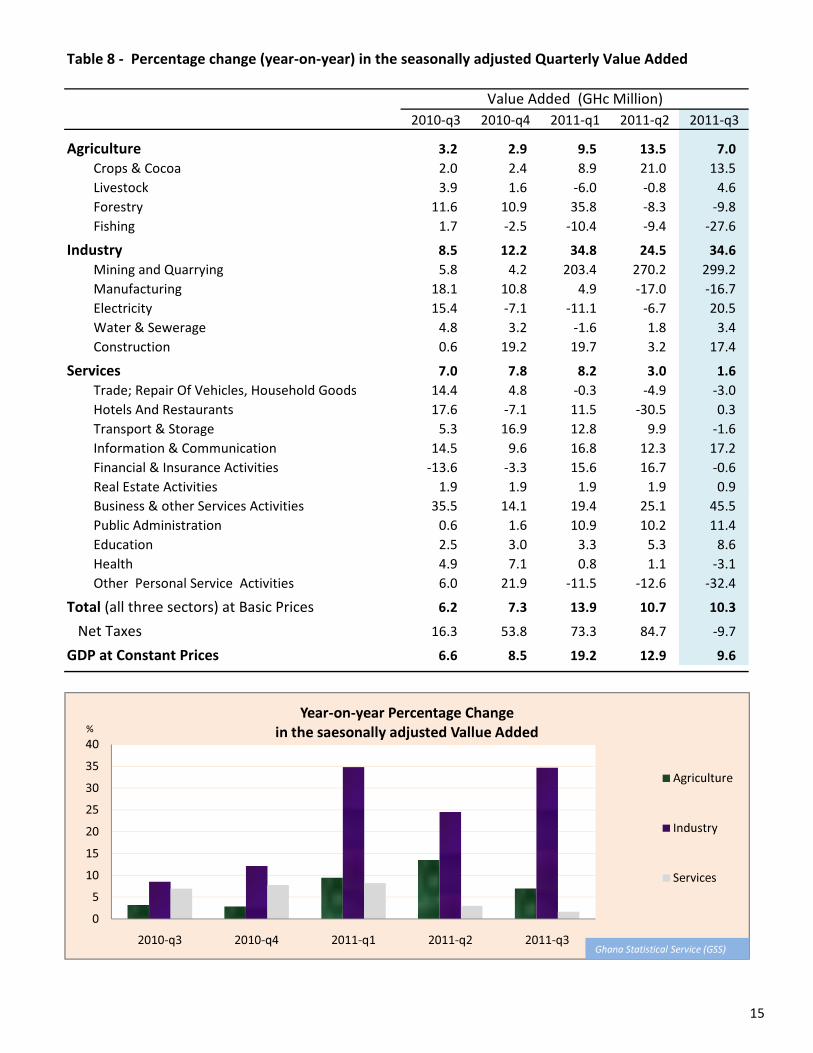
Table 8 - Percentage change (year-on-year) in the seasonally adjusted Quarterly Value Added
2010-q3 2010-q4 2011-q1 2011-q2 2011-q3Agriculture 3.2 2.9 9.5 13.5 7.0
Crops & Cocoa 2.0 2.4 8.9 21.0 13.5 Livestock 3.9 1.6 -6.0 -0.8 4.6 Forestry 11.6 10.9 35.8 -8.3 -9.8 Fishing 1.7 -2.5 -10.4 -9.4 -27.6
Industry 8.5 12.2 34.8 24.5 34.6 Mining and Quarrying 5.8 4.2 203.4 270.2 299.2 Manufacturing 18.1 10.8 4.9 -17.0 -16.7 Electricity 15.4 -7.1 -11.1 -6.7 20.5 Water & Sewerage 4.8 3.2 -1.6 1.8 3.4 Construction 0.6 19.2 19.7 3.2 17.4
Services 7.0 7.8 8.2 3.0 1.6 Trade; Repair Of Vehicles, Household Goods 14.4 4.8 -0.3 -4.9 -3.0 Hotels And Restaurants 17.6 -7.1 11.5 -30.5 0.3 Transport & Storage 5.3 16.9 12.8 9.9 -1.6 Information & Communication 14.5 9.6 16.8 12.3 17.2 Financial & Insurance Activities -13.6 -3.3 15.6 16.7 -0.6 Real Estate Activities 1.9 1.9 1.9 1.9 0.9
Value Added (GHc Million)
Real Estate Activities 1.9 1.9 1.9 1.9 0.9 Business & other Services Activities 35.5 14.1 19.4 25.1 45.5 Public Administration 0.6 1.6 10.9 10.2 11.4 Education 2.5 3.0 3.3 5.3 8.6 Health 4.9 7.1 0.8 1.1 -3.1 Other Personal Service Activities 6.0 21.9 -11.5 -12.6 -32.4
Total (all three sectors) at Basic Prices 6.2 7.3 13.9 10.7 10.3 Net Taxes 16.3 53.8 73.3 84.7 -9.7 GDP at Constant Prices 6.6 8.5 19.2 12.9 9.6
05
10152025303540
2010-q3 2010-q4 2011-q1 2011-q2 2011-q3
%Year-on-year Percentage Change
in the saesonally adjusted Vallue Added
Agriculture
Industry
Services
Ghana Statistical Service (GSS)
15