gianfranco verbana, i2vgo
TRANSCRIPT
11° Convention – Costalovara - 26-27 Settembre 2009 – G.VerbanaSlide 1
After the discussion of issues of current dynamics of the receivers,
Gianfranco Verbana , I2VGO
presents:
“ Measurement of all products intermodulation on
HF receivers, with 24000 telegraph channels
11° Convention – Costalovara - 26-27 Settembre 2009 – G.VerbanaSlide 2
Introduction
� The title, although it may seem, it is no exaggeration. Certainly not have used more
than two tens of thousands of generators and 24 thousand input ports combiner,
but the results are the same as if they were present, at the receiver under test,
24088 telegraph signals, independent, modulated with a speed of word to fill,
each, a band of 500 Hz.
� This method has used since sixty years in all the wide-band telecommunications
applications with a single carrier and multi telephone channels FDM or in TDM
single or multi-carrier (k-QAM modulation), on broadband analog/digital converter,
where the distortions and spurious free, introduced under real operating
conditions, are not values reflected in the traditional two tone test.
11° Convention – Costalovara - 26-27 Settembre 2009 – G.VerbanaSlide 3
� The method is known by the term "Noise Power Ratio Testing"
or simply: NPR testing. A single value, expressed in dB,
replacing dozens of measures (IP2, IP3 ... IPn - IMD2, IMD3 ...
IMDn - DR2, DR3 ... DRn)
� To make known to as many ham as possible the simplicity and
precision of such a method, I would like to take this opportunity
to point out, based on my experience, the fundamental
concepts of the effects of "nonlinear" distortion.
11° Convention – Costalovara - 26-27 Settembre 2009 – G.VerbanaSlide 4
Distorsions
Any electric “Two-port network” can introduce on the signal only two types of
distortion:
� Linear
� The linear distortions are independent of signal
amplitude can be either amplitude and / or phase (e.g., Response
amplitude and phase vs frequency that modify the spectrum of the
received signal).
� Nonlinear
� The nonlinear distortion depends on the size of the
signals and are also amplitude and / or phase. The so-called AM /
AM and AM / PM. In the TV industry uses terms “differential gain and
phase “. Different way to express the same things.

11° Convention – Costalovara - 26-27 Settembre 2009 – G.VerbanaSlide 5
Effects of distortion
� The “linear “ distortions change the spectrum of the signal
without adding anything.
From the two-port network coming out the same signals that
are incoming (Different forms in frequency and time if is present linear
distorsion).
� The "nonlinear" distortions gives rise to many spurious
signals at different frequencies and amplitudes.
The signals coming out of the two-port network are more
numerous than those who entered.
11° Convention – Costalovara - 26-27 Settembre 2009 – G.VerbanaSlide 6
Transmitters and receivers
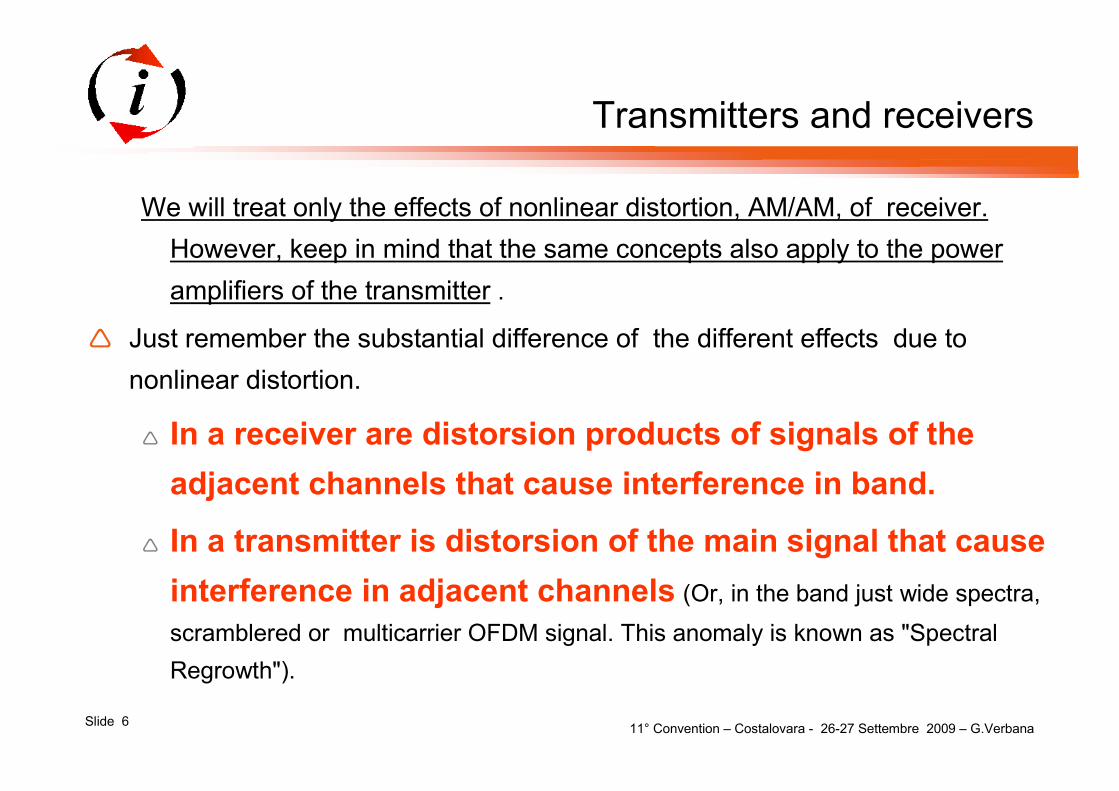
We will treat only the effects of nonlinear distortion, AM/AM, of receiver.
However, keep in mind that the same concepts also apply to the power
amplifiers of the transmitter .
� Just remember the substantial difference of the different effects due to
nonlinear distortion.
� In a receiver are distorsion products of signals of the
adjacent channels that cause interference in band.
� In a transmitter is distorsion of the main signal that cause
interference in adjacent channels (Or, in the band just wide spectra,
scramblered or multicarrier OFDM signal. This anomaly is known as "Spectral
Regrowth").
11° Convention – Costalovara - 26-27 Settembre 2009 – G.VerbanaSlide 7
Linearity
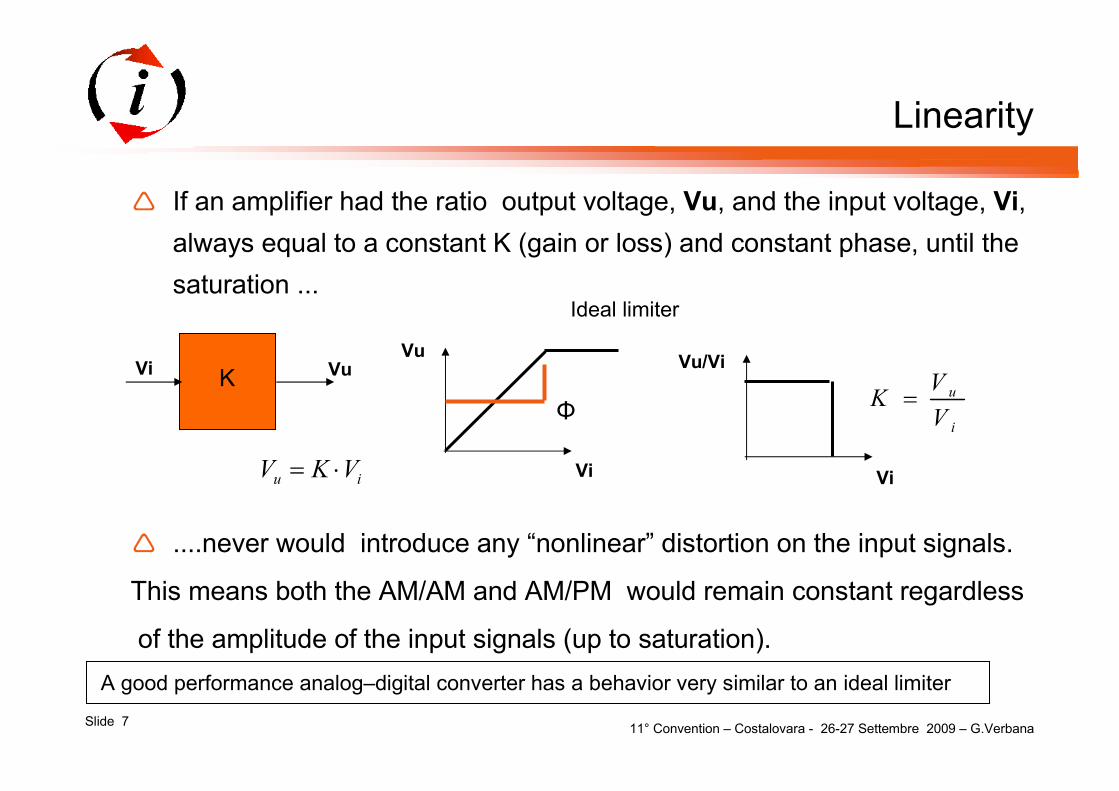
� If an amplifier had the ratio output voltage, Vu, and the input voltage, Vi,
always equal to a constant K (gain or loss) and constant phase, until the
saturation ...
� ....never would introduce any “nonlinear” distortion on the input signals.
This means both the AM/AM and AM/PM would remain constant regardless
of the amplitude of the input signals (up to saturation).
A good performance analog–digital converter has a behavior very similar to an ideal limiter
iu VKV ⋅=
VuViK
Ideal limiter
Vu
Vi
Φ
Vu/Vi
Vi
i
u
V
VK =
11° Convention – Costalovara - 26-27 Settembre 2009 – G.VerbanaSlide 8
Nonlinearity
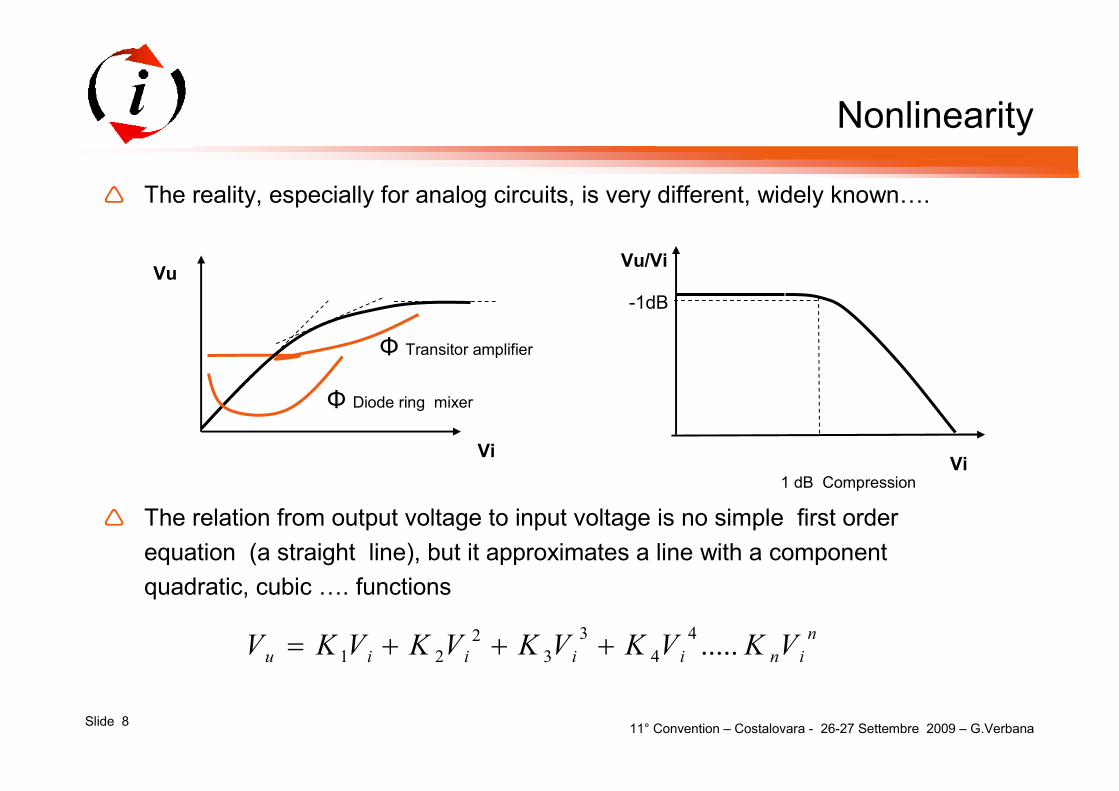
� The reality, especially for analog circuits, is very different, widely known….
� The relation from output voltage to input voltage is no simple first order
equation (a straight line), but it approximates a line with a component
quadratic, cubic …. functions
n
iniiiiu VKVKVKVKVKV .....4
4
3
3
2
21 +++=
1 dB Compression
Vi
Vu
Φ Transitor amplifier
Φ Diode ring mixer
Vu/Vi
Vi
-1dB

11° Convention – Costalovara - 26-27 Settembre 2009 – G.VerbanaSlide 9
Simplifying example
� Consider, for simplicity of calculation, a quadripole whose output voltage, Vu,
has the follow relation with input voltage:
� Applied to the quadripole two sinusoidal signals with equal amplitudes and
different frequencies, the total signal will be:
� At the output of the quadripole we get more signals of those present to the
input:
2
21 iiu VKVKV +=
tVtVVi 21 coscos ωω +=
2
212211 )coscos()coscos( tVtVKtVtVKVu ωωωω +++=
11° Convention – Costalovara - 26-27 Settembre 2009 – G.VerbanaSlide 10
Second order IMD
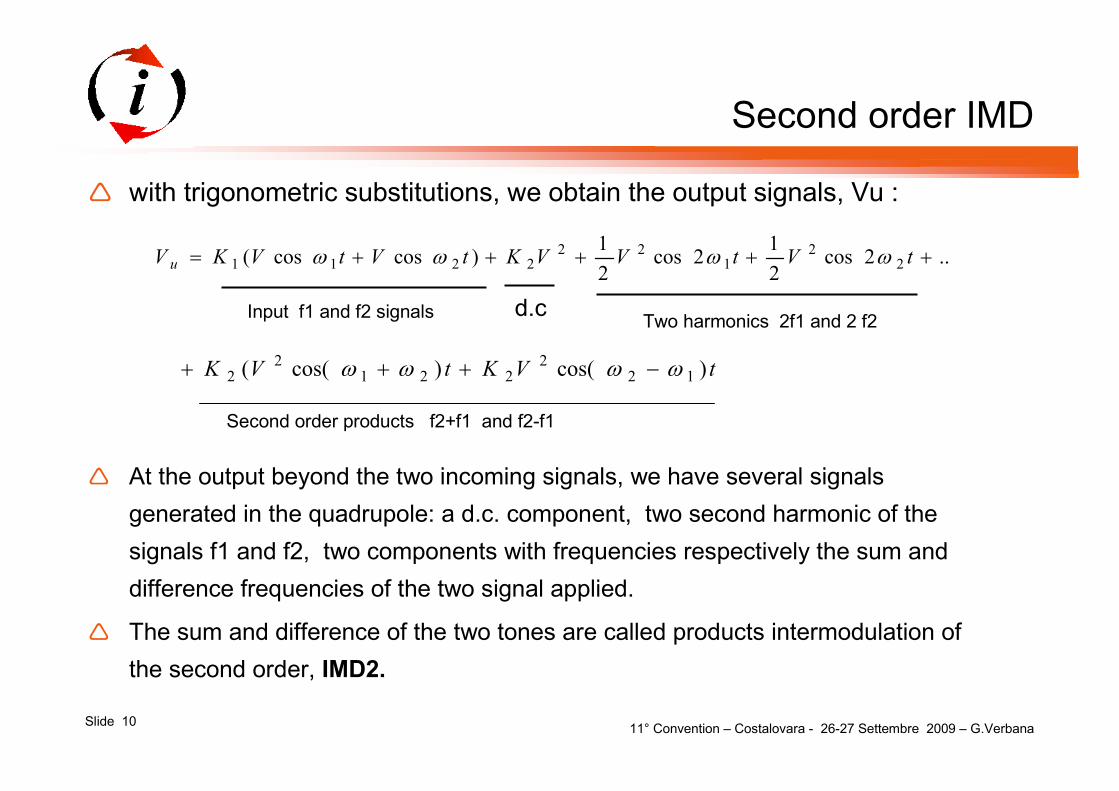
� with trigonometric substitutions, we obtain the output signals, Vu :
� At the output beyond the two incoming signals, we have several signals
generated in the quadrupole: a d.c. component, two second harmonic of the
signals f1 and f2, two components with frequencies respectively the sum and
difference frequencies of the two signal applied.
� The sum and difference of the two tones are called products intermodulation of
the second order, IMD2.
..2cos2
12cos
2
1)coscos( 2
21
222211 +++++= tVtVVKtVtVKV u ωωωω
tVKtVK )cos()cos(( 122
2212
2 ωωωω −+++
Input f1 and f2 signals d.cTwo harmonics 2f1 and 2 f2
Second order products f2+f1 and f2-f1

11° Convention – Costalovara - 26-27 Settembre 2009 – G.VerbanaSlide 11
Considerations on even order IMDn
� ..in the frequency domain we get..
� The signals generated by the even orders of IMD (2-4-6 etc.) tend to be out-of-band for
most RF applications and easily removed by filters. This is true for all the quadripole RF
inputs that have a narrow band as professional receivers up to the 80s, thanks to
sophisticated preselectors (e.g., R-390 Collins), the second-order intermodulation was
never a problem.
� Today, with irreversible evolution to design multi–octave (broadband) amplifier, mixer, etc
you should be careful before say that the receiver under test introduce only distortion of
odd-order.
� The easiest way to lessen second order IMD is to use a push-pull configuration
fd.c 2f1 2f2f2+f1
f2-f1f1 f2
∆f
Band
11° Convention – Costalovara - 26-27 Settembre 2009 – G.VerbanaSlide 12
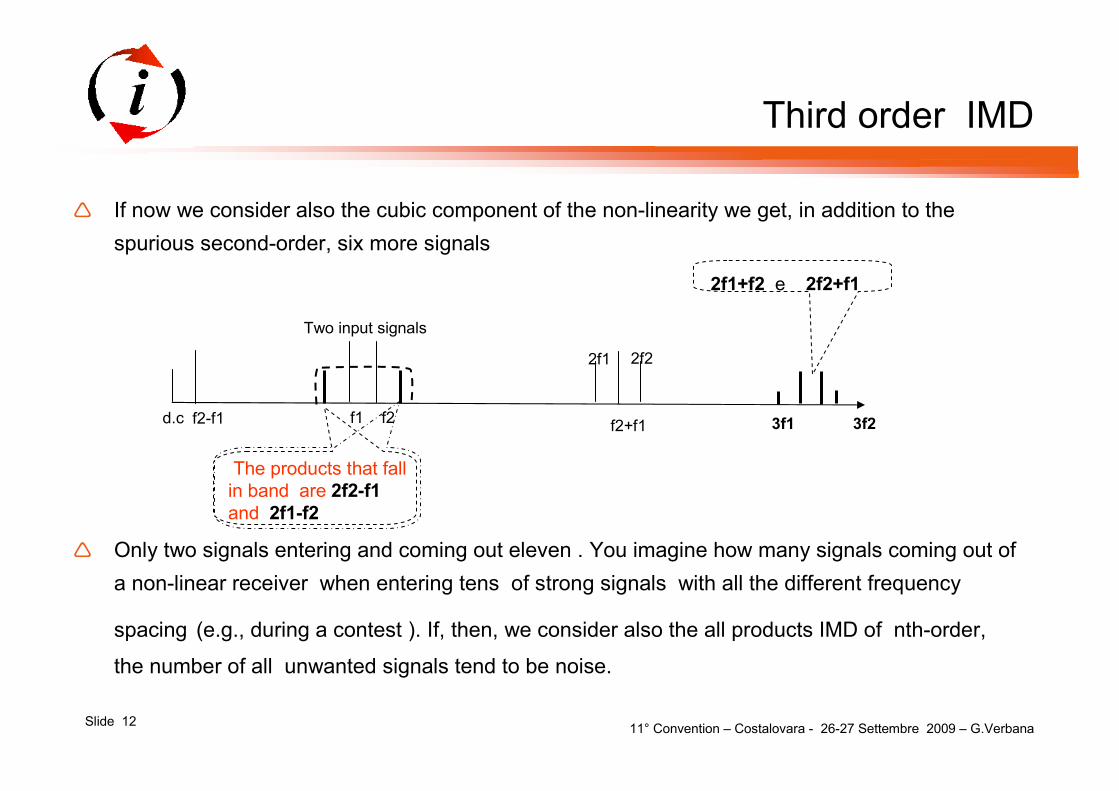
Third order IMD
� If now we consider also the cubic component of the non-linearity we get, in addition to the
spurious second-order, six more signals
� Only two signals entering and coming out eleven . You imagine how many signals coming out of
a non-linear receiver when entering tens of strong signals with all the different frequency
spacing (e.g., during a contest ). If, then, we consider also the all products IMD of nth-order,
the number of all unwanted signals tend to be noise.
d.c f2-f1
Two input signals
3f1 3f2
2f1+f2 e 2f2+f1
The products that fall
in band are 2f2-f1
and 2f1-f2
f1 f2f2+f1
2f22f1
11° Convention – Costalovara - 26-27 Settembre 2009 – G.VerbanaSlide 13
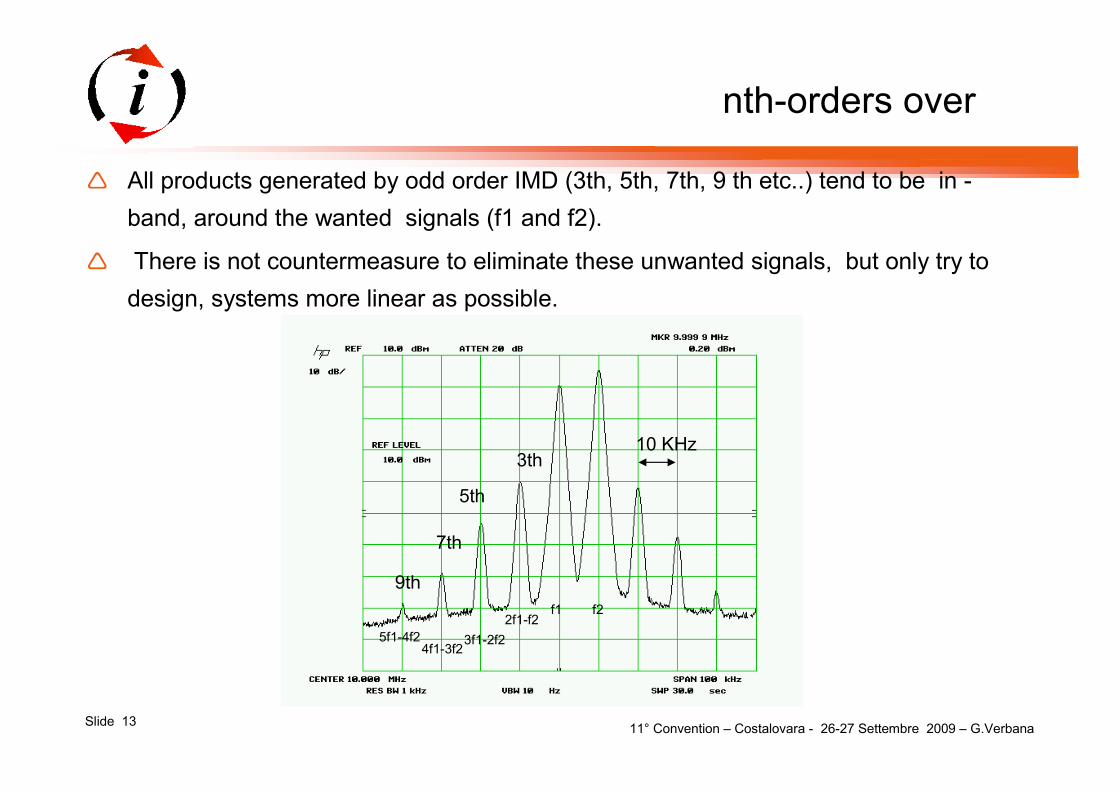
nth-orders over
3th
5th
7th
9th
10 KHz
2f1-f2
3f1-2f24f1-3f2
5f1-4f2
f1 f2
� All products generated by odd order IMD (3th, 5th, 7th, 9 th etc..) tend to be in -
band, around the wanted signals (f1 and f2).
� There is not countermeasure to eliminate these unwanted signals, but only try to
design, systems more linear as possible.
11° Convention – Costalovara - 26-27 Settembre 2009 – G.VerbanaSlide 14
0dBm
-10dBm
-20dBm
IMD3=35dB
IMD5=53dB
10 kHz
f1 f2
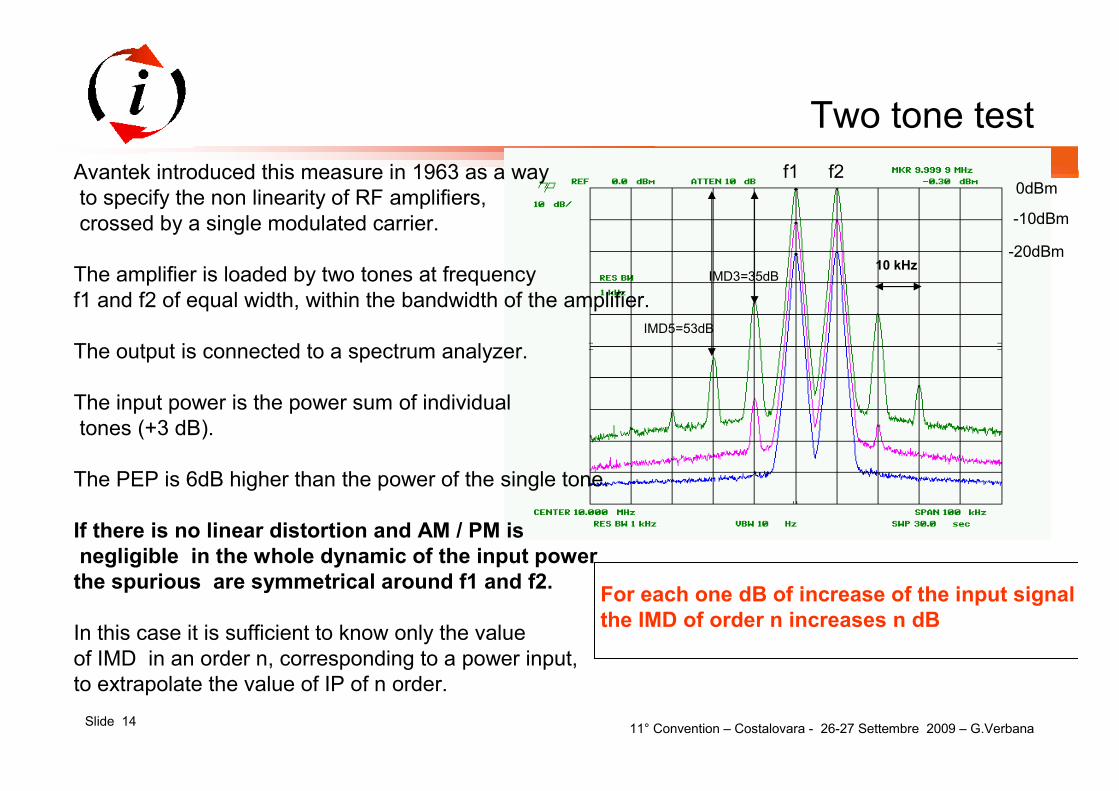
Two tone test
For each one dB of increase of the input signal
the IMD of order n increases n dB
Avantek introduced this measure in 1963 as a way
to specify the non linearity of RF amplifiers,
crossed by a single modulated carrier.
The amplifier is loaded by two tones at frequency
f1 and f2 of equal width, within the bandwidth of the amplifier.
The output is connected to a spectrum analyzer.
The input power is the power sum of individual
tones (+3 dB).
The PEP is 6dB higher than the power of the single tone.
If there is no linear distortion and AM / PM is
negligible in the whole dynamic of the input power
the spurious are symmetrical around f1 and f2.
In this case it is sufficient to know only the value
of IMD in an order n, corresponding to a power input,
to extrapolate the value of IP of n order.
11° Convention – Costalovara - 26-27 Settembre 2009 – G.VerbanaSlide 15
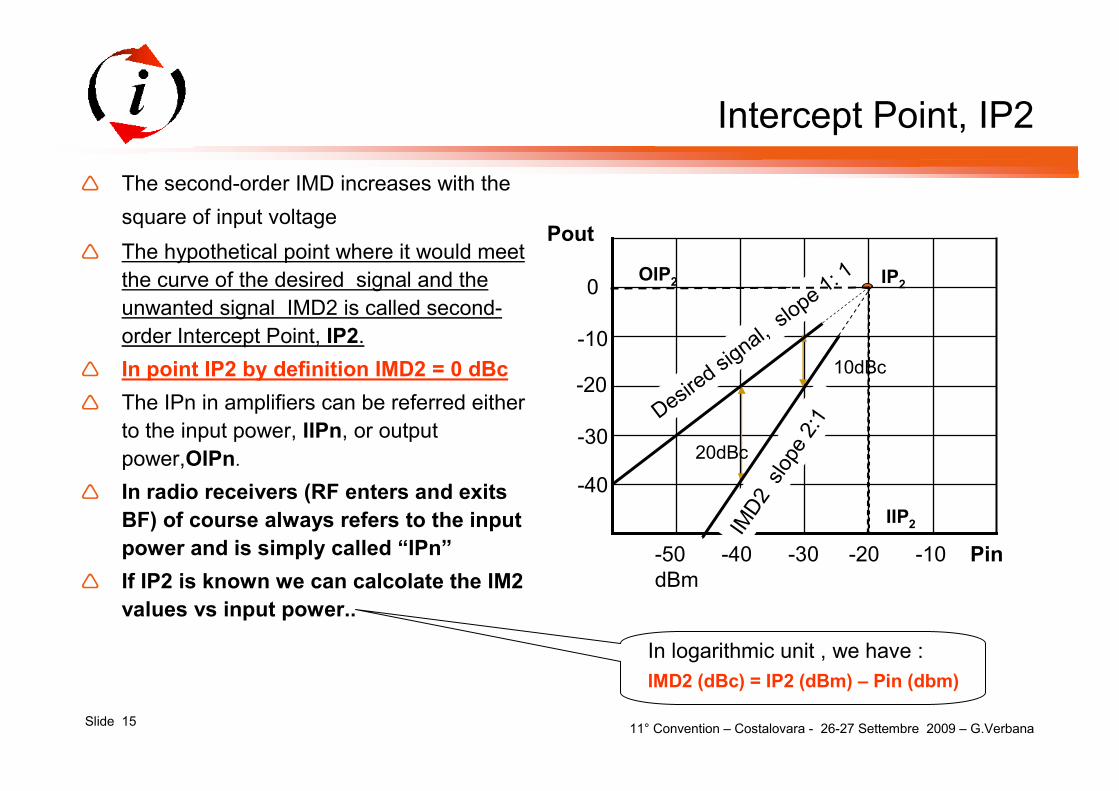
Intercept Point, IP2
� The second-order IMD increases with the
square of input voltage
� The hypothetical point where it would meet
the curve of the desired signal and the
unwanted signal IMD2 is called second-
order Intercept Point, IP2.
� In point IP2 by definition IMD2 = 0 dBc
� The IPn in amplifiers can be referred either
to the input power, IIPn, or output
power,OIPn.
� In radio receivers (RF enters and exits
BF) of course always refers to the input
power and is simply called “IPn”
� If IP2 is known we can calcolate the IM2
values vs input power..
Pout
IP2
10dBc
Desired
signal,
slope
1: 1
IMD
2 s
lope
2:1
20dBc
-50 -40 -30 -20 -10 Pin
dBm
0
-10
-20
-30
-40
OIP2
IIP2
In logarithmic unit , we have :
IMD2 (dBc) = IP2 (dBm) – Pin (dbm)
11° Convention – Costalovara - 26-27 Settembre 2009 – G.VerbanaSlide 16
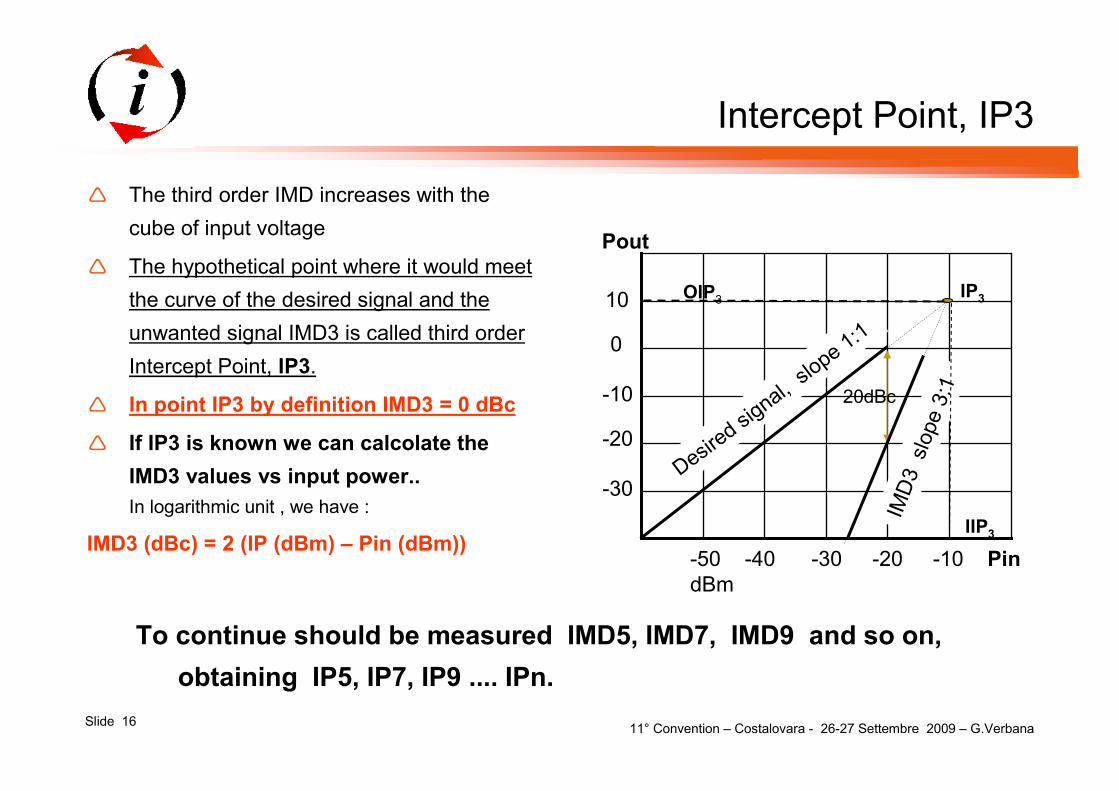
Intercept Point, IP3
� The third order IMD increases with the
cube of input voltage
� The hypothetical point where it would meet
the curve of the desired signal and the
unwanted signal IMD3 is called third order
Intercept Point, IP3.
� In point IP3 by definition IMD3 = 0 dBc
� If IP3 is known we can calcolate the
IMD3 values vs input power..
In logarithmic unit , we have :
IMD3 (dBc) = 2 (IP (dBm) – Pin (dBm))-50 -40 -30 -20 -10 Pin
dBm
IP3
Desired
signal,
slope
1:1
IMD
3 sl
ope
3:1
20dBc
Pout
0
-10
-20
-30
10 OIP3
IIP3
To continue should be measured IMD5, IMD7, IMD9 and so on,
obtaining IP5, IP7, IP9 .... IPn.
11° Convention – Costalovara - 26-27 Settembre 2009 – G.VerbanaSlide 17
Dynamics of receivers, DR
� From the seventies and widespread method of measuring the dynamic range, DR,
receivers with single (BDR) and two tones (IPn- DRn)
� The DRn is the difference (in log unit) between the max level and at the mininum
level (MDS)
� The max level is determined of the interfering power in the incoming Rx (at different
offset frequency (f2-f1)) that increases the output, the MDS value of 3 db on the
desired channel,
� In two tone test signal f1 and f2 are considered interfering, and the receiver is tuned,
in the case of DR3, on the frequency 2f2-f1 or 2f1-f2.
� In recent years I have seen, on OM magazine, to use frequency spacing (offset) of
100-50-25-20-10 -7-5-3 -2 kHz up to 2.4 kHz SSB channels that 500 Hz CW
channel.
11° Convention – Costalovara - 26-27 Settembre 2009 – G.VerbanaSlide 18
� Then for each value of frequency offset, we have a huge values family IPn and DRn
(for n = 2.3,4 and 5) multiplied by every amateur band into the two classic conditions:
high to low sensitivity (Pre on or off).
� A considerable amount of data to interpret and difficult to compare. But what is
surprising is that with dozens and dozens of "numbers", yet we do not get a full
assessment for confirmation of the true loss of sensitivity, caused by a high number of
signals at the input receiver.
� The effective loss of comprehensibility of a weak signal , due to noise generated by
adding random in amplitude and phase of dozens of signals with different frequency
spacing in entering the front-end receiver, may be different than two tone test (e.g. the
distorsion product amplitude may be dependent on the determinated offset frequency) .
� One can understand how, sometimes, when comparing two receivers stressed by so
many strong signals, switching in real time the same antenna, you can hear a low signal
to the receiver less powerful (as values of two tone test) while the another, the weak
desired signal is not decipherable.
Test in field
11° Convention – Costalovara - 26-27 Settembre 2009 – G.VerbanaSlide 19
Multi tone test
� We have seen that the classical two-tone test does not provide an assessment that
matches the real conditions when the system is crossed by many signals. The two
tone test has many shortcoming for broadband receiver loaded with many signal.
� Even on the transmitters is understood, in the eighties, that microwave amplifiers for
scramblered (broad-spectrum) single carrier in ultra linear modulation (n-QAM) or
multi-carrier (OFDM), introduce distortions on the spectrum (spectral regrows) not
justified by the good values of IP3, measured with the classic two tone test.
Everything was clarified with measurements at least eight, also modulated, tones
test (Patend in Telettra, 1984- now Alcatel-Lucent )
� A eight uncorrelated tones (four above and four below the desired channel give
results more reality over two tone est.
11° Convention – Costalovara - 26-27 Settembre 2009 – G.VerbanaSlide 20
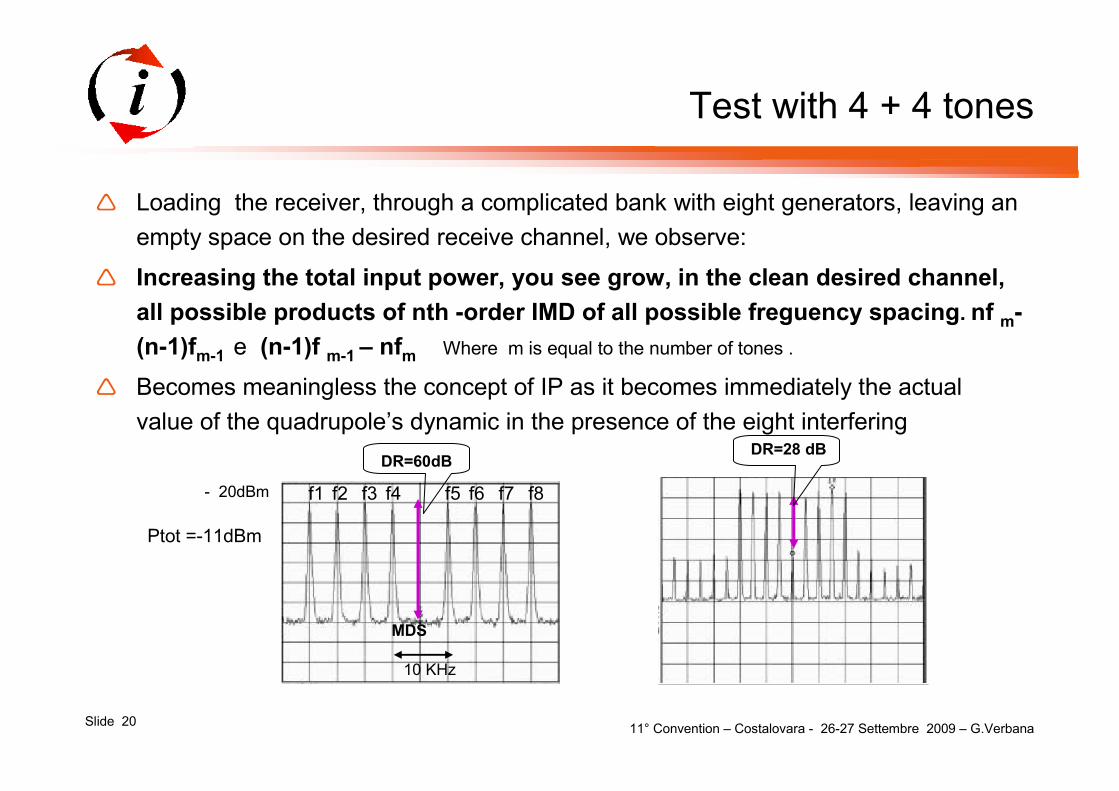
Test with 4 + 4 tones
� Loading the receiver, through a complicated bank with eight generators, leaving an
empty space on the desired receive channel, we observe:
� Increasing the total input power, you see grow, in the clean desired channel,
all possible products of nth -order IMD of all possible freguency spacing. nf m-
(n-1)fm-1 e (n-1)f m-1 – nfm Where m is equal to the number of tones .
� Becomes meaningless the concept of IP as it becomes immediately the actual
value of the quadrupole’s dynamic in the presence of the eight interfering
- 20dBm
10 KHz
f1 f2 f5f3 f4 f7f6 f8
MDS
DR=60dB DR=28 dB
Ptot =-11dBm
11° Convention – Costalovara - 26-27 Settembre 2009 – G.VerbanaSlide 21
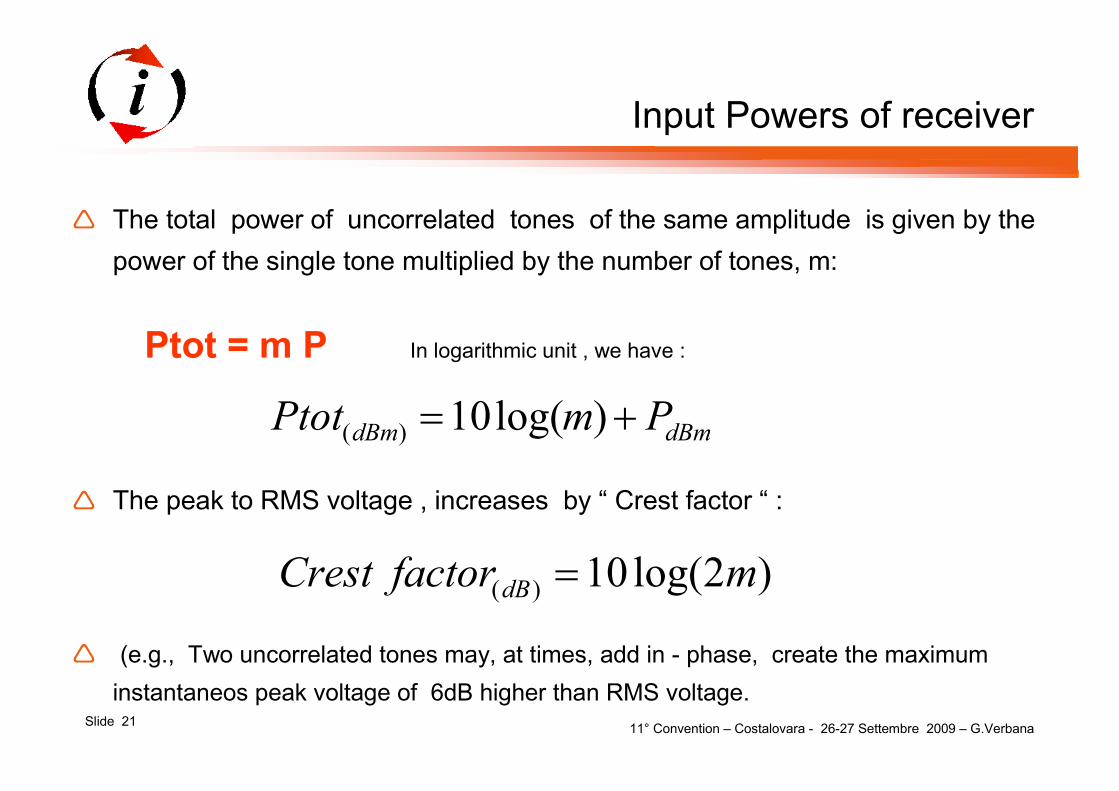
Input Powers of receiver
� The total power of uncorrelated tones of the same amplitude is given by the
power of the single tone multiplied by the number of tones, m:
Ptot = m P In logarithmic unit , we have :
� The peak to RMS voltage , increases by “ Crest factor “ :
� (e.g., Two uncorrelated tones may, at times, add in - phase, create the maximum
instantaneos peak voltage of 6dB higher than RMS voltage.
dBmdBm PmPtot += )log(10)(
)2log(10 )( mfactorCrest dB =
11° Convention – Costalovara - 26-27 Settembre 2009 – G.VerbanaSlide 22
100 - 1.000 -10.000 tones
� If we analyze a large number of uncorrelated tones , a function of time, we
get a certain kind of randomness of the amplitude. They follow a regular
pattern called a distribution function.
� The most important functions of distributions are: binomial, Poisson, normal or
Gaussian and Rayleigh.
� A sufficiently large number of indipendent random variables, each with finite
mean and variance, will be approximately a normal or Gaussian (central limit
theorem )
� The distribution of the instantaneous voltage resulting from the summation
of many independent amplitude and phase signals , follows the law of
Gauss. Exactly the same distribution of the stochastic process thermal
agitation of electrons in a conductor (thermal noise).
11° Convention – Costalovara - 26-27 Settembre 2009 – G.VerbanaSlide 23
NPR, Noise Power Ratio
� Therefore, if the result of a sum of multi signals produce the
same pattern of the thermal noise ........
......then we can use a single white Gaussian noise generator, to
simulate a large number of uncorrelated tones.
� This is the basic concept of measuring noise power ratio, NPR.
� The NPR method emulates many signal by loading the
receveirs with white noise. In this way, all combinations of
carrier frequency spacing are taken into account, and a true
worst-case measurement is made.
11° Convention – Costalovara - 26-27 Settembre 2009 – G.VerbanaSlide 24
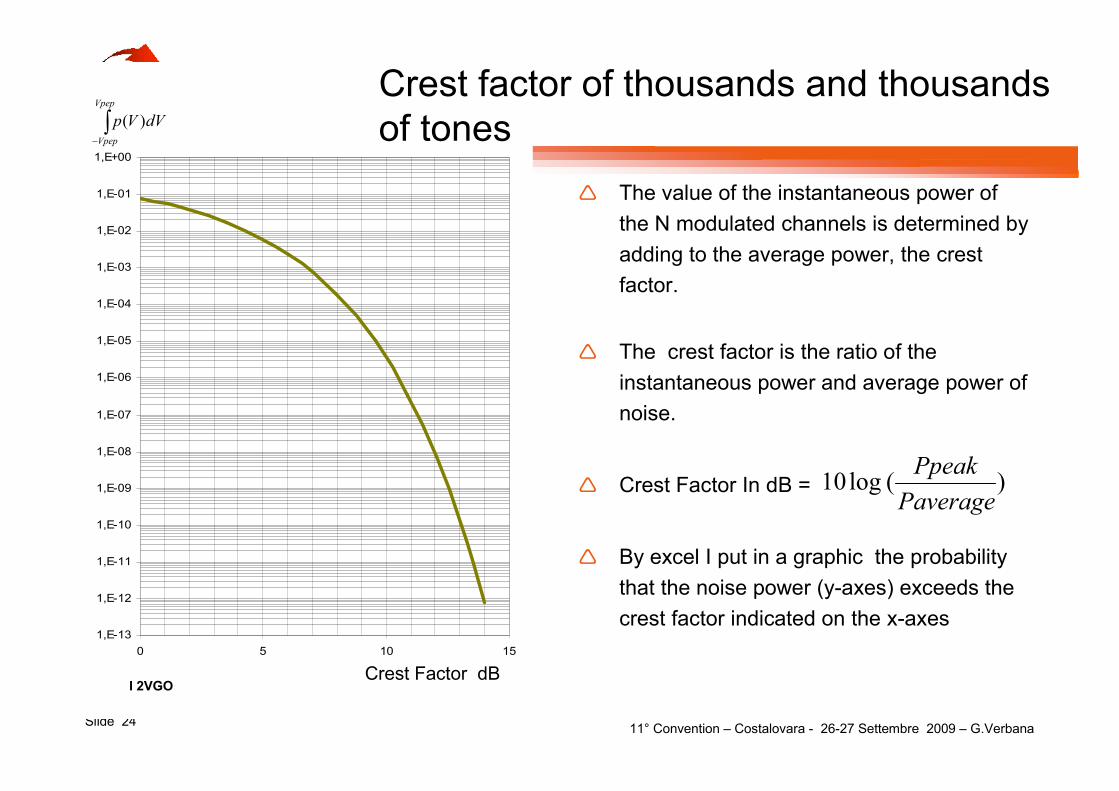
� The value of the instantaneous power of
the N modulated channels is determined by
adding to the average power, the crest
factor.
� The crest factor is the ratio of the
instantaneous power and average power of
noise.
� Crest Factor In dB =
� By excel I put in a graphic the probability
that the noise power (y-axes) exceeds the
crest factor indicated on the x-axes
)( log10Paverage
Ppeak
1,E-13
1,E-12
1,E-11
1,E-10
1,E-09
1,E-08
1,E-07
1,E-06
1,E-05
1,E-04
1,E-03
1,E-02
1,E-01
1,E+00
0 5 10 15
∫−
Vpep
Vpep
dVVp )(
I 2VGO Crest Factor dB
Crest factor of thousands and thousands
of tones
11° Convention – Costalovara - 26-27 Settembre 2009 – G.VerbanaSlide 25
What needs
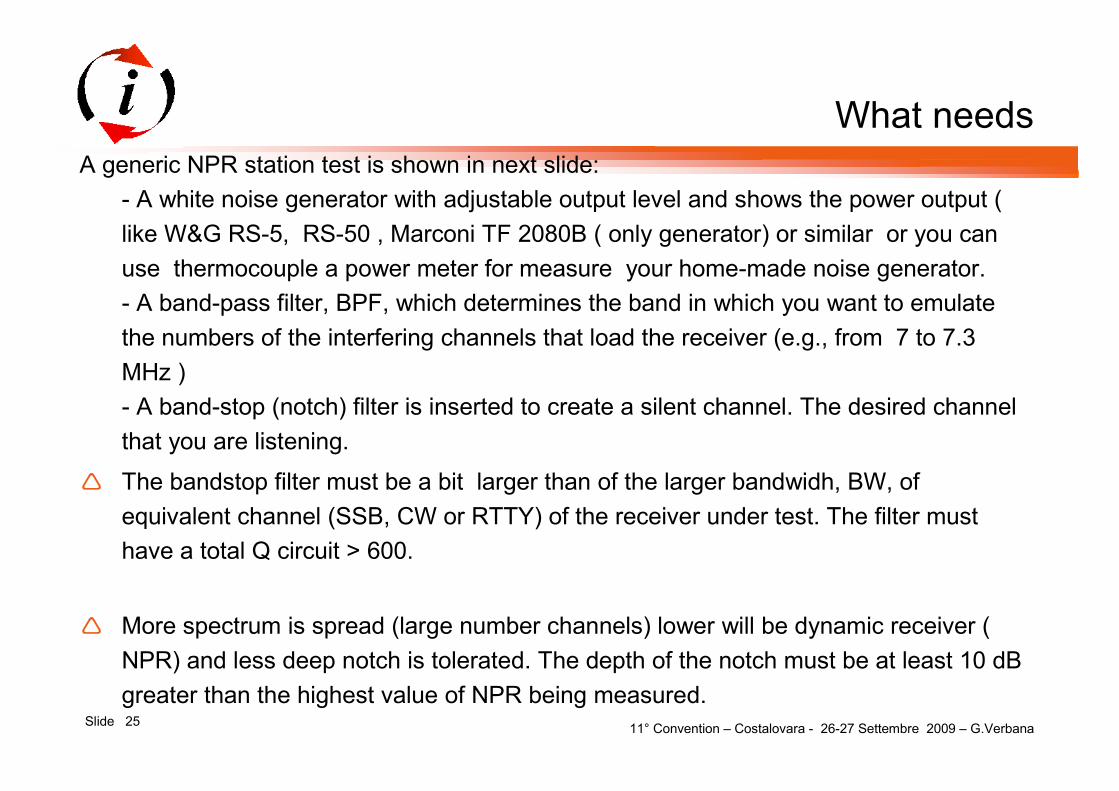
A generic NPR station test is shown in next slide:
- A white noise generator with adjustable output level and shows the power output (
like W&G RS-5, RS-50 , Marconi TF 2080B ( only generator) or similar or you can
use thermocouple a power meter for measure your home-made noise generator.
- A band-pass filter, BPF, which determines the band in which you want to emulate
the numbers of the interfering channels that load the receiver (e.g., from 7 to 7.3
MHz )
- A band-stop (notch) filter is inserted to create a silent channel. The desired channel
that you are listening.
� The bandstop filter must be a bit larger than of the larger bandwidh, BW, of
equivalent channel (SSB, CW or RTTY) of the receiver under test. The filter must
have a total Q circuit > 600.
� More spectrum is spread (large number channels) lower will be dynamic receiver (
NPR) and less deep notch is tolerated. The depth of the notch must be at least 10 dB
greater than the highest value of NPR being measured.

11° Convention – Costalovara - 26-27 Settembre 2009 – G.VerbanaSlide 26
How to set up an NPR testing
300/0,5= 600
350/0,5 = 700
2000/0,5= 4000
Equivalent CW
channels number
BW = 500Hz
21dB
21,6dB
29 dB
BWR SSB
10log (Band/BW) =
10log (Ptot / PBw)
28 dB
28.5dB
36 dB
300/2,4= 125
350/2,4= 146
2000/2,4= 834
300
350
2000
7-7,3
14-14,350
4-6
BWR CW
10log (Band/BW) =
10log (Ptot/PBw)
Equivalent SSB
channels number
BW =2,4Khz
Band
kHz
BPF
MHz
Examples f f
S(f)
f
S(f)
Band 3 kHz
S(f)
NPR
Noise floor
BPF 10 kHz -30MHz Notch Filter
White
Noise
Generator
Rx under test with his BW
RMS
VoltmeterRF
BBCW
SSB
IMD =3dB
Qc > 600
11° Convention – Costalovara - 26-27 Settembre 2009 – G.VerbanaSlide 27
The technique of measuring
� The procedure is simple. Make it easier to write
You tune the receiver to the frequency of the notch filter. It
regulates the level of the noise generator to a minimum (low
loading) In this way you are sure that the rms voltmeter (I used
Hp 3400A) connected to the output of the receiver measures
only the noise floor.
� By increasing the levels of the generator, all IMD products
of all orders identified in the non-linear distortion
amplitude and phase) and /or spurious free, tend to fill the
notch's hole. Take note the value when the total input power
increases the noise floor (observed by the rms voltmeter or even a spectrum
if you have SDR receiver) , of 3dB.

11° Convention – Costalovara - 26-27 Settembre 2009 – G.VerbanaSlide 28
NPR vs loading condition to
determine the optimum dynamic
� The NPR is poor at low loading levels
because the receiver is being operated
near its own noise floor.
� Increasing the loading the NPR will
improve 1dB for every 1dB of the loading
level
� The maximum input power, Ptot, which
corresponds the optimum NPR, I have
determined when the rms power noise
floor into the slot, increase of 3dB.
� The NPR is also poor at very high loading
level. But the slope on this side of the
curve is steeper since the distortion
products are dominant in this case. If the distortions are caused by nth-order harmonics
then the IMD products increase by n dB for every
1 dB increase the loading level.
NPR(dB)
Loading level RX
50
40
11° Convention – Costalovara - 26-27 Settembre 2009 – G.VerbanaSlide 29
NPR
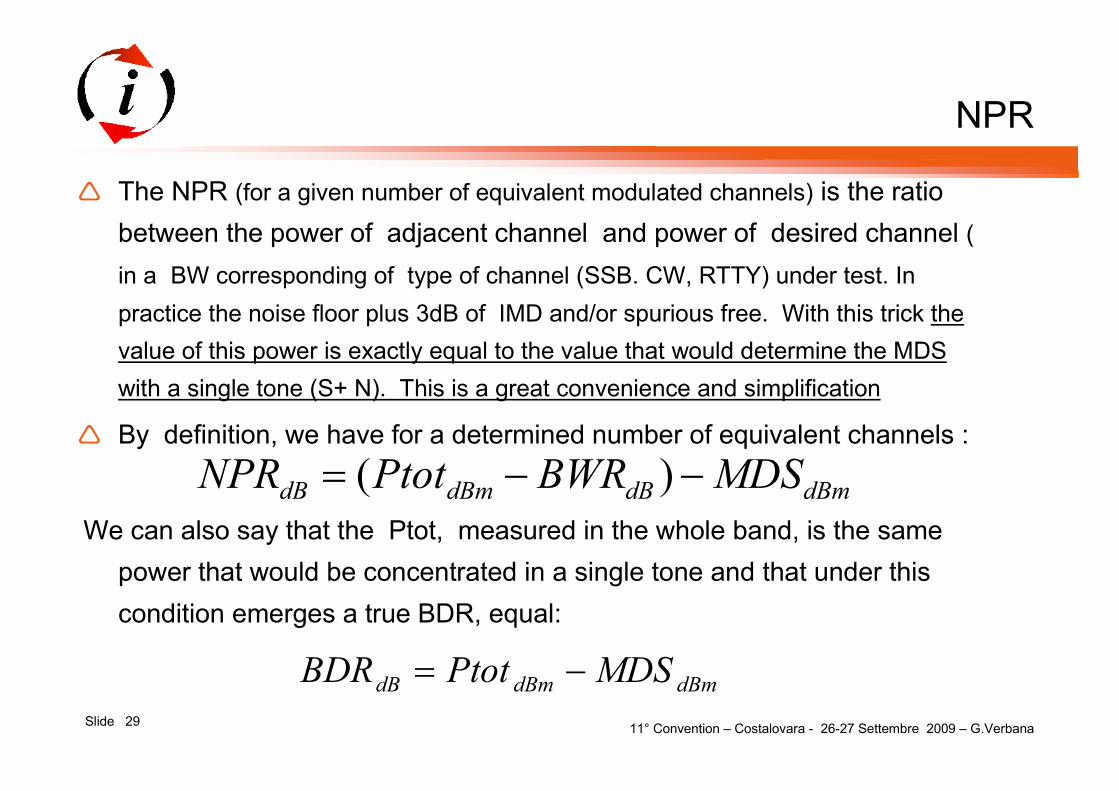
� The NPR (for a given number of equivalent modulated channels) is the ratio
between the power of adjacent channel and power of desired channel (
in a BW corresponding of type of channel (SSB. CW, RTTY) under test. In
practice the noise floor plus 3dB of IMD and/or spurious free. With this trick the
value of this power is exactly equal to the value that would determine the MDS
with a single tone (S+ N). This is a great convenience and simplification
� By definition, we have for a determined number of equivalent channels :
We can also say that the Ptot, measured in the whole band, is the same
power that would be concentrated in a single tone and that under this
condition emerges a true BDR, equal:
dBmdBdBmdB MDSBWRPtotNPR −−= )(
dBmdBmdB MDSPtotBDR −=
11° Convention – Costalovara - 26-27 Settembre 2009 – G.VerbanaSlide 30
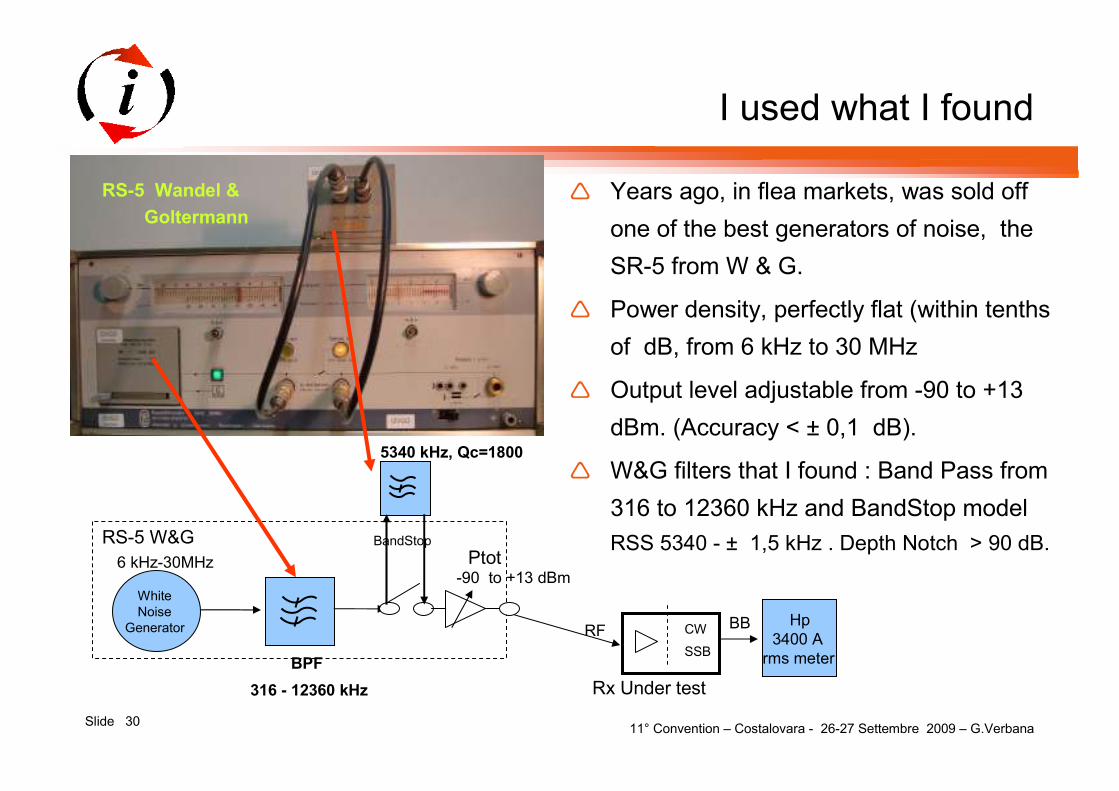
I used what I found
� Years ago, in flea markets, was sold off
one of the best generators of noise, the
SR-5 from W & G.
� Power density, perfectly flat (within tenths
of dB, from 6 kHz to 30 MHz
� Output level adjustable from -90 to +13
dBm. (Accuracy < ± 0,1 dB).
� W&G filters that I found : Band Pass from
316 to 12360 kHz and BandStop model
RSS 5340 - ± 1,5 kHz . Depth Notch > 90 dB. BandStop
BPF
316 - 12360 kHz
Hp
3400 A
rms meter
RFBBCW
SSB
Rx Under test
5340 kHz, Qc=1800
-90 to +13 dBmWhite
Noise
Generator
6 kHz-30MHz
RS-5 Wandel &
Goltermann
RS-5 W&GPtot

11° Convention – Costalovara - 26-27 Settembre 2009 – G.VerbanaSlide 31
-40dBm
Band = 12044 kHz
316kH
z
12360 k
Hz
24088 equivalent modulated CW channels , 500 Hz,
or
4817 equivalent modulated SSB channels , 2.4 kHz
Power spectral density of the
signal used
BWR =10Log12044/10 = 31 dB
Spectral density = -40.2dBm/10kHz.
Ptot (12044kHz) = -40.2+31= -9.8 dBm
11° Convention – Costalovara - 26-27 Settembre 2009 – G.VerbanaSlide 32
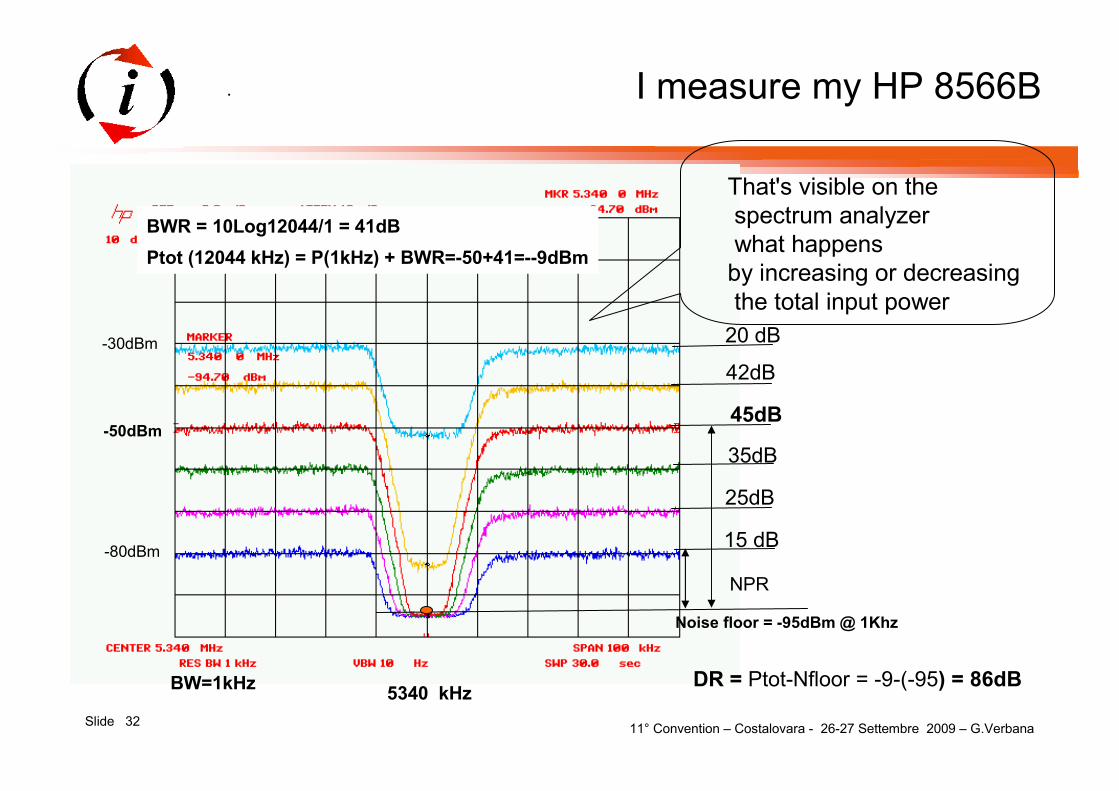
I measure my HP 8566B
-80dBm
Noise floor = -95dBm @ 1Khz
-50dBm
15 dB
25dB
35dB
45dB
42dB
20 dB-30dBm
5340 kHz
BWR = 10Log12044/1 = 41dB
Ptot (12044 kHz) = P(1kHz) + BWR=-50+41=--9dBm
.
BW=1kHz
That's visible on the
spectrum analyzer
what happens
by increasing or decreasing
the total input power
NPR
DR = Ptot-Nfloor = -9-(-95) = 86dB
11° Convention – Costalovara - 26-27 Settembre 2009 – G.VerbanaSlide 33
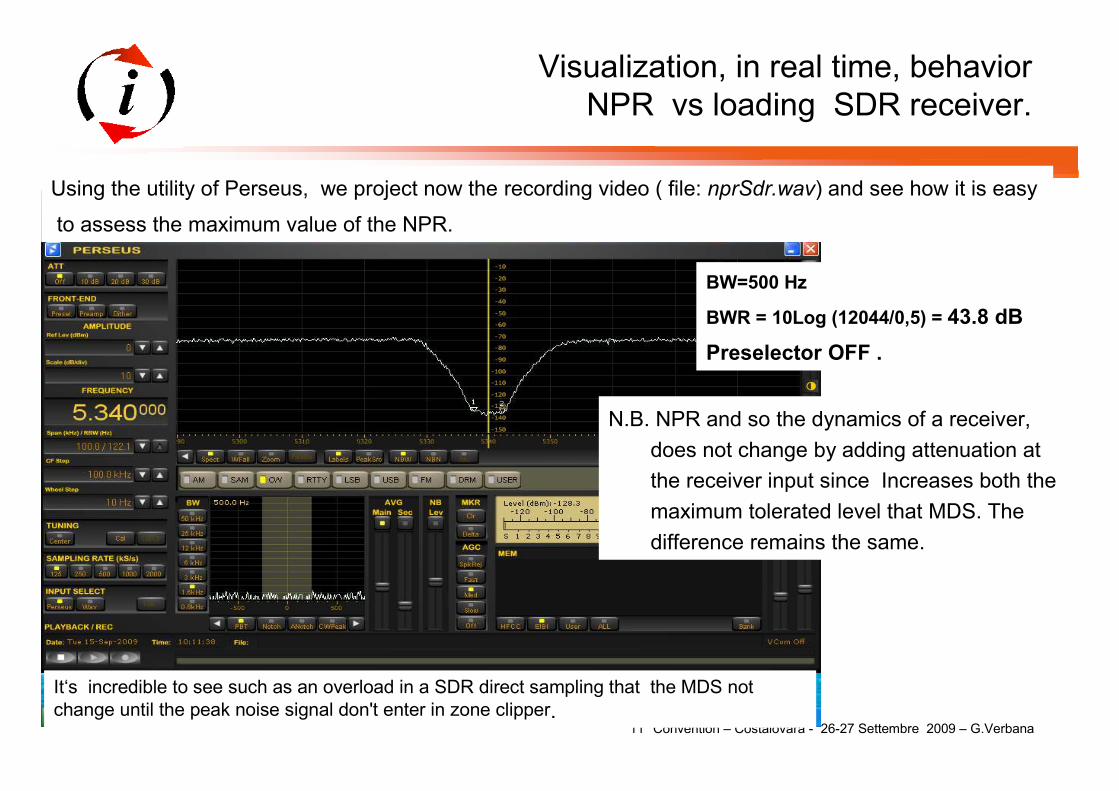
Visualization, in real time, behavior
NPR vs loading SDR receiver.
Using the utility of Perseus, we project now the recording video ( file: nprSdr.wav) and see how it is easy
to assess the maximum value of the NPR.
BW=500 Hz
BWR = 10Log (12044/0,5) = 43.8 dB
Preselector OFF .
N.B. NPR and so the dynamics of a receiver,
does not change by adding attenuation at
the receiver input since Increases both the
maximum tolerated level that MDS. The
difference remains the same.
It‘s incredible to see such as an overload in a SDR direct sampling that the MDS not
change until the peak noise signal don't enter in zone clipper.
11° Convention – Costalovara - 26-27 Settembre 2009 – G.VerbanaSlide 34
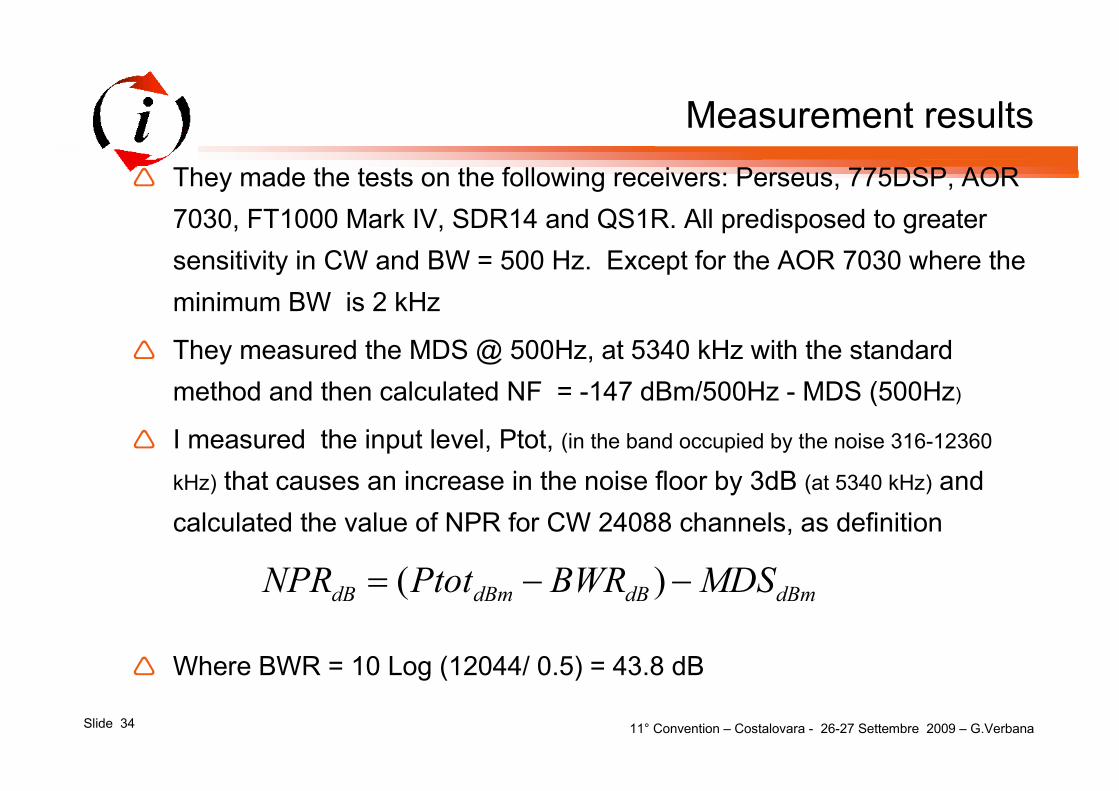
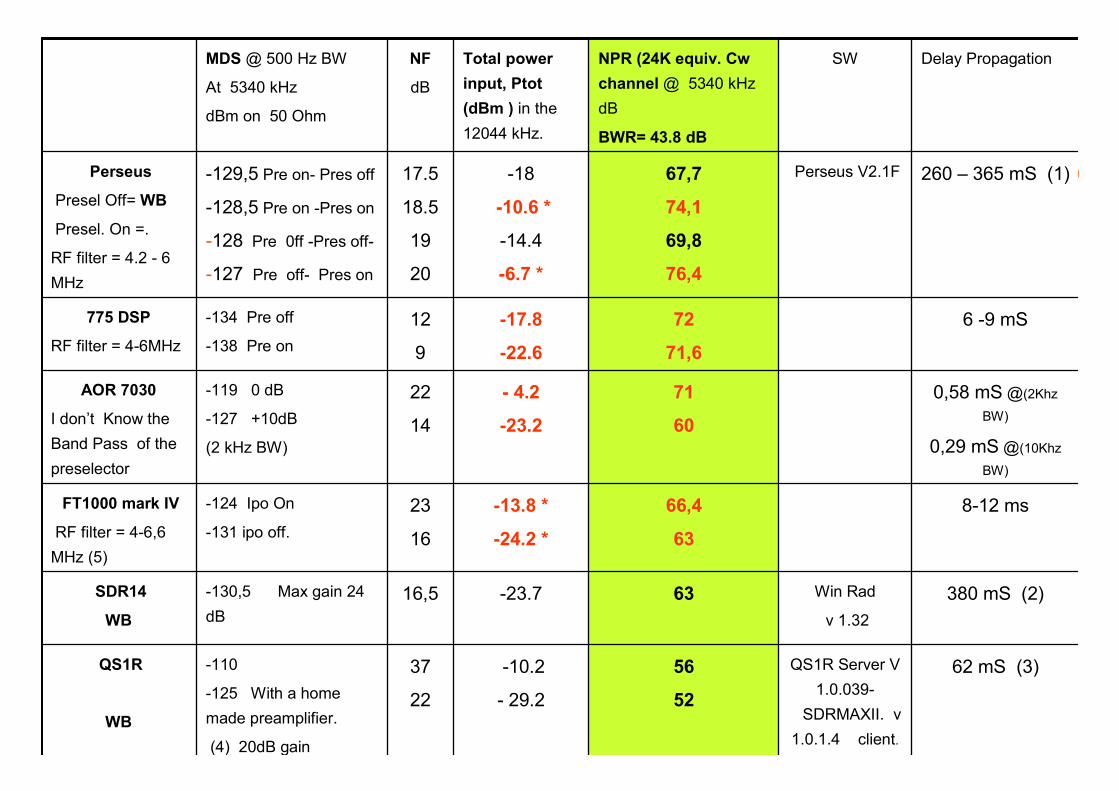
Measurement results
� They made the tests on the following receivers: Perseus, 775DSP, AOR
7030, FT1000 Mark IV, SDR14 and QS1R. All predisposed to greater
sensitivity in CW and BW = 500 Hz. Except for the AOR 7030 where the
minimum BW is 2 kHz
� They measured the MDS @ 500Hz, at 5340 kHz with the standard
method and then calculated NF = -147 dBm/500Hz - MDS (500Hz)
� I measured the input level, Ptot, (in the band occupied by the noise 316-12360
kHz) that causes an increase in the noise floor by 3dB (at 5340 kHz) and
calculated the value of NPR for CW 24088 channels, as definition
� Where BWR = 10 Log (12044/ 0.5) = 43.8 dB
dBmdBdBmdB MDSBWRPtotNPR −−= )(
11° Convention – Costalovara - 26-27 Settembre 2009 – G.VerbanaSlide 35
-
380 mS (2) Win Rad
v 1.32
63-23.7 16,5-130,5 Max gain 24
dB
SDR14
WB
8-12 ms 66,4
63
-13.8 *
-24.2 *
23
16
-124 Ipo On
-131 ipo off.
FT1000 mark IV
RF filter = 4-6,6
MHz (5)
0,58 mS @(2Khz
BW)
0,29 mS @(10Khz
BW)
71
60
- 4.2
-23.2
22
14
-119 0 dB
-127 +10dB
(2 kHz BW)
AOR 7030
I don’t Know the
Band Pass of the
preselector
6 -9 mS72
71,6
-17.8
-22.6
12
9
-134 Pre off
-138 Pre on
775 DSP
RF filter = 4-6MHz
260 – 365 mS (1)Perseus V2.1F67,7
74,1
69,8
76,4
-18
-10.6 *
-14.4
-6.7 *
17.5
18.5
19
20
-129,5 Pre on- Pres off
-128,5 Pre on -Pres on
-128 Pre 0ff -Pres off-
-127 Pre off- Pres on
Perseus
Presel Off= WB
Presel. On =.
RF filter = 4.2 - 6
MHz
62 mS (3) QS1R Server V
1.0.039-
SDRMAXII. v
1.0.1.4 client.
56
52
-10.2
- 29.2
37
22
-110
-125 With a home
made preamplifier.
(4) 20dB gain
QS1R
WB
NPR (24K equiv. Cw
channel @ 5340 kHz
dB
BWR= 43.8 dB
SW Total power
input, Ptot
(dBm ) in the
12044 kHz.
Delay PropagationNF
dB
MDS @ 500 Hz BW
At 5340 kHz
dBm on 50 Ohm
11° Convention – Costalovara - 26-27 Settembre 2009 – G.VerbanaSlide 36
Notes on low NPR of QS1R
� As you can see from the table, i would have expected on the QS1R of i2ILS, an
NPR about only 6 dB worse than Perseus, not 14 dB as I tested (69,8 - 56 dB).
Perseus has a MDS better 18 dB than to QS1R (37-19 dB, NF difference ), but
Perseus is 12/13 dB worse than input level clipping (-3.5 , +9 dBm) (1). So the
difference on NPR should be 6 dB (18-12 dB) and also I had to get a total of power
Input, Ptot, at least about 0 dBm and not -10.2 dBm (2)
� I have seen that the low value of the NPR is not due to IMD. When increased
input power, from - 7 dBm to over 0 dBm the NPR not to decreased cause
distortion products. I saw that inside the slot the noise continued to increased
1dB for every 1dB the power loading (thousands of tones let see things that often do not
emerge with only two tones with a fixed frequency offset).
� (1) If you put a 18 dB attenuator to the input of Perseus, MDS becomes equal to QS1R and
improving of 18 dB the maximum level clipping (From about -3,5 to +15 dBm).
� (2) It is the PEP entering the area clipping not the average power. I tested with the same
probability of time (10 sec).
11° Convention – Costalovara - 26-27 Settembre 2009 – G.VerbanaSlide 37
Notes
� It clear that the receivers with preselector filter, the input noise power was
attenuated in dB of 10Log 12044 / BW (kHz) of the preselector filter.
(Considering only the bandwidth at 3dB and not the shape of the filter, in practice I
do not know the exact equivalent noise bandwidth).
� I have not found the block diagram of AOR 7030 or the information that what
kind RF filter uses.
� Only on QS1R, SDR14 and Perseus (with preselector Off) were loaded with
all 24088 equivalent channels telegraph. So the true BDR (see slide 29) is :
99.8 dB for QS1R, 106.8 dB for SDR14 and 113.6dB for Perseus.
� I took the opportunity of the presence of the receivers, to measure also the
propagation delay from the RF receiver input to the audio speaker.
� All SDR were used at the minimum sampling rate, 125 kS / s
11° Convention – Costalovara - 26-27 Settembre 2009 – G.VerbanaSlide 38
Continue notes
� Notes
� 1) The 260 mS were obtained with PC Pentium IV, 1.8 GHz, Sound Blaster
AWE 64. The 365 mS were measured with PC, Amilo, Centrino 1.7 GHz,
integrated AC97 16 bit audio.
� 2) PC ACER Aspire 1654 Wimi – Centrino 2 GHz, integrated audio
� 3) PC like note 2 . The difference is that you do not use the PC sound card.
� 4) A number of users QS1R add an external preamplifier. I2ILS wanted to try
a draft of a Ukrainian OM
� 5) The narrow preselector (Qc= 7,) is present only in the amateur radio
bands. A 5340 kHz is the classic band-pass filter from 4 to 6.6 MHz
11° Convention – Costalovara - 26-27 Settembre 2009 – G.VerbanaSlide 39
Appendix
� Easy and accurate to determine NPR for a given load’s band. Have you
seen, all in just seconds, acting only te knob of the generator’s output level
The two tone test is more complicated and very critical when it comes to
measuring receivers at high IP and low MDS (e.g., when the dynamics is>
95 dB)
� For high-DR, without specific knowledge, proper equipment, a strict
procedure and approved, each laboratory and the operator could give (as
often happens) discordant measures for the same apparatus.
� It is not enough to have old generators with low phase noise, it is necessary
to isolate them as much as possible, have high and constant power to the
receiver and lots of experience.
11° Convention – Costalovara - 26-27 Settembre 2009 – G.VerbanaSlide 40
Test bench for two tones
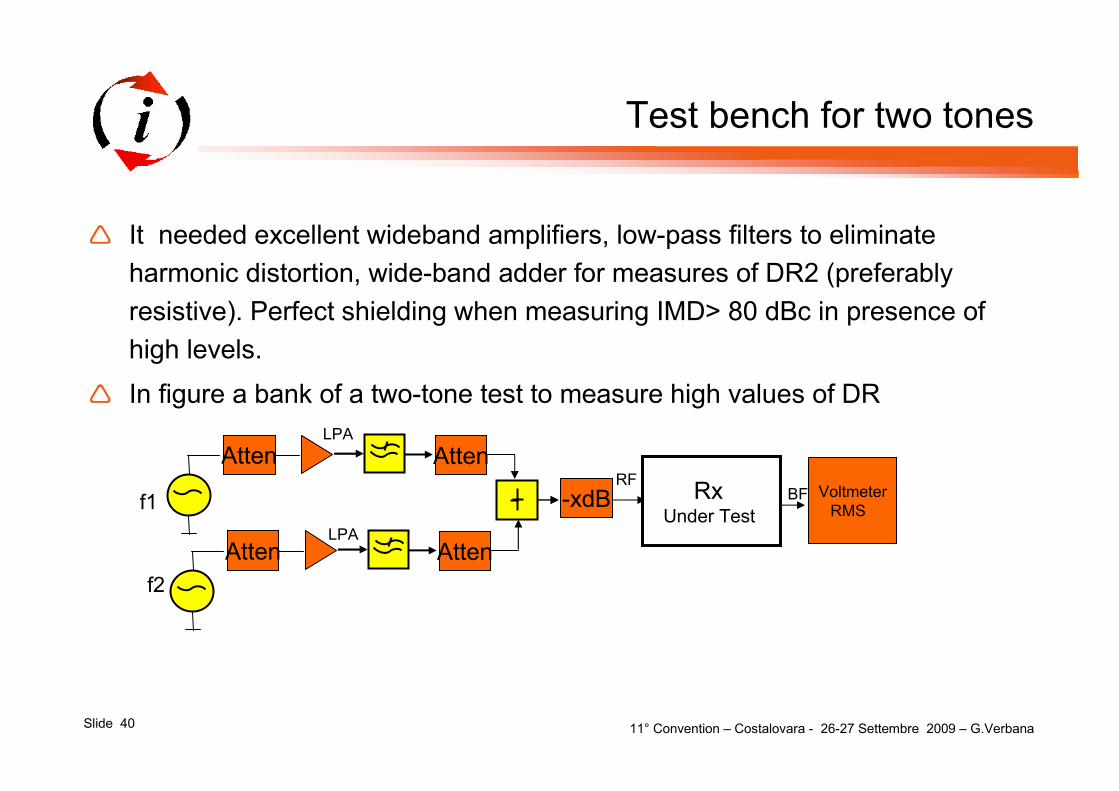
� It needed excellent wideband amplifiers, low-pass filters to eliminate
harmonic distortion, wide-band adder for measures of DR2 (preferably
resistive). Perfect shielding when measuring IMD> 80 dBc in presence of
high levels.
� In figure a bank of a two-tone test to measure high values of DR
Atten Atten
Atten Atten
f2
-xdB RxUnder Test
Voltmeter
RMS BF
RF
LPA
LPA
f1
11° Convention – Costalovara - 26-27 Settembre 2009 – G.VerbanaSlide 41
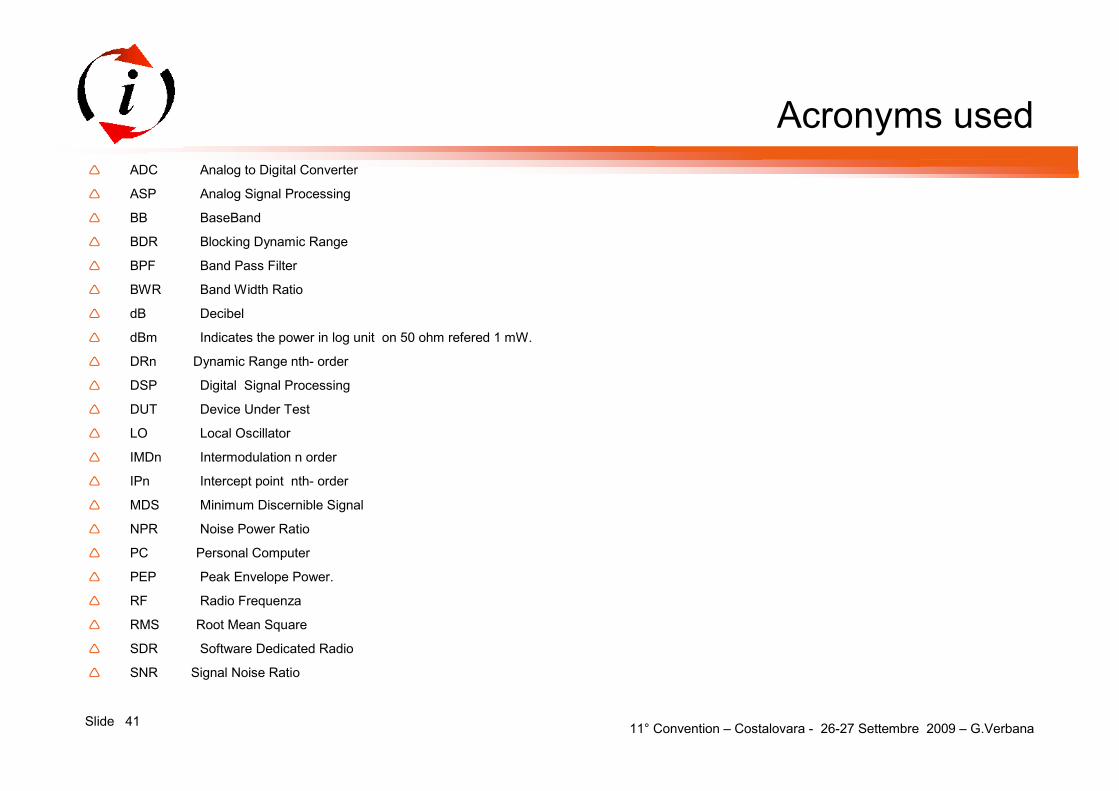
Acronyms used
� ADC Analog to Digital Converter
� ASP Analog Signal Processing
� BB BaseBand
� BDR Blocking Dynamic Range
� BPF Band Pass Filter
� BWR Band Width Ratio
� dB Decibel
� dBm Indicates the power in log unit on 50 ohm refered 1 mW.
� DRn Dynamic Range nth- order
� DSP Digital Signal Processing
� DUT Device Under Test
� LO Local Oscillator
� IMDn Intermodulation n order
� IPn Intercept point nth- order
� MDS Minimum Discernible Signal
� NPR Noise Power Ratio
� PC Personal Computer
� PEP Peak Envelope Power.
� RF Radio Frequenza
� RMS Root Mean Square
� SDR Software Dedicated Radio
� SNR Signal Noise Ratio

11° Convention – Costalovara - 26-27 Settembre 2009 – G.VerbanaSlide 42
Acknowledgements
� A Martin, IW3AUT, at the end of June in Friedrichshafen, brought to me the
bandstop filter RSS 5340, allowing this experience on NPR test.
� A Renato, I2BJS, for the interest and availability of ASP equipment.
� A special thanks to Salvatore, I2ILS, that has all the SDR equipment that I
have measured and despite his commitments, he dedicated to me several
afternoons.