gima: geographical information management and applications
TRANSCRIPT
Introduction Remote Sensing
GIMA: Geographical Information Managementand Applications

Electromagnetic (EM) spectrum

Remote sensing platforms
Remote sensing ≡ Earth observation
RS is a tool; one of the sources of information !Field
Sensor ata distance
EM radiation

Satellite image Terschelling 26 May 2018
4

Drought effect Terschelling 15 July 2018
5

Satellite image Friesland 13 May 2019
6

Satellite image Friesland 19 July 2019
7

Grassland parcels with damage by mice
8

25 July 2019: heatwave over Europe

Huge Seaweed Bloom (Sargassum)

Sargassum on Bonaire

Fires in the U.S. West: 30 August 2021

Arc of Fires U.S. West: 29 August 2021

Hurricane Ida hits Louisiana: 30 August ‘21

GIS Geographical Information System
Well-considered combination of mutually referring data sets of various kinds of position-bound thematic data(database), software inclusive
Requirement:the information layersmatch geometrically
==> OVERLAY STRUCTURE
1. topography
2. soils
3. geology
4. precipitation
5. land cover
6. vegetation
7. remote sensing data
8. surface temperature
9. hydrology
10. population
11. nature conservation
12. environment
13. digital terrain model
14. topographical map
15. -------------------
16. -------------------
17. -------------------
rasterdata
GIS file: field data(point measurements)
vectordata

Meteosat: meteorological satellite


Rotterdam harbour, daytime / nighttime

The remote sensing system
A = sourceB = atmosphereC = objectD = sensorE = receptionF = data analysisG = final product

Sources of EM radiation
100
10-1
10-2
10-3
10-4
0.2 0.5 2 101.0 5 20
radiation (Wcm-2 µm-1)
wavelength (µm)
REFLECTION EMISSION
emitted
thermal radiation
reflected
solar radiation
curves for an “average”object on Earth

EM Spectrum and Windows
200 m0.3 0.6 1.0 5.0 10 50 10m100 1mm 1cm 1m
200 m0.3 0.6 1.0 5.0 10 50 10m100 1mm1cm 1m
multispectral scanners
microwave
window
emission
optical
window
lidar
reflection
photography
human eye
mic
row
ave
s
microwave radiometry
blocking effect of atmosphere
radar
atm
os
ph
eri
ctr
an
sm
itta
nce
UV
blu
egre
en
red
NIR
MIR
MIR
TIR
TIR
thermal scanners
VIS
wavelength
100
0
wavelength (m)
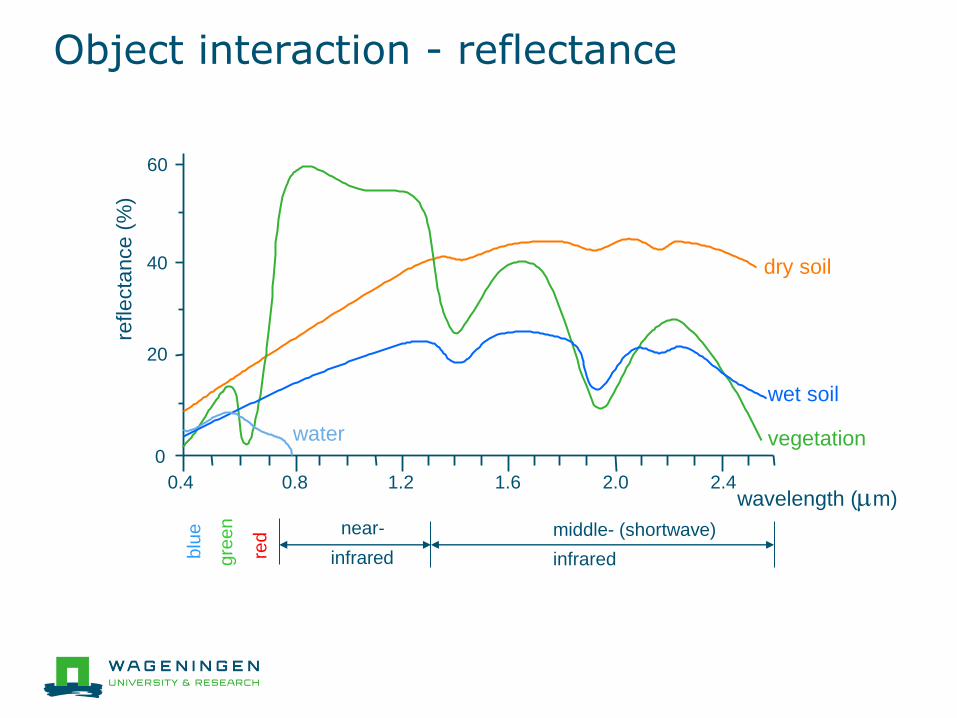
red middle- (shortwave)
infrared
near-
infraredblu
e
gre
en
dry soil
water
wet soil
vegetation
reflecta
nce (
%)
40
20
0
0.8
60
0.4 1.2 1.6 2.0 2.4
Object interaction - reflectance

Active <-> Passive
RS using radiation emitted
by objects:
(PASSIVE)
RS using reflected
solar radiation:
(PASSIVE)
ACTIVE RS:

Principles imaging sensor systems
Pushbroom scannerWhiskbroom scanner
digital recordinganalogue recording digital recording
scanning mirrorshutter
“point” detector
aerial image plane line array detector
imaging optics imaging optics
Camera
(aerial photography)
imaging
optics

Position of spectral bands
Meteosat
NOAA AVHRR
wavelength (m)
red middle-
infrared
near-
infraredblu
e
gre
en
dry soil
waterwet soilvegetationre
fle
cta
nce
(%
)
40
20
00.8
60
0.4 1.2 1.6 2.0 2.4
Pan: IKONOS, Quickbird, GeoEye, WorldView
Multispectral: IKONOS, Quickbird, GeoEye, WorldView
Proba-V
Sentinel-2 MSI8
42 3
Landsat OLIpan
2 3 4 5

Image Processing Options
Tape/DVD/CD: Screen:latent image → Visualization → picture 1
picture 2--------------
picture nOptions:e.g. spectral band selection filtering
displaying band composites band ratioingcontrast modification vegetation index computationhistogram equalization classificationgrey scale enhancement texture analysis colour assignment segmentationdensity slicing geometric correction

Example TM-image, band 4-3-2 (R,G,B)

RS Properties
Moreover:
◆ overview region
◆ differences and coherence
◆ variety of sensors, techniques, processing algorithms
◆ reproducible analysis
◆ in addition to conventional mapping
◆ specified data for application
◆ up to date information
◆ co-operation of human knowledge and machine operations
◆ capability of monitoring with time series of data
◆ reveals changes (change detection)
◆ the invisible becomes visible
◆ objective and quantitative data
◆ extrapolation of point measurements
◆ open up inaccessible regions
◆ integration with GIS
◼ Synopsis
◼ Flexibility
◼ Actuality
◼ Interactivity
◼ Dynamics

LGN detail The Hague - Rotterdam

Global land cover classification - MODIS
254Unclassified
16Barren or Sparsely Vegetated
15Snow and Ice
14Cropland/Natural Vegetation Mosaic
13Urban and Built-Up
12Croplands
11Permanent Wetlands
10Grasslands
9Savannas
8Woody Savannas
7Open Shrubland
6Closed Shrubland
5Mixed Forest
4Deciduous Broadleaf Forest
3Deciduous Needleleaf Forest
2Evergreen Broadleaf Forest
1Evergreen Needleleaf Forest
0Water
255Fill Value
ColorClassLand Cover

AVHRR-NDVI time series 1981-2012
Credit: R. de Jong

▪ Some current RS developments
What’s up next?

Next topics:
• Spectral signature
• Multispectral scanning
• Microwave remote sensing
• Image pre-processing
• Digital image processing
See: www.geo-informatie.nl/courses/gima_rs