gis 4653/5653: spatial programming and gis - cimmslakshman/spatialprogramming/... · gdal is...
TRANSCRIPT
Basic GIS
GIS 4653/5653: Spatial
Programming and GIS

Reading and writing shapefiles

GIS datasets
GIS datasets tend to come in some quasi-standard format
Open-source Python modules available to read these
Can then process the data in Python
Examples of freely available GIS datasets
TIGER (census.gov): county information in Shapefile format
naturalearthdata.com: borders, timezones, roads, etc. in
Shapefile format
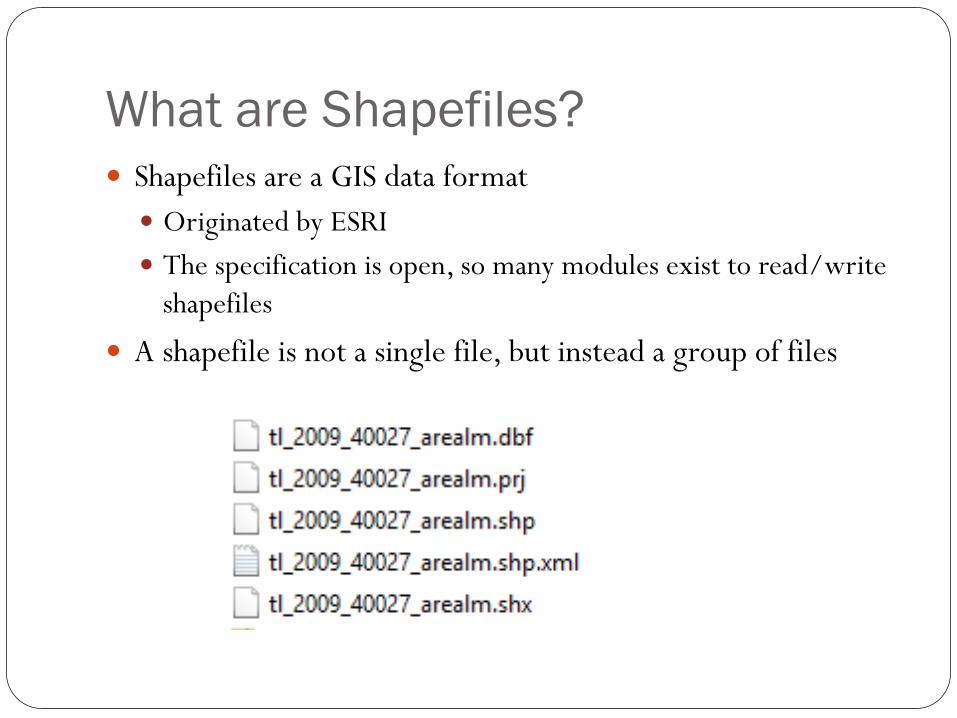
What are Shapefiles?
Shapefiles are a GIS data format
Originated by ESRI
The specification is open, so many modules exist to read/write
shapefiles
A shapefile is not a single file, but instead a group of files
The key three components
Three key components:
The .shp file contains the geometry
The .dbf file contains the attributes as a relational table
The .prj file contains the map projection as well-known text

Types of shapes
Shapefiles are typically composed of a number of shapes of a
single type.
Source: Python Geospatial Development
by Erik Westra, 2010
Census Tiger Files
Download census data for Cleveland County:
http://www2.census.gov/cgi-bin/shapefiles2009/county-
files?county=40027
Includes TGRSH09.pdf which has details about the shapefiles
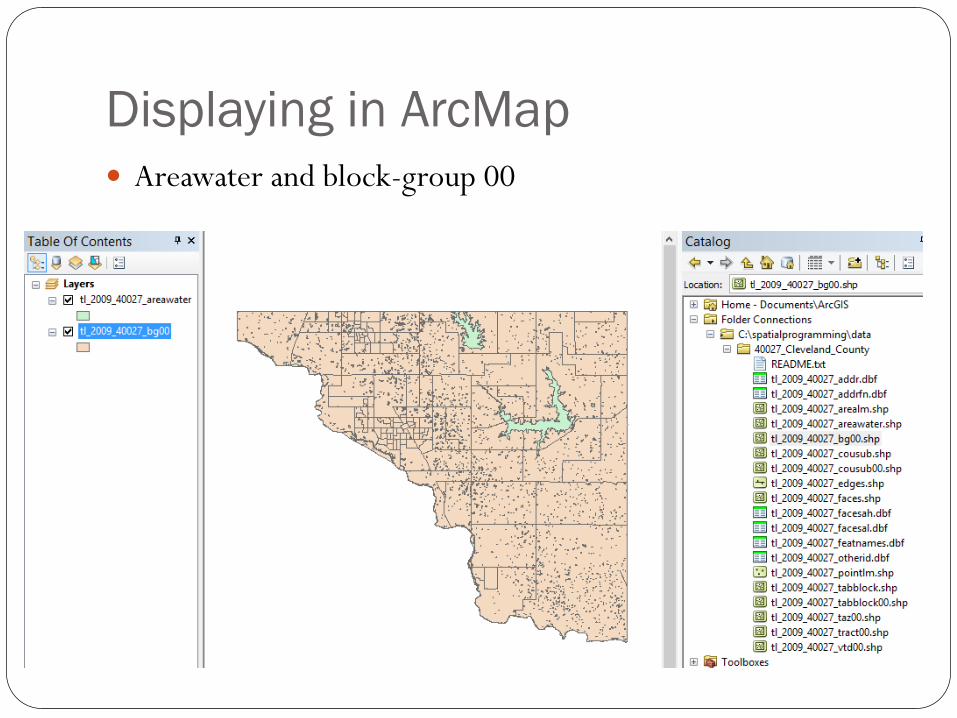
Displaying in ArcMap
Areawater and block-group 00
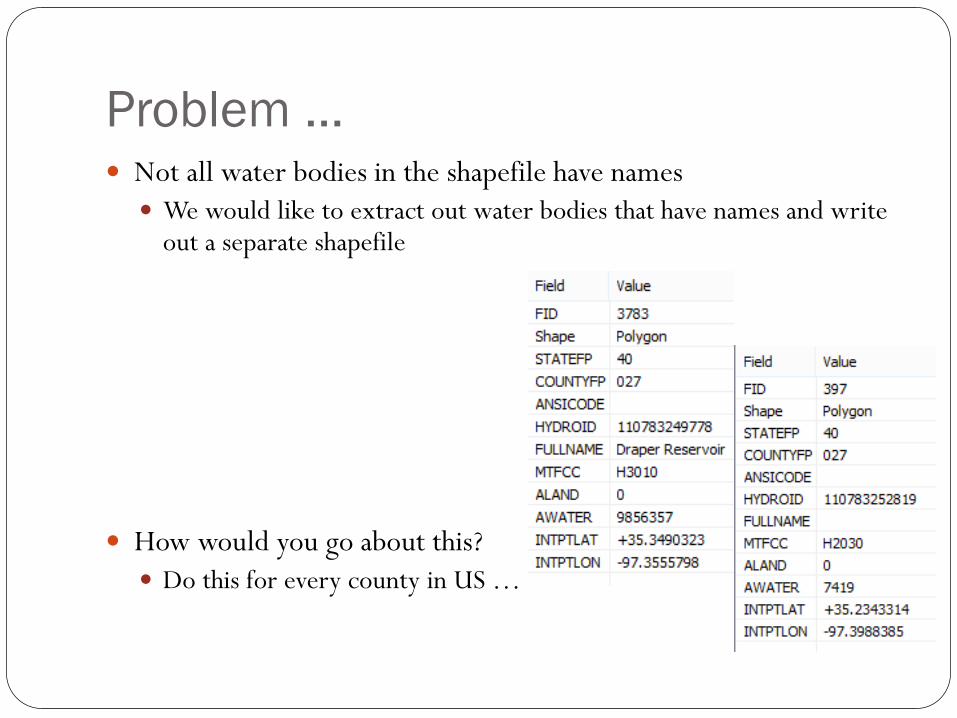
Problem … Not all water bodies in the shapefile have names
We would like to extract out water bodies that have names and write out a separate shapefile
How would you go about this?
Do this for every county in US …

Reading shapefiles in Python
One of the ways to read shapefiles is use PyShp
https://code.google.com/p/pyshp/
Download and place shapefile.py along with the rest of your
code
Now what?

Looking at headers
Which field number is the FULLNAME field?
Make sure …
Look at an example record … what field# in record?

Can do this programmatically
Why is this approach better?
Now what?

Finding shapes with names

Writing out a shapefile
Set up the shapefile:

Saving the shapefile
The shapefile module will not overwrite files
So remove the output directory before writing it
It does not write a .prj file, so copy original .prj file …

Displaying Shapefiles
Displaying without ArcMap
Useful to be able to display GIS data without ArcMap
Useful for dynamically creating maps
License/cost issues
Can use a combination of modules to display GIS data
numpy for numeric processing
matplotlib for plotting
Basemap for projections and reading shapefiles into displayable
points
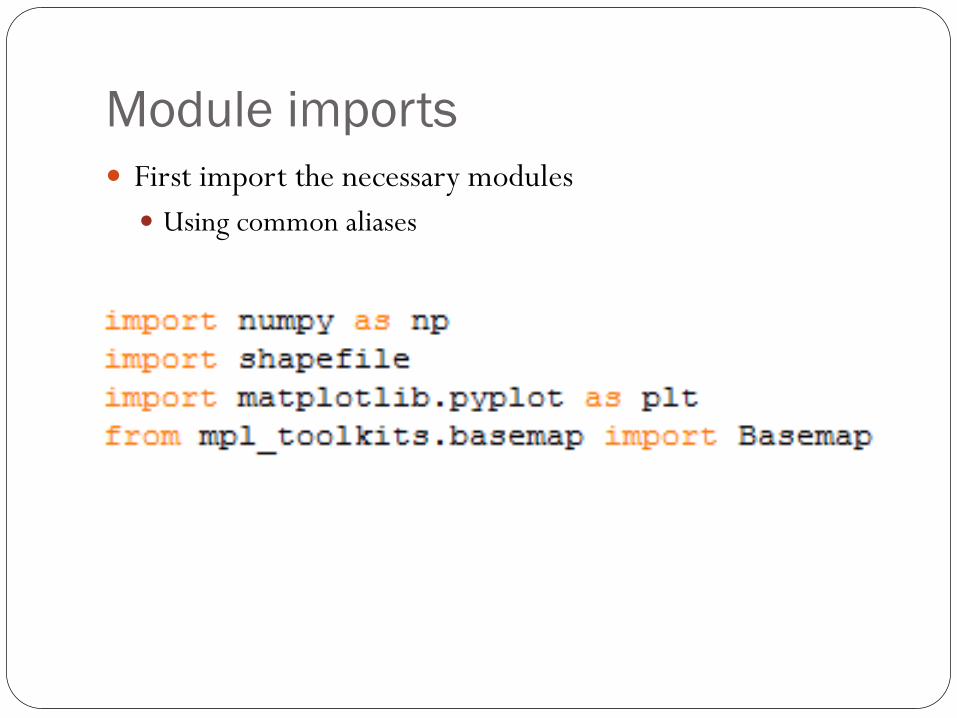
Module imports
First import the necessary modules
Using common aliases

Drawing maps with Python
The process of creating and drawing maps:
Create a Basemap
Read shapefile
Plot the shapes in the shapefile
Show the plot

Creating a Basemap
To create a Basemap, specify the bounds of the plot:
Can choose from several projections: stereographic,
Mercatur, Robinson, Lambert Conformal, etc.
Specify any necessary parameters for the projection
Specify bounding box
How fine/coarse do you want the drawing to be?
Areas smaller than what should be ignored?

Built-in maps
Some basic map features are built-in
You don’t need extra shapefiles for these:

Bounding box
How do you find the bounding box of a shapefile?
Can use the shapefile module to read shapes and compute this

Reading and plotting a shapefile
Reading a shapefile returns a list of tuples (list of points)
zip() is a built-in Python function (zip as in fastener)
zip() with the * operator essentially unzips

Setting up plot and drawing it
The matplotlib is used for plotting
Can plot all types of charts and figures

Getting the attributes
Basemap also reads the attributes
Makes the shapes and attributes available
For example:
The shapes are in ‘water’ and attributes in ‘water_info’ because
the second parameter to readshapefile is ‘water’
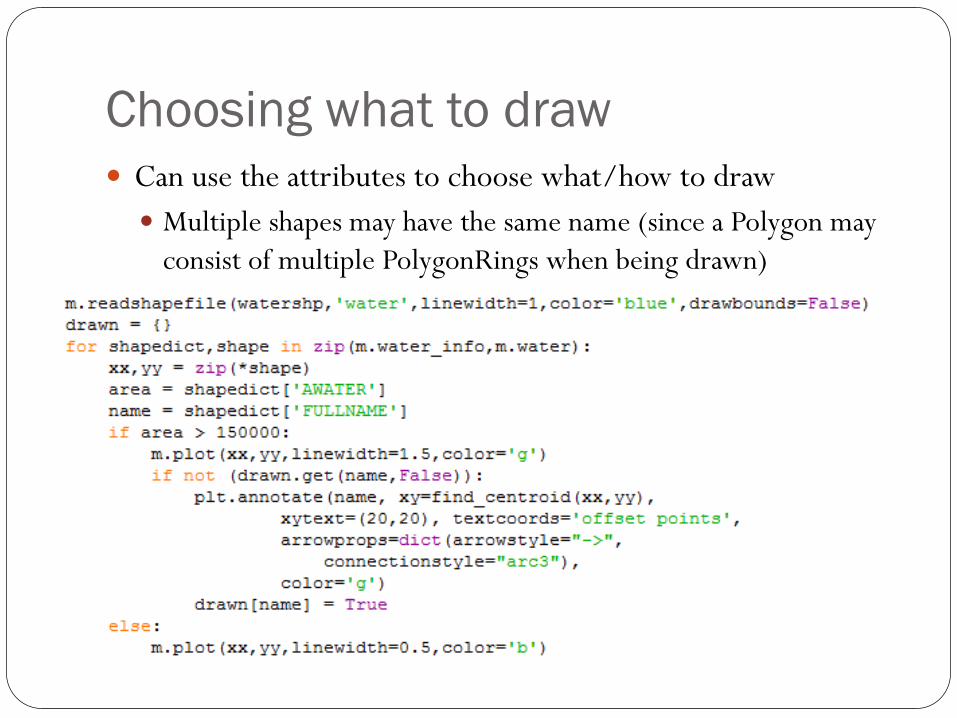
Choosing what to draw
Can use the attributes to choose what/how to draw
Multiple shapes may have the same name (since a Polygon may
consist of multiple PolygonRings when being drawn)

Final result
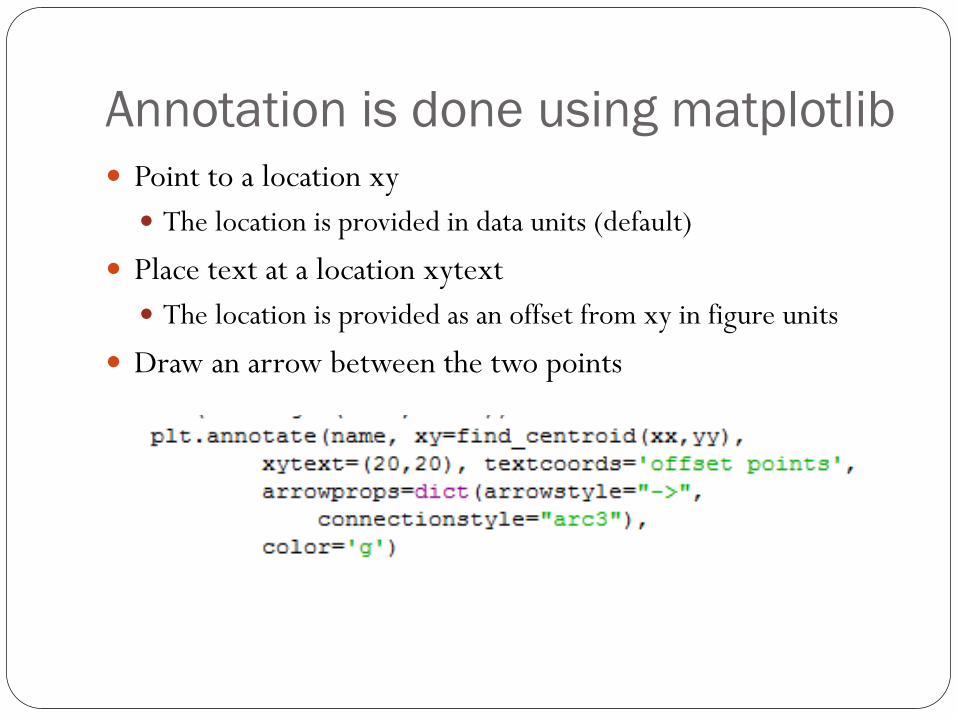
Annotation is done using matplotlib
Point to a location xy
The location is provided in data units (default)
Place text at a location xytext
The location is provided as an offset from xy in figure units
Draw an arrow between the two points

Reference documentation
Please refer to the documentation of the three modules we
have used:
http://matplotlib.org/api/pyplot_api.html
https://code.google.com/p/pyshp/
http://matplotlib.org/basemap/api/basemap_api.html
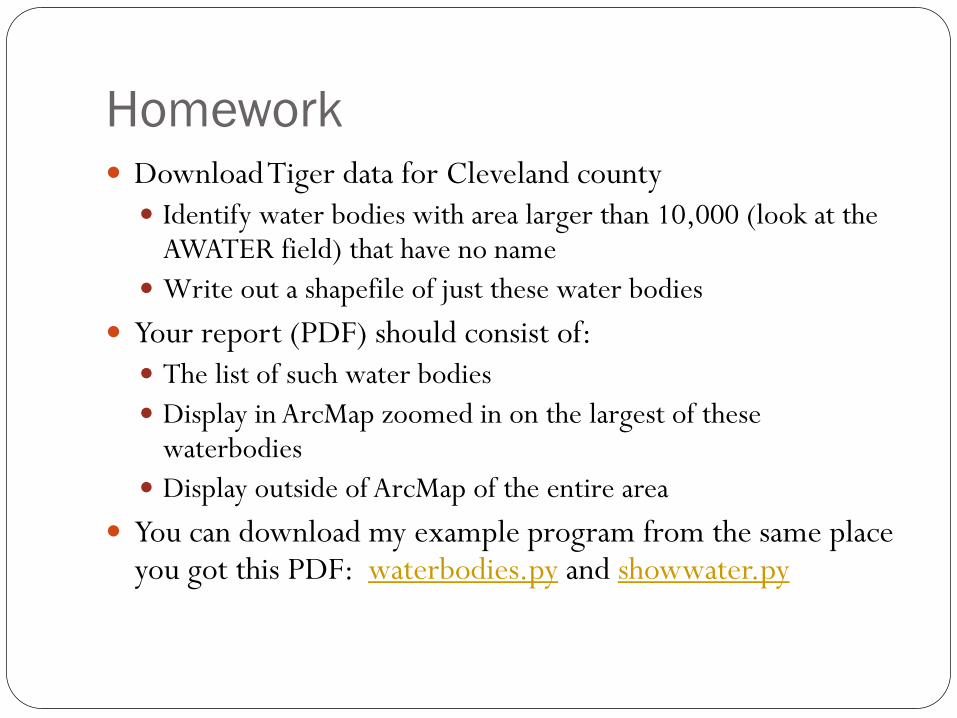
Homework Download Tiger data for Cleveland county
Identify water bodies with area larger than 10,000 (look at the AWATER field) that have no name
Write out a shapefile of just these water bodies
Your report (PDF) should consist of:
The list of such water bodies
Display in ArcMap zoomed in on the largest of these waterbodies
Display outside of ArcMap of the entire area
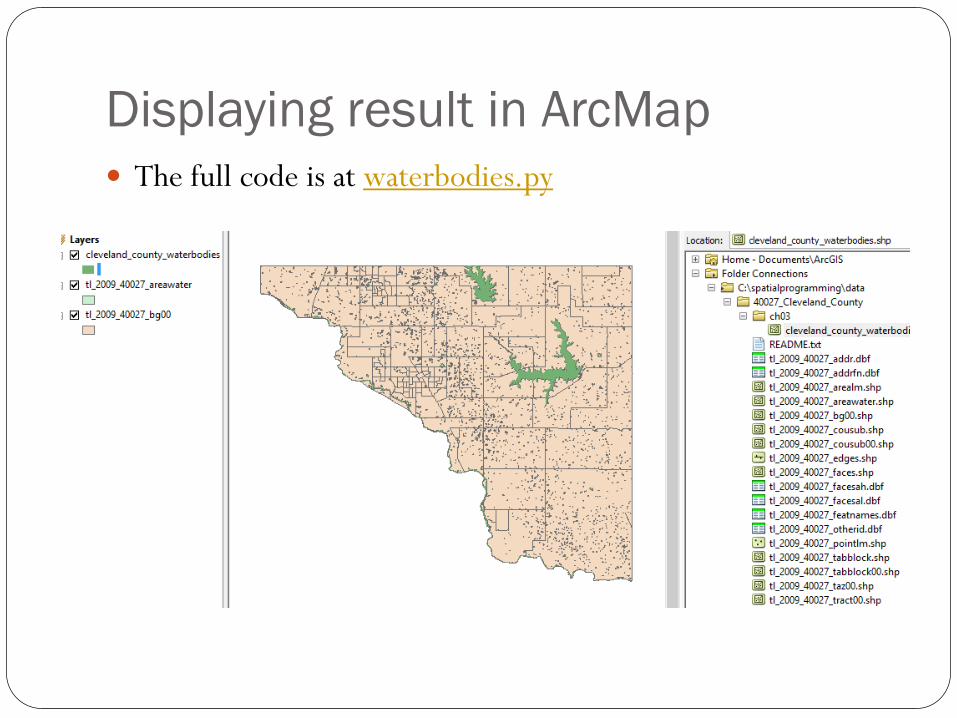
You can download my example program from the same place you got this PDF: waterbodies.py and showwater.py

Raster data
Raster vs. Vector
What’s the difference?

Elevation data
Can obtain elevation data for the Cleveland county area:
http://viewer.nationalmap.gov/viewer/
Zoom in and center on Norman, making sure you see Draper
Reservoir, Thunderbird Lake and the Canadian River
Click on “Download Data”
Choose “Click here to order for map extent”
Select Elevation and get the National Elevation Dataset (1/3 arc
second) in IMG format
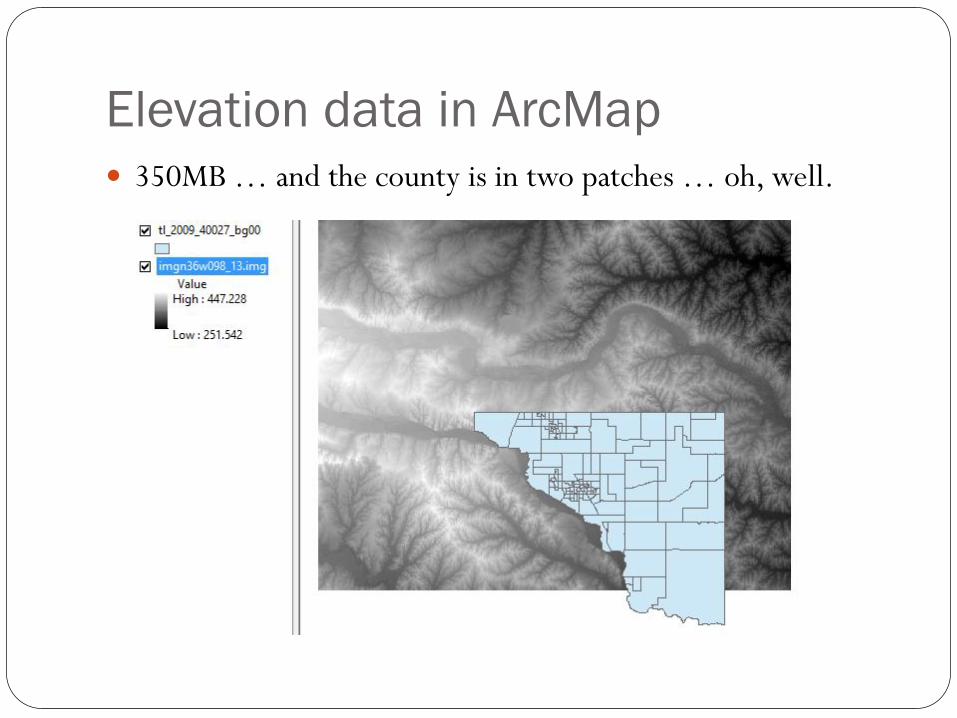
Elevation data in ArcMap
350MB … and the county is in two patches … oh, well.

Our goal:
To crop the raster image
Think: create cropped rasters around every lake …
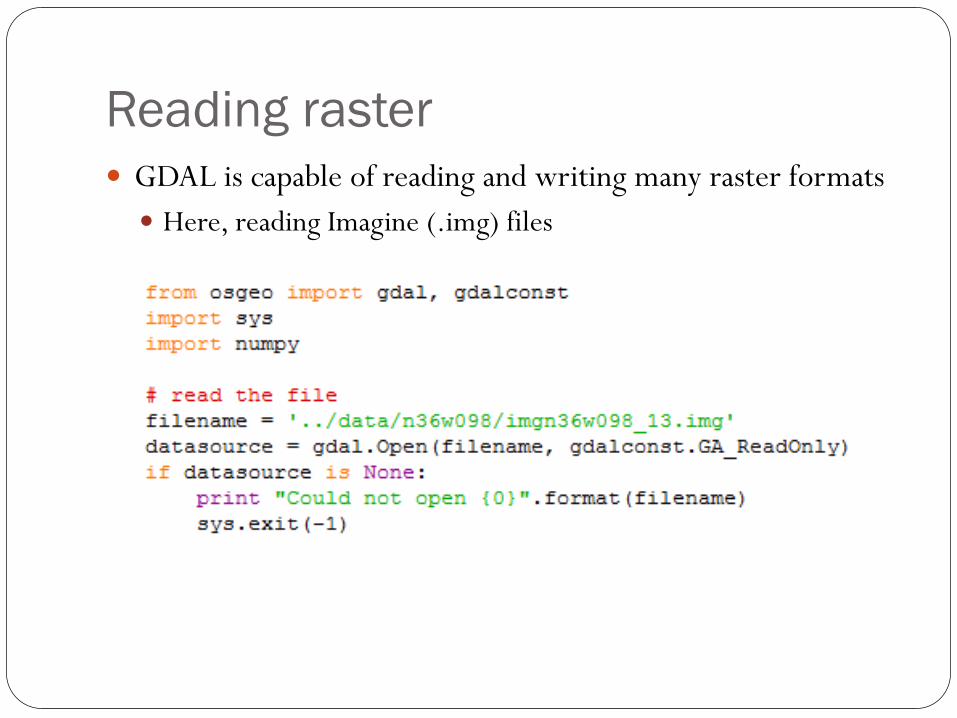
Reading raster
GDAL is capable of reading and writing many raster formats
Here, reading Imagine (.img) files

Basic metadata of raster
The 2nd and 4th parameter of geotransform is the rotation
Normally zero degrees for true-north pointing data
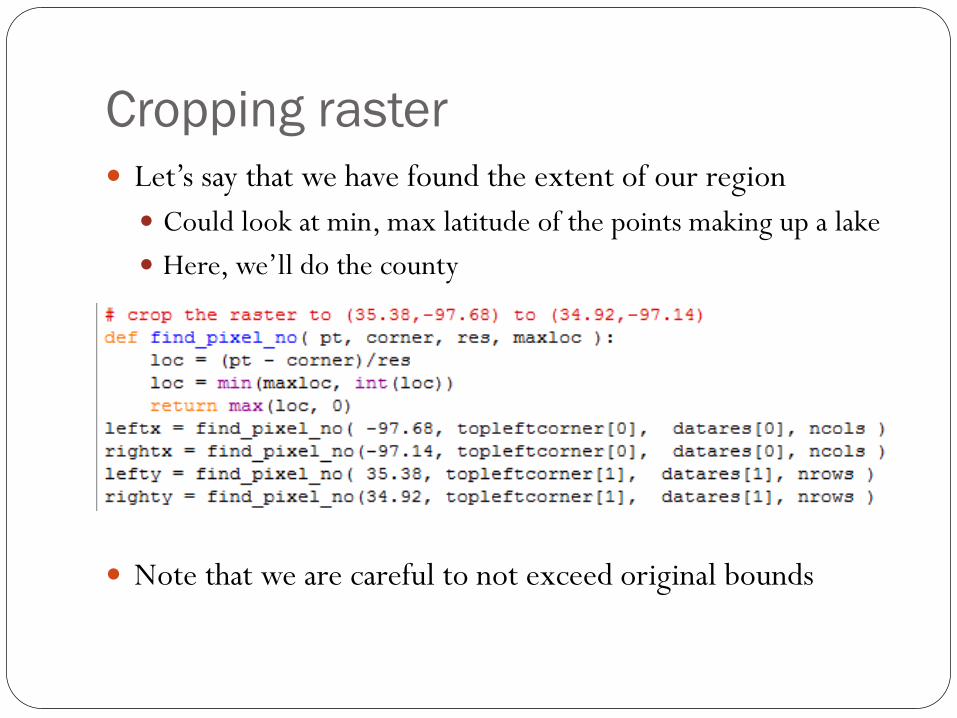
Cropping raster
Let’s say that we have found the extent of our region
Could look at min, max latitude of the points making up a lake
Here, we’ll do the county
Note that we are careful to not exceed original bounds

Inverse transform
Could use gdal to do the inversion rather than coding it up

Reading in 2D array from raster
Specify top-left corner and number of pixels in each
direction
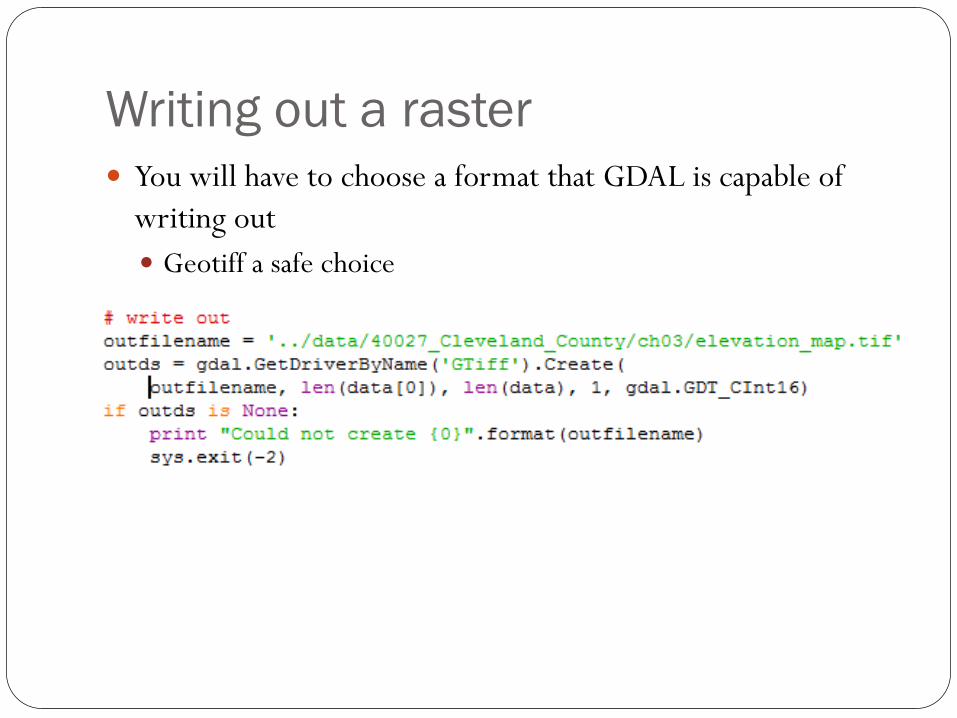
Writing out a raster
You will have to choose a format that GDAL is capable of
writing out
Geotiff a safe choice
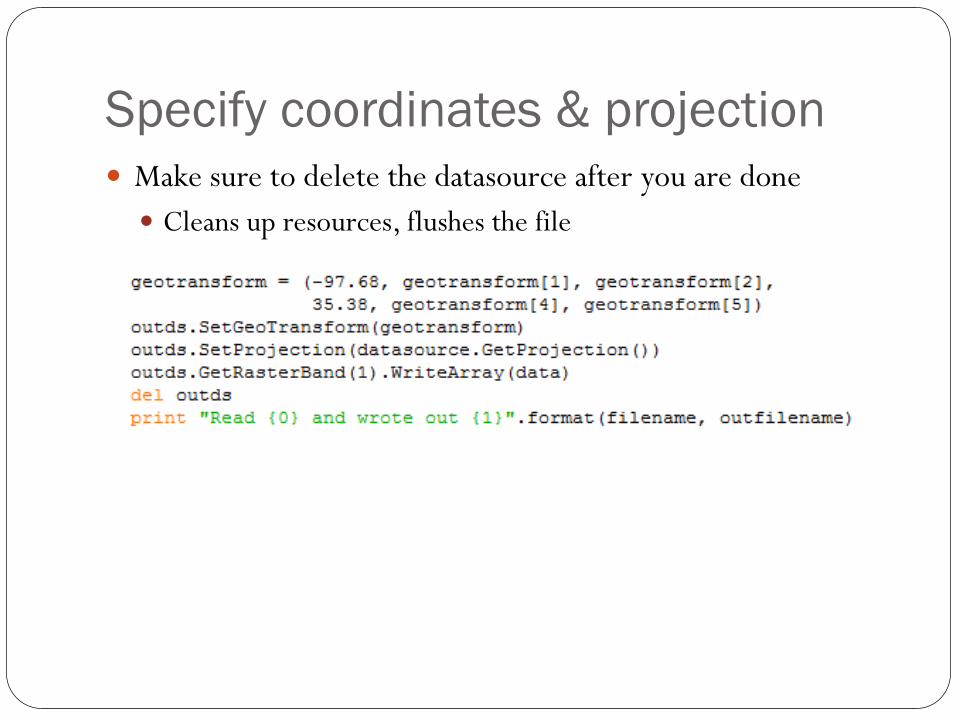
Specify coordinates & projection
Make sure to delete the datasource after you are done
Cleans up resources, flushes the file

Spatial programming questions
Given the bare earth elevation data and the depth of a lake at
a certain point
How would you find the maximum depth in the lake?
How about the volume of water in the lake?
Does the projection matter?

Changing Projections

Different projections Often need to deal with datasets in different projections
The elevation data is in a well-known geographic coordinate system (WGS-84) And unprojected coordinates (lat-long)
The TIGER dataset of water bodies in Cleveland county is in NAD83 spheroid and unprojected coordinates
The Isle of Wight fire hydrant locations are also in NAD83 but the projection coordinate system is Lambert Conformal
What is the difference between a geographic coordinate system (GCS) and a projection coordinate system?
Can datasets differ in one or the other? Or both?
What does “unprojected coordinates” mean?
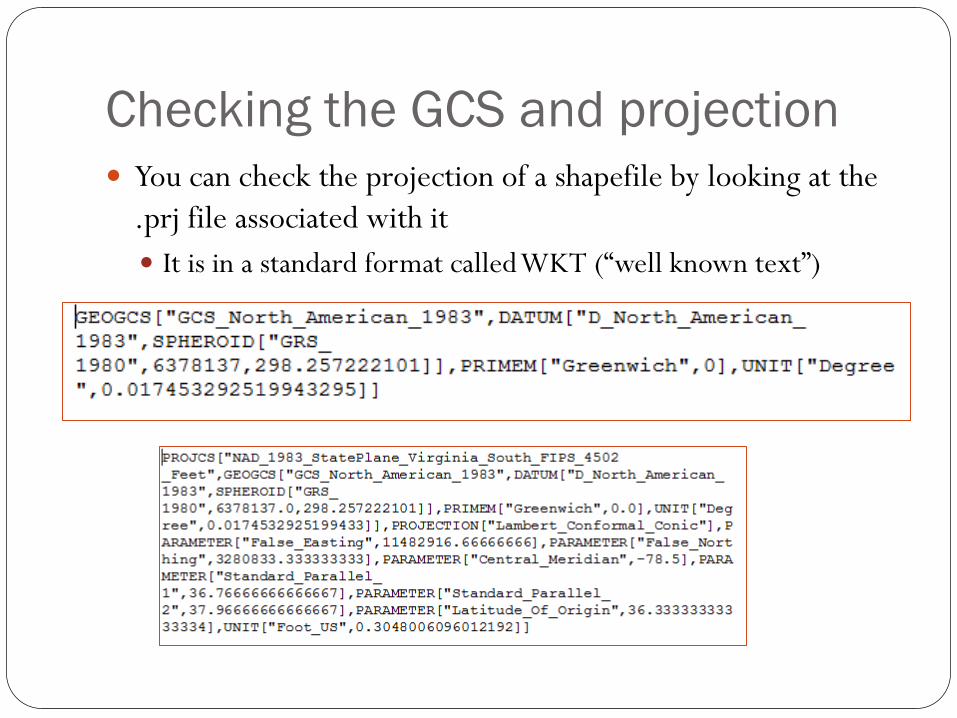
Checking the GCS and projection
You can check the projection of a shapefile by looking at the
.prj file associated with it
It is in a standard format called WKT (“well known text”)
From LCC to Lat-Long
Recall that I gave you the list of fire hydrant locations in lat-
lon for an earlier homework
Let’s do the conversion that I had to do …
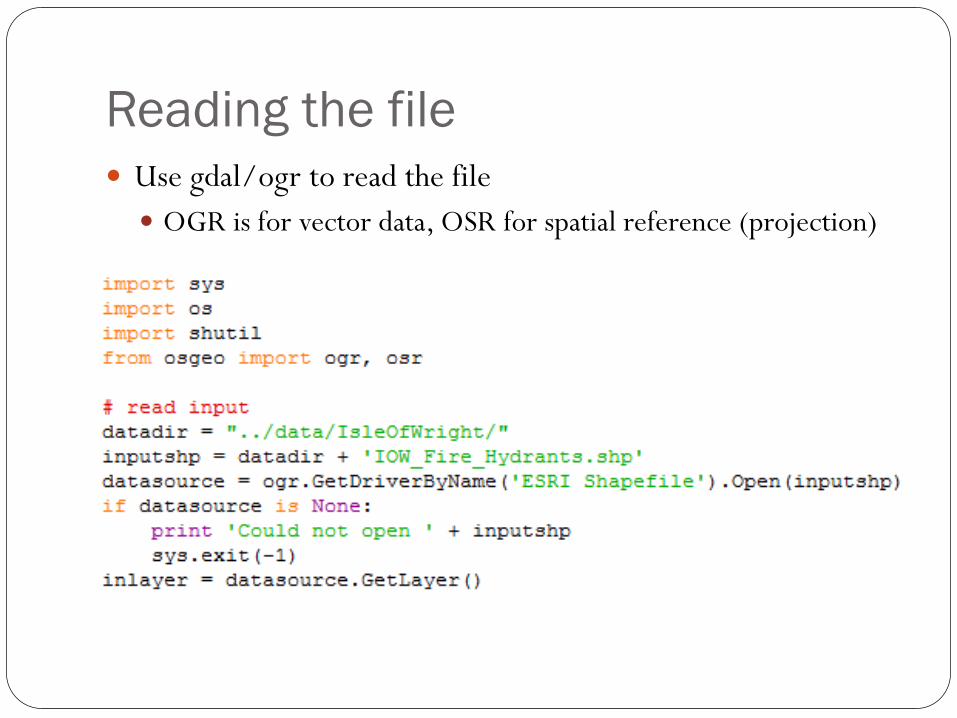
Reading the file
Use gdal/ogr to read the file
OGR is for vector data, OSR for spatial reference (projection)

Getting the projection
Ogr calls this the spatial reference
And can export to Wkt to see what the .prj would be:
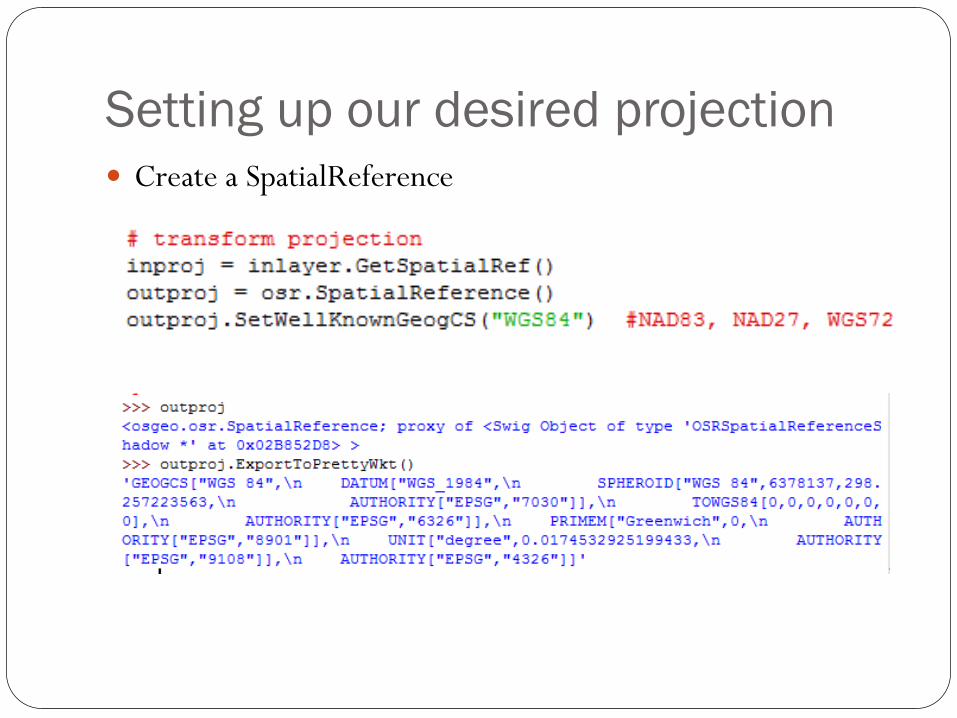
Setting up our desired projection
Create a SpatialReference
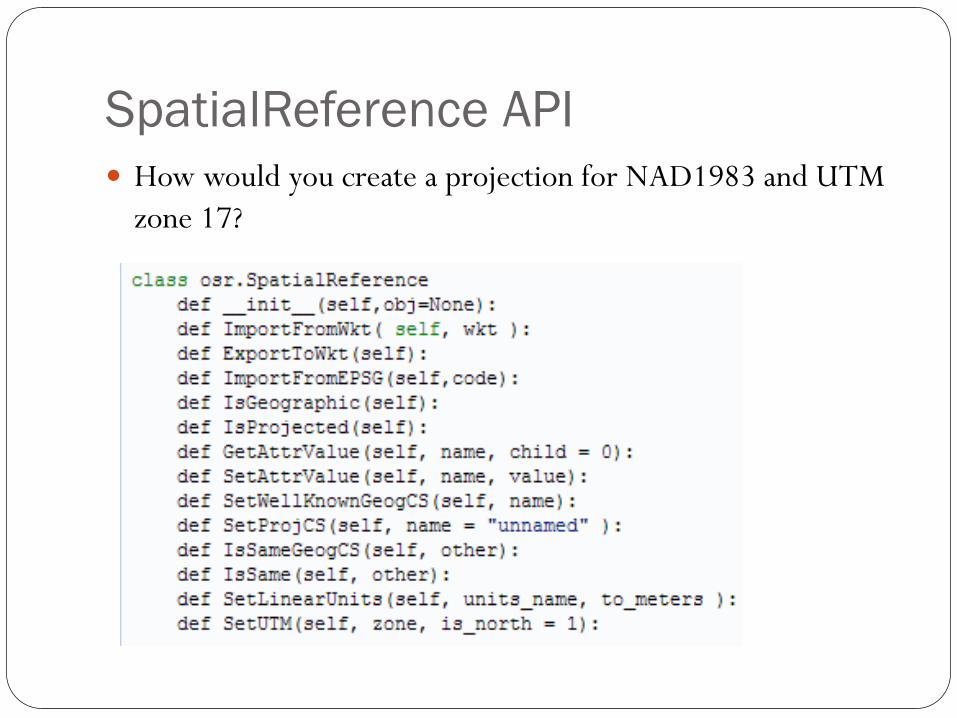
SpatialReference API
How would you create a projection for NAD1983 and UTM
zone 17?
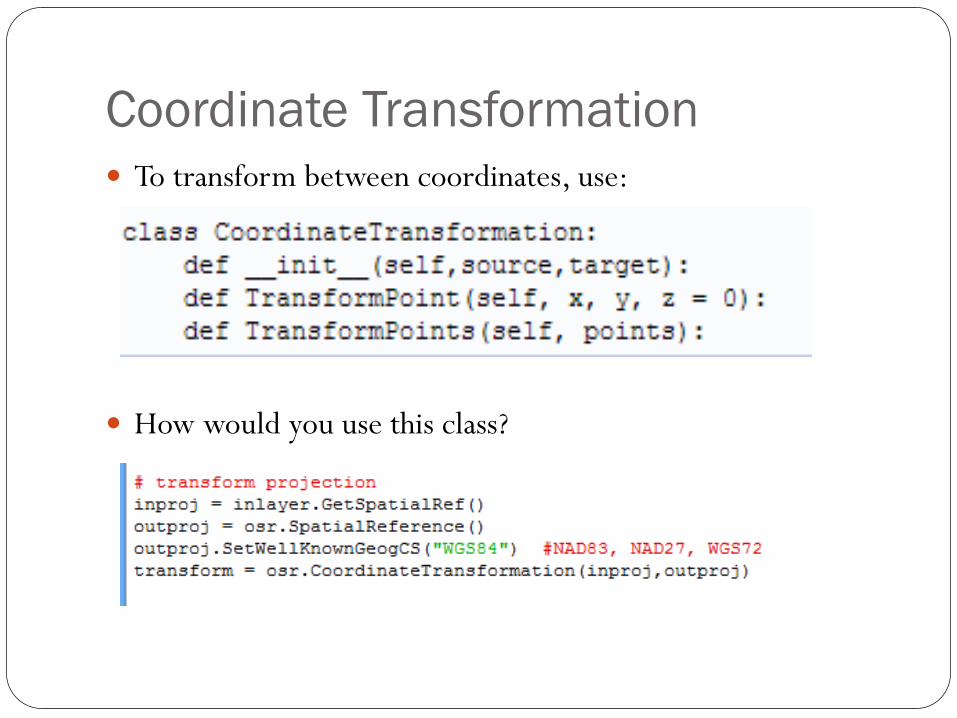
Coordinate Transformation
To transform between coordinates, use:
How would you use this class?
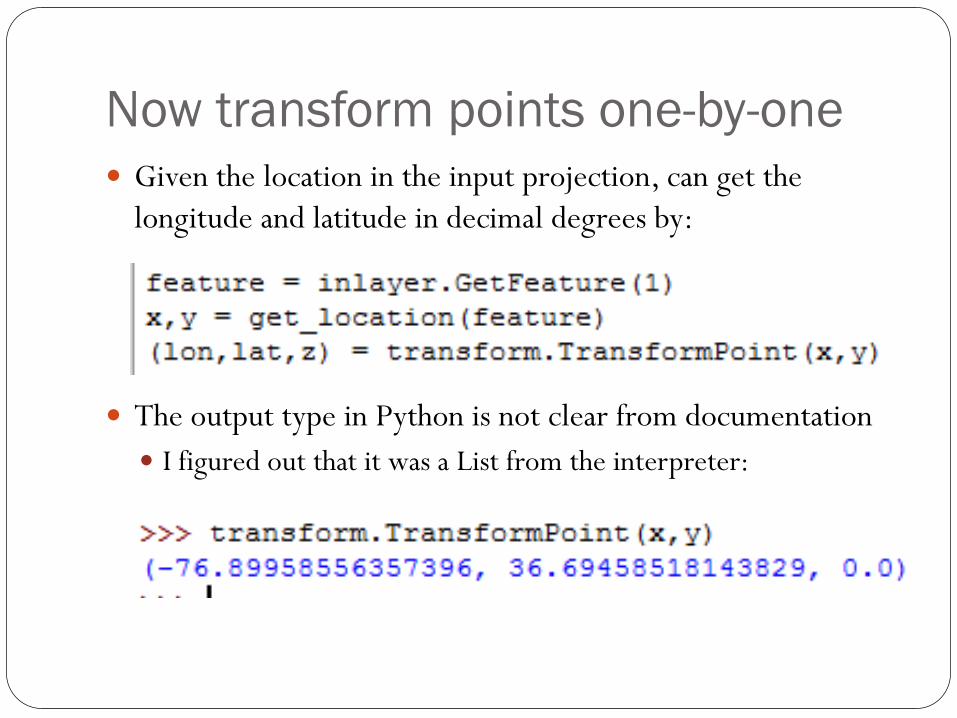
Now transform points one-by-one
Given the location in the input projection, can get the
longitude and latitude in decimal degrees by:
The output type in Python is not clear from documentation
I figured out that it was a List from the interpreter:

get_location
To get the location given a feature, this is what “should”
work:
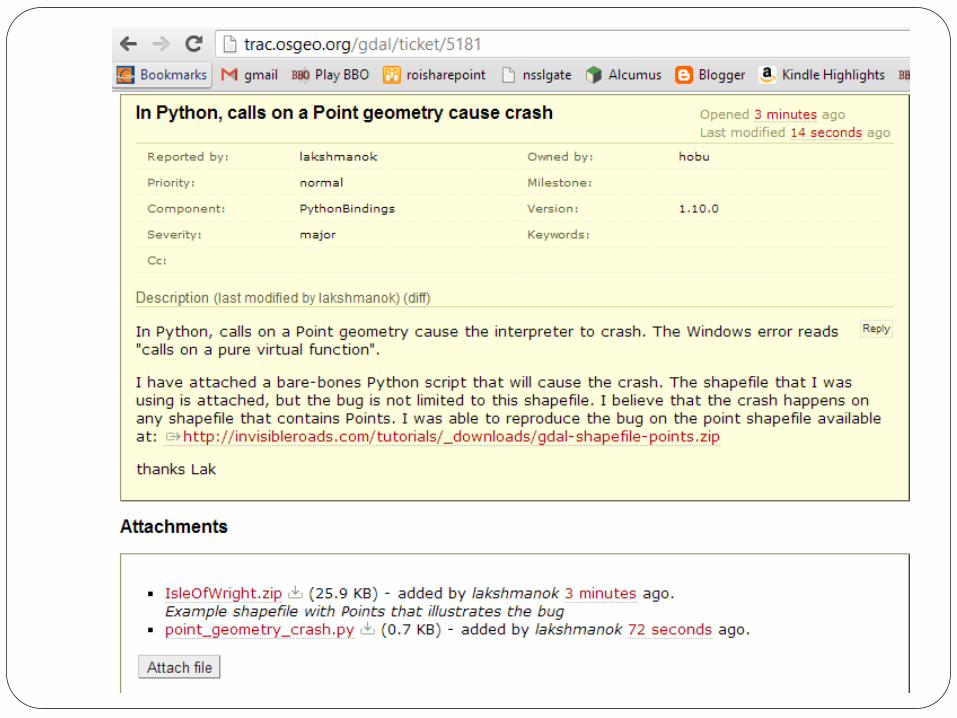
Unfortunately Python kept crashing on any and all methods
on the geometry object returned by GetGeometryRef()
What to do?
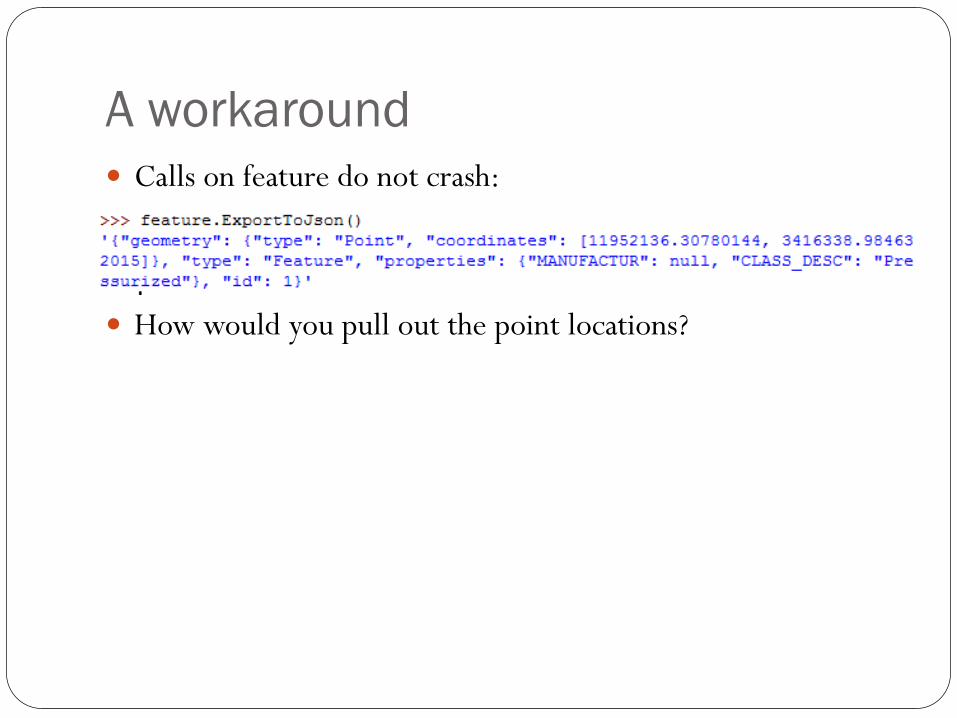
A workaround
Calls on feature do not crash:
How would you pull out the point locations?

Some string processing
What is this code doing?

Writing out a text file
Postscript
Was not able to reproduce the bug
A restart of the Python window solved the problem
Workaround no longer needed
Geoprocessing

Common geoprocessing operations
What do these mean?
Buffer
Clip
Union
Intersection
Merge
Dissolve
What are these operations on?

Geometry The GDAL geometry object is documented here:
http://gdal.org/python/osgeo.ogr.Geometry-class.html
It provides:
Create a geometry from a set of points
Ways to edit the geometry by adding and removing points
Ways to compute length, area
Get the boundary as a geometry
Find distance to another geometry
Find the union, intersection with another geometry
Check whether this geometry touches, crosses, is within or overlaps another geometry
Buffer a geometry by a distance (in units of shapefile)
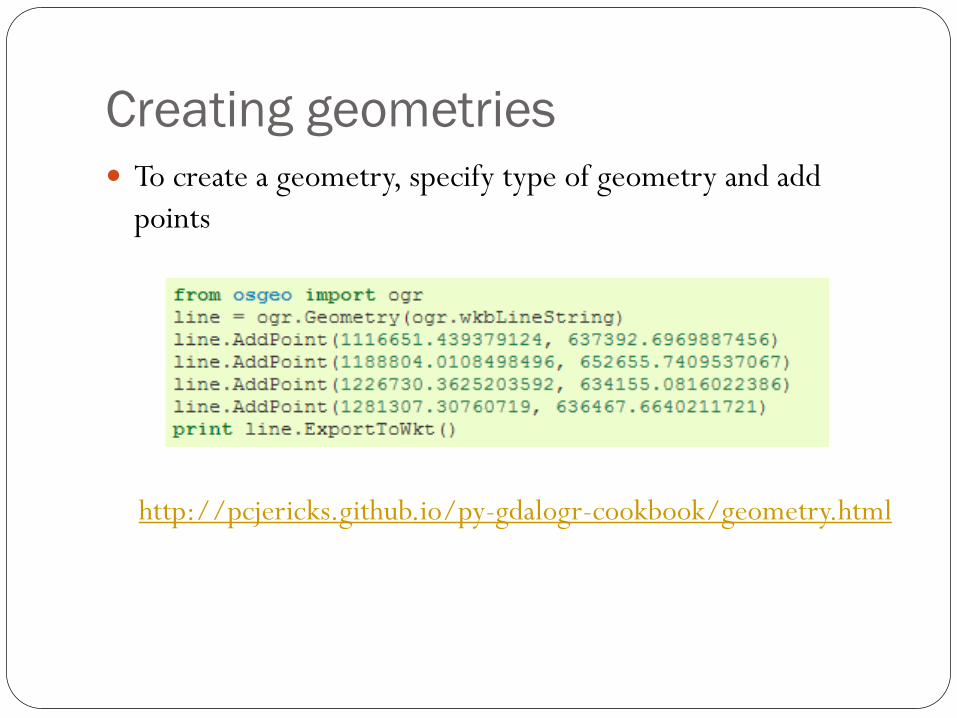
Creating geometries
To create a geometry, specify type of geometry and add
points
http://pcjericks.github.io/py-gdalogr-cookbook/geometry.html

Desired output
We want this output
Circles of 420km radius centered around each radar in
Oklahoma
Writing a shapefile from scratch To write a shapefile from scratch using OGR:
Get driver
Create datasource
Create layer
Create fields (you need at least one field)
For each polygon: Make polygon (or whatever geometry)
Create a feature and set the fields and geometry on it
Provide the feature to the layer
Destroy the feature
When done, destroy the datasource
Also create a .prj file

Preliminaries
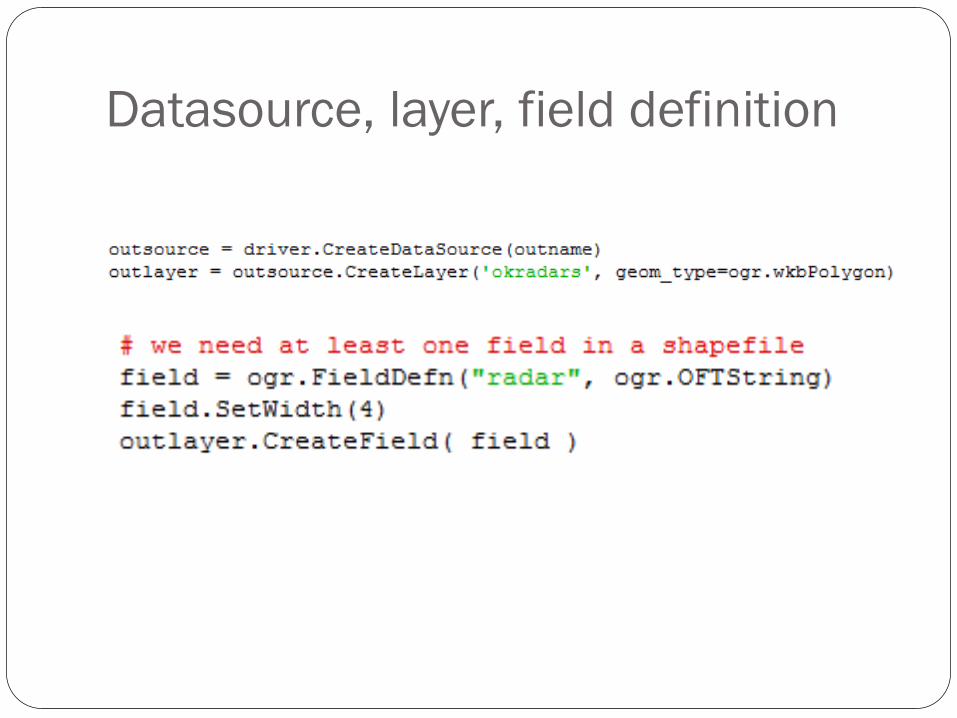
Datasource, layer, field definition

Circles
Shapefiles do not have circle support
Only points, lines and polygons
How would you get a circle?
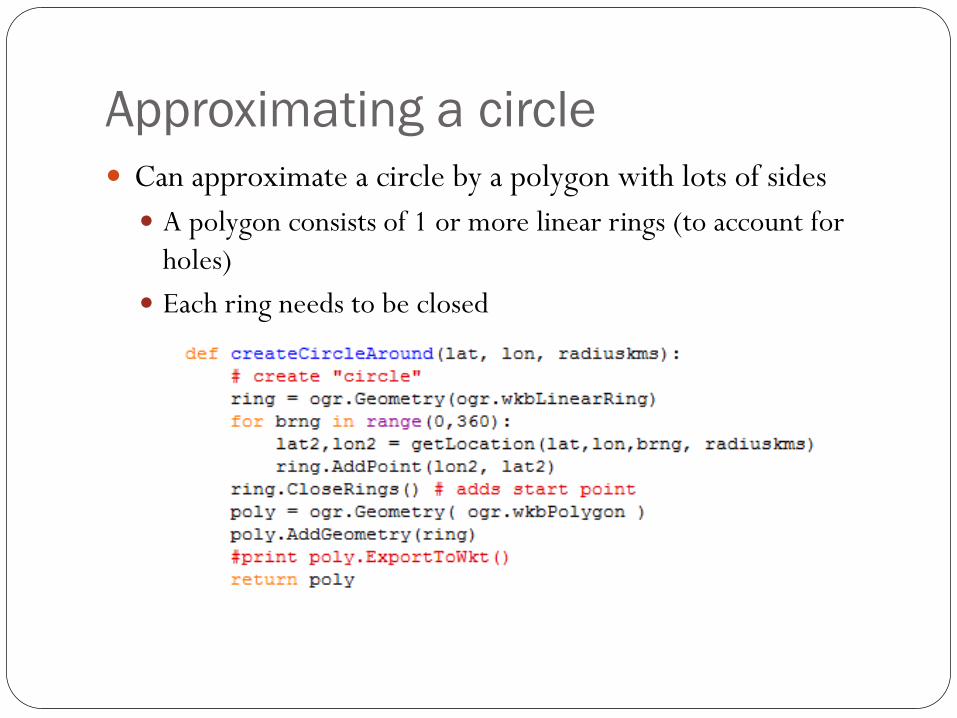
Approximating a circle
Can approximate a circle by a polygon with lots of sides
A polygon consists of 1 or more linear rings (to account for
holes)
Each ring needs to be closed

Location of point given bearing
The location of a point given a bearing and distance is:
http://www.movable-type.co.uk/scripts/latlong.html
In Python, remember to convert angles to radians:
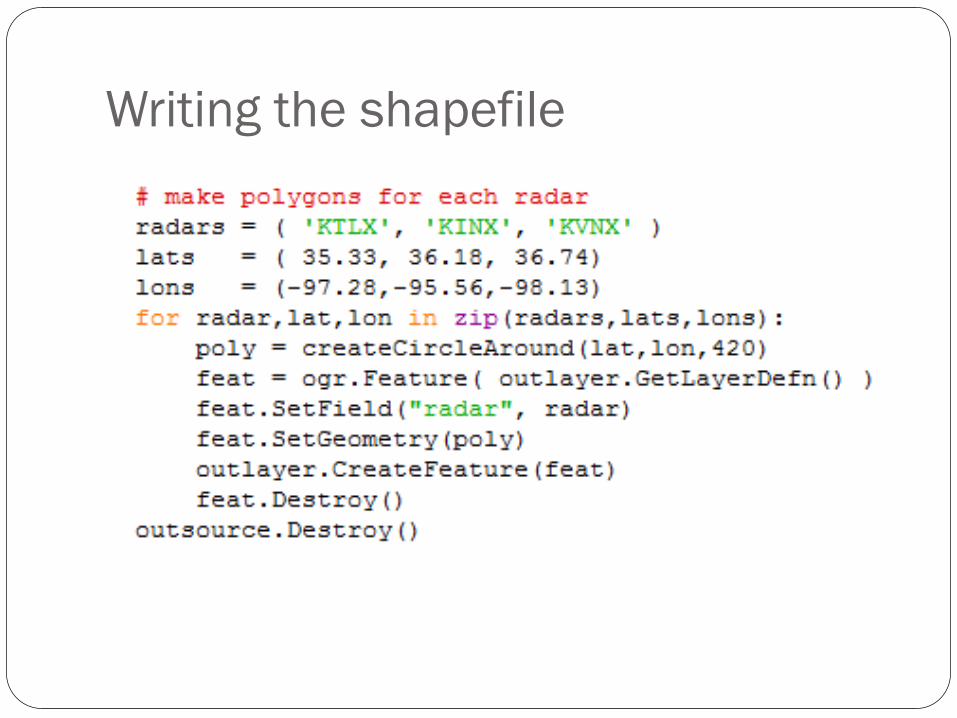
Writing the shapefile
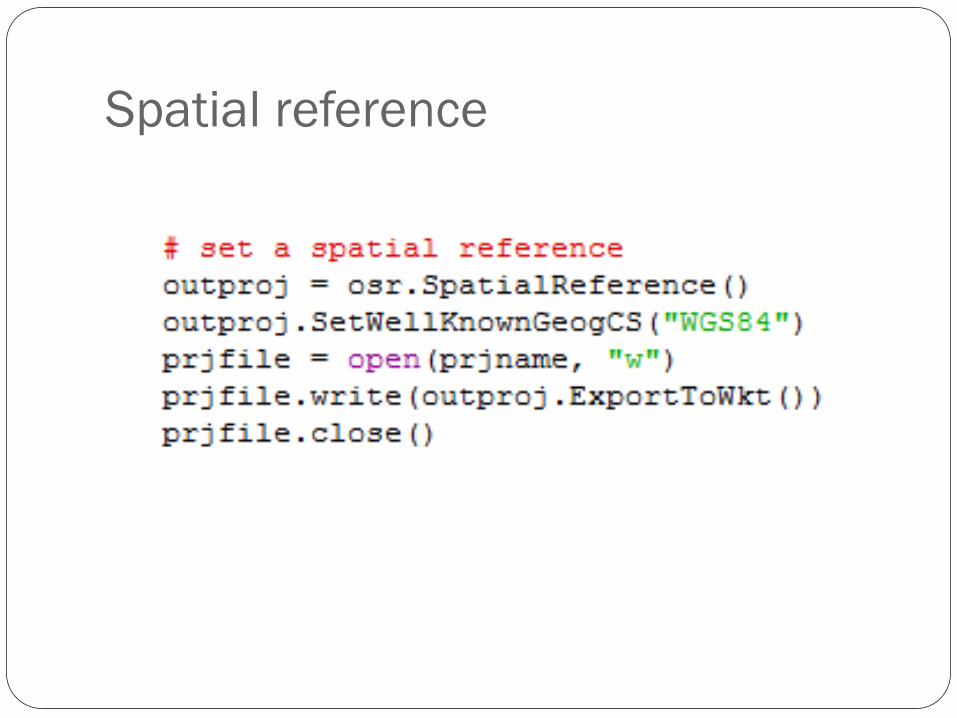
Spatial reference

Buffering
To buffer a geometry, simply call the Buffer() function
Let us buffer all the named lakes
Steps:
Read input file containing all the water bodies
Open output file with same geometry type as input
Copy the field definitions from the input to the output
For each feature in the input that has a name and is not a river
Buffer by 0.0005 (the units are units of the input file, so degrees)
Write out buffered geometry into output file
Clean up
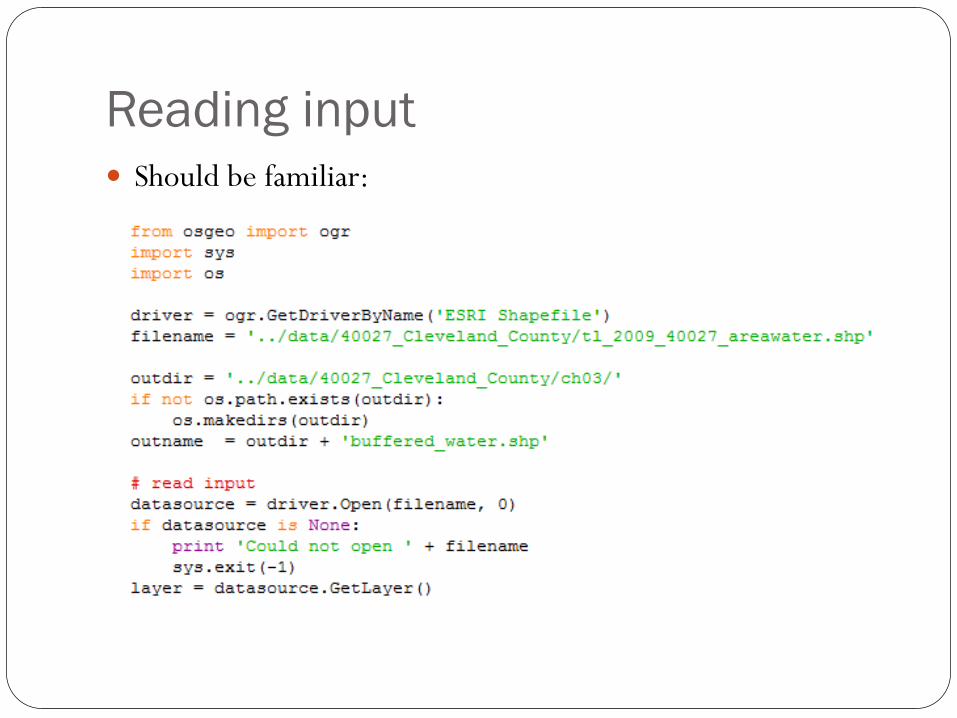
Reading input
Should be familiar:
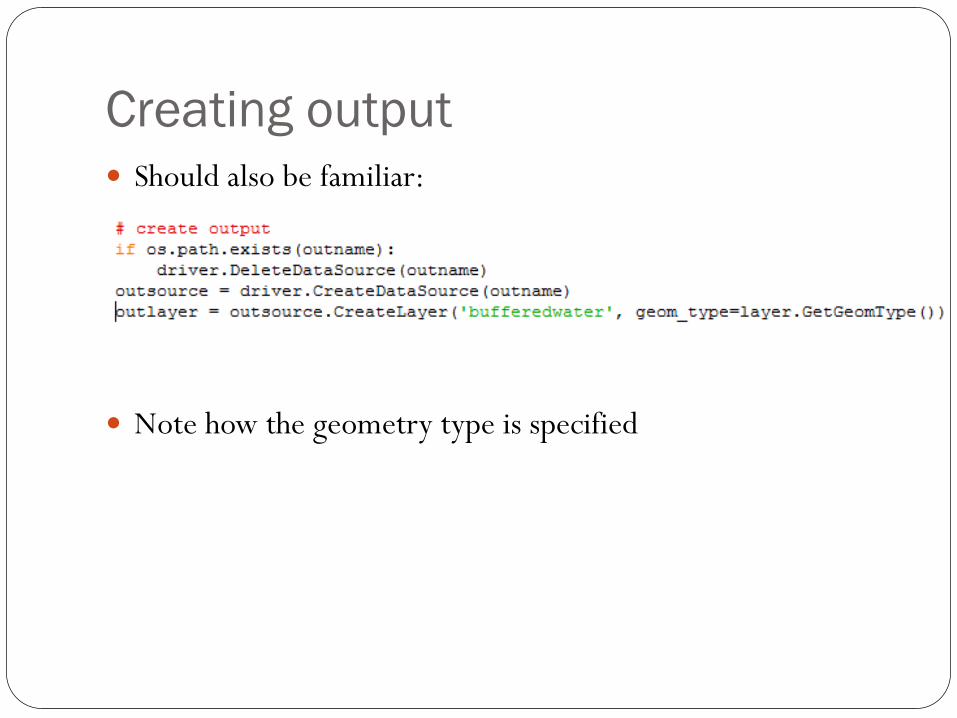
Creating output
Should also be familiar:
Note how the geometry type is specified

Copy field definitions
The output file will have all the attributes of the input

Buffer The 0.0005 is in the original map’s units (decimal degrees)
How would you buffer by a specific number of kilometers
Say 5 km?
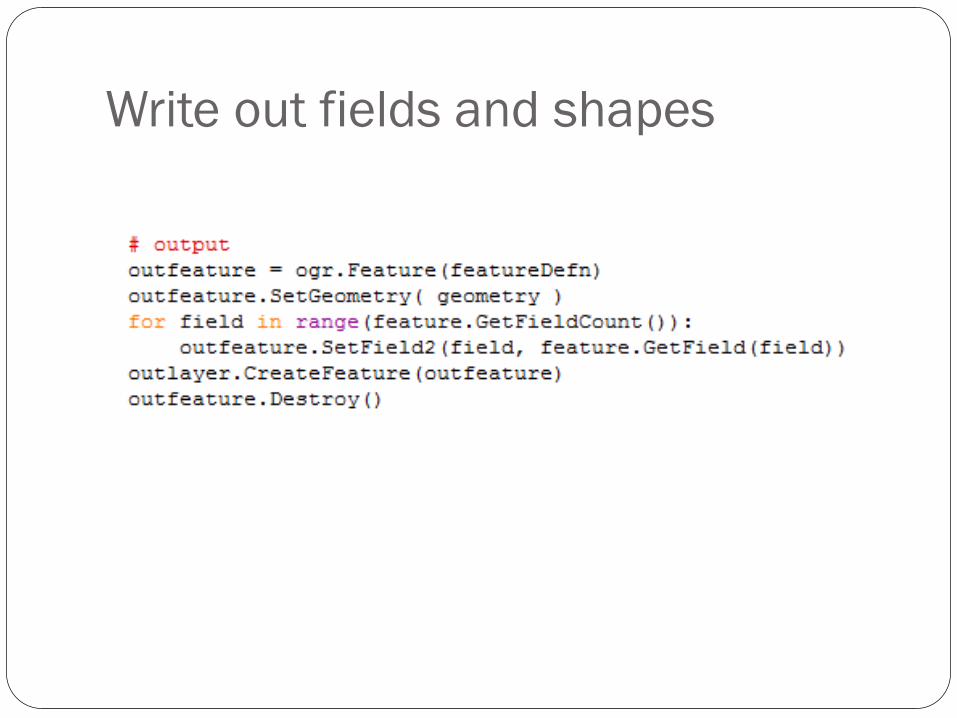
Write out fields and shapes

Before
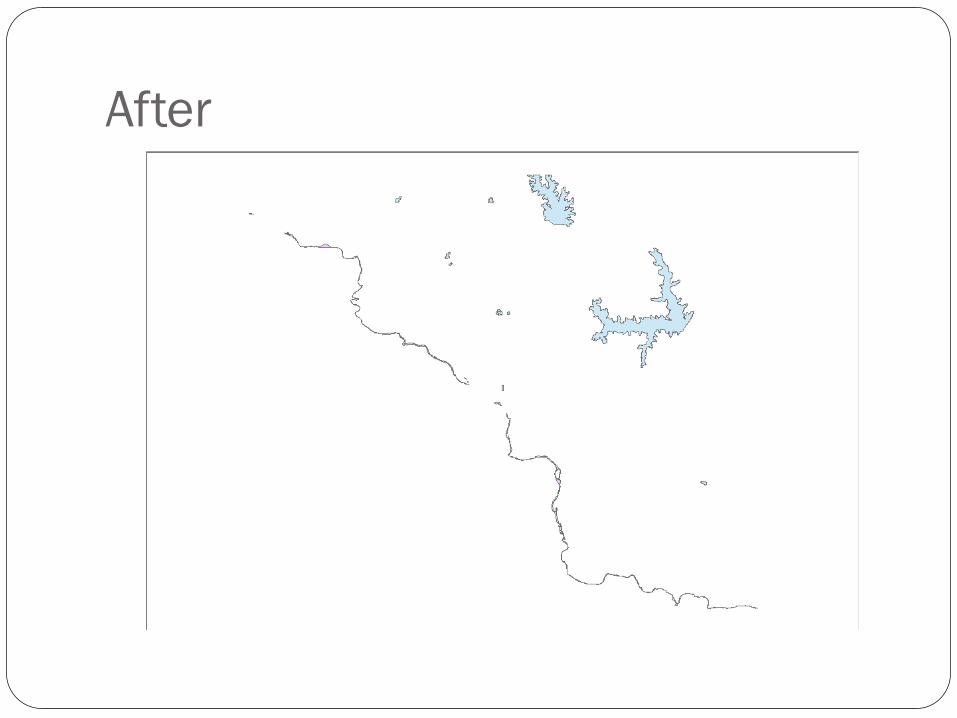
After

Other geoprocessing
Look at the API of the Geometry class
http://gdal.org/python/osgeo.ogr.Geometry-class.html
Can you see how to Clip one geometry to the extent of
another?
How about to the bounding box of another geometry?
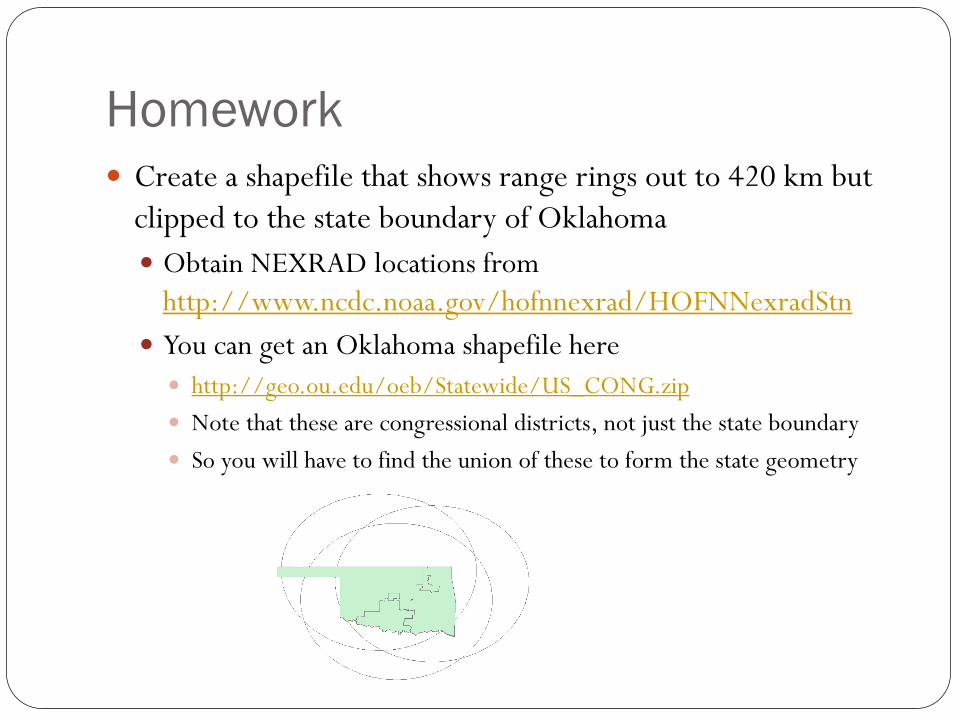
Homework
Create a shapefile that shows range rings out to 420 km but
clipped to the state boundary of Oklahoma
Obtain NEXRAD locations from
http://www.ncdc.noaa.gov/hofnnexrad/HOFNNexradStn
You can get an Oklahoma shapefile here
http://geo.ou.edu/oeb/Statewide/US_CONG.zip
Note that these are congressional districts, not just the state boundary
So you will have to find the union of these to form the state geometry
Summary
We have looked at how to perform basic GIS functions using
Open Source Python:
shapefile.py for reading and writing shapefiles in pure Python
Basemap for plotting data and creating simple maps
GDAL/OGR also has advanced GIS functionality
A C++ library with Python bindings
GDAL for reading and processing raster data
OGR for reading and processing vector data
Geoprocessing carried out using geometry object
What are the advantages of open-source packages?
What are the disadvantages of open-source packages?