gis application for mineral potential mapping of gold …
TRANSCRIPT
1Geology Department, Institute of Sains & Technology AKPRIND, Yogyakarta
2Geological Engineering Department, Faculty of Engineering, Gadjah Mada Universty,
Yogyakarta
GIS APPLICATION FOR MINERAL POTENTIAL MAPPING OF GOLD
AND BASE METAL MINERALIZATION,
IN PACITAN DISTRICT, EAST JAVA PROVINCE
Radhitya Adzan Hidayah1, Lucas Donny Setijadji
2, Agung Setianto
2
1Geology Department, Institute of Sains & Technology AKPRIND, Yogyakarta
2Geological Engineering Department, Faculty of Engineering, Gadjah Mada Universty,
Yogyakarta
Abstract
The research area covers the administration of the Pacitan District, East Java
Province. Geological data, such as lithological data, structural data, contour data
and alteration, were used in analyses and making evidence maps. The geological
data yield six evidence maps such as NE-SW lineament, NW-SE lineament,
hostrock, heat source, kaolinite alteration and iron oxide alteration maps.
Evidence maps were analyzed by weight of evidence methods to result in
favorable maps, where the validity was tested using conditional independence
(CI), the pairwise and overall tests. Then, the analyses produced a posterior
probability map. Posterior probability map (mineral potential maps) was
validated by checking field to determine the next exploration target zone cluster.
Posterior probability map (after validation) / favorable map predicted
approximately 27,61% (389.83 km2) including the favorable zone and
approximately 72,39% (1021,79 km2) including non favorable zones. Favorable
zones are divided into three classes. The target areas were divided into five
clusters areas of mineralized potential zone.
Keyword: GIS, weight of evidence, mineral potential mapping, Pacitan District
JGP (Jurnal Geologi Pertambangan 49
Volume 2 No. 20 September 2016
1 INTRODUCTION
GIS used as software to integrate multiple layers of geology data into a
mineral potential maps, it help identify prospect for mineral exploration. This
capability contributes to make GIS a very powerfull tool in mineral exploration
(Harris et al., 2006).
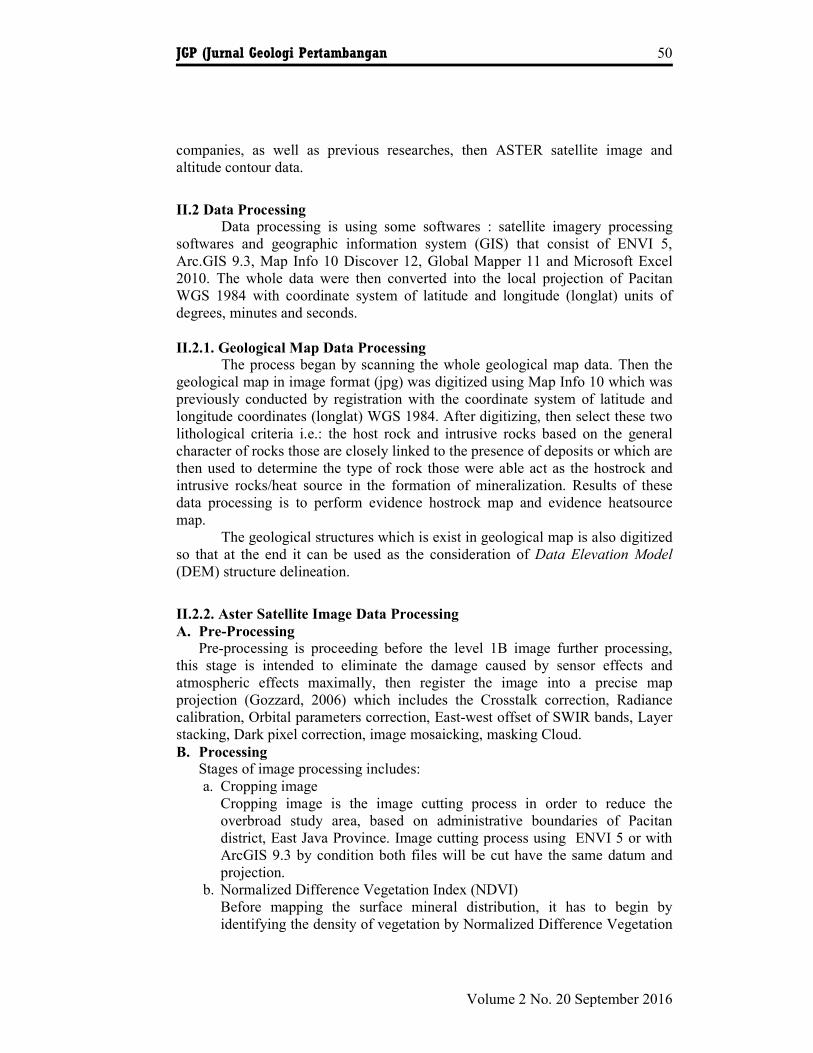
The study area located in Pacitan district (Figure 1) is a hilly region with
high and steep topography and only a few places that form the plains.
Geologically, Pacitan had been known to have very large potential minerals,
therefore it needs integrated efforts and sustainable management in order to be
able to contribute optimally to local governments and communities. Metallic
minerals that are considered to be economically important are gold and base
metal.
Figure 1. East Java province map dan Pacitan district as study area which is shaded gray
II RESEARCH METHODS
The principle of exploration models in this research divided into variables
which being identifier where the minerals are located, such as lithology,
geological structure and interpretation of satellite imagery. The outline of the
research methodology comprises four phases (modification from Rojash, 2003)
which consists of :
1. Determination of the model sediment deposits of gold and base metal
mineralization (Corbet, 1996);
2. Data gathering and data entry to be used as a weighting variable;
3. Refinement, extraction and data integration and
4. Determination of the relation between the variables of geology,
ASTER image analysis with the model deposits of gold and base
metal mineralization; determinion of areas of potential and test
validation.
II.1. Evidence Data Preparation
In addition to lithological, structural, and satellite image data, other data
required in further processing were hardcopy of geological map of Pacitan district,
mineral deposit data compilation and alteration, which were obtained from mining
JGP (Jurnal Geologi Pertambangan 50
Volume 2 No. 20 September 2016
companies, as well as previous researches, then ASTER satellite image and
altitude contour data.
II.2 Data Processing
Data processing is using some softwares : satellite imagery processing
softwares and geographic information system (GIS) that consist of ENVI 5,
Arc.GIS 9.3, Map Info 10 Discover 12, Global Mapper 11 and Microsoft Excel
2010. The whole data were then converted into the local projection of Pacitan
WGS 1984 with coordinate system of latitude and longitude (longlat) units of
degrees, minutes and seconds.
II.2.1. Geological Map Data Processing The process began by scanning the whole geological map data. Then the
geological map in image format (jpg) was digitized using Map Info 10 which was
previously conducted by registration with the coordinate system of latitude and
longitude coordinates (longlat) WGS 1984. After digitizing, then select these two
lithological criteria i.e.: the host rock and intrusive rocks based on the general
character of rocks those are closely linked to the presence of deposits or which are
then used to determine the type of rock those were able act as the hostrock and
intrusive rocks/heat source in the formation of mineralization. Results of these
data processing is to perform evidence hostrock map and evidence heatsource
map.
The geological structures which is exist in geological map is also digitized
so that at the end it can be used as the consideration of Data Elevation Model
(DEM) structure delineation.
II.2.2. Aster Satellite Image Data Processing
A. Pre-Processing
Pre-processing is proceeding before the level 1B image further processing,
this stage is intended to eliminate the damage caused by sensor effects and
atmospheric effects maximally, then register the image into a precise map
projection (Gozzard, 2006) which includes the Crosstalk correction, Radiance
calibration, Orbital parameters correction, East-west offset of SWIR bands, Layer
stacking, Dark pixel correction, image mosaicking, masking Cloud.
B. Processing
Stages of image processing includes:
a. Cropping image
Cropping image is the image cutting process in order to reduce the
overbroad study area, based on administrative boundaries of Pacitan
district, East Java Province. Image cutting process using ENVI 5 or with
ArcGIS 9.3 by condition both files will be cut have the same datum and
projection.
b. Normalized Difference Vegetation Index (NDVI)
Before mapping the surface mineral distribution, it has to begin by
identifying the density of vegetation by Normalized Difference Vegetation
JGP (Jurnal Geologi Pertambangan 51
Volume 2 No. 20 September 2016
Index (NDVI) method. Vegetation density mapping aims to identify the
characteristics of land cover, and as an early indication of the presence of
mineral deposits through vegetation (Rojas, 2003). NDVI normalization
calculation is obtained by using visible wavelength bands (red) (band 2;
0.63 to 0.69 m) and near infrared (band 3; 0.76 to 0.86 m).
Normalization before vegetation density calculation aims to that NDVI
which has a negative value (-) and water bodies would not be included to
the calculation. NDVI calculation according to Kalinowski and Oliver,
2004 are : NDVI = (NIR-Red Band Band) / (NIR-Red Band Band) = (3-
Band Band 2) / (3-Band Band 2).
Near infra red Band and Red Band are albedo value in the range of wave
lengths of 3 and 2 on the ASTER image. NDVI value obtained from the
above formula ranges from -1.0 to 1.0.
c. Defoliant Methods
Image processing for mapping the mineral surface in vegetated areas
consist of three stages. The first stage using defoliant methods to improve
the spectral response of surface minerals, which is based on the response
of spectral minerals reflectance. Second, the sample extraction area
(training area) as the reference pixel containing mineral surface alteration.
Third, supervised classification by determined the threshold limit of the
processed image, in order to obtain a map of surface mineral alteration
distribution.
The next stage is to extract the training sample area that has been known to
either containing or not a deposit of gold and base metals to be integrated
into alteration distribution processed output produced before proceeding
the further classification process. Supervised classification process is
performed by using the maximum likelihood method (Richards, 1999, in
Carranza and Hale, 2000).
Accuracy rate calculation of identified minerals alteration using formula
by comparing the number of alteration distribution points of training data point be
in mutual accord to the pixel position of the ASTER image alteration results,
divided by total number of points which have available alteration information on
the training point. The level of overall classification or overall performance class
can be calculated by summing total number of pixels that are classified and
dividing by the number of pixels that will be tested. Overal Classification =
(number of convenient alteration pixels) / (Total alteration sample).
II.2.3 Contour Data Processing
Contour data used to identify geological structures and patterns of
lineament that exist in the study area. Contour data process began by cropping
convenient to the administration of Pacitan district, then made into a digital map
elevation model (DEM) using software Global Mapper 11 or ArcGIS 9.3,
afterwards proceed it in to hillshade form so that the contrasts area can be more
visible. The image later can be processed to extract the appearance of lineament
pattern in study area.
JGP (Jurnal Geologi Pertambangan 52
Volume 2 No. 20 September 2016
The process of delineation of geological structure performed manually (on
screen) by dragging a line on the areas that are considered to have certain
characteristics, by changing the solar radiance direction on the angle of radiation
315°, 0°, 45°, 90°, 135°, 180°, 225°, 270°, and then the whole map is combined
into one (fusion). Results of structure derived from former geological map which
is combined with map of Hillshade DEM, eventually it can be determined the
confirmed alignment as the new geological structure and lineament as the results
of the manual on the hillshade DEM map.
Lineament and geological structure which are obtained from delineation
result created the influence area/buffer in order that it can be identified how far
the relation between the presence of a mineral deposit as well as geological
structure.
II.2.4. Training Point Mineral Deposits / Known Deposits
Preced by compile entire data of mineralization potential deposit, selected
which have association with gold and base metals, then registered to map Pacitan
in the form of map info table / shapefile that can be integrated with other data.
The data used is then divided into two parts, the first is used as a model for the
deposit and the rest is used as a validation point.
Beside the mineral deposit data, the selection of data against training
point which is associated with alteration of kaolinite, iron oxide alteration, as well
as non rock alteration. Then proceed tresholding to the point of each hydrothermal
alteration maps, both kaolinite and iron oxide alteration. This method later called
as supervised classification. The data used to clarify the distribution of
hydrothermal alteration resulting from the processing of ASTER image.
II.2.5 Spatial Data Processing
Evidence map which had been produced later proceed in buffer due to the
presence of mineral deposits, the optimal distance selected by condition of deposit
presence > 70%. Data analysis was conducted using weight of evidence (WOfE),
to gain information about how much weight and relevance of each geological
variable (evidence map) to the presence of mineral deposits in the form of a
matrix comparison. Analysis sequence methods of weight of evidence in the study
area (modified from Schmitt, 2010) :
1) Determine the criteria for the model, i.e. the mineralization deposits Gold and
Base Metal Mineralization in the Circum-Pacific (Corbet and Leach, 1996).
2) Geological data processing such as lithologic, structure, alteration, contour
data into a map of evidence.
3) Determine the number and percentage of deposits that are known precisely by
predicted in the model, i.e. the number of occurrences located within the
favorable zone, at least> 70% of the mineral deposits which are known to be
acceptable.
4) Evidence maps analyzed by software ArcGIS /MapInfo in determining the
reclassification boundary and those had been reclassified earlier in the form of
binary values 1, and 0 is no prospect prospects.
JGP (Jurnal Geologi Pertambangan 53
Volume 2 No. 20 September 2016
5) Each evidence map should be tested such as pairwise test and overall test of
conditional of independence (CI).
6) Weight (weight) is calculated, and the reclassification of the evidence map
combined to produce favorability map using raster operations calculator.
7) Determine the percentage of the area including to favorable zones (areas with
posterior probability greater than the prior probability), it is acceptable if the
area percentage of favorable zones at least about 25%, and by determining the
number and percentage of knowing deposits which is precisely predicted in
the model.
8) Favorable maps (posterior probability map) reclassified into multiclass map,
divided into three classes, i.e. high potential, intermediate potential and low
potential. Then conducted to the field validation (field checking) randomly
against the posterior map.
9) Determination of the target of cluster further exploration area.
II.3 Type Of Data
The data used in this study is a semi-detail geological map of all sub-
districts of Pacitan, ASTER image of Pacitan and surrounding areas, Pacitan
contour data, alteration assay data and non alteration, presence of metal
mineralized deposits compiled by local mining companies and from the
Department of Mineral and Energy of Pacitan District Government.
III. EVIDENCE MAP DESIGNATION AND WEIGHT OF EVIDENCE
(WOFE) MODELING
Evidence map is the result of the evidence data processing. Whole data
converted into digital format. The selected data should be important and relevant
to this study such as the lithological, structural, hydrothermal alteration map refers
to the study of literature and the earlier research.
III.1. Lithology
The most important information related to the geological map is
lithological data and age of the individual rock units. Lithology data are taken
from semi-detail geological maps of study area by scale of 1 : 25,000
(Widiasmoro, 2003) which divides the study area into several lithologies,
generally dominated by volcanic clastic rocks Oligo-Miocene age. Lithological
data has great potential for gold and base metal deposits modelling in the study
area. Based on the general characteristics of metallic mineral deposits on other
prospects and in the study area, it divided into two criterias, namely the host rock
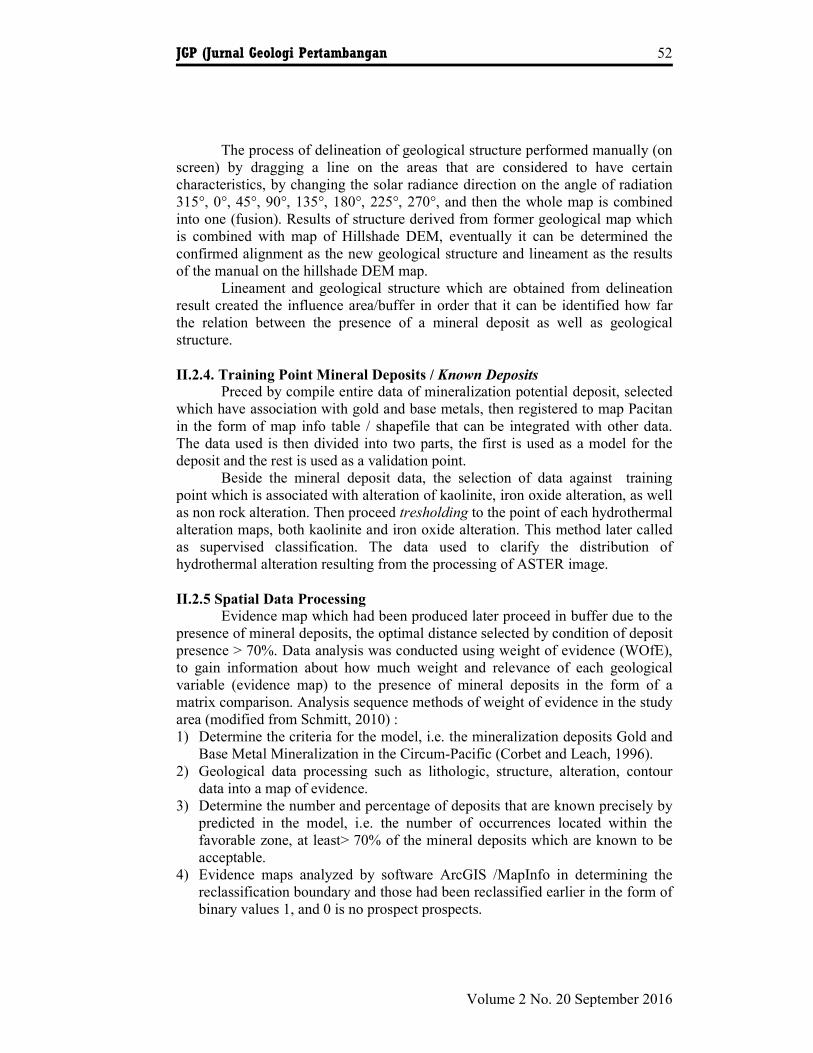
lithology / host rock (Figure 2) and rock heat source / heat source (Figure 3).
JGP (Jurnal Geologi Pertambangan 54
Volume 2 No. 20 September 2016
Figure 2. Hostrock evidence map of study area
The hostrock of Pacitan district, the rock metal mineralization is preserved
in polymic breccias unit, volcanic sandstone unit, microdiorit unit, the lava flow
breccias unit and andesite-dacite unit (Widiasmoro, 2003), these potential unit
contain Cu, Pb, Zn, Ag elements, (Figure III.1), yet the units are considered as
non parent rock (non hostrock).
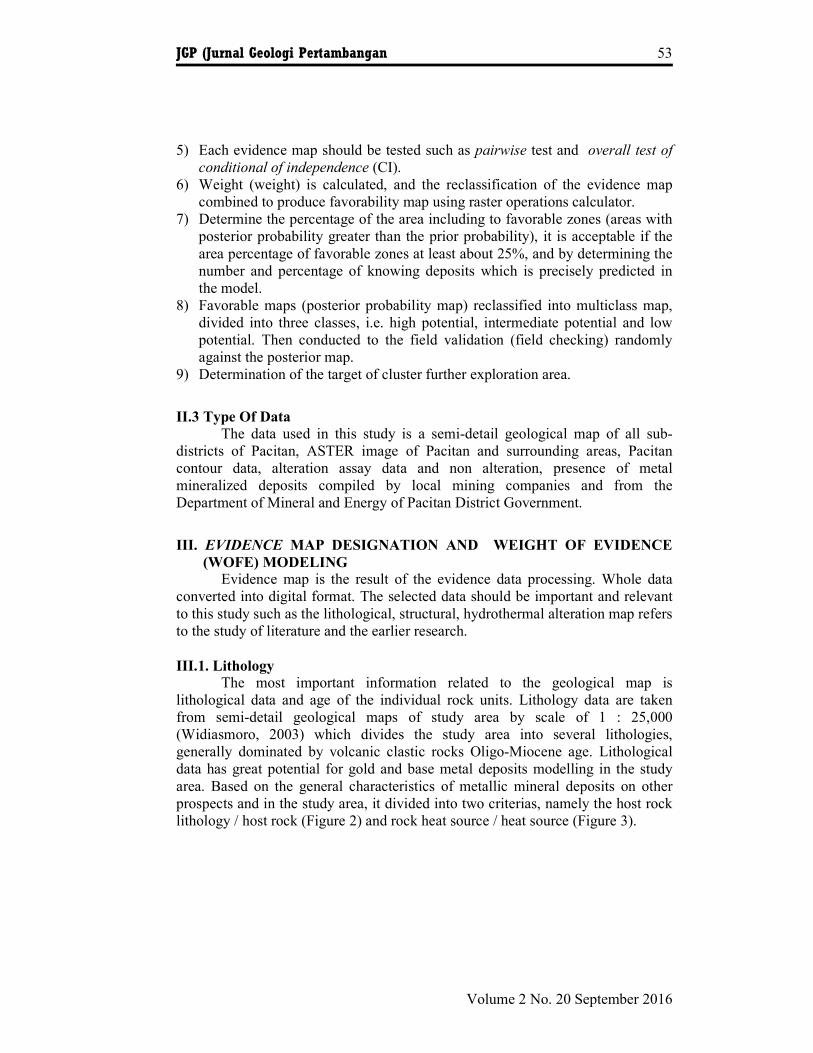
While the lithological unit which has role as heat source in the
mineralization process are dacite intrusions, andesite, pyroxene andesite,
granodiorite, and microdiorit (Figure III.2).
Figure 3. Heat source evidence map of study area
III.2. Geological Structure
Analysis of geological structure and lineament are used to find the link
between the presence of geological structures in the study area with mineral
deposits, as well as determine the direction of the the most influential structure in
the formation of mineral deposits.
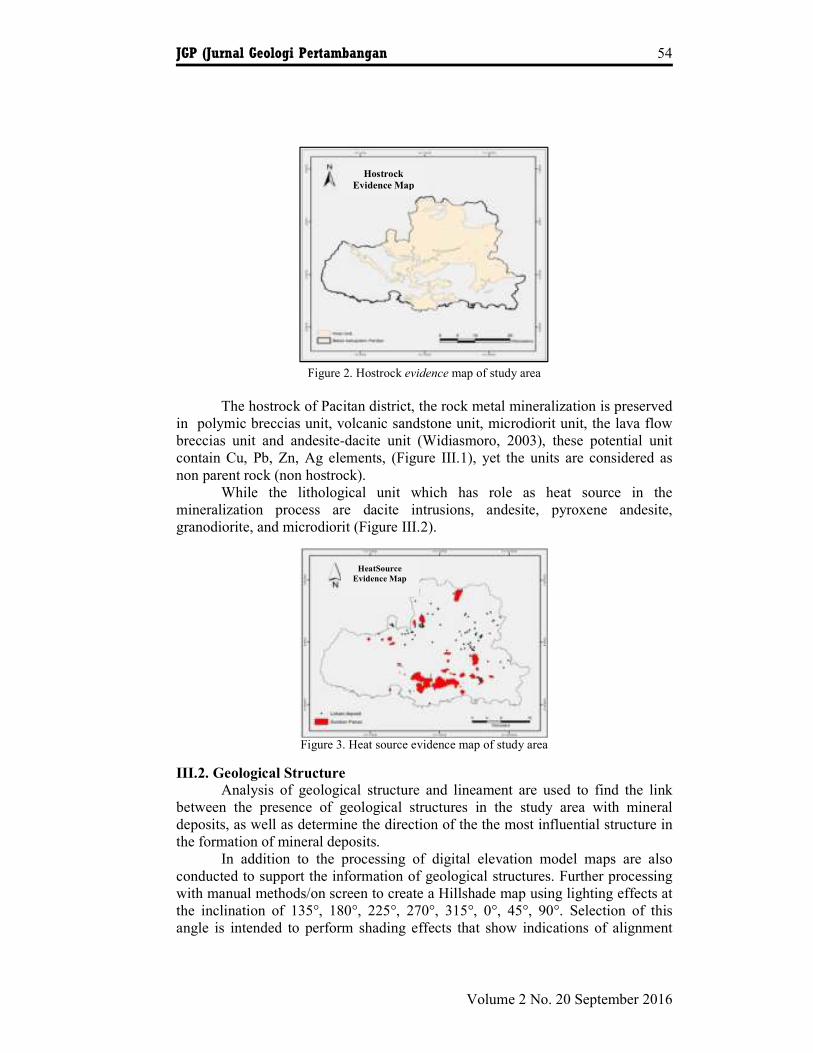
In addition to the processing of digital elevation model maps are also
conducted to support the information of geological structures. Further processing
with manual methods/on screen to create a Hillshade map using lighting effects at
the inclination of 135°, 180°, 225°, 270°, 315°, 0°, 45°, 90°. Selection of this
angle is intended to perform shading effects that show indications of alignment
Hostrock
Evidence Map
HeatSource
Evidence Map
JGP (Jurnal Geologi Pertambangan 55
Volume 2 No. 20 September 2016
due to the structure, especially to find the general direction of the dominant
structure in the study area. the result of hillshade map performs the best image
effects at the inclination 315°, 0°, 45° and 90° (Figure 4), then four different
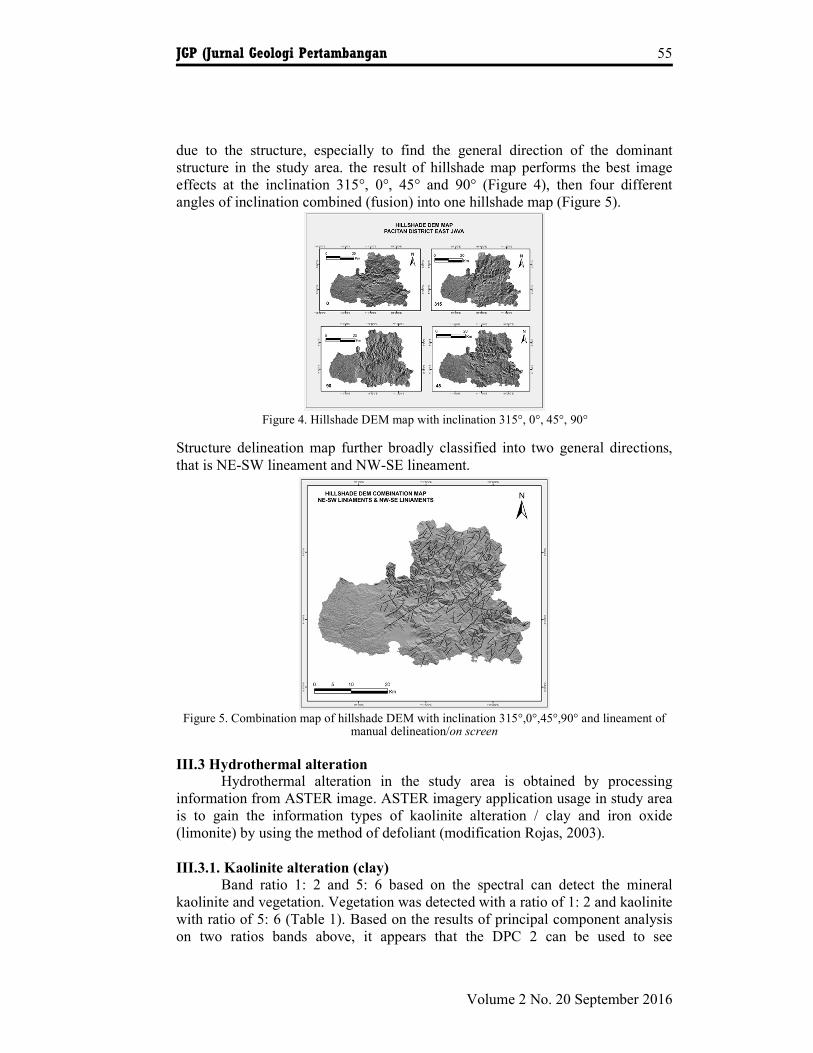
angles of inclination combined (fusion) into one hillshade map (Figure 5).
Figure 4. Hillshade DEM map with inclination 315°, 0°, 45°, 90°
Structure delineation map further broadly classified into two general directions,
that is NE-SW lineament and NW-SE lineament.
Figure 5. Combination map of hillshade DEM with inclination 315°,0°,45°,90° and lineament of
manual delineation/on screen
III.3 Hydrothermal alteration
Hydrothermal alteration in the study area is obtained by processing
information from ASTER image. ASTER imagery application usage in study area
is to gain the information types of kaolinite alteration / clay and iron oxide
(limonite) by using the method of defoliant (modification Rojas, 2003).
III.3.1. Kaolinite alteration (clay)
Band ratio 1: 2 and 5: 6 based on the spectral can detect the mineral
kaolinite and vegetation. Vegetation was detected with a ratio of 1: 2 and kaolinite
with ratio of 5: 6 (Table 1). Based on the results of principal component analysis
on two ratios bands above, it appears that the DPC 2 can be used to see
JGP (Jurnal Geologi Pertambangan 56
Volume 2 No. 20 September 2016
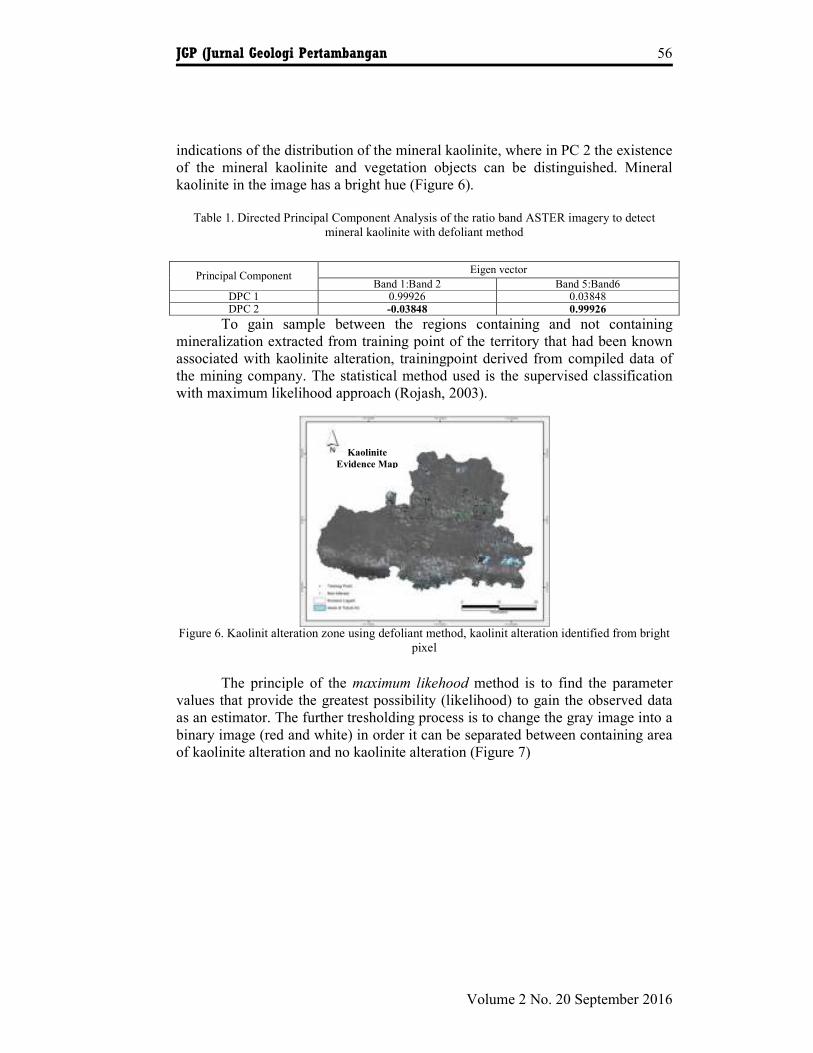
indications of the distribution of the mineral kaolinite, where in PC 2 the existence
of the mineral kaolinite and vegetation objects can be distinguished. Mineral
kaolinite in the image has a bright hue (Figure 6).
Table 1. Directed Principal Component Analysis of the ratio band ASTER imagery to detect
mineral kaolinite with defoliant method
To gain sample between the regions containing and not containing
mineralization extracted from training point of the territory that had been known
associated with kaolinite alteration, trainingpoint derived from compiled data of
the mining company. The statistical method used is the supervised classification
with maximum likelihood approach (Rojash, 2003).
Figure 6. Kaolinit alteration zone using defoliant method, kaolinit alteration identified from bright
pixel
The principle of the maximum likehood method is to find the parameter
values that provide the greatest possibility (likelihood) to gain the observed data
as an estimator. The further tresholding process is to change the gray image into a
binary image (red and white) in order it can be separated between containing area
of kaolinite alteration and no kaolinite alteration (Figure 7)
Principal Component Eigen vector
Band 1:Band 2 Band 5:Band6 DPC 1 0.99926 0.03848 DPC 2 -0.03848 0.99926
Kaolinite
Evidence Map
JGP (Jurnal Geologi Pertambangan 57
Volume 2 No. 20 September 2016
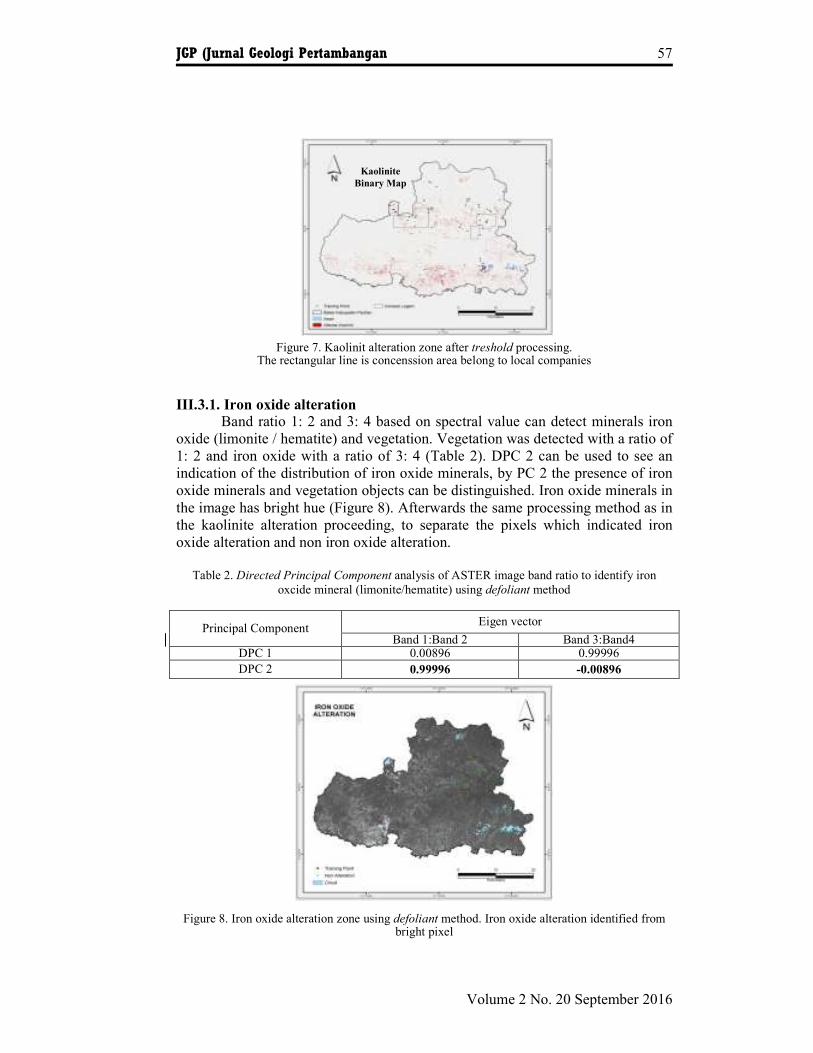
Figure 7. Kaolinit alteration zone after treshold processing. The rectangular line is concenssion area belong to local companies
III.3.1. Iron oxide alteration
Band ratio 1: 2 and 3: 4 based on spectral value can detect minerals iron
oxide (limonite / hematite) and vegetation. Vegetation was detected with a ratio of
1: 2 and iron oxide with a ratio of 3: 4 (Table 2). DPC 2 can be used to see an
indication of the distribution of iron oxide minerals, by PC 2 the presence of iron
oxide minerals and vegetation objects can be distinguished. Iron oxide minerals in
the image has bright hue (Figure 8). Afterwards the same processing method as in
the kaolinite alteration proceeding, to separate the pixels which indicated iron
oxide alteration and non iron oxide alteration.
Table 2. Directed Principal Component analysis of ASTER image band ratio to identify iron
oxcide mineral (limonite/hematite) using defoliant method
Figure 8. Iron oxide alteration zone using defoliant method. Iron oxide alteration identified from bright pixel
Principal Component Eigen vector
Band 1:Band 2 Band 3:Band4 DPC 1 0.00896 0.99996
DPC 2 0.99996 -0.00896
Kaolinite
Binary Map
JGP (Jurnal Geologi Pertambangan 58
Volume 2 No. 20 September 2016
III.3.3. Distribution Validation Of Hydrothermal Alteration Map
Testing towards the accuracy of distribution maps of the hydrothermal
alteration minerals known on the ASTER image processing should be validated,
coordinate position (pixel) with exploration result data and mapping field data.
This is useful in determining the percentage of accuracy of the resulting alteration
maps.
If the alteration pixels of the analysis of image processing has higher value
than to threshold, it can be known to be consistent and whereas if it is below the
threshold value is known to be an error factor. Alteration validation by the above
method produces a total accuracy rate of 82.5% of hydrothermal alteration (Table
3).
Table 3. Hydrothermal alteration accuracy rate of validation result by training point data of
companies compilation
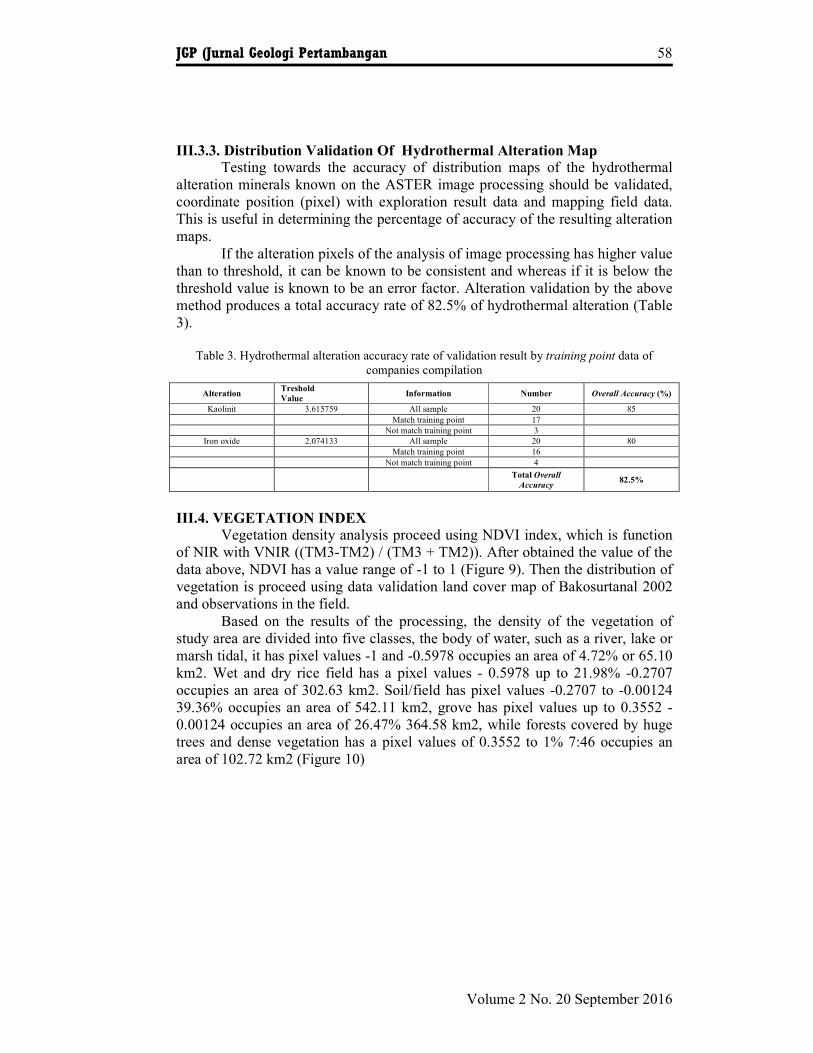
III.4. VEGETATION INDEX
Vegetation density analysis proceed using NDVI index, which is function
of NIR with VNIR ((TM3-TM2) / (TM3 + TM2)). After obtained the value of the
data above, NDVI has a value range of -1 to 1 (Figure 9). Then the distribution of
vegetation is proceed using data validation land cover map of Bakosurtanal 2002
and observations in the field.
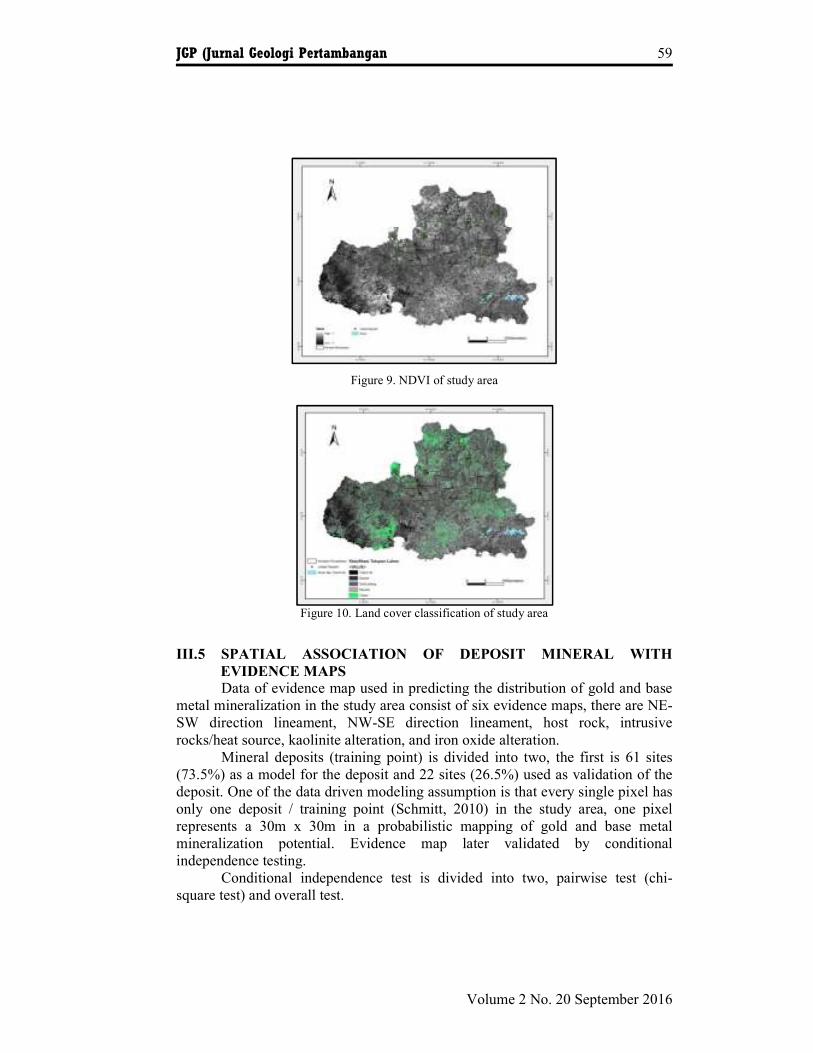
Based on the results of the processing, the density of the vegetation of
study area are divided into five classes, the body of water, such as a river, lake or
marsh tidal, it has pixel values -1 and -0.5978 occupies an area of 4.72% or 65.10
km2. Wet and dry rice field has a pixel values - 0.5978 up to 21.98% -0.2707
occupies an area of 302.63 km2. Soil/field has pixel values -0.2707 to -0.00124
39.36% occupies an area of 542.11 km2, grove has pixel values up to 0.3552 -
0.00124 occupies an area of 26.47% 364.58 km2, while forests covered by huge
trees and dense vegetation has a pixel values of 0.3552 to 1% 7:46 occupies an
area of 102.72 km2 (Figure 10)
Alteration Treshold
Value Information Number Overall Accuracy (%)
Kaolinit 3.615759 All sample 20 85
Match training point 17
Not match training point 3
Iron oxide 2.074133 All sample 20 80
Match training point 16
Not match training point 4
Total Overall
Accuracy 82.5%
JGP (Jurnal Geologi Pertambangan 59
Volume 2 No. 20 September 2016
Figure 9. NDVI of study area
Figure 10. Land cover classification of study area
III.5 SPATIAL ASSOCIATION OF DEPOSIT MINERAL WITH
EVIDENCE MAPS
Data of evidence map used in predicting the distribution of gold and base
metal mineralization in the study area consist of six evidence maps, there are NE-
SW direction lineament, NW-SE direction lineament, host rock, intrusive
rocks/heat source, kaolinite alteration, and iron oxide alteration.
Mineral deposits (training point) is divided into two, the first is 61 sites
(73.5%) as a model for the deposit and 22 sites (26.5%) used as validation of the
deposit. One of the data driven modeling assumption is that every single pixel has
only one deposit / training point (Schmitt, 2010) in the study area, one pixel
represents a 30m x 30m in a probabilistic mapping of gold and base metal
mineralization potential. Evidence map later validated by conditional
independence testing.
Conditional independence test is divided into two, pairwise test (chi-
square test) and overall test.
JGP (Jurnal Geologi Pertambangan 60
Volume 2 No. 20 September 2016
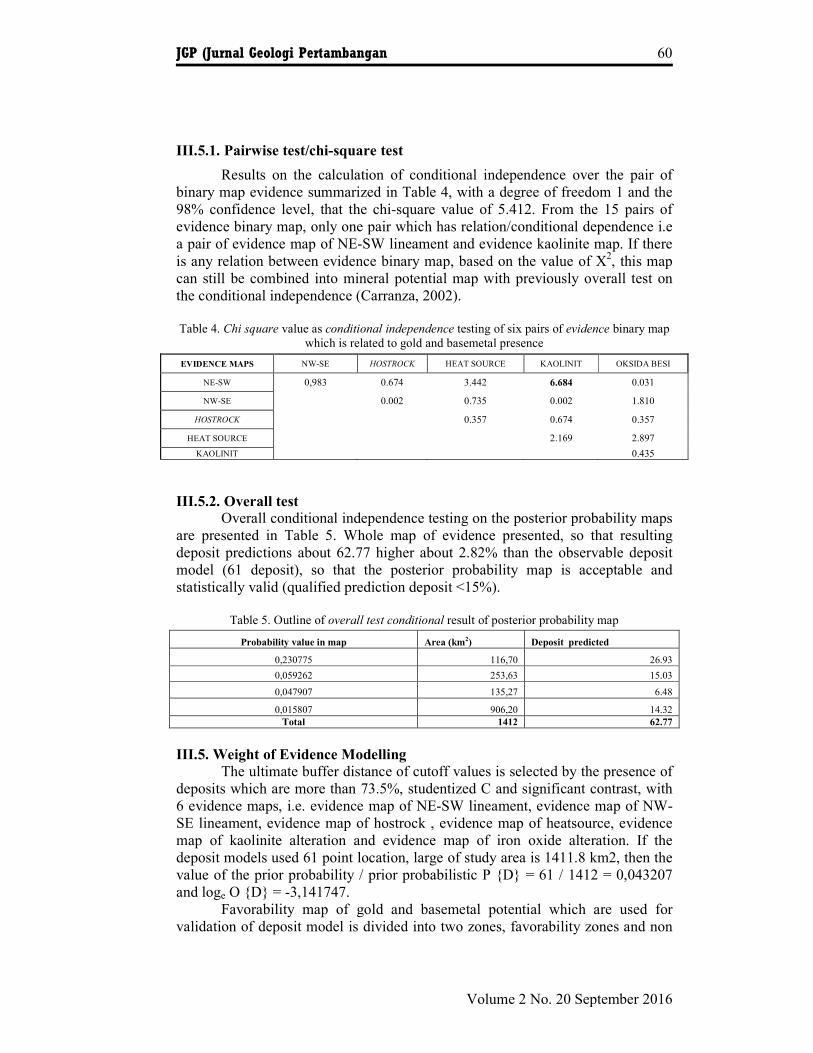
III.5.1. Pairwise test/chi-square test
Results on the calculation of conditional independence over the pair of
binary map evidence summarized in Table 4, with a degree of freedom 1 and the
98% confidence level, that the chi-square value of 5.412. From the 15 pairs of
evidence binary map, only one pair which has relation/conditional dependence i.e
a pair of evidence map of NE-SW lineament and evidence kaolinite map. If there
is any relation between evidence binary map, based on the value of X2, this map
can still be combined into mineral potential map with previously overall test on
the conditional independence (Carranza, 2002).
Table 4. Chi square value as conditional independence testing of six pairs of evidence binary map
which is related to gold and basemetal presence
III.5.2. Overall test
Overall conditional independence testing on the posterior probability maps
are presented in Table 5. Whole map of evidence presented, so that resulting
deposit predictions about 62.77 higher about 2.82% than the observable deposit
model (61 deposit), so that the posterior probability map is acceptable and
statistically valid (qualified prediction deposit <15%).
Table 5. Outline of overall test conditional result of posterior probability map
III.5. Weight of Evidence Modelling
The ultimate buffer distance of cutoff values is selected by the presence of
deposits which are more than 73.5%, studentized C and significant contrast, with
6 evidence maps, i.e. evidence map of NE-SW lineament, evidence map of NW-
SE lineament, evidence map of hostrock , evidence map of heatsource, evidence
map of kaolinite alteration and evidence map of iron oxide alteration. If the
deposit models used 61 point location, large of study area is 1411.8 km2, then the
value of the prior probability / prior probabilistic P {D} = 61 / 1412 = 0,043207
and loge O {D} = -3,141747.
Favorability map of gold and basemetal potential which are used for
validation of deposit model is divided into two zones, favorability zones and non
EVIDENCE MAPS NW-SE HOSTROCK HEAT SOURCE KAOLINIT OKSIDA BESI
NE-SW 0,983 0.674 3.442 6.684 0.031
NW-SE
0.002 0.735 0.002 1.810
HOSTROCK
0.357 0.674 0.357
HEAT SOURCE
2.169 2.897
KAOLINIT
0.435
Probability value in map Area (km2) Deposit predicted
0,230775 116,70 26.93
0,059262 253,63 15.03
0,047907 135,27 6.48
0,015807 906,20 14.32
Total 1412 62.77
JGP (Jurnal Geologi Pertambangan 61
Volume 2 No. 20 September 2016
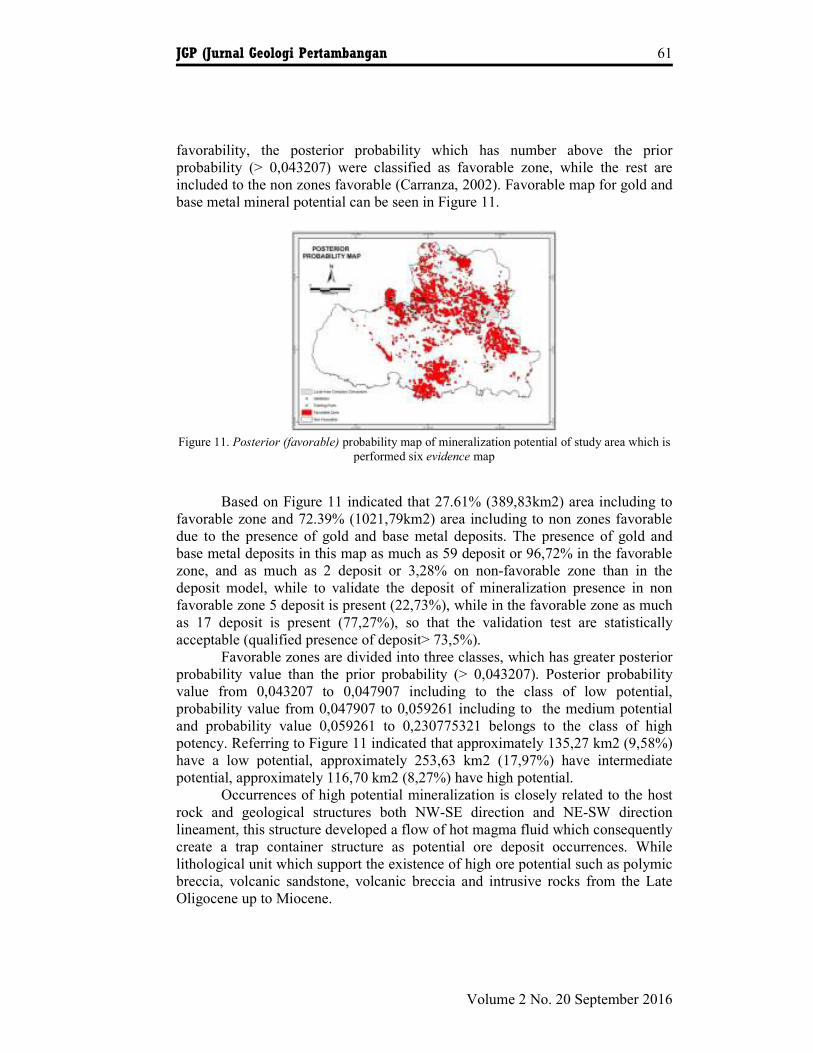
favorability, the posterior probability which has number above the prior
probability (> 0,043207) were classified as favorable zone, while the rest are
included to the non zones favorable (Carranza, 2002). Favorable map for gold and
base metal mineral potential can be seen in Figure 11.
Figure 11. Posterior (favorable) probability map of mineralization potential of study area which is
performed six evidence map
Based on Figure 11 indicated that 27.61% (389,83km2) area including to
favorable zone and 72.39% (1021,79km2) area including to non zones favorable
due to the presence of gold and base metal deposits. The presence of gold and
base metal deposits in this map as much as 59 deposit or 96,72% in the favorable
zone, and as much as 2 deposit or 3,28% on non-favorable zone than in the
deposit model, while to validate the deposit of mineralization presence in non
favorable zone 5 deposit is present (22,73%), while in the favorable zone as much
as 17 deposit is present (77,27%), so that the validation test are statistically
acceptable (qualified presence of deposit> 73,5%).
Favorable zones are divided into three classes, which has greater posterior
probability value than the prior probability (> 0,043207). Posterior probability
value from 0,043207 to 0,047907 including to the class of low potential,
probability value from 0,047907 to 0,059261 including to the medium potential
and probability value 0,059261 to 0,230775321 belongs to the class of high
potency. Referring to Figure 11 indicated that approximately 135,27 km2 (9,58%)
have a low potential, approximately 253,63 km2 (17,97%) have intermediate
potential, approximately 116,70 km2 (8,27%) have high potential.
Occurrences of high potential mineralization is closely related to the host
rock and geological structures both NW-SE direction and NE-SW direction
lineament, this structure developed a flow of hot magma fluid which consequently
create a trap container structure as potential ore deposit occurrences. While
lithological unit which support the existence of high ore potential such as polymic
breccia, volcanic sandstone, volcanic breccia and intrusive rocks from the Late
Oligocene up to Miocene.
JGP (Jurnal Geologi Pertambangan 62
Volume 2 No. 20 September 2016
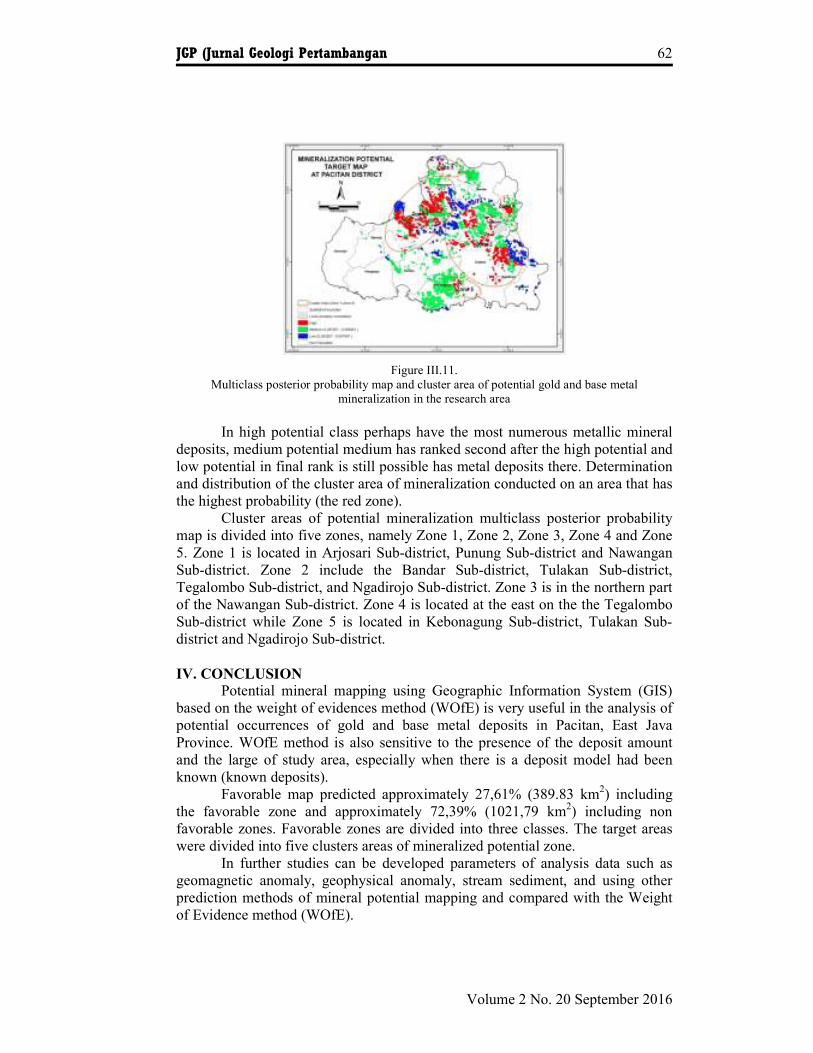
Figure III.11.
Multiclass posterior probability map and cluster area of potential gold and base metal
mineralization in the research area
In high potential class perhaps have the most numerous metallic mineral
deposits, medium potential medium has ranked second after the high potential and
low potential in final rank is still possible has metal deposits there. Determination
and distribution of the cluster area of mineralization conducted on an area that has
the highest probability (the red zone).
Cluster areas of potential mineralization multiclass posterior probability
map is divided into five zones, namely Zone 1, Zone 2, Zone 3, Zone 4 and Zone
5. Zone 1 is located in Arjosari Sub-district, Punung Sub-district and Nawangan
Sub-district. Zone 2 include the Bandar Sub-district, Tulakan Sub-district,
Tegalombo Sub-district, and Ngadirojo Sub-district. Zone 3 is in the northern part
of the Nawangan Sub-district. Zone 4 is located at the east on the the Tegalombo
Sub-district while Zone 5 is located in Kebonagung Sub-district, Tulakan Sub-
district and Ngadirojo Sub-district.
IV. CONCLUSION
Potential mineral mapping using Geographic Information System (GIS)
based on the weight of evidences method (WOfE) is very useful in the analysis of
potential occurrences of gold and base metal deposits in Pacitan, East Java
Province. WOfE method is also sensitive to the presence of the deposit amount
and the large of study area, especially when there is a deposit model had been
known (known deposits).
Favorable map predicted approximately 27,61% (389.83 km2) including
the favorable zone and approximately 72,39% (1021,79 km2) including non
favorable zones. Favorable zones are divided into three classes. The target areas
were divided into five clusters areas of mineralized potential zone.
In further studies can be developed parameters of analysis data such as
geomagnetic anomaly, geophysical anomaly, stream sediment, and using other
prediction methods of mineral potential mapping and compared with the Weight
of Evidence method (WOfE).
JGP (Jurnal Geologi Pertambangan 63
Volume 2 No. 20 September 2016
BIBLIOGRAPHY
Carranza, E.J.M. and Hale, M. 2000, Geologically constrained probabilistic
mapping of gold potential, Bauio District, Philippines. Natural Resources
Research 9 (3).
Carranza, E.J.M., 2002, Geologically constrained probabilistic mapping of gold
potential, Bauio District, Philippines. ITC Publication Number 86
International Institute for Aerospace Survey and Earth Sciences (ITC)
Corbet, G.J. & Leach, T.M., 1996. Southwest Pacific Rim Gold/Copper
System:Structure, Alteration, and Mineralization, A workshop presented for
the Society of Exploration Geochemists, Townsville.
Gozzard, J.R., 2006. Image Processing Of Aster Multispectral Data, Department
of Industry and Resources, Western Australia Geological Survey, Record
2006/9, 51p.
Harris, J.R., Sanborn-Barrie, M., Panagapko, D.A., Skulski, T., and Parker, J.R.,
2006, Gold prospectivity maps of the Red Lake greenstone belt: Application
of GIS technology: Canadian Journal of Earth Sciences (in press).
Kalinowski, A., Oliver, S. 2004. ASTER Mineral Index Processing Manual.
Remote Sensing Applications Geoscience, Australia.
Rojas, A. S. 2003. Predictive Mapping of Massive Sulphide Potential in the
Western Part of the Escambray Terrain, Cuba. International Institute for
Geo-Information Science and Earth Observation, Enschede, Belanda.
Schmitt, 2010, Weights of Evidence Mineral Prospectivity Modelling with
ArcGIS. EOSC Directed Studies.
Widiasmoro., Wintolo, D., 2003. Pemetaan Geologi dan Perhitungan Cadangan
Sumberdaya Mineral Kabupaten Pacitan, Universitas Gadjah Mada.

JGP (Jurnal Geologi Pertambangan 64
Volume 2 No. 20 September 2016