gis: concepts, methods & tools - peer
TRANSCRIPT

1
Territories, Environment, Remote Sensing & Spatial Information Joint Research Unit Cemagref - CIRAD - ENGREF
Pierre BAZILE
GIS: concepts, methods & toolsGIS: concepts, methods & tools
METIER METIER GraduateGraduate Training Course no. 2 Training Course no. 2 –– Montpellier Montpellier -- FebruaryFebruary 20072007
Information Management in Information Management in EnvironmentalEnvironmental SciencesSciences
Introduction to GISIntroduction to GIS
Structuring of geographic informationStructuring of geographic information

2 / 30
INTRODUCTION TO GIS: STRUCTURING GEOGRAPHIC INFORMATIONINTRODUCTION TO GIS: STRUCTURING GEOGRAPHIC INFORMATION
INFORMATION SYSTEM AND ORGANIZATIONINFORMATION SYSTEM AND ORGANIZATION
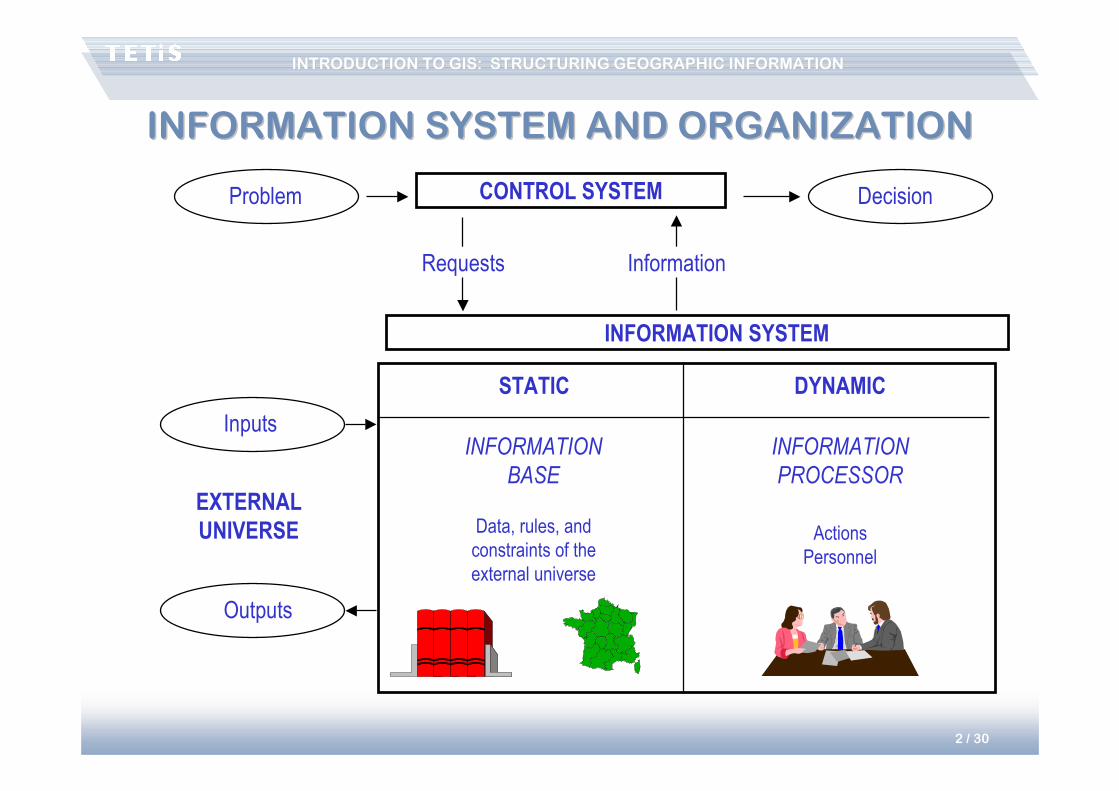
CONTROL SYSTEM
INFORMATION SYSTEM
Problem Decision
Requests Information
Inputs
Outputs
EXTERNAL
UNIVERSE
INFORMATION
BASE
STATIC
Data, rules, and
constraints of the
external universe
DYNAMIC
INFORMATION
PROCESSOR
Actions
Personnel

3 / 30
INTRODUCTION TO GIS: STRUCTURING GEOGRAPHIC INFORMATIONINTRODUCTION TO GIS: STRUCTURING GEOGRAPHIC INFORMATION
AUTOMATIZATION OF THE INFORMATION SYSTEMAUTOMATIZATION OF THE INFORMATION SYSTEM
AUTOMATIZED INFORMATION SYSTEM
Inputs
Outputs
FORMALISABLE
UNIVERSE
INFORMATION
BASE
STATIC DYNAMIC
INFORMATION
PROCESSOR
Personnel
Data
model
Computer
Software: DBMS
(Database management system)

4 / 30
INTRODUCTION TO GIS: STRUCTURING GEOGRAPHIC INFORMATIONINTRODUCTION TO GIS: STRUCTURING GEOGRAPHIC INFORMATION
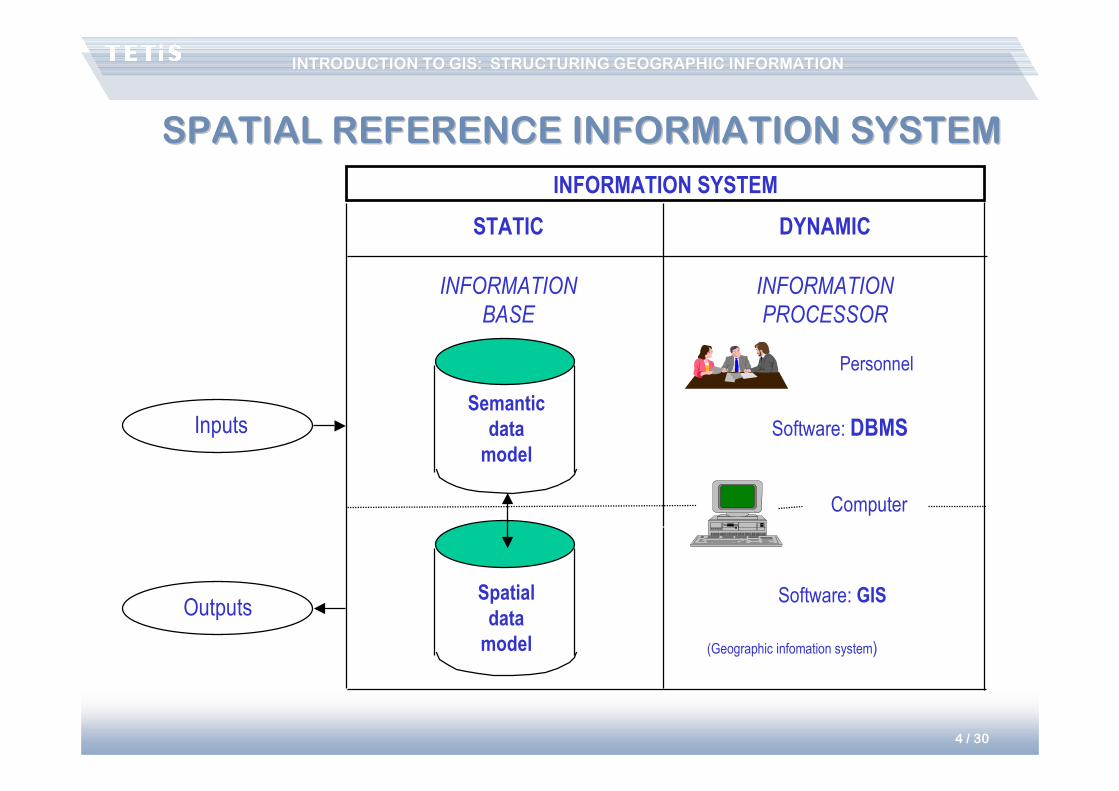
SPATIAL REFERENCE INFORMATION SYSTEMSPATIAL REFERENCE INFORMATION SYSTEM
INFORMATION SYSTEM
Inputs
Outputs
INFORMATION
BASE
STATIC DYNAMIC
INFORMATION
PROCESSOR
Personnel
Semantic
data
model
Software: GISSpatial
data
model
Software: DBMS
Computer
(Geographic infomation system)

5 / 30
INTRODUCTION TO GIS: STRUCTURING GEOGRAPHIC INFORMATIONINTRODUCTION TO GIS: STRUCTURING GEOGRAPHIC INFORMATION
GIS: WHAT EXACTLY IS IT?GIS: WHAT EXACTLY IS IT?
The term GIS represents, in fact, 3 different concepts:
• An information system about a territory or project
• The databases describing this IS
• The IT solutions used (in particular: software)
One has to return to the basic concept!
Importance of the spatial component of the IS (localization of objects and processes, spatial interactions between elements)

6 / 30
INTRODUCTION TO GIS: STRUCTURING GEOGRAPHIC INFORMATIONINTRODUCTION TO GIS: STRUCTURING GEOGRAPHIC INFORMATION
REPRESENTING GEOGRAPHICAL DATAREPRESENTING GEOGRAPHICAL DATA
Duality of Geographical Information:
• Graphical information:The geographical objects, their localization, their topological relationships
• Thematic information:The descriptors of these objects, of these localizations
‘semantic’ data
500 Metres0
N

7 / 30
INTRODUCTION TO GIS: STRUCTURING GEOGRAPHIC INFORMATIONINTRODUCTION TO GIS: STRUCTURING GEOGRAPHIC INFORMATION
REPRESENTING GRAPHIC DATAREPRESENTING GRAPHIC DATA
Semantic
database
Semantic
database
Entities
Relationship
Spatial
representation
Spatial
representation
Entities
Relationships
Point
Line
Surface
Continuous
Tables
Adjacency
Inclusion
Proximity
Path
Link

8 / 30
INTRODUCTION TO GIS: STRUCTURING GEOGRAPHIC INFORMATIONINTRODUCTION TO GIS: STRUCTURING GEOGRAPHIC INFORMATION
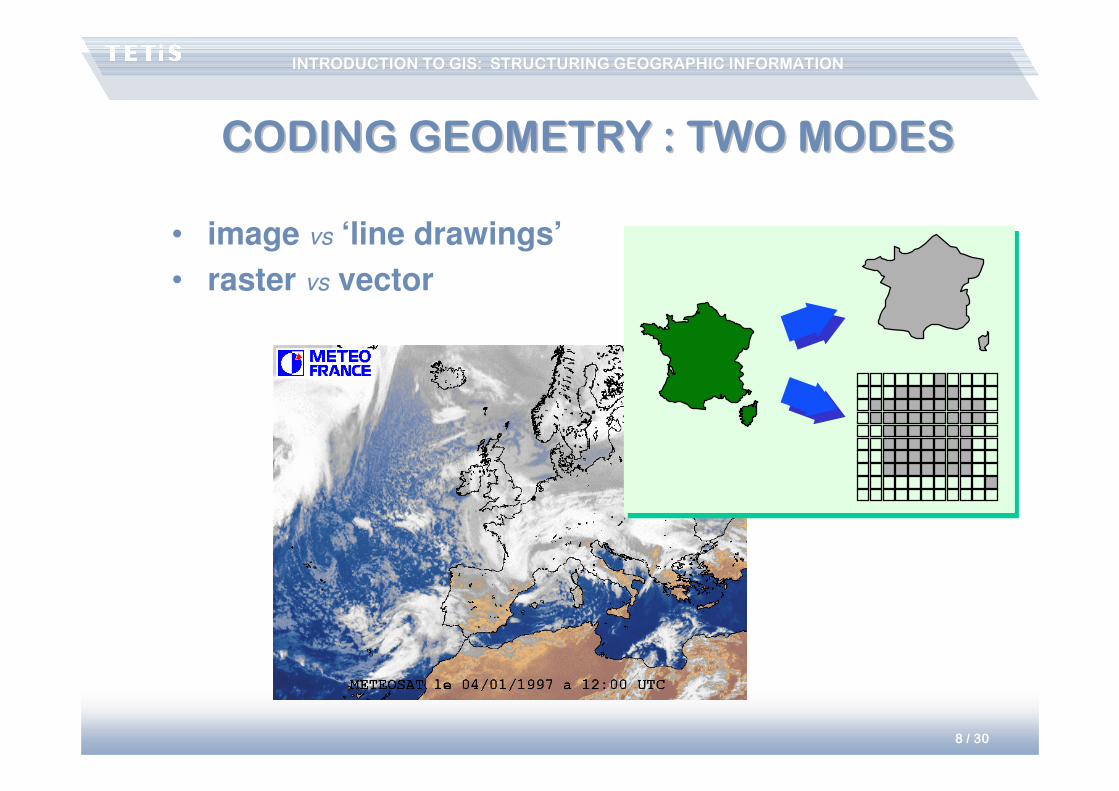
CODING GEOMETRY : TWO MODESCODING GEOMETRY : TWO MODES
• image vs ‘line drawings’
• raster vs vector

9 / 30
INTRODUCTION TO GIS: STRUCTURING GEOGRAPHIC INFORMATIONINTRODUCTION TO GIS: STRUCTURING GEOGRAPHIC INFORMATION
VECTOR REPRESENTATIONVECTOR REPRESENTATION
bâtiment
route
lac
10 / 30
INTRODUCTION TO GIS: STRUCTURING GEOGRAPHIC INFORMATIONINTRODUCTION TO GIS: STRUCTURING GEOGRAPHIC INFORMATION
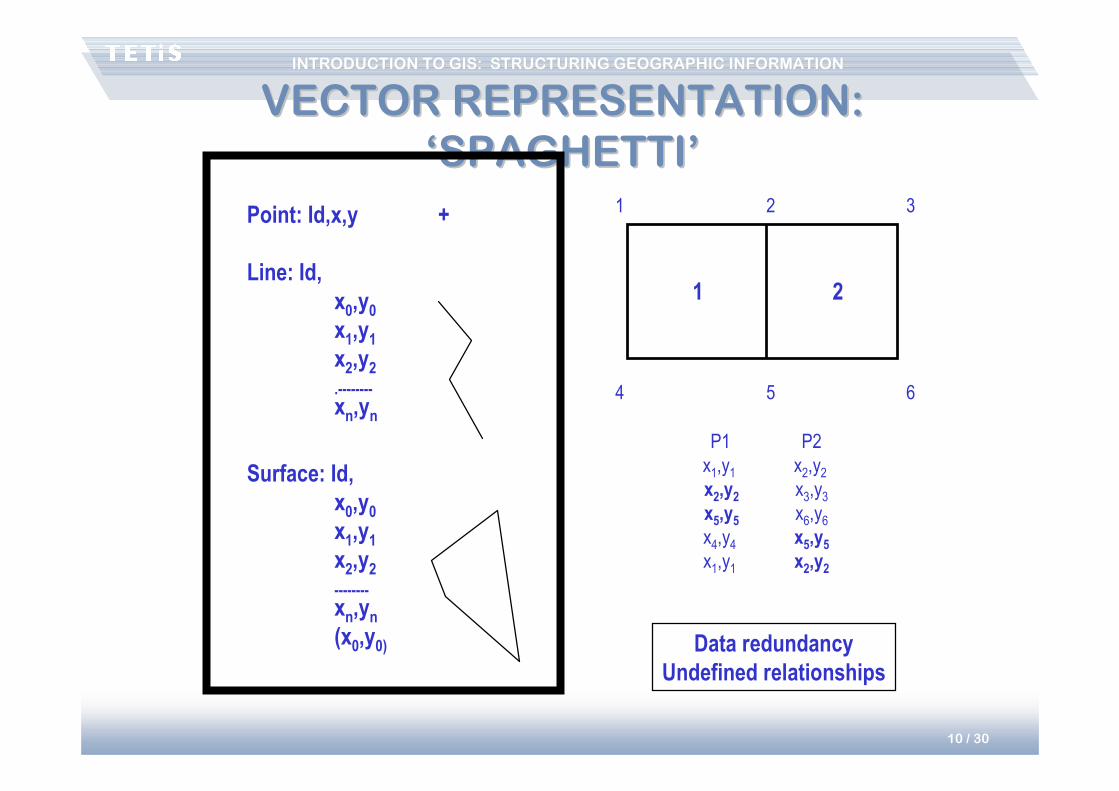
VECTOR REPRESENTATION: VECTOR REPRESENTATION:
‘SPAGHETTI’‘SPAGHETTI’
Point: Id,x,y +
Line: Id,
x0,y0x1,y1x2,y2.--------
xn,yn
Surface: Id,
x0,y0x1,y1x2,y2--------
xn,yn(x0,y0)
1 2
1 2 3
4 5 6
P1 P2
x1,y1 x2,y2
x2,y2 x3,y3
x5,y5 x6,y6
x4,y4 x5,y5x1,y1 x2,y2
Data redundancy
Undefined relationships

11 / 30
INTRODUCTION TO GIS: STRUCTURING GEOGRAPHIC INFORMATIONINTRODUCTION TO GIS: STRUCTURING GEOGRAPHIC INFORMATION
VECTOR REPRESENTATION:VECTOR REPRESENTATION:
NETWORK TOPOLOGYNETWORK TOPOLOGY
Point: Id,x,y +
Line: Id, (L)
Nax1,y1x2,y2.--------
Nb
Node: Id,x,y
Surface: Id,
L1L2----
Ln
1 2
1 2 3
4 5 6
No redundancy
Management of connectedness
L1 L2 L3
N1
N2
L1
N1x1,y1
x4,y4
N2
L2
N1N2
L3
N1x3,y3
x6,y6
N2
P1
L1
L2
P2
L2
L3
N1
x2,y2
N2
x5,y5
12 / 30
INTRODUCTION TO GIS: STRUCTURING GEOGRAPHIC INFORMATIONINTRODUCTION TO GIS: STRUCTURING GEOGRAPHIC INFORMATION
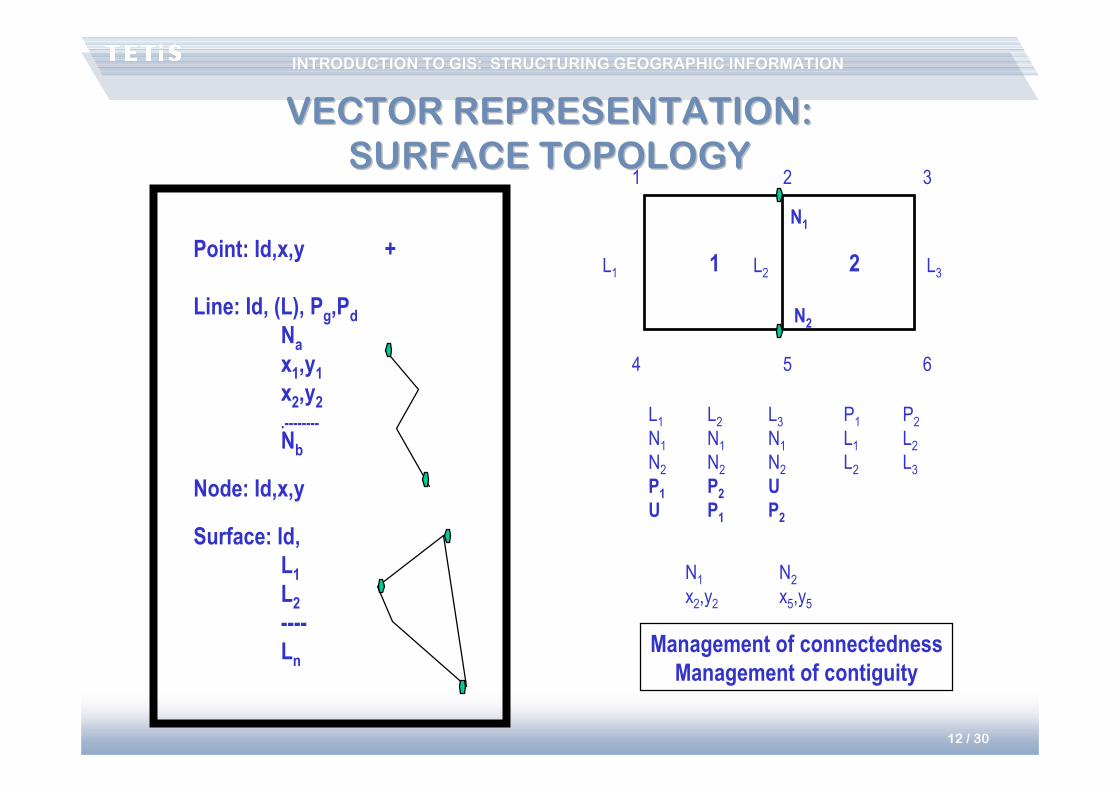
VECTOR REPRESENTATION: VECTOR REPRESENTATION:
SURFACE TOPOLOGYSURFACE TOPOLOGY
1 2
1 2 3
4 5 6
Management of connectedness
Management of contiguity
Point: Id,x,y +
Line: Id, (L), Pg,PdNax1,y1x2,y2.--------
Nb
Node: Id,x,y
Surface: Id,
L1L2----
Ln
L1 L2 L3
N1
N2
L1
N1
N2
P1U
L2
N1
N2
P2P1
L3
N1
N2
U
P2
P1
L1
L2
P2
L2
L3
N1
x2,y2
N2
x5,y5

13 / 30
INTRODUCTION TO GIS: STRUCTURING GEOGRAPHIC INFORMATIONINTRODUCTION TO GIS: STRUCTURING GEOGRAPHIC INFORMATION
‘SPAGHETTI’ MODEL‘SPAGHETTI’ MODEL
• Entities
– point: x, y coordinates
– line: list of x,y coordinates corresponding to nodes
– sometimes polygons: set of x,y coordinates, forming a loop: the first coordinate
couple = last coordinate couple
� The spaghetti mode produces a visual effect of polygons but, most often, no polygon
entity is stored
• No spatial relationships between objects– unjoined arcs – unclosed polygons
� polygons cannot form a surface
– intersections without nodes at the crossing of two arcs
– Adjacent polygons that overlap or separated by ‘blanks’
Appearence
!
Reality
14 / 30
INTRODUCTION TO GIS: STRUCTURING GEOGRAPHIC INFORMATIONINTRODUCTION TO GIS: STRUCTURING GEOGRAPHIC INFORMATION
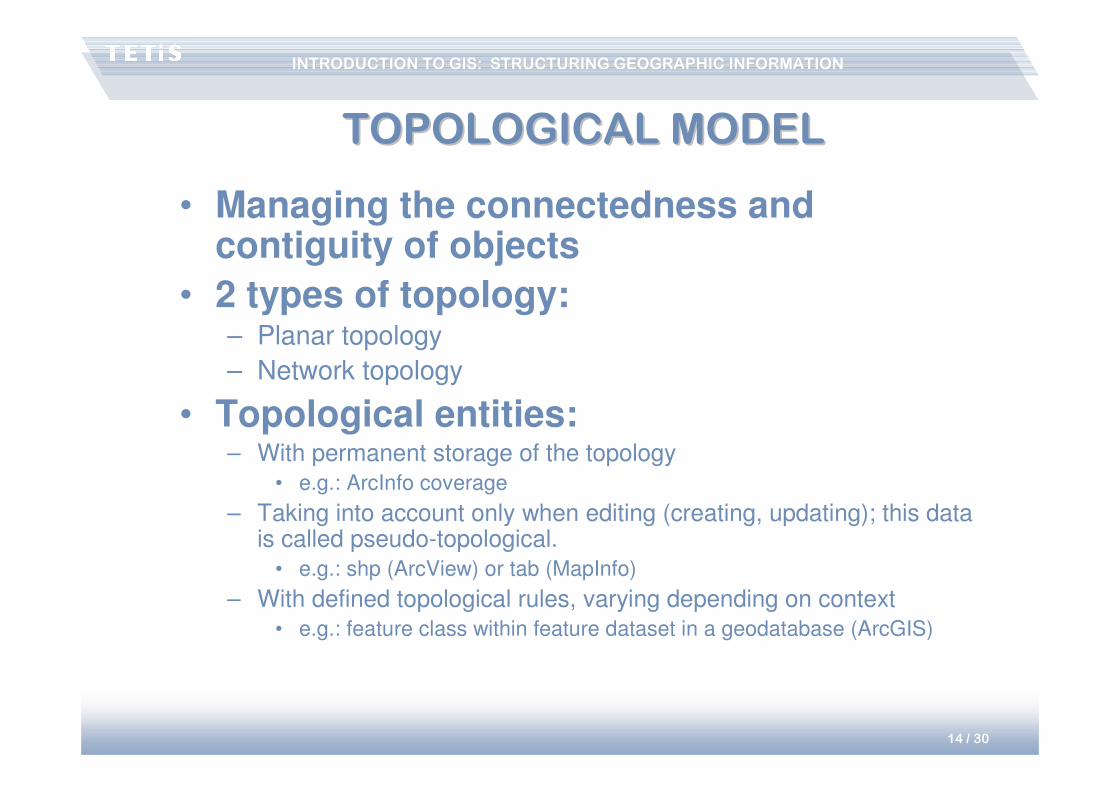
TOPOLOGICAL MODELTOPOLOGICAL MODEL
• Managing the connectedness and contiguity of objects
• 2 types of topology: – Planar topology
– Network topology
• Topological entities:– With permanent storage of the topology
• e.g.: ArcInfo coverage
– Taking into account only when editing (creating, updating); this data is called pseudo-topological.
• e.g.: shp (ArcView) or tab (MapInfo)
– With defined topological rules, varying depending on context
• e.g.: feature class within feature dataset in a geodatabase (ArcGIS)

15 / 30
INTRODUCTION TO GIS: STRUCTURING GEOGRAPHIC INFORMATIONINTRODUCTION TO GIS: STRUCTURING GEOGRAPHIC INFORMATION
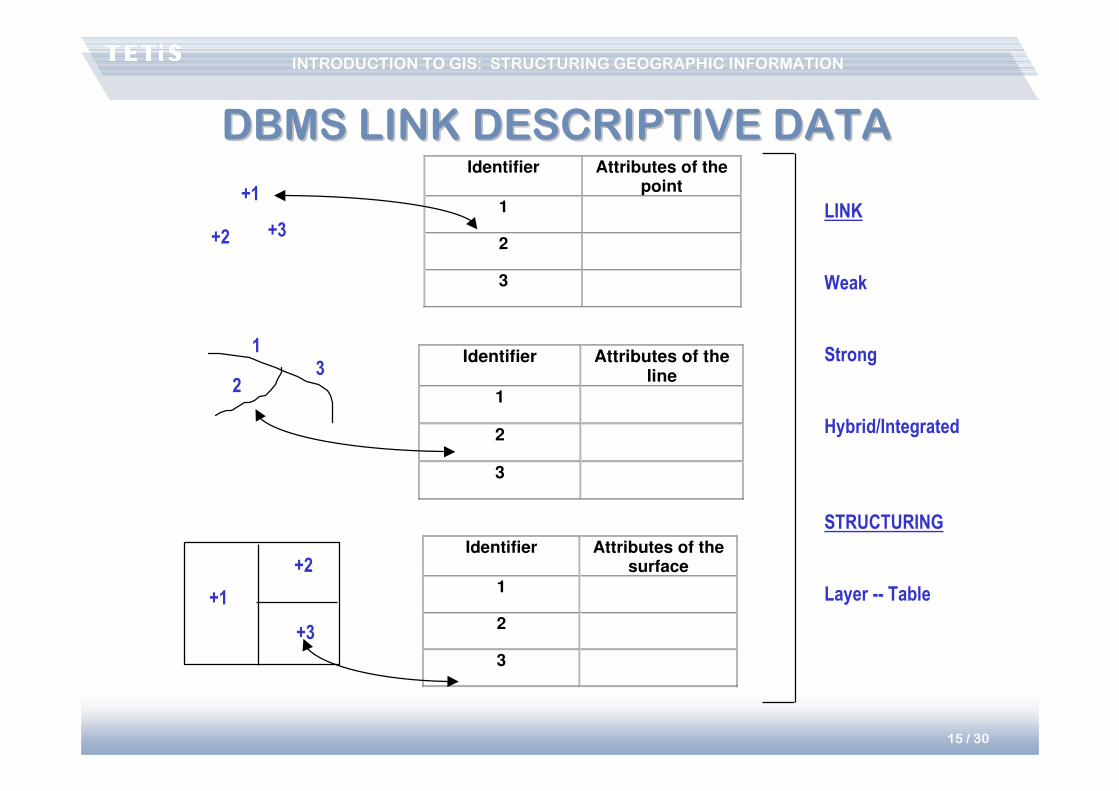
DBMS LINK DESCRIPTIVE DATADBMS LINK DESCRIPTIVE DATA
Identifier Attributes of the surface
1
2
3
+1
+3+2
Identifier Attributes of the point
1
2
3
1
23
Identifier Attributes of the line
1
2
3
+1
+2
+3
LINK
Weak
Strong
Hybrid/Integrated
STRUCTURING
Layer -- Table

16 / 30
INTRODUCTION TO GIS: STRUCTURING GEOGRAPHIC INFORMATIONINTRODUCTION TO GIS: STRUCTURING GEOGRAPHIC INFORMATION
1 1 1 1 1 1 1 1 1 1
1 1 1 1 1 1 1 1 1 1
1 1 1 1 1
2 2 2 2 2
2 2 2 2 2
2 2 2 2 2
2 2 2
3 3 3 3 3
3 3 3 3 3
3 3 3 3 3
3 3 3 3 3
3 3 3 3 33 3
extent
in Y or
rows
extent in X or columns
dx
dy
Size of the cell
(geometrical resolution)
Origin (X,Y)
N (orientation)
id attribute
1
2
3
Wheat
Grapevine
Forest
Identifier
RASTER PRESENTATIONRASTER PRESENTATION

17 / 30
INTRODUCTION TO GIS: STRUCTURING GEOGRAPHIC INFORMATIONINTRODUCTION TO GIS: STRUCTURING GEOGRAPHIC INFORMATION
RASTER REPRESENTATION: IMAGE DEPTHRASTER REPRESENTATION: IMAGE DEPTH
�Number of planes
�Depth of each planeboolean = 1 bit (21) 2 values: {0,1}byte = 8 bits (28) 256 values: {0,255}integer = 16 bits (216) 65536 values: {-32767,32765}...
Necessity of digital coding!
dz1
dz2
Thematic resolution

18 / 30
INTRODUCTION TO GIS: STRUCTURING GEOGRAPHIC INFORMATIONINTRODUCTION TO GIS: STRUCTURING GEOGRAPHIC INFORMATION
1
1 1 1
1
2
2
2
2
3
3 3 3
3
RASTER REPRESENTATION: RASTER REPRESENTATION:
LINES AND POINTSLINES AND POINTS
1
2
3
The value chosen for the empty cell is selected by convention.
19 / 30
INTRODUCTION TO GIS: STRUCTURING GEOGRAPHIC INFORMATIONINTRODUCTION TO GIS: STRUCTURING GEOGRAPHIC INFORMATION
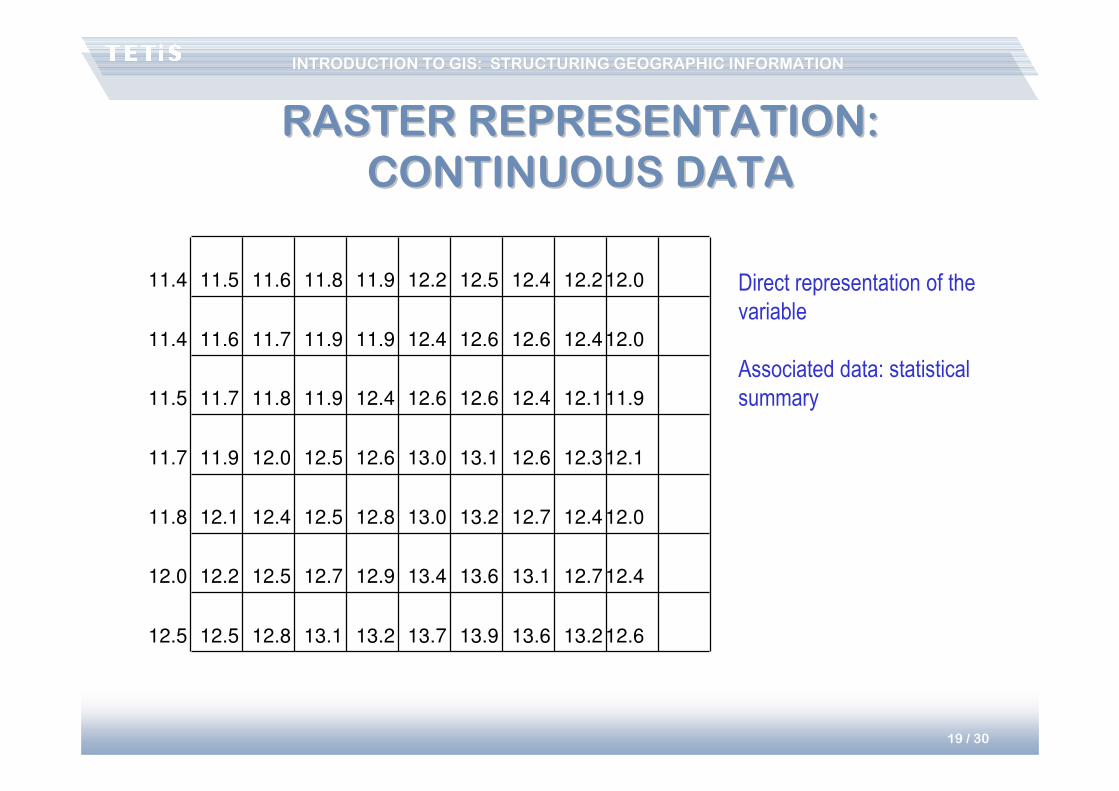
RASTER REPRESENTATION: RASTER REPRESENTATION:
CONTINUOUS DATACONTINUOUS DATA
11.4 11.5 11.6 11.8 11.9 12.2 12.5 12.4 12.212.0
11.4 11.6 11.7 11.9 11.9 12.4 12.6 12.6 12.412.0
11.5 11.7 11.8 11.9 12.4
11.7 11.9 12.0 12.5 12.6
11.8 12.1 12.4 12.5 12.8
12.0 12.2 12.5 12.7 12.9
12.5 12.5 12.8
12.6 12.6 12.4 12.111.9
13.0 13.1 12.6 12.312.1
13.0 13.2 12.7 12.412.0
13.4 13.6 13.1 12.712.4
13.7 13.9 13.6 13.212.613.1 13.2
Direct representation of the
variable
Associated data: statistical
summary

20 / 30
INTRODUCTION TO GIS: STRUCTURING GEOGRAPHIC INFORMATIONINTRODUCTION TO GIS: STRUCTURING GEOGRAPHIC INFORMATION
DBMS LINK: DESCRIPTIVE DATADBMS LINK: DESCRIPTIVE DATAIdentifier Attributes of the
point
1
2
3
Identifier Attributes of the line
1
2
3
Identifier Attributes of the surface
1
2
3
LINK
Hybrid/integrated
STRUCTURING
Layer -- Table
1 1 1 1 1 1 1 1 1 1
1 1 1 1 1 1 1 1 1 1
1 1 1 1 1
2 2 2 2 2
2 2 2 2 2
2 2 2 2 2
2 2 2
3 3 3 3 3
3 3 3 3 3
3 3 3 3 3
3 3 3 3 3
3 3 3 3 33 3
1
1 1 1
1
2
2
2
2
3
3 3 3
3
1
2
3

21 / 30
INTRODUCTION TO GIS: STRUCTURING GEOGRAPHIC INFORMATIONINTRODUCTION TO GIS: STRUCTURING GEOGRAPHIC INFORMATION
RASTER REPRESENTATION: IMAGE DATARASTER REPRESENTATION: IMAGE DATA
Map (scanned)
Orthophotography
Digital Elevation Model

22 / 30
INTRODUCTION TO GIS: STRUCTURING GEOGRAPHIC INFORMATIONINTRODUCTION TO GIS: STRUCTURING GEOGRAPHIC INFORMATION
FROM VECTOR TO RASTER: RASTERIZATION
FROM RASTER TO VECTOR: VECTORIZATION
VECTOR/RASTER CONVERSIONSVECTOR/RASTER CONVERSIONS

23 / 30
INTRODUCTION TO GIS: STRUCTURING GEOGRAPHIC INFORMATIONINTRODUCTION TO GIS: STRUCTURING GEOGRAPHIC INFORMATION
VECTOR AND RASTER: VECTOR AND RASTER:
COMPLEMENTARITYCOMPLEMENTARITY• Raster:
– Grid of ‘independent’ cells
– Matrix calculations
– Redundancy – volume of information
• Vector:– Objects +- structured
– Information with low or no redundancy (depending on the structuring)
– Link with external databases
• Complementarity raster-vector
• Improvements in hardware architectures– Processor power / disk space
– Developments in raster solutions / image processing

24 / 30
INTRODUCTION TO GIS: STRUCTURING GEOGRAPHIC INFORMATIONINTRODUCTION TO GIS: STRUCTURING GEOGRAPHIC INFORMATION
SCALE AND ACCURACY SCALE AND ACCURACY -- 11
• Definition:Constant ratio between lengths measured on the map and the
corresponding lengths measured on the land.
• Expression:– Algebraic expression = scale ratio
map at 1:25,000
– Graphical expression by a scale bar representing the ratio
Graphical expression of scale: INDISPENSABLE
• Semantic confusion
25 / 30
INTRODUCTION TO GIS: STRUCTURING GEOGRAPHIC INFORMATIONINTRODUCTION TO GIS: STRUCTURING GEOGRAPHIC INFORMATION
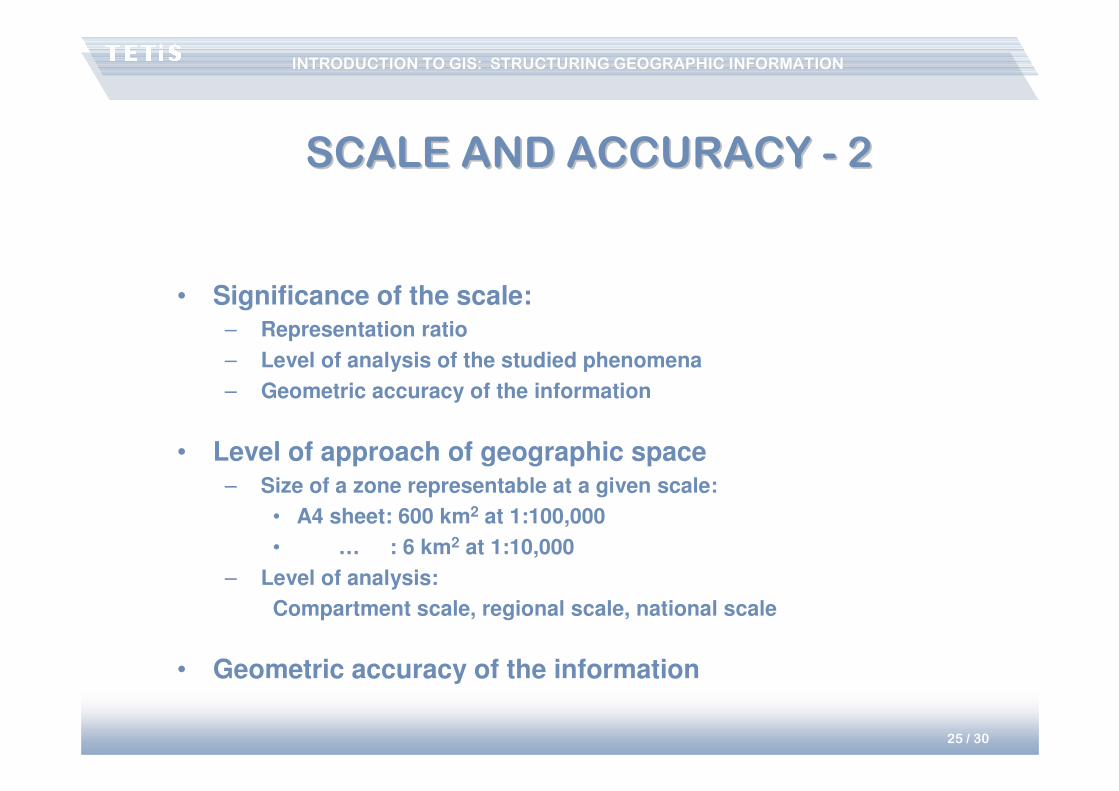
• Significance of the scale:– Representation ratio
– Level of analysis of the studied phenomena
– Geometric accuracy of the information
• Level of approach of geographic space– Size of a zone representable at a given scale:
• A4 sheet: 600 km2 at 1:100,000
• … : 6 km2 at 1:10,000
– Level of analysis:
Compartment scale, regional scale, national scale
• Geometric accuracy of the information
SCALE AND ACCURACY SCALE AND ACCURACY -- 22

26 / 30
INTRODUCTION TO GIS: STRUCTURING GEOGRAPHIC INFORMATIONINTRODUCTION TO GIS: STRUCTURING GEOGRAPHIC INFORMATION
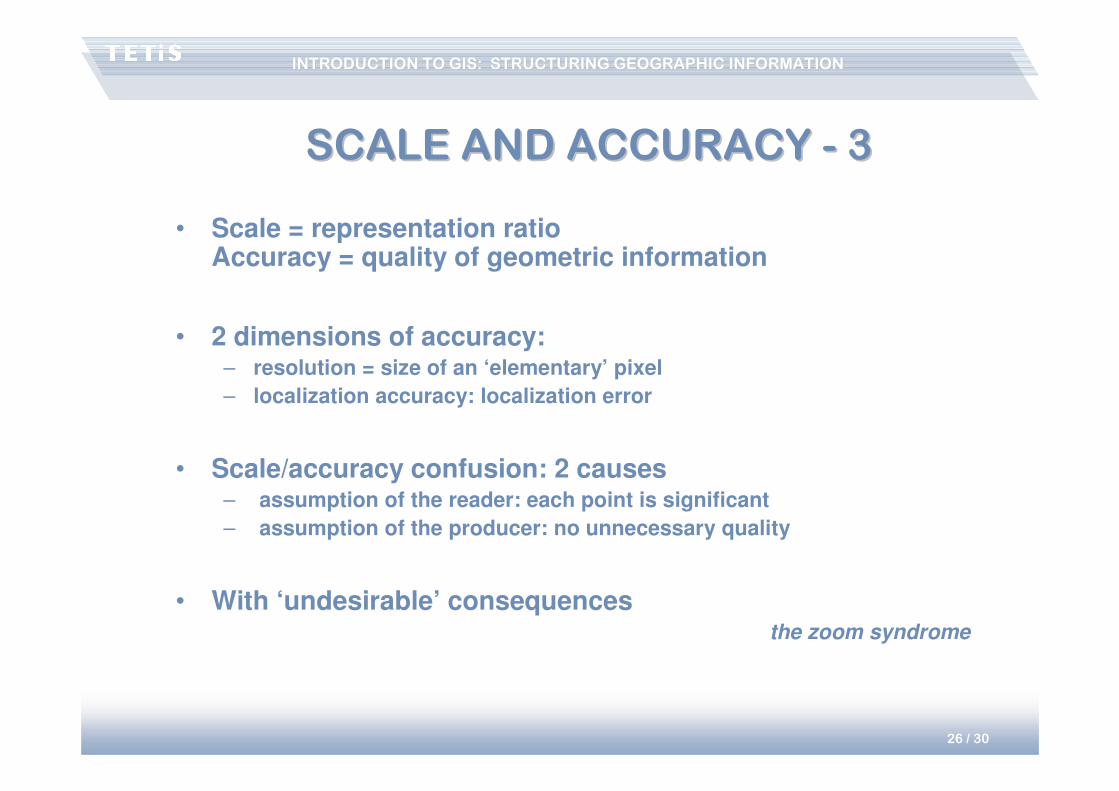
• Scale = representation ratioAccuracy = quality of geometric information
• 2 dimensions of accuracy:– resolution = size of an ‘elementary’ pixel
– localization accuracy: localization error
• Scale/accuracy confusion: 2 causes– assumption of the reader: each point is significant
– assumption of the producer: no unnecessary quality
• With ‘undesirable’ consequencesthe zoom syndrome
SCALE AND ACCURACY SCALE AND ACCURACY -- 33

27 / 30
INTRODUCTION TO GIS: STRUCTURING GEOGRAPHIC INFORMATIONINTRODUCTION TO GIS: STRUCTURING GEOGRAPHIC INFORMATION
GEOGRAPHIC DATA QUALITY GEOGRAPHIC DATA QUALITY -- 11
Hardwares
Softwares
Methods
Users
Data
• Key-element of
any GIS project
• 70 to 80 % of
total project costs
28 / 30
INTRODUCTION TO GIS: STRUCTURING GEOGRAPHIC INFORMATIONINTRODUCTION TO GIS: STRUCTURING GEOGRAPHIC INFORMATION
GEOGRAPHIC DATA QUALITY GEOGRAPHIC DATA QUALITY -- 22
• Acquiring data from:– Institutional: public agencies
– Private providers
– External contractors
– Internal digitalization
GIS software incorporate tools to create layer:
– features digitalization,
– calculation on one or many existing plans,
– Image processing

29 / 30
INTRODUCTION TO GIS: STRUCTURING GEOGRAPHIC INFORMATIONINTRODUCTION TO GIS: STRUCTURING GEOGRAPHIC INFORMATION
GEOGRAPHIC DATA QUALITY GEOGRAPHIC DATA QUALITY -- 33
• Which use ?– To use or extract information from this document
– As based map (illustration or filling)
– To take measurements
– To analyze simultaneously several information plans (spatial
analysis)
• Whatever use, consider :– Precision of imported data
– Level of detail
– Reference system used (compatibility with local database)
– Data property (copyright)
Information
to be stored
in metadata

30 / 30
INTRODUCTION TO GIS: STRUCTURING GEOGRAPHIC INFORMATIONINTRODUCTION TO GIS: STRUCTURING GEOGRAPHIC INFORMATION
METADATA, TO GUARANTEE DATA METADATA, TO GUARANTEE DATA
QUALITYQUALITY
• Metadata = "data about data"– The procedures followed to acquire the data
– The precision et methods of measurements
– The age of the data and update
– The data coding
– The geographic referencing
– The geometry
– The attributes
• Absence of metadata– False interpretation
– Bad usage
– Erroneous perception of precision
Example of metadata's appearance
ArcCatalog (ESRI)

1
Territories, Environment, Remote Sensing & Spatial Information Joint Research Unit Cemagref - CIRAD - ENGREF
Pierre BAZILE
GIS: concepts, methods & toolsGIS: concepts, methods & tools
METIER METIER GraduateGraduate Training Course no. 2 Training Course no. 2 –– Montpellier Montpellier -- FebruaryFebruary 20072007
Information Management in Information Management in EnvironmentalEnvironmental SciencesSciences
Introduction to GISIntroduction to GIS
Structuring of geographic informationStructuring of geographic information

2 / 30
INTRODUCTION TO GIS: STRUCTURING GEOGRAPHIC INFORMATIONINTRODUCTION TO GIS: STRUCTURING GEOGRAPHIC INFORMATION
INFORMATION SYSTEM AND ORGANIZATIONINFORMATION SYSTEM AND ORGANIZATION
CONTROL SYSTEM
INFORMATION SYSTEM
Problem Decision
Requests Information
Inputs
Outputs
EXTERNAL
UNIVERSE
INFORMATION
BASE
STATIC
Data, rules, and
constraints of the
external universe
DYNAMIC
INFORMATION
PROCESSOR
Actions
Personnel

3 / 30
INTRODUCTION TO GIS: STRUCTURING GEOGRAPHIC INFORMATIONINTRODUCTION TO GIS: STRUCTURING GEOGRAPHIC INFORMATION
AUTOMATIZATION OF THE INFORMATION SYSTEMAUTOMATIZATION OF THE INFORMATION SYSTEM
AUTOMATIZED INFORMATION SYSTEM
Inputs
Outputs
FORMALISABLE
UNIVERSE
INFORMATION
BASE
STATIC DYNAMIC
INFORMATION
PROCESSOR
Personnel
Data
model
Computer
Software: DBMS
(Database management system)

4 / 30
INTRODUCTION TO GIS: STRUCTURING GEOGRAPHIC INFORMATIONINTRODUCTION TO GIS: STRUCTURING GEOGRAPHIC INFORMATION
SPATIAL REFERENCE INFORMATION SYSTEMSPATIAL REFERENCE INFORMATION SYSTEM
INFORMATION SYSTEM
Inputs
Outputs
INFORMATION
BASE
STATIC DYNAMIC
INFORMATION
PROCESSOR
Personnel
Semantic
data
model
Software: GISSpatial
data
model
Software: DBMS
Computer
(Geographic infomation system)

5 / 30
INTRODUCTION TO GIS: STRUCTURING GEOGRAPHIC INFORMATIONINTRODUCTION TO GIS: STRUCTURING GEOGRAPHIC INFORMATION
GIS: WHAT EXACTLY IS IT?GIS: WHAT EXACTLY IS IT?
The term GIS represents, in fact, 3 different concepts:
• An information system about a territory or project
• The databases describing this IS
• The IT solutions used (in particular: software)
One has to return to the basic concept!
Importance of the spatial component of the IS (localization of objects and processes, spatial interactions between elements)

6 / 30
INTRODUCTION TO GIS: STRUCTURING GEOGRAPHIC INFORMATIONINTRODUCTION TO GIS: STRUCTURING GEOGRAPHIC INFORMATION
REPRESENTING GEOGRAPHICAL DATAREPRESENTING GEOGRAPHICAL DATA
Duality of Geographical Information:
• Graphical information:The geographical objects, their localization, their topological relationships
• Thematic information:The descriptors of these objects, of these localizations
‘semantic’ data
500 Metres0
N

7 / 30
INTRODUCTION TO GIS: STRUCTURING GEOGRAPHIC INFORMATIONINTRODUCTION TO GIS: STRUCTURING GEOGRAPHIC INFORMATION
REPRESENTING GRAPHIC DATAREPRESENTING GRAPHIC DATA
Semantic
database
Semantic
database
Entities
Relationship
Spatial
representation
Spatial
representation
Entities
Relationships
Point
Line
Surface
Continuous
Tables
Adjacency
Inclusion
Proximity
Path
Link

8 / 30
INTRODUCTION TO GIS: STRUCTURING GEOGRAPHIC INFORMATIONINTRODUCTION TO GIS: STRUCTURING GEOGRAPHIC INFORMATION
CODING GEOMETRY : TWO MODESCODING GEOMETRY : TWO MODES
• image vs ‘line drawings’
• raster vs vector

9 / 30
INTRODUCTION TO GIS: STRUCTURING GEOGRAPHIC INFORMATIONINTRODUCTION TO GIS: STRUCTURING GEOGRAPHIC INFORMATION
VECTOR REPRESENTATIONVECTOR REPRESENTATION
bâtiment
route
lac

10 / 30
INTRODUCTION TO GIS: STRUCTURING GEOGRAPHIC INFORMATIONINTRODUCTION TO GIS: STRUCTURING GEOGRAPHIC INFORMATION
VECTOR REPRESENTATION: VECTOR REPRESENTATION:
‘SPAGHETTI’‘SPAGHETTI’
Point: Id,x,y +
Line: Id,
x0,y0x1,y1x2,y2.--------
xn,yn
Surface: Id,
x0,y0x1,y1x2,y2--------
xn,yn(x0,y0)
1 2
1 2 3
4 5 6
P1 P2
x1,y1 x2,y2
x2,y2 x3,y3
x5,y5 x6,y6
x4,y4 x5,y5x1,y1 x2,y2
Data redundancy
Undefined relationships

11 / 30
INTRODUCTION TO GIS: STRUCTURING GEOGRAPHIC INFORMATIONINTRODUCTION TO GIS: STRUCTURING GEOGRAPHIC INFORMATION
VECTOR REPRESENTATION:VECTOR REPRESENTATION:
NETWORK TOPOLOGYNETWORK TOPOLOGY
Point: Id,x,y +
Line: Id, (L)
Nax1,y1x2,y2.--------
Nb
Node: Id,x,y
Surface: Id,
L1L2----
Ln
1 2
1 2 3
4 5 6
No redundancy
Management of connectedness
L1 L2 L3
N1
N2
L1
N1x1,y1
x4,y4
N2
L2
N1N2
L3
N1x3,y3
x6,y6
N2
P1
L1
L2
P2
L2
L3
N1
x2,y2
N2
x5,y5

12 / 30
INTRODUCTION TO GIS: STRUCTURING GEOGRAPHIC INFORMATIONINTRODUCTION TO GIS: STRUCTURING GEOGRAPHIC INFORMATION
VECTOR REPRESENTATION: VECTOR REPRESENTATION:
SURFACE TOPOLOGYSURFACE TOPOLOGY
1 2
1 2 3
4 5 6
Management of connectedness
Management of contiguity
Point: Id,x,y +
Line: Id, (L), Pg,PdNax1,y1x2,y2.--------
Nb
Node: Id,x,y
Surface: Id,
L1L2----
Ln
L1 L2 L3
N1
N2
L1
N1
N2
P1U
L2
N1
N2
P2P1
L3
N1
N2
U
P2
P1
L1
L2
P2
L2
L3
N1
x2,y2
N2
x5,y5

13 / 30
INTRODUCTION TO GIS: STRUCTURING GEOGRAPHIC INFORMATIONINTRODUCTION TO GIS: STRUCTURING GEOGRAPHIC INFORMATION
‘SPAGHETTI’ MODEL‘SPAGHETTI’ MODEL
• Entities
– point: x, y coordinates
– line: list of x,y coordinates corresponding to nodes
– sometimes polygons: set of x,y coordinates, forming a loop: the first coordinate
couple = last coordinate couple
� The spaghetti mode produces a visual effect of polygons but, most often, no polygon
entity is stored
• No spatial relationships between objects– unjoined arcs – unclosed polygons
� polygons cannot form a surface
– intersections without nodes at the crossing of two arcs
– Adjacent polygons that overlap or separated by ‘blanks’
Appearence
!
Reality

14 / 30
INTRODUCTION TO GIS: STRUCTURING GEOGRAPHIC INFORMATIONINTRODUCTION TO GIS: STRUCTURING GEOGRAPHIC INFORMATION
TOPOLOGICAL MODELTOPOLOGICAL MODEL
• Managing the connectedness and contiguity of objects
• 2 types of topology: – Planar topology
– Network topology
• Topological entities:– With permanent storage of the topology
• e.g.: ArcInfo coverage
– Taking into account only when editing (creating, updating); this data is called pseudo-topological.
• e.g.: shp (ArcView) or tab (MapInfo)
– With defined topological rules, varying depending on context
• e.g.: feature class within feature dataset in a geodatabase (ArcGIS)

15 / 30
INTRODUCTION TO GIS: STRUCTURING GEOGRAPHIC INFORMATIONINTRODUCTION TO GIS: STRUCTURING GEOGRAPHIC INFORMATION
DBMS LINK DESCRIPTIVE DATADBMS LINK DESCRIPTIVE DATA
Identifier Attributes of the surface
1
2
3
+1
+3+2
Identifier Attributes of the point
1
2
3
1
23
Identifier Attributes of the line
1
2
3
+1
+2
+3
LINK
Weak
Strong
Hybrid/Integrated
STRUCTURING
Layer -- Table

16 / 30
INTRODUCTION TO GIS: STRUCTURING GEOGRAPHIC INFORMATIONINTRODUCTION TO GIS: STRUCTURING GEOGRAPHIC INFORMATION
1 1 1 1 1 1 1 1 1 1
1 1 1 1 1 1 1 1 1 1
1 1 1 1 1
2 2 2 2 2
2 2 2 2 2
2 2 2 2 2
2 2 2
3 3 3 3 3
3 3 3 3 3
3 3 3 3 3
3 3 3 3 3
3 3 3 3 33 3
extent
in Y or
rows
extent in X or columns
dx
dy
Size of the cell
(geometrical resolution)
Origin (X,Y)
N (orientation)
id attribute
1
2
3
Wheat
Grapevine
Forest
Identifier
RASTER PRESENTATIONRASTER PRESENTATION

17 / 30
INTRODUCTION TO GIS: STRUCTURING GEOGRAPHIC INFORMATIONINTRODUCTION TO GIS: STRUCTURING GEOGRAPHIC INFORMATION
RASTER REPRESENTATION: IMAGE DEPTHRASTER REPRESENTATION: IMAGE DEPTH
�Number of planes
�Depth of each planeboolean = 1 bit (21) 2 values: {0,1}byte = 8 bits (28) 256 values: {0,255}integer = 16 bits (216) 65536 values: {-32767,32765}...
Necessity of digital coding!
dz1
dz2
Thematic resolution

18 / 30
INTRODUCTION TO GIS: STRUCTURING GEOGRAPHIC INFORMATIONINTRODUCTION TO GIS: STRUCTURING GEOGRAPHIC INFORMATION
1
1 1 1
1
2
2
2
2
3
3 3 3
3
RASTER REPRESENTATION: RASTER REPRESENTATION:
LINES AND POINTSLINES AND POINTS
1
2
3
The value chosen for the empty cell is selected by convention.

19 / 30
INTRODUCTION TO GIS: STRUCTURING GEOGRAPHIC INFORMATIONINTRODUCTION TO GIS: STRUCTURING GEOGRAPHIC INFORMATION
RASTER REPRESENTATION: RASTER REPRESENTATION:
CONTINUOUS DATACONTINUOUS DATA
11.4 11.5 11.6 11.8 11.9 12.2 12.5 12.4 12.212.0
11.4 11.6 11.7 11.9 11.9 12.4 12.6 12.6 12.412.0
11.5 11.7 11.8 11.9 12.4
11.7 11.9 12.0 12.5 12.6
11.8 12.1 12.4 12.5 12.8
12.0 12.2 12.5 12.7 12.9
12.5 12.5 12.8
12.6 12.6 12.4 12.111.9
13.0 13.1 12.6 12.312.1
13.0 13.2 12.7 12.412.0
13.4 13.6 13.1 12.712.4
13.7 13.9 13.6 13.212.613.1 13.2
Direct representation of the
variable
Associated data: statistical
summary

20 / 30
INTRODUCTION TO GIS: STRUCTURING GEOGRAPHIC INFORMATIONINTRODUCTION TO GIS: STRUCTURING GEOGRAPHIC INFORMATION
DBMS LINK: DESCRIPTIVE DATADBMS LINK: DESCRIPTIVE DATAIdentifier Attributes of the
point
1
2
3
Identifier Attributes of the line
1
2
3
Identifier Attributes of the surface
1
2
3
LINK
Hybrid/integrated
STRUCTURING
Layer -- Table
1 1 1 1 1 1 1 1 1 1
1 1 1 1 1 1 1 1 1 1
1 1 1 1 1
2 2 2 2 2
2 2 2 2 2
2 2 2 2 2
2 2 2
3 3 3 3 3
3 3 3 3 3
3 3 3 3 3
3 3 3 3 3
3 3 3 3 33 3
1
1 1 1
1
2
2
2
2
3
3 3 3
3
1
2
3

21 / 30
INTRODUCTION TO GIS: STRUCTURING GEOGRAPHIC INFORMATIONINTRODUCTION TO GIS: STRUCTURING GEOGRAPHIC INFORMATION
RASTER REPRESENTATION: IMAGE DATARASTER REPRESENTATION: IMAGE DATA
Map (scanned)
Orthophotography
Digital Elevation Model

22 / 30
INTRODUCTION TO GIS: STRUCTURING GEOGRAPHIC INFORMATIONINTRODUCTION TO GIS: STRUCTURING GEOGRAPHIC INFORMATION
FROM VECTOR TO RASTER: RASTERIZATION
FROM RASTER TO VECTOR: VECTORIZATION
VECTOR/RASTER CONVERSIONSVECTOR/RASTER CONVERSIONS

23 / 30
INTRODUCTION TO GIS: STRUCTURING GEOGRAPHIC INFORMATIONINTRODUCTION TO GIS: STRUCTURING GEOGRAPHIC INFORMATION
VECTOR AND RASTER: VECTOR AND RASTER:
COMPLEMENTARITYCOMPLEMENTARITY• Raster:
– Grid of ‘independent’ cells
– Matrix calculations
– Redundancy – volume of information
• Vector:– Objects +- structured
– Information with low or no redundancy (depending on the structuring)
– Link with external databases
• Complementarity raster-vector
• Improvements in hardware architectures– Processor power / disk space
– Developments in raster solutions / image processing

24 / 30
INTRODUCTION TO GIS: STRUCTURING GEOGRAPHIC INFORMATIONINTRODUCTION TO GIS: STRUCTURING GEOGRAPHIC INFORMATION
SCALE AND ACCURACY SCALE AND ACCURACY -- 11
• Definition:Constant ratio between lengths measured on the map and the
corresponding lengths measured on the land.
• Expression:– Algebraic expression = scale ratio
map at 1:25,000
– Graphical expression by a scale bar representing the ratio
Graphical expression of scale: INDISPENSABLE
• Semantic confusion

25 / 30
INTRODUCTION TO GIS: STRUCTURING GEOGRAPHIC INFORMATIONINTRODUCTION TO GIS: STRUCTURING GEOGRAPHIC INFORMATION
• Significance of the scale:– Representation ratio
– Level of analysis of the studied phenomena
– Geometric accuracy of the information
• Level of approach of geographic space– Size of a zone representable at a given scale:
• A4 sheet: 600 km2 at 1:100,000
• … : 6 km2 at 1:10,000
– Level of analysis:
Compartment scale, regional scale, national scale
• Geometric accuracy of the information
SCALE AND ACCURACY SCALE AND ACCURACY -- 22

26 / 30
INTRODUCTION TO GIS: STRUCTURING GEOGRAPHIC INFORMATIONINTRODUCTION TO GIS: STRUCTURING GEOGRAPHIC INFORMATION
• Scale = representation ratioAccuracy = quality of geometric information
• 2 dimensions of accuracy:– resolution = size of an ‘elementary’ pixel
– localization accuracy: localization error
• Scale/accuracy confusion: 2 causes– assumption of the reader: each point is significant
– assumption of the producer: no unnecessary quality
• With ‘undesirable’ consequencesthe zoom syndrome
SCALE AND ACCURACY SCALE AND ACCURACY -- 33

27 / 30
INTRODUCTION TO GIS: STRUCTURING GEOGRAPHIC INFORMATIONINTRODUCTION TO GIS: STRUCTURING GEOGRAPHIC INFORMATION
GEOGRAPHIC DATA QUALITY GEOGRAPHIC DATA QUALITY -- 11
Hardwares
Softwares
Methods
Users
Data
• Key-element of
any GIS project
• 70 to 80 % of
total project costs

28 / 30
INTRODUCTION TO GIS: STRUCTURING GEOGRAPHIC INFORMATIONINTRODUCTION TO GIS: STRUCTURING GEOGRAPHIC INFORMATION
GEOGRAPHIC DATA QUALITY GEOGRAPHIC DATA QUALITY -- 22
• Acquiring data from:– Institutional: public agencies
– Private providers
– External contractors
– Internal digitalization
GIS software incorporate tools to create layer:
– features digitalization,
– calculation on one or many existing plans,
– Image processing

29 / 30
INTRODUCTION TO GIS: STRUCTURING GEOGRAPHIC INFORMATIONINTRODUCTION TO GIS: STRUCTURING GEOGRAPHIC INFORMATION
GEOGRAPHIC DATA QUALITY GEOGRAPHIC DATA QUALITY -- 33
• Which use ?– To use or extract information from this document
– As based map (illustration or filling)
– To take measurements
– To analyze simultaneously several information plans (spatial
analysis)
• Whatever use, consider :– Precision of imported data
– Level of detail
– Reference system used (compatibility with local database)
– Data property (copyright)
Information
to be stored
in metadata

30 / 30
INTRODUCTION TO GIS: STRUCTURING GEOGRAPHIC INFORMATIONINTRODUCTION TO GIS: STRUCTURING GEOGRAPHIC INFORMATION
METADATA, TO GUARANTEE DATA METADATA, TO GUARANTEE DATA
QUALITYQUALITY
• Metadata = "data about data"– The procedures followed to acquire the data
– The precision et methods of measurements
– The age of the data and update
– The data coding
– The geographic referencing
– The geometry
– The attributes
• Absence of metadata– False interpretation
– Bad usage
– Erroneous perception of precision
Example of metadata's appearance
ArcCatalog (ESRI)

1
Territories, Environment, Remote Sensing & Spatial Information Joint Research Unit Cemagref - CIRAD - ENGREF
Pierre BAZILE
GIS: concepts, methods & toolsGIS: concepts, methods & tools
METIER METIER GraduateGraduate Training Course no. 2 Training Course no. 2 –– Montpellier Montpellier -- FebruaryFebruary 20072007
Information Management in Information Management in EnvironmentalEnvironmental SciencesSciences
Introduction to GISIntroduction to GIS
Structuring of geographic informationStructuring of geographic information
2 / 30
INTRODUCTION TO GIS: STRUCTURING GEOGRAPHIC INFORMATIONINTRODUCTION TO GIS: STRUCTURING GEOGRAPHIC INFORMATION
INFORMATION SYSTEM AND ORGANIZATIONINFORMATION SYSTEM AND ORGANIZATION
CONTROL SYSTEM
INFORMATION SYSTEM
Problem Decision
Requests Information
Inputs
Outputs
EXTERNAL
UNIVERSE
INFORMATION
BASE
STATIC
Data, rules, and
constraints of the
external universe
DYNAMIC
INFORMATION
PROCESSOR
Actions
Personnel

3 / 30
INTRODUCTION TO GIS: STRUCTURING GEOGRAPHIC INFORMATIONINTRODUCTION TO GIS: STRUCTURING GEOGRAPHIC INFORMATION
AUTOMATIZATION OF THE INFORMATION SYSTEMAUTOMATIZATION OF THE INFORMATION SYSTEM
AUTOMATIZED INFORMATION SYSTEM
Inputs
Outputs
FORMALISABLE
UNIVERSE
INFORMATION
BASE
STATIC DYNAMIC
INFORMATION
PROCESSOR
Personnel
Data
model
Computer
Software: DBMS
(Database management system)
4 / 30
INTRODUCTION TO GIS: STRUCTURING GEOGRAPHIC INFORMATIONINTRODUCTION TO GIS: STRUCTURING GEOGRAPHIC INFORMATION
SPATIAL REFERENCE INFORMATION SYSTEMSPATIAL REFERENCE INFORMATION SYSTEM
INFORMATION SYSTEM
Inputs
Outputs
INFORMATION
BASE
STATIC DYNAMIC
INFORMATION
PROCESSOR
Personnel
Semantic
data
model
Software: GISSpatial
data
model
Software: DBMS
Computer
(Geographic infomation system)

5 / 30
INTRODUCTION TO GIS: STRUCTURING GEOGRAPHIC INFORMATIONINTRODUCTION TO GIS: STRUCTURING GEOGRAPHIC INFORMATION
GIS: WHAT EXACTLY IS IT?GIS: WHAT EXACTLY IS IT?
The term GIS represents, in fact, 3 different concepts:
• An information system about a territory or project
• The databases describing this IS
• The IT solutions used (in particular: software)
One has to return to the basic concept!
Importance of the spatial component of the IS (localization of objects and processes, spatial interactions between elements)

6 / 30
INTRODUCTION TO GIS: STRUCTURING GEOGRAPHIC INFORMATIONINTRODUCTION TO GIS: STRUCTURING GEOGRAPHIC INFORMATION
REPRESENTING GEOGRAPHICAL DATAREPRESENTING GEOGRAPHICAL DATA
Duality of Geographical Information:
• Graphical information:The geographical objects, their localization, their topological relationships
• Thematic information:The descriptors of these objects, of these localizations
‘semantic’ data
500 Metres0
N

7 / 30
INTRODUCTION TO GIS: STRUCTURING GEOGRAPHIC INFORMATIONINTRODUCTION TO GIS: STRUCTURING GEOGRAPHIC INFORMATION
REPRESENTING GRAPHIC DATAREPRESENTING GRAPHIC DATA
Semantic
database
Semantic
database
Entities
Relationship
Spatial
representation
Spatial
representation
Entities
Relationships
Point
Line
Surface
Continuous
Tables
Adjacency
Inclusion
Proximity
Path
Link
8 / 30
INTRODUCTION TO GIS: STRUCTURING GEOGRAPHIC INFORMATIONINTRODUCTION TO GIS: STRUCTURING GEOGRAPHIC INFORMATION
CODING GEOMETRY : TWO MODESCODING GEOMETRY : TWO MODES
• image vs ‘line drawings’
• raster vs vector

9 / 30
INTRODUCTION TO GIS: STRUCTURING GEOGRAPHIC INFORMATIONINTRODUCTION TO GIS: STRUCTURING GEOGRAPHIC INFORMATION
VECTOR REPRESENTATIONVECTOR REPRESENTATION
bâtiment
route
lac

10 / 30
INTRODUCTION TO GIS: STRUCTURING GEOGRAPHIC INFORMATIONINTRODUCTION TO GIS: STRUCTURING GEOGRAPHIC INFORMATION
VECTOR REPRESENTATION: VECTOR REPRESENTATION:
‘SPAGHETTI’‘SPAGHETTI’
Point: Id,x,y +
Line: Id,
x0,y0x1,y1x2,y2.--------
xn,yn
Surface: Id,
x0,y0x1,y1x2,y2--------
xn,yn(x0,y0)
1 2
1 2 3
4 5 6
P1 P2
x1,y1 x2,y2
x2,y2 x3,y3
x5,y5 x6,y6
x4,y4 x5,y5x1,y1 x2,y2
Data redundancy
Undefined relationships

11 / 30
INTRODUCTION TO GIS: STRUCTURING GEOGRAPHIC INFORMATIONINTRODUCTION TO GIS: STRUCTURING GEOGRAPHIC INFORMATION
VECTOR REPRESENTATION:VECTOR REPRESENTATION:
NETWORK TOPOLOGYNETWORK TOPOLOGY
Point: Id,x,y +
Line: Id, (L)
Nax1,y1x2,y2.--------
Nb
Node: Id,x,y
Surface: Id,
L1L2----
Ln
1 2
1 2 3
4 5 6
No redundancy
Management of connectedness
L1 L2 L3
N1
N2
L1
N1x1,y1
x4,y4
N2
L2
N1N2
L3
N1x3,y3
x6,y6
N2
P1
L1
L2
P2
L2
L3
N1
x2,y2
N2
x5,y5

12 / 30
INTRODUCTION TO GIS: STRUCTURING GEOGRAPHIC INFORMATIONINTRODUCTION TO GIS: STRUCTURING GEOGRAPHIC INFORMATION
VECTOR REPRESENTATION: VECTOR REPRESENTATION:
SURFACE TOPOLOGYSURFACE TOPOLOGY
1 2
1 2 3
4 5 6
Management of connectedness
Management of contiguity
Point: Id,x,y +
Line: Id, (L), Pg,PdNax1,y1x2,y2.--------
Nb
Node: Id,x,y
Surface: Id,
L1L2----
Ln
L1 L2 L3
N1
N2
L1
N1
N2
P1U
L2
N1
N2
P2P1
L3
N1
N2
U
P2
P1
L1
L2
P2
L2
L3
N1
x2,y2
N2
x5,y5

13 / 30
INTRODUCTION TO GIS: STRUCTURING GEOGRAPHIC INFORMATIONINTRODUCTION TO GIS: STRUCTURING GEOGRAPHIC INFORMATION
‘SPAGHETTI’ MODEL‘SPAGHETTI’ MODEL
• Entities
– point: x, y coordinates
– line: list of x,y coordinates corresponding to nodes
– sometimes polygons: set of x,y coordinates, forming a loop: the first coordinate
couple = last coordinate couple
� The spaghetti mode produces a visual effect of polygons but, most often, no polygon
entity is stored
• No spatial relationships between objects– unjoined arcs – unclosed polygons
� polygons cannot form a surface
– intersections without nodes at the crossing of two arcs
– Adjacent polygons that overlap or separated by ‘blanks’
Appearence
!
Reality

14 / 30
INTRODUCTION TO GIS: STRUCTURING GEOGRAPHIC INFORMATIONINTRODUCTION TO GIS: STRUCTURING GEOGRAPHIC INFORMATION
TOPOLOGICAL MODELTOPOLOGICAL MODEL
• Managing the connectedness and contiguity of objects
• 2 types of topology: – Planar topology
– Network topology
• Topological entities:– With permanent storage of the topology
• e.g.: ArcInfo coverage
– Taking into account only when editing (creating, updating); this data is called pseudo-topological.
• e.g.: shp (ArcView) or tab (MapInfo)
– With defined topological rules, varying depending on context
• e.g.: feature class within feature dataset in a geodatabase (ArcGIS)

15 / 30
INTRODUCTION TO GIS: STRUCTURING GEOGRAPHIC INFORMATIONINTRODUCTION TO GIS: STRUCTURING GEOGRAPHIC INFORMATION
DBMS LINK DESCRIPTIVE DATADBMS LINK DESCRIPTIVE DATA
Identifier Attributes of the surface
1
2
3
+1
+3+2
Identifier Attributes of the point
1
2
3
1
23
Identifier Attributes of the line
1
2
3
+1
+2
+3
LINK
Weak
Strong
Hybrid/Integrated
STRUCTURING
Layer -- Table

16 / 30
INTRODUCTION TO GIS: STRUCTURING GEOGRAPHIC INFORMATIONINTRODUCTION TO GIS: STRUCTURING GEOGRAPHIC INFORMATION
1 1 1 1 1 1 1 1 1 1
1 1 1 1 1 1 1 1 1 1
1 1 1 1 1
2 2 2 2 2
2 2 2 2 2
2 2 2 2 2
2 2 2
3 3 3 3 3
3 3 3 3 3
3 3 3 3 3
3 3 3 3 3
3 3 3 3 33 3
extent
in Y or
rows
extent in X or columns
dx
dy
Size of the cell
(geometrical resolution)
Origin (X,Y)
N (orientation)
id attribute
1
2
3
Wheat
Grapevine
Forest
Identifier
RASTER PRESENTATIONRASTER PRESENTATION

17 / 30
INTRODUCTION TO GIS: STRUCTURING GEOGRAPHIC INFORMATIONINTRODUCTION TO GIS: STRUCTURING GEOGRAPHIC INFORMATION
RASTER REPRESENTATION: IMAGE DEPTHRASTER REPRESENTATION: IMAGE DEPTH
�Number of planes
�Depth of each planeboolean = 1 bit (21) 2 values: {0,1}byte = 8 bits (28) 256 values: {0,255}integer = 16 bits (216) 65536 values: {-32767,32765}...
Necessity of digital coding!
dz1
dz2
Thematic resolution

18 / 30
INTRODUCTION TO GIS: STRUCTURING GEOGRAPHIC INFORMATIONINTRODUCTION TO GIS: STRUCTURING GEOGRAPHIC INFORMATION
1
1 1 1
1
2
2
2
2
3
3 3 3
3
RASTER REPRESENTATION: RASTER REPRESENTATION:
LINES AND POINTSLINES AND POINTS
1
2
3
The value chosen for the empty cell is selected by convention.

19 / 30
INTRODUCTION TO GIS: STRUCTURING GEOGRAPHIC INFORMATIONINTRODUCTION TO GIS: STRUCTURING GEOGRAPHIC INFORMATION
RASTER REPRESENTATION: RASTER REPRESENTATION:
CONTINUOUS DATACONTINUOUS DATA
11.4 11.5 11.6 11.8 11.9 12.2 12.5 12.4 12.212.0
11.4 11.6 11.7 11.9 11.9 12.4 12.6 12.6 12.412.0
11.5 11.7 11.8 11.9 12.4
11.7 11.9 12.0 12.5 12.6
11.8 12.1 12.4 12.5 12.8
12.0 12.2 12.5 12.7 12.9
12.5 12.5 12.8
12.6 12.6 12.4 12.111.9
13.0 13.1 12.6 12.312.1
13.0 13.2 12.7 12.412.0
13.4 13.6 13.1 12.712.4
13.7 13.9 13.6 13.212.613.1 13.2
Direct representation of the
variable
Associated data: statistical
summary

20 / 30
INTRODUCTION TO GIS: STRUCTURING GEOGRAPHIC INFORMATIONINTRODUCTION TO GIS: STRUCTURING GEOGRAPHIC INFORMATION
DBMS LINK: DESCRIPTIVE DATADBMS LINK: DESCRIPTIVE DATAIdentifier Attributes of the
point
1
2
3
Identifier Attributes of the line
1
2
3
Identifier Attributes of the surface
1
2
3
LINK
Hybrid/integrated
STRUCTURING
Layer -- Table
1 1 1 1 1 1 1 1 1 1
1 1 1 1 1 1 1 1 1 1
1 1 1 1 1
2 2 2 2 2
2 2 2 2 2
2 2 2 2 2
2 2 2
3 3 3 3 3
3 3 3 3 3
3 3 3 3 3
3 3 3 3 3
3 3 3 3 33 3
1
1 1 1
1
2
2
2
2
3
3 3 3
3
1
2
3

21 / 30
INTRODUCTION TO GIS: STRUCTURING GEOGRAPHIC INFORMATIONINTRODUCTION TO GIS: STRUCTURING GEOGRAPHIC INFORMATION
RASTER REPRESENTATION: IMAGE DATARASTER REPRESENTATION: IMAGE DATA
Map (scanned)
Orthophotography
Digital Elevation Model

22 / 30
INTRODUCTION TO GIS: STRUCTURING GEOGRAPHIC INFORMATIONINTRODUCTION TO GIS: STRUCTURING GEOGRAPHIC INFORMATION
FROM VECTOR TO RASTER: RASTERIZATION
FROM RASTER TO VECTOR: VECTORIZATION
VECTOR/RASTER CONVERSIONSVECTOR/RASTER CONVERSIONS

23 / 30
INTRODUCTION TO GIS: STRUCTURING GEOGRAPHIC INFORMATIONINTRODUCTION TO GIS: STRUCTURING GEOGRAPHIC INFORMATION
VECTOR AND RASTER: VECTOR AND RASTER:
COMPLEMENTARITYCOMPLEMENTARITY• Raster:
– Grid of ‘independent’ cells
– Matrix calculations
– Redundancy – volume of information
• Vector:– Objects +- structured
– Information with low or no redundancy (depending on the structuring)
– Link with external databases
• Complementarity raster-vector
• Improvements in hardware architectures– Processor power / disk space
– Developments in raster solutions / image processing
24 / 30
INTRODUCTION TO GIS: STRUCTURING GEOGRAPHIC INFORMATIONINTRODUCTION TO GIS: STRUCTURING GEOGRAPHIC INFORMATION
SCALE AND ACCURACY SCALE AND ACCURACY -- 11
• Definition:Constant ratio between lengths measured on the map and the
corresponding lengths measured on the land.
• Expression:– Algebraic expression = scale ratio
map at 1:25,000
– Graphical expression by a scale bar representing the ratio
Graphical expression of scale: INDISPENSABLE
• Semantic confusion

25 / 30
INTRODUCTION TO GIS: STRUCTURING GEOGRAPHIC INFORMATIONINTRODUCTION TO GIS: STRUCTURING GEOGRAPHIC INFORMATION
• Significance of the scale:– Representation ratio
– Level of analysis of the studied phenomena
– Geometric accuracy of the information
• Level of approach of geographic space– Size of a zone representable at a given scale:
• A4 sheet: 600 km2 at 1:100,000
• … : 6 km2 at 1:10,000
– Level of analysis:
Compartment scale, regional scale, national scale
• Geometric accuracy of the information
SCALE AND ACCURACY SCALE AND ACCURACY -- 22

26 / 30
INTRODUCTION TO GIS: STRUCTURING GEOGRAPHIC INFORMATIONINTRODUCTION TO GIS: STRUCTURING GEOGRAPHIC INFORMATION
• Scale = representation ratioAccuracy = quality of geometric information
• 2 dimensions of accuracy:– resolution = size of an ‘elementary’ pixel
– localization accuracy: localization error
• Scale/accuracy confusion: 2 causes– assumption of the reader: each point is significant
– assumption of the producer: no unnecessary quality
• With ‘undesirable’ consequencesthe zoom syndrome
SCALE AND ACCURACY SCALE AND ACCURACY -- 33

27 / 30
INTRODUCTION TO GIS: STRUCTURING GEOGRAPHIC INFORMATIONINTRODUCTION TO GIS: STRUCTURING GEOGRAPHIC INFORMATION
GEOGRAPHIC DATA QUALITY GEOGRAPHIC DATA QUALITY -- 11
Hardwares
Softwares
Methods
Users
Data
• Key-element of
any GIS project
• 70 to 80 % of
total project costs

28 / 30
INTRODUCTION TO GIS: STRUCTURING GEOGRAPHIC INFORMATIONINTRODUCTION TO GIS: STRUCTURING GEOGRAPHIC INFORMATION
GEOGRAPHIC DATA QUALITY GEOGRAPHIC DATA QUALITY -- 22
• Acquiring data from:– Institutional: public agencies
– Private providers
– External contractors
– Internal digitalization
GIS software incorporate tools to create layer:
– features digitalization,
– calculation on one or many existing plans,
– Image processing

29 / 30
INTRODUCTION TO GIS: STRUCTURING GEOGRAPHIC INFORMATIONINTRODUCTION TO GIS: STRUCTURING GEOGRAPHIC INFORMATION
GEOGRAPHIC DATA QUALITY GEOGRAPHIC DATA QUALITY -- 33
• Which use ?– To use or extract information from this document
– As based map (illustration or filling)
– To take measurements
– To analyze simultaneously several information plans (spatial
analysis)
• Whatever use, consider :– Precision of imported data
– Level of detail
– Reference system used (compatibility with local database)
– Data property (copyright)
Information
to be stored
in metadata

30 / 30
INTRODUCTION TO GIS: STRUCTURING GEOGRAPHIC INFORMATIONINTRODUCTION TO GIS: STRUCTURING GEOGRAPHIC INFORMATION
METADATA, TO GUARANTEE DATA METADATA, TO GUARANTEE DATA
QUALITYQUALITY
• Metadata = "data about data"– The procedures followed to acquire the data
– The precision et methods of measurements
– The age of the data and update
– The data coding
– The geographic referencing
– The geometry
– The attributes
• Absence of metadata– False interpretation
– Bad usage
– Erroneous perception of precision
Example of metadata's appearance
ArcCatalog (ESRI)

1
Territories, Environment, Remote Sensing & Spatial Information Joint Research Unit Cemagref - CIRAD - ENGREF
Pierre BAZILE
GIS: concepts, methods & toolsGIS: concepts, methods & tools
METIER METIER GraduateGraduate Training Course no. 2 Training Course no. 2 –– Montpellier Montpellier -- FebruaryFebruary 20072007
Information Management in Information Management in EnvironmentalEnvironmental SciencesSciences
Introduction to GISIntroduction to GIS
Structuring of geographic informationStructuring of geographic information

2 / 30
INTRODUCTION TO GIS: STRUCTURING GEOGRAPHIC INFORMATIONINTRODUCTION TO GIS: STRUCTURING GEOGRAPHIC INFORMATION
INFORMATION SYSTEM AND ORGANIZATIONINFORMATION SYSTEM AND ORGANIZATION
CONTROL SYSTEM
INFORMATION SYSTEM
Problem Decision
Requests Information
Inputs
Outputs
EXTERNAL
UNIVERSE
INFORMATION
BASE
STATIC
Data, rules, and
constraints of the
external universe
DYNAMIC
INFORMATION
PROCESSOR
Actions
Personnel

3 / 30
INTRODUCTION TO GIS: STRUCTURING GEOGRAPHIC INFORMATIONINTRODUCTION TO GIS: STRUCTURING GEOGRAPHIC INFORMATION
AUTOMATIZATION OF THE INFORMATION SYSTEMAUTOMATIZATION OF THE INFORMATION SYSTEM
AUTOMATIZED INFORMATION SYSTEM
Inputs
Outputs
FORMALISABLE
UNIVERSE
INFORMATION
BASE
STATIC DYNAMIC
INFORMATION
PROCESSOR
Personnel
Data
model
Computer
Software: DBMS
(Database management system)

4 / 30
INTRODUCTION TO GIS: STRUCTURING GEOGRAPHIC INFORMATIONINTRODUCTION TO GIS: STRUCTURING GEOGRAPHIC INFORMATION
SPATIAL REFERENCE INFORMATION SYSTEMSPATIAL REFERENCE INFORMATION SYSTEM
INFORMATION SYSTEM
Inputs
Outputs
INFORMATION
BASE
STATIC DYNAMIC
INFORMATION
PROCESSOR
Personnel
Semantic
data
model
Software: GISSpatial
data
model
Software: DBMS
Computer
(Geographic infomation system)

5 / 30
INTRODUCTION TO GIS: STRUCTURING GEOGRAPHIC INFORMATIONINTRODUCTION TO GIS: STRUCTURING GEOGRAPHIC INFORMATION
GIS: WHAT EXACTLY IS IT?GIS: WHAT EXACTLY IS IT?
The term GIS represents, in fact, 3 different concepts:
• An information system about a territory or project
• The databases describing this IS
• The IT solutions used (in particular: software)
One has to return to the basic concept!
Importance of the spatial component of the IS (localization of objects and processes, spatial interactions between elements)

6 / 30
INTRODUCTION TO GIS: STRUCTURING GEOGRAPHIC INFORMATIONINTRODUCTION TO GIS: STRUCTURING GEOGRAPHIC INFORMATION
REPRESENTING GEOGRAPHICAL DATAREPRESENTING GEOGRAPHICAL DATA
Duality of Geographical Information:
• Graphical information:The geographical objects, their localization, their topological relationships
• Thematic information:The descriptors of these objects, of these localizations
‘semantic’ data
500 Metres0
N

7 / 30
INTRODUCTION TO GIS: STRUCTURING GEOGRAPHIC INFORMATIONINTRODUCTION TO GIS: STRUCTURING GEOGRAPHIC INFORMATION
REPRESENTING GRAPHIC DATAREPRESENTING GRAPHIC DATA
Semantic
database
Semantic
database
Entities
Relationship
Spatial
representation
Spatial
representation
Entities
Relationships
Point
Line
Surface
Continuous
Tables
Adjacency
Inclusion
Proximity
Path
Link

8 / 30
INTRODUCTION TO GIS: STRUCTURING GEOGRAPHIC INFORMATIONINTRODUCTION TO GIS: STRUCTURING GEOGRAPHIC INFORMATION
CODING GEOMETRY : TWO MODESCODING GEOMETRY : TWO MODES
• image vs ‘line drawings’
• raster vs vector

9 / 30
INTRODUCTION TO GIS: STRUCTURING GEOGRAPHIC INFORMATIONINTRODUCTION TO GIS: STRUCTURING GEOGRAPHIC INFORMATION
VECTOR REPRESENTATIONVECTOR REPRESENTATION
bâtiment
route
lac

10 / 30
INTRODUCTION TO GIS: STRUCTURING GEOGRAPHIC INFORMATIONINTRODUCTION TO GIS: STRUCTURING GEOGRAPHIC INFORMATION
VECTOR REPRESENTATION: VECTOR REPRESENTATION:
‘SPAGHETTI’‘SPAGHETTI’
Point: Id,x,y +
Line: Id,
x0,y0x1,y1x2,y2.--------
xn,yn
Surface: Id,
x0,y0x1,y1x2,y2--------
xn,yn(x0,y0)
1 2
1 2 3
4 5 6
P1 P2
x1,y1 x2,y2
x2,y2 x3,y3
x5,y5 x6,y6
x4,y4 x5,y5x1,y1 x2,y2
Data redundancy
Undefined relationships

11 / 30
INTRODUCTION TO GIS: STRUCTURING GEOGRAPHIC INFORMATIONINTRODUCTION TO GIS: STRUCTURING GEOGRAPHIC INFORMATION
VECTOR REPRESENTATION:VECTOR REPRESENTATION:
NETWORK TOPOLOGYNETWORK TOPOLOGY
Point: Id,x,y +
Line: Id, (L)
Nax1,y1x2,y2.--------
Nb
Node: Id,x,y
Surface: Id,
L1L2----
Ln
1 2
1 2 3
4 5 6
No redundancy
Management of connectedness
L1 L2 L3
N1
N2
L1
N1x1,y1
x4,y4
N2
L2
N1N2
L3
N1x3,y3
x6,y6
N2
P1
L1
L2
P2
L2
L3
N1
x2,y2
N2
x5,y5

12 / 30
INTRODUCTION TO GIS: STRUCTURING GEOGRAPHIC INFORMATIONINTRODUCTION TO GIS: STRUCTURING GEOGRAPHIC INFORMATION
VECTOR REPRESENTATION: VECTOR REPRESENTATION:
SURFACE TOPOLOGYSURFACE TOPOLOGY
1 2
1 2 3
4 5 6
Management of connectedness
Management of contiguity
Point: Id,x,y +
Line: Id, (L), Pg,PdNax1,y1x2,y2.--------
Nb
Node: Id,x,y
Surface: Id,
L1L2----
Ln
L1 L2 L3
N1
N2
L1
N1
N2
P1U
L2
N1
N2
P2P1
L3
N1
N2
U
P2
P1
L1
L2
P2
L2
L3
N1
x2,y2
N2
x5,y5

13 / 30
INTRODUCTION TO GIS: STRUCTURING GEOGRAPHIC INFORMATIONINTRODUCTION TO GIS: STRUCTURING GEOGRAPHIC INFORMATION
‘SPAGHETTI’ MODEL‘SPAGHETTI’ MODEL
• Entities
– point: x, y coordinates
– line: list of x,y coordinates corresponding to nodes
– sometimes polygons: set of x,y coordinates, forming a loop: the first coordinate
couple = last coordinate couple
� The spaghetti mode produces a visual effect of polygons but, most often, no polygon
entity is stored
• No spatial relationships between objects– unjoined arcs – unclosed polygons
� polygons cannot form a surface
– intersections without nodes at the crossing of two arcs
– Adjacent polygons that overlap or separated by ‘blanks’
Appearence
!
Reality

14 / 30
INTRODUCTION TO GIS: STRUCTURING GEOGRAPHIC INFORMATIONINTRODUCTION TO GIS: STRUCTURING GEOGRAPHIC INFORMATION
TOPOLOGICAL MODELTOPOLOGICAL MODEL
• Managing the connectedness and contiguity of objects
• 2 types of topology: – Planar topology
– Network topology
• Topological entities:– With permanent storage of the topology
• e.g.: ArcInfo coverage
– Taking into account only when editing (creating, updating); this data is called pseudo-topological.
• e.g.: shp (ArcView) or tab (MapInfo)
– With defined topological rules, varying depending on context
• e.g.: feature class within feature dataset in a geodatabase (ArcGIS)
15 / 30
INTRODUCTION TO GIS: STRUCTURING GEOGRAPHIC INFORMATIONINTRODUCTION TO GIS: STRUCTURING GEOGRAPHIC INFORMATION
DBMS LINK DESCRIPTIVE DATADBMS LINK DESCRIPTIVE DATA
Identifier Attributes of the surface
1
2
3
+1
+3+2
Identifier Attributes of the point
1
2
3
1
23
Identifier Attributes of the line
1
2
3
+1
+2
+3
LINK
Weak
Strong
Hybrid/Integrated
STRUCTURING
Layer -- Table

16 / 30
INTRODUCTION TO GIS: STRUCTURING GEOGRAPHIC INFORMATIONINTRODUCTION TO GIS: STRUCTURING GEOGRAPHIC INFORMATION
1 1 1 1 1 1 1 1 1 1
1 1 1 1 1 1 1 1 1 1
1 1 1 1 1
2 2 2 2 2
2 2 2 2 2
2 2 2 2 2
2 2 2
3 3 3 3 3
3 3 3 3 3
3 3 3 3 3
3 3 3 3 3
3 3 3 3 33 3
extent
in Y or
rows
extent in X or columns
dx
dy
Size of the cell
(geometrical resolution)
Origin (X,Y)
N (orientation)
id attribute
1
2
3
Wheat
Grapevine
Forest
Identifier
RASTER PRESENTATIONRASTER PRESENTATION

17 / 30
INTRODUCTION TO GIS: STRUCTURING GEOGRAPHIC INFORMATIONINTRODUCTION TO GIS: STRUCTURING GEOGRAPHIC INFORMATION
RASTER REPRESENTATION: IMAGE DEPTHRASTER REPRESENTATION: IMAGE DEPTH
�Number of planes
�Depth of each planeboolean = 1 bit (21) 2 values: {0,1}byte = 8 bits (28) 256 values: {0,255}integer = 16 bits (216) 65536 values: {-32767,32765}...
Necessity of digital coding!
dz1
dz2
Thematic resolution

18 / 30
INTRODUCTION TO GIS: STRUCTURING GEOGRAPHIC INFORMATIONINTRODUCTION TO GIS: STRUCTURING GEOGRAPHIC INFORMATION
1
1 1 1
1
2
2
2
2
3
3 3 3
3
RASTER REPRESENTATION: RASTER REPRESENTATION:
LINES AND POINTSLINES AND POINTS
1
2
3
The value chosen for the empty cell is selected by convention.

19 / 30
INTRODUCTION TO GIS: STRUCTURING GEOGRAPHIC INFORMATIONINTRODUCTION TO GIS: STRUCTURING GEOGRAPHIC INFORMATION
RASTER REPRESENTATION: RASTER REPRESENTATION:
CONTINUOUS DATACONTINUOUS DATA
11.4 11.5 11.6 11.8 11.9 12.2 12.5 12.4 12.212.0
11.4 11.6 11.7 11.9 11.9 12.4 12.6 12.6 12.412.0
11.5 11.7 11.8 11.9 12.4
11.7 11.9 12.0 12.5 12.6
11.8 12.1 12.4 12.5 12.8
12.0 12.2 12.5 12.7 12.9
12.5 12.5 12.8
12.6 12.6 12.4 12.111.9
13.0 13.1 12.6 12.312.1
13.0 13.2 12.7 12.412.0
13.4 13.6 13.1 12.712.4
13.7 13.9 13.6 13.212.613.1 13.2
Direct representation of the
variable
Associated data: statistical
summary

20 / 30
INTRODUCTION TO GIS: STRUCTURING GEOGRAPHIC INFORMATIONINTRODUCTION TO GIS: STRUCTURING GEOGRAPHIC INFORMATION
DBMS LINK: DESCRIPTIVE DATADBMS LINK: DESCRIPTIVE DATAIdentifier Attributes of the
point
1
2
3
Identifier Attributes of the line
1
2
3
Identifier Attributes of the surface
1
2
3
LINK
Hybrid/integrated
STRUCTURING
Layer -- Table
1 1 1 1 1 1 1 1 1 1
1 1 1 1 1 1 1 1 1 1
1 1 1 1 1
2 2 2 2 2
2 2 2 2 2
2 2 2 2 2
2 2 2
3 3 3 3 3
3 3 3 3 3
3 3 3 3 3
3 3 3 3 3
3 3 3 3 33 3
1
1 1 1
1
2
2
2
2
3
3 3 3
3
1
2
3

21 / 30
INTRODUCTION TO GIS: STRUCTURING GEOGRAPHIC INFORMATIONINTRODUCTION TO GIS: STRUCTURING GEOGRAPHIC INFORMATION
RASTER REPRESENTATION: IMAGE DATARASTER REPRESENTATION: IMAGE DATA
Map (scanned)
Orthophotography
Digital Elevation Model

22 / 30
INTRODUCTION TO GIS: STRUCTURING GEOGRAPHIC INFORMATIONINTRODUCTION TO GIS: STRUCTURING GEOGRAPHIC INFORMATION
FROM VECTOR TO RASTER: RASTERIZATION
FROM RASTER TO VECTOR: VECTORIZATION
VECTOR/RASTER CONVERSIONSVECTOR/RASTER CONVERSIONS

23 / 30
INTRODUCTION TO GIS: STRUCTURING GEOGRAPHIC INFORMATIONINTRODUCTION TO GIS: STRUCTURING GEOGRAPHIC INFORMATION
VECTOR AND RASTER: VECTOR AND RASTER:
COMPLEMENTARITYCOMPLEMENTARITY• Raster:
– Grid of ‘independent’ cells
– Matrix calculations
– Redundancy – volume of information
• Vector:– Objects +- structured
– Information with low or no redundancy (depending on the structuring)
– Link with external databases
• Complementarity raster-vector
• Improvements in hardware architectures– Processor power / disk space
– Developments in raster solutions / image processing

24 / 30
INTRODUCTION TO GIS: STRUCTURING GEOGRAPHIC INFORMATIONINTRODUCTION TO GIS: STRUCTURING GEOGRAPHIC INFORMATION
SCALE AND ACCURACY SCALE AND ACCURACY -- 11
• Definition:Constant ratio between lengths measured on the map and the
corresponding lengths measured on the land.
• Expression:– Algebraic expression = scale ratio
map at 1:25,000
– Graphical expression by a scale bar representing the ratio
Graphical expression of scale: INDISPENSABLE
• Semantic confusion

25 / 30
INTRODUCTION TO GIS: STRUCTURING GEOGRAPHIC INFORMATIONINTRODUCTION TO GIS: STRUCTURING GEOGRAPHIC INFORMATION
• Significance of the scale:– Representation ratio
– Level of analysis of the studied phenomena
– Geometric accuracy of the information
• Level of approach of geographic space– Size of a zone representable at a given scale:
• A4 sheet: 600 km2 at 1:100,000
• … : 6 km2 at 1:10,000
– Level of analysis:
Compartment scale, regional scale, national scale
• Geometric accuracy of the information
SCALE AND ACCURACY SCALE AND ACCURACY -- 22
26 / 30
INTRODUCTION TO GIS: STRUCTURING GEOGRAPHIC INFORMATIONINTRODUCTION TO GIS: STRUCTURING GEOGRAPHIC INFORMATION
• Scale = representation ratioAccuracy = quality of geometric information
• 2 dimensions of accuracy:– resolution = size of an ‘elementary’ pixel
– localization accuracy: localization error
• Scale/accuracy confusion: 2 causes– assumption of the reader: each point is significant
– assumption of the producer: no unnecessary quality
• With ‘undesirable’ consequencesthe zoom syndrome
SCALE AND ACCURACY SCALE AND ACCURACY -- 33

27 / 30
INTRODUCTION TO GIS: STRUCTURING GEOGRAPHIC INFORMATIONINTRODUCTION TO GIS: STRUCTURING GEOGRAPHIC INFORMATION
GEOGRAPHIC DATA QUALITY GEOGRAPHIC DATA QUALITY -- 11
Hardwares
Softwares
Methods
Users
Data
• Key-element of
any GIS project
• 70 to 80 % of
total project costs

28 / 30
INTRODUCTION TO GIS: STRUCTURING GEOGRAPHIC INFORMATIONINTRODUCTION TO GIS: STRUCTURING GEOGRAPHIC INFORMATION
GEOGRAPHIC DATA QUALITY GEOGRAPHIC DATA QUALITY -- 22
• Acquiring data from:– Institutional: public agencies
– Private providers
– External contractors
– Internal digitalization
GIS software incorporate tools to create layer:
– features digitalization,
– calculation on one or many existing plans,
– Image processing

29 / 30
INTRODUCTION TO GIS: STRUCTURING GEOGRAPHIC INFORMATIONINTRODUCTION TO GIS: STRUCTURING GEOGRAPHIC INFORMATION
GEOGRAPHIC DATA QUALITY GEOGRAPHIC DATA QUALITY -- 33
• Which use ?– To use or extract information from this document
– As based map (illustration or filling)
– To take measurements
– To analyze simultaneously several information plans (spatial
analysis)
• Whatever use, consider :– Precision of imported data
– Level of detail
– Reference system used (compatibility with local database)
– Data property (copyright)
Information
to be stored
in metadata

30 / 30
INTRODUCTION TO GIS: STRUCTURING GEOGRAPHIC INFORMATIONINTRODUCTION TO GIS: STRUCTURING GEOGRAPHIC INFORMATION
METADATA, TO GUARANTEE DATA METADATA, TO GUARANTEE DATA
QUALITYQUALITY
• Metadata = "data about data"– The procedures followed to acquire the data
– The precision et methods of measurements
– The age of the data and update
– The data coding
– The geographic referencing
– The geometry
– The attributes
• Absence of metadata– False interpretation
– Bad usage
– Erroneous perception of precision
Example of metadata's appearance
ArcCatalog (ESRI)
1
Territories, Environment, Remote Sensing & Spatial Information Joint Research Unit Cemagref - CIRAD - ENGREF
Pierre BAZILE
GIS: concepts, methods & toolsGIS: concepts, methods & tools
METIER METIER GraduateGraduate Training Course no. 2 Training Course no. 2 –– Montpellier Montpellier -- FebruaryFebruary 20072007
Information Management in Information Management in EnvironmentalEnvironmental SciencesSciences
Introduction to GISIntroduction to GIS
Structuring of geographic informationStructuring of geographic information

2 / 30
INTRODUCTION TO GIS: STRUCTURING GEOGRAPHIC INFORMATIONINTRODUCTION TO GIS: STRUCTURING GEOGRAPHIC INFORMATION
INFORMATION SYSTEM AND ORGANIZATIONINFORMATION SYSTEM AND ORGANIZATION
CONTROL SYSTEM
INFORMATION SYSTEM
Problem Decision
Requests Information
Inputs
Outputs
EXTERNAL
UNIVERSE
INFORMATION
BASE
STATIC
Data, rules, and
constraints of the
external universe
DYNAMIC
INFORMATION
PROCESSOR
Actions
Personnel

3 / 30
INTRODUCTION TO GIS: STRUCTURING GEOGRAPHIC INFORMATIONINTRODUCTION TO GIS: STRUCTURING GEOGRAPHIC INFORMATION
AUTOMATIZATION OF THE INFORMATION SYSTEMAUTOMATIZATION OF THE INFORMATION SYSTEM
AUTOMATIZED INFORMATION SYSTEM
Inputs
Outputs
FORMALISABLE
UNIVERSE
INFORMATION
BASE
STATIC DYNAMIC
INFORMATION
PROCESSOR
Personnel
Data
model
Computer
Software: DBMS
(Database management system)

4 / 30
INTRODUCTION TO GIS: STRUCTURING GEOGRAPHIC INFORMATIONINTRODUCTION TO GIS: STRUCTURING GEOGRAPHIC INFORMATION
SPATIAL REFERENCE INFORMATION SYSTEMSPATIAL REFERENCE INFORMATION SYSTEM
INFORMATION SYSTEM
Inputs
Outputs
INFORMATION
BASE
STATIC DYNAMIC
INFORMATION
PROCESSOR
Personnel
Semantic
data
model
Software: GISSpatial
data
model
Software: DBMS
Computer
(Geographic infomation system)

5 / 30
INTRODUCTION TO GIS: STRUCTURING GEOGRAPHIC INFORMATIONINTRODUCTION TO GIS: STRUCTURING GEOGRAPHIC INFORMATION
GIS: WHAT EXACTLY IS IT?GIS: WHAT EXACTLY IS IT?
The term GIS represents, in fact, 3 different concepts:
• An information system about a territory or project
• The databases describing this IS
• The IT solutions used (in particular: software)
One has to return to the basic concept!
Importance of the spatial component of the IS (localization of objects and processes, spatial interactions between elements)

6 / 30
INTRODUCTION TO GIS: STRUCTURING GEOGRAPHIC INFORMATIONINTRODUCTION TO GIS: STRUCTURING GEOGRAPHIC INFORMATION
REPRESENTING GEOGRAPHICAL DATAREPRESENTING GEOGRAPHICAL DATA
Duality of Geographical Information:
• Graphical information:The geographical objects, their localization, their topological relationships
• Thematic information:The descriptors of these objects, of these localizations
‘semantic’ data
500 Metres0
N

7 / 30
INTRODUCTION TO GIS: STRUCTURING GEOGRAPHIC INFORMATIONINTRODUCTION TO GIS: STRUCTURING GEOGRAPHIC INFORMATION
REPRESENTING GRAPHIC DATAREPRESENTING GRAPHIC DATA
Semantic
database
Semantic
database
Entities
Relationship
Spatial
representation
Spatial
representation
Entities
Relationships
Point
Line
Surface
Continuous
Tables
Adjacency
Inclusion
Proximity
Path
Link

8 / 30
INTRODUCTION TO GIS: STRUCTURING GEOGRAPHIC INFORMATIONINTRODUCTION TO GIS: STRUCTURING GEOGRAPHIC INFORMATION
CODING GEOMETRY : TWO MODESCODING GEOMETRY : TWO MODES
• image vs ‘line drawings’
• raster vs vector

9 / 30
INTRODUCTION TO GIS: STRUCTURING GEOGRAPHIC INFORMATIONINTRODUCTION TO GIS: STRUCTURING GEOGRAPHIC INFORMATION
VECTOR REPRESENTATIONVECTOR REPRESENTATION
bâtiment
route
lac

10 / 30
INTRODUCTION TO GIS: STRUCTURING GEOGRAPHIC INFORMATIONINTRODUCTION TO GIS: STRUCTURING GEOGRAPHIC INFORMATION
VECTOR REPRESENTATION: VECTOR REPRESENTATION:
‘SPAGHETTI’‘SPAGHETTI’
Point: Id,x,y +
Line: Id,
x0,y0x1,y1x2,y2.--------
xn,yn
Surface: Id,
x0,y0x1,y1x2,y2--------
xn,yn(x0,y0)
1 2
1 2 3
4 5 6
P1 P2
x1,y1 x2,y2
x2,y2 x3,y3
x5,y5 x6,y6
x4,y4 x5,y5x1,y1 x2,y2
Data redundancy
Undefined relationships

11 / 30
INTRODUCTION TO GIS: STRUCTURING GEOGRAPHIC INFORMATIONINTRODUCTION TO GIS: STRUCTURING GEOGRAPHIC INFORMATION
VECTOR REPRESENTATION:VECTOR REPRESENTATION:
NETWORK TOPOLOGYNETWORK TOPOLOGY
Point: Id,x,y +
Line: Id, (L)
Nax1,y1x2,y2.--------
Nb
Node: Id,x,y
Surface: Id,
L1L2----
Ln
1 2
1 2 3
4 5 6
No redundancy
Management of connectedness
L1 L2 L3
N1
N2
L1
N1x1,y1
x4,y4
N2
L2
N1N2
L3
N1x3,y3
x6,y6
N2
P1
L1
L2
P2
L2
L3
N1
x2,y2
N2
x5,y5

12 / 30
INTRODUCTION TO GIS: STRUCTURING GEOGRAPHIC INFORMATIONINTRODUCTION TO GIS: STRUCTURING GEOGRAPHIC INFORMATION
VECTOR REPRESENTATION: VECTOR REPRESENTATION:
SURFACE TOPOLOGYSURFACE TOPOLOGY
1 2
1 2 3
4 5 6
Management of connectedness
Management of contiguity
Point: Id,x,y +
Line: Id, (L), Pg,PdNax1,y1x2,y2.--------
Nb
Node: Id,x,y
Surface: Id,
L1L2----
Ln
L1 L2 L3
N1
N2
L1
N1
N2
P1U
L2
N1
N2
P2P1
L3
N1
N2
U
P2
P1
L1
L2
P2
L2
L3
N1
x2,y2
N2
x5,y5

13 / 30
INTRODUCTION TO GIS: STRUCTURING GEOGRAPHIC INFORMATIONINTRODUCTION TO GIS: STRUCTURING GEOGRAPHIC INFORMATION
‘SPAGHETTI’ MODEL‘SPAGHETTI’ MODEL
• Entities
– point: x, y coordinates
– line: list of x,y coordinates corresponding to nodes
– sometimes polygons: set of x,y coordinates, forming a loop: the first coordinate
couple = last coordinate couple
� The spaghetti mode produces a visual effect of polygons but, most often, no polygon
entity is stored
• No spatial relationships between objects– unjoined arcs – unclosed polygons
� polygons cannot form a surface
– intersections without nodes at the crossing of two arcs
– Adjacent polygons that overlap or separated by ‘blanks’
Appearence
!
Reality

14 / 30
INTRODUCTION TO GIS: STRUCTURING GEOGRAPHIC INFORMATIONINTRODUCTION TO GIS: STRUCTURING GEOGRAPHIC INFORMATION
TOPOLOGICAL MODELTOPOLOGICAL MODEL
• Managing the connectedness and contiguity of objects
• 2 types of topology: – Planar topology
– Network topology
• Topological entities:– With permanent storage of the topology
• e.g.: ArcInfo coverage
– Taking into account only when editing (creating, updating); this data is called pseudo-topological.
• e.g.: shp (ArcView) or tab (MapInfo)
– With defined topological rules, varying depending on context
• e.g.: feature class within feature dataset in a geodatabase (ArcGIS)

15 / 30
INTRODUCTION TO GIS: STRUCTURING GEOGRAPHIC INFORMATIONINTRODUCTION TO GIS: STRUCTURING GEOGRAPHIC INFORMATION
DBMS LINK DESCRIPTIVE DATADBMS LINK DESCRIPTIVE DATA
Identifier Attributes of the surface
1
2
3
+1
+3+2
Identifier Attributes of the point
1
2
3
1
23
Identifier Attributes of the line
1
2
3
+1
+2
+3
LINK
Weak
Strong
Hybrid/Integrated
STRUCTURING
Layer -- Table

16 / 30
INTRODUCTION TO GIS: STRUCTURING GEOGRAPHIC INFORMATIONINTRODUCTION TO GIS: STRUCTURING GEOGRAPHIC INFORMATION
1 1 1 1 1 1 1 1 1 1
1 1 1 1 1 1 1 1 1 1
1 1 1 1 1
2 2 2 2 2
2 2 2 2 2
2 2 2 2 2
2 2 2
3 3 3 3 3
3 3 3 3 3
3 3 3 3 3
3 3 3 3 3
3 3 3 3 33 3
extent
in Y or
rows
extent in X or columns
dx
dy
Size of the cell
(geometrical resolution)
Origin (X,Y)
N (orientation)
id attribute
1
2
3
Wheat
Grapevine
Forest
Identifier
RASTER PRESENTATIONRASTER PRESENTATION

17 / 30
INTRODUCTION TO GIS: STRUCTURING GEOGRAPHIC INFORMATIONINTRODUCTION TO GIS: STRUCTURING GEOGRAPHIC INFORMATION
RASTER REPRESENTATION: IMAGE DEPTHRASTER REPRESENTATION: IMAGE DEPTH
�Number of planes
�Depth of each planeboolean = 1 bit (21) 2 values: {0,1}byte = 8 bits (28) 256 values: {0,255}integer = 16 bits (216) 65536 values: {-32767,32765}...
Necessity of digital coding!
dz1
dz2
Thematic resolution

18 / 30
INTRODUCTION TO GIS: STRUCTURING GEOGRAPHIC INFORMATIONINTRODUCTION TO GIS: STRUCTURING GEOGRAPHIC INFORMATION
1
1 1 1
1
2
2
2
2
3
3 3 3
3
RASTER REPRESENTATION: RASTER REPRESENTATION:
LINES AND POINTSLINES AND POINTS
1
2
3
The value chosen for the empty cell is selected by convention.

19 / 30
INTRODUCTION TO GIS: STRUCTURING GEOGRAPHIC INFORMATIONINTRODUCTION TO GIS: STRUCTURING GEOGRAPHIC INFORMATION
RASTER REPRESENTATION: RASTER REPRESENTATION:
CONTINUOUS DATACONTINUOUS DATA
11.4 11.5 11.6 11.8 11.9 12.2 12.5 12.4 12.212.0
11.4 11.6 11.7 11.9 11.9 12.4 12.6 12.6 12.412.0
11.5 11.7 11.8 11.9 12.4
11.7 11.9 12.0 12.5 12.6
11.8 12.1 12.4 12.5 12.8
12.0 12.2 12.5 12.7 12.9
12.5 12.5 12.8
12.6 12.6 12.4 12.111.9
13.0 13.1 12.6 12.312.1
13.0 13.2 12.7 12.412.0
13.4 13.6 13.1 12.712.4
13.7 13.9 13.6 13.212.613.1 13.2
Direct representation of the
variable
Associated data: statistical
summary

20 / 30
INTRODUCTION TO GIS: STRUCTURING GEOGRAPHIC INFORMATIONINTRODUCTION TO GIS: STRUCTURING GEOGRAPHIC INFORMATION
DBMS LINK: DESCRIPTIVE DATADBMS LINK: DESCRIPTIVE DATAIdentifier Attributes of the
point
1
2
3
Identifier Attributes of the line
1
2
3
Identifier Attributes of the surface
1
2
3
LINK
Hybrid/integrated
STRUCTURING
Layer -- Table
1 1 1 1 1 1 1 1 1 1
1 1 1 1 1 1 1 1 1 1
1 1 1 1 1
2 2 2 2 2
2 2 2 2 2
2 2 2 2 2
2 2 2
3 3 3 3 3
3 3 3 3 3
3 3 3 3 3
3 3 3 3 3
3 3 3 3 33 3
1
1 1 1
1
2
2
2
2
3
3 3 3
3
1
2
3

21 / 30
INTRODUCTION TO GIS: STRUCTURING GEOGRAPHIC INFORMATIONINTRODUCTION TO GIS: STRUCTURING GEOGRAPHIC INFORMATION
RASTER REPRESENTATION: IMAGE DATARASTER REPRESENTATION: IMAGE DATA
Map (scanned)
Orthophotography
Digital Elevation Model

22 / 30
INTRODUCTION TO GIS: STRUCTURING GEOGRAPHIC INFORMATIONINTRODUCTION TO GIS: STRUCTURING GEOGRAPHIC INFORMATION
FROM VECTOR TO RASTER: RASTERIZATION
FROM RASTER TO VECTOR: VECTORIZATION
VECTOR/RASTER CONVERSIONSVECTOR/RASTER CONVERSIONS

23 / 30
INTRODUCTION TO GIS: STRUCTURING GEOGRAPHIC INFORMATIONINTRODUCTION TO GIS: STRUCTURING GEOGRAPHIC INFORMATION
VECTOR AND RASTER: VECTOR AND RASTER:
COMPLEMENTARITYCOMPLEMENTARITY• Raster:
– Grid of ‘independent’ cells
– Matrix calculations
– Redundancy – volume of information
• Vector:– Objects +- structured
– Information with low or no redundancy (depending on the structuring)
– Link with external databases
• Complementarity raster-vector
• Improvements in hardware architectures– Processor power / disk space
– Developments in raster solutions / image processing

24 / 30
INTRODUCTION TO GIS: STRUCTURING GEOGRAPHIC INFORMATIONINTRODUCTION TO GIS: STRUCTURING GEOGRAPHIC INFORMATION
SCALE AND ACCURACY SCALE AND ACCURACY -- 11
• Definition:Constant ratio between lengths measured on the map and the
corresponding lengths measured on the land.
• Expression:– Algebraic expression = scale ratio
map at 1:25,000
– Graphical expression by a scale bar representing the ratio
Graphical expression of scale: INDISPENSABLE
• Semantic confusion

25 / 30
INTRODUCTION TO GIS: STRUCTURING GEOGRAPHIC INFORMATIONINTRODUCTION TO GIS: STRUCTURING GEOGRAPHIC INFORMATION
• Significance of the scale:– Representation ratio
– Level of analysis of the studied phenomena
– Geometric accuracy of the information
• Level of approach of geographic space– Size of a zone representable at a given scale:
• A4 sheet: 600 km2 at 1:100,000
• … : 6 km2 at 1:10,000
– Level of analysis:
Compartment scale, regional scale, national scale
• Geometric accuracy of the information
SCALE AND ACCURACY SCALE AND ACCURACY -- 22

26 / 30
INTRODUCTION TO GIS: STRUCTURING GEOGRAPHIC INFORMATIONINTRODUCTION TO GIS: STRUCTURING GEOGRAPHIC INFORMATION
• Scale = representation ratioAccuracy = quality of geometric information
• 2 dimensions of accuracy:– resolution = size of an ‘elementary’ pixel
– localization accuracy: localization error
• Scale/accuracy confusion: 2 causes– assumption of the reader: each point is significant
– assumption of the producer: no unnecessary quality
• With ‘undesirable’ consequencesthe zoom syndrome
SCALE AND ACCURACY SCALE AND ACCURACY -- 33

27 / 30
INTRODUCTION TO GIS: STRUCTURING GEOGRAPHIC INFORMATIONINTRODUCTION TO GIS: STRUCTURING GEOGRAPHIC INFORMATION
GEOGRAPHIC DATA QUALITY GEOGRAPHIC DATA QUALITY -- 11
Hardwares
Softwares
Methods
Users
Data
• Key-element of
any GIS project
• 70 to 80 % of
total project costs

28 / 30
INTRODUCTION TO GIS: STRUCTURING GEOGRAPHIC INFORMATIONINTRODUCTION TO GIS: STRUCTURING GEOGRAPHIC INFORMATION
GEOGRAPHIC DATA QUALITY GEOGRAPHIC DATA QUALITY -- 22
• Acquiring data from:– Institutional: public agencies
– Private providers
– External contractors
– Internal digitalization
GIS software incorporate tools to create layer:
– features digitalization,
– calculation on one or many existing plans,
– Image processing

29 / 30
INTRODUCTION TO GIS: STRUCTURING GEOGRAPHIC INFORMATIONINTRODUCTION TO GIS: STRUCTURING GEOGRAPHIC INFORMATION
GEOGRAPHIC DATA QUALITY GEOGRAPHIC DATA QUALITY -- 33
• Which use ?– To use or extract information from this document
– As based map (illustration or filling)
– To take measurements
– To analyze simultaneously several information plans (spatial
analysis)
• Whatever use, consider :– Precision of imported data
– Level of detail
– Reference system used (compatibility with local database)
– Data property (copyright)
Information
to be stored
in metadata

30 / 30
INTRODUCTION TO GIS: STRUCTURING GEOGRAPHIC INFORMATIONINTRODUCTION TO GIS: STRUCTURING GEOGRAPHIC INFORMATION
METADATA, TO GUARANTEE DATA METADATA, TO GUARANTEE DATA
QUALITYQUALITY
• Metadata = "data about data"– The procedures followed to acquire the data
– The precision et methods of measurements
– The age of the data and update
– The data coding
– The geographic referencing
– The geometry
– The attributes
• Absence of metadata– False interpretation
– Bad usage
– Erroneous perception of precision
Example of metadata's appearance
ArcCatalog (ESRI)

1
Territories, Environment, Remote Sensing & Spatial Information Joint Research Unit Cemagref - CIRAD - ENGREF
Pierre BAZILE
GIS: concepts, methods & toolsGIS: concepts, methods & tools
METIER METIER GraduateGraduate Training Course no. 2 Training Course no. 2 –– Montpellier Montpellier -- FebruaryFebruary 20072007
Information Management in Information Management in EnvironmentalEnvironmental SciencesSciences
Introduction to GISIntroduction to GIS
Structuring of geographic informationStructuring of geographic information

2 / 30
INTRODUCTION TO GIS: STRUCTURING GEOGRAPHIC INFORMATIONINTRODUCTION TO GIS: STRUCTURING GEOGRAPHIC INFORMATION
INFORMATION SYSTEM AND ORGANIZATIONINFORMATION SYSTEM AND ORGANIZATION
CONTROL SYSTEM
INFORMATION SYSTEM
Problem Decision
Requests Information
Inputs
Outputs
EXTERNAL
UNIVERSE
INFORMATION
BASE
STATIC
Data, rules, and
constraints of the
external universe
DYNAMIC
INFORMATION
PROCESSOR
Actions
Personnel

3 / 30
INTRODUCTION TO GIS: STRUCTURING GEOGRAPHIC INFORMATIONINTRODUCTION TO GIS: STRUCTURING GEOGRAPHIC INFORMATION
AUTOMATIZATION OF THE INFORMATION SYSTEMAUTOMATIZATION OF THE INFORMATION SYSTEM
AUTOMATIZED INFORMATION SYSTEM
Inputs
Outputs
FORMALISABLE
UNIVERSE
INFORMATION
BASE
STATIC DYNAMIC
INFORMATION
PROCESSOR
Personnel
Data
model
Computer
Software: DBMS
(Database management system)

4 / 30
INTRODUCTION TO GIS: STRUCTURING GEOGRAPHIC INFORMATIONINTRODUCTION TO GIS: STRUCTURING GEOGRAPHIC INFORMATION
SPATIAL REFERENCE INFORMATION SYSTEMSPATIAL REFERENCE INFORMATION SYSTEM
INFORMATION SYSTEM
Inputs
Outputs
INFORMATION
BASE
STATIC DYNAMIC
INFORMATION
PROCESSOR
Personnel
Semantic
data
model
Software: GISSpatial
data
model
Software: DBMS
Computer
(Geographic infomation system)

5 / 30
INTRODUCTION TO GIS: STRUCTURING GEOGRAPHIC INFORMATIONINTRODUCTION TO GIS: STRUCTURING GEOGRAPHIC INFORMATION
GIS: WHAT EXACTLY IS IT?GIS: WHAT EXACTLY IS IT?
The term GIS represents, in fact, 3 different concepts:
• An information system about a territory or project
• The databases describing this IS
• The IT solutions used (in particular: software)
One has to return to the basic concept!
Importance of the spatial component of the IS (localization of objects and processes, spatial interactions between elements)

6 / 30
INTRODUCTION TO GIS: STRUCTURING GEOGRAPHIC INFORMATIONINTRODUCTION TO GIS: STRUCTURING GEOGRAPHIC INFORMATION
REPRESENTING GEOGRAPHICAL DATAREPRESENTING GEOGRAPHICAL DATA
Duality of Geographical Information:
• Graphical information:The geographical objects, their localization, their topological relationships
• Thematic information:The descriptors of these objects, of these localizations
‘semantic’ data
500 Metres0
N
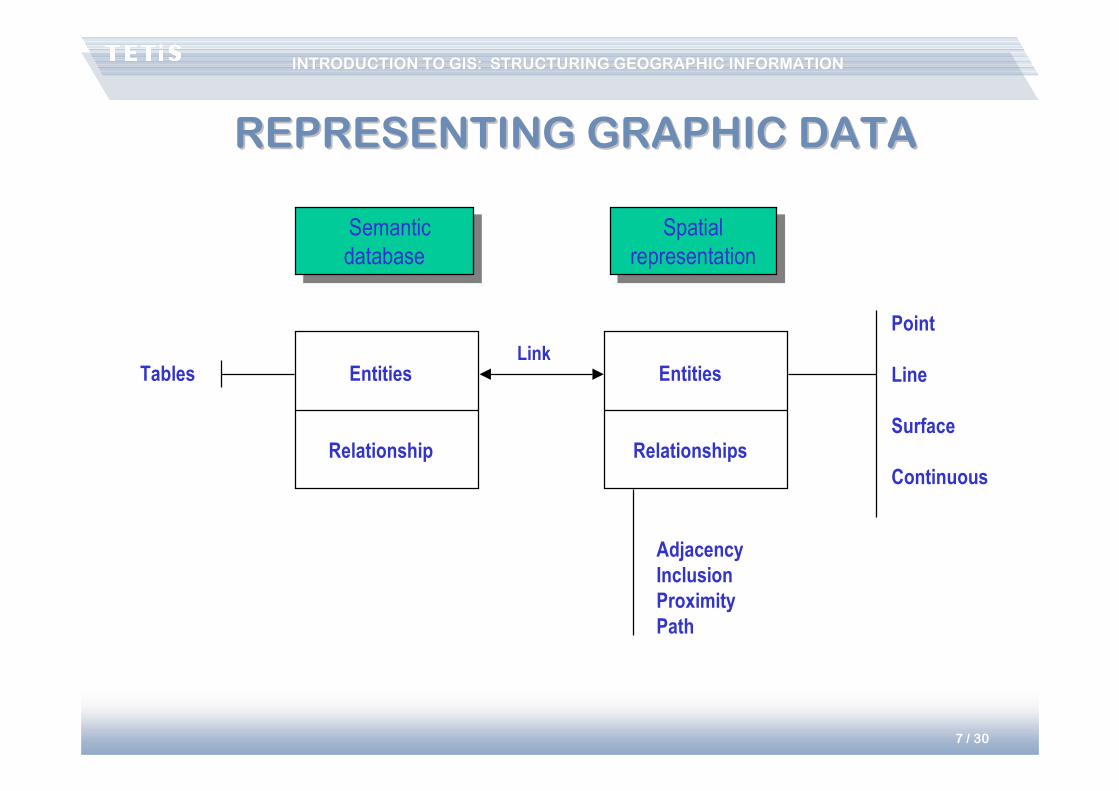
7 / 30
INTRODUCTION TO GIS: STRUCTURING GEOGRAPHIC INFORMATIONINTRODUCTION TO GIS: STRUCTURING GEOGRAPHIC INFORMATION
REPRESENTING GRAPHIC DATAREPRESENTING GRAPHIC DATA
Semantic
database
Semantic
database
Entities
Relationship
Spatial
representation
Spatial
representation
Entities
Relationships
Point
Line
Surface
Continuous
Tables
Adjacency
Inclusion
Proximity
Path
Link

8 / 30
INTRODUCTION TO GIS: STRUCTURING GEOGRAPHIC INFORMATIONINTRODUCTION TO GIS: STRUCTURING GEOGRAPHIC INFORMATION
CODING GEOMETRY : TWO MODESCODING GEOMETRY : TWO MODES
• image vs ‘line drawings’
• raster vs vector

9 / 30
INTRODUCTION TO GIS: STRUCTURING GEOGRAPHIC INFORMATIONINTRODUCTION TO GIS: STRUCTURING GEOGRAPHIC INFORMATION
VECTOR REPRESENTATIONVECTOR REPRESENTATION
bâtiment
route
lac

10 / 30
INTRODUCTION TO GIS: STRUCTURING GEOGRAPHIC INFORMATIONINTRODUCTION TO GIS: STRUCTURING GEOGRAPHIC INFORMATION
VECTOR REPRESENTATION: VECTOR REPRESENTATION:
‘SPAGHETTI’‘SPAGHETTI’
Point: Id,x,y +
Line: Id,
x0,y0x1,y1x2,y2.--------
xn,yn
Surface: Id,
x0,y0x1,y1x2,y2--------
xn,yn(x0,y0)
1 2
1 2 3
4 5 6
P1 P2
x1,y1 x2,y2
x2,y2 x3,y3
x5,y5 x6,y6
x4,y4 x5,y5x1,y1 x2,y2
Data redundancy
Undefined relationships

11 / 30
INTRODUCTION TO GIS: STRUCTURING GEOGRAPHIC INFORMATIONINTRODUCTION TO GIS: STRUCTURING GEOGRAPHIC INFORMATION
VECTOR REPRESENTATION:VECTOR REPRESENTATION:
NETWORK TOPOLOGYNETWORK TOPOLOGY
Point: Id,x,y +
Line: Id, (L)
Nax1,y1x2,y2.--------
Nb
Node: Id,x,y
Surface: Id,
L1L2----
Ln
1 2
1 2 3
4 5 6
No redundancy
Management of connectedness
L1 L2 L3
N1
N2
L1
N1x1,y1
x4,y4
N2
L2
N1N2
L3
N1x3,y3
x6,y6
N2
P1
L1
L2
P2
L2
L3
N1
x2,y2
N2
x5,y5

12 / 30
INTRODUCTION TO GIS: STRUCTURING GEOGRAPHIC INFORMATIONINTRODUCTION TO GIS: STRUCTURING GEOGRAPHIC INFORMATION
VECTOR REPRESENTATION: VECTOR REPRESENTATION:
SURFACE TOPOLOGYSURFACE TOPOLOGY
1 2
1 2 3
4 5 6
Management of connectedness
Management of contiguity
Point: Id,x,y +
Line: Id, (L), Pg,PdNax1,y1x2,y2.--------
Nb
Node: Id,x,y
Surface: Id,
L1L2----
Ln
L1 L2 L3
N1
N2
L1
N1
N2
P1U
L2
N1
N2
P2P1
L3
N1
N2
U
P2
P1
L1
L2
P2
L2
L3
N1
x2,y2
N2
x5,y5

13 / 30
INTRODUCTION TO GIS: STRUCTURING GEOGRAPHIC INFORMATIONINTRODUCTION TO GIS: STRUCTURING GEOGRAPHIC INFORMATION
‘SPAGHETTI’ MODEL‘SPAGHETTI’ MODEL
• Entities
– point: x, y coordinates
– line: list of x,y coordinates corresponding to nodes
– sometimes polygons: set of x,y coordinates, forming a loop: the first coordinate
couple = last coordinate couple
� The spaghetti mode produces a visual effect of polygons but, most often, no polygon
entity is stored
• No spatial relationships between objects– unjoined arcs – unclosed polygons
� polygons cannot form a surface
– intersections without nodes at the crossing of two arcs
– Adjacent polygons that overlap or separated by ‘blanks’
Appearence
!
Reality

14 / 30
INTRODUCTION TO GIS: STRUCTURING GEOGRAPHIC INFORMATIONINTRODUCTION TO GIS: STRUCTURING GEOGRAPHIC INFORMATION
TOPOLOGICAL MODELTOPOLOGICAL MODEL
• Managing the connectedness and contiguity of objects
• 2 types of topology: – Planar topology
– Network topology
• Topological entities:– With permanent storage of the topology
• e.g.: ArcInfo coverage
– Taking into account only when editing (creating, updating); this data is called pseudo-topological.
• e.g.: shp (ArcView) or tab (MapInfo)
– With defined topological rules, varying depending on context
• e.g.: feature class within feature dataset in a geodatabase (ArcGIS)

15 / 30
INTRODUCTION TO GIS: STRUCTURING GEOGRAPHIC INFORMATIONINTRODUCTION TO GIS: STRUCTURING GEOGRAPHIC INFORMATION
DBMS LINK DESCRIPTIVE DATADBMS LINK DESCRIPTIVE DATA
Identifier Attributes of the surface
1
2
3
+1
+3+2
Identifier Attributes of the point
1
2
3
1
23
Identifier Attributes of the line
1
2
3
+1
+2
+3
LINK
Weak
Strong
Hybrid/Integrated
STRUCTURING
Layer -- Table

16 / 30
INTRODUCTION TO GIS: STRUCTURING GEOGRAPHIC INFORMATIONINTRODUCTION TO GIS: STRUCTURING GEOGRAPHIC INFORMATION
1 1 1 1 1 1 1 1 1 1
1 1 1 1 1 1 1 1 1 1
1 1 1 1 1
2 2 2 2 2
2 2 2 2 2
2 2 2 2 2
2 2 2
3 3 3 3 3
3 3 3 3 3
3 3 3 3 3
3 3 3 3 3
3 3 3 3 33 3
extent
in Y or
rows
extent in X or columns
dx
dy
Size of the cell
(geometrical resolution)
Origin (X,Y)
N (orientation)
id attribute
1
2
3
Wheat
Grapevine
Forest
Identifier
RASTER PRESENTATIONRASTER PRESENTATION

17 / 30
INTRODUCTION TO GIS: STRUCTURING GEOGRAPHIC INFORMATIONINTRODUCTION TO GIS: STRUCTURING GEOGRAPHIC INFORMATION
RASTER REPRESENTATION: IMAGE DEPTHRASTER REPRESENTATION: IMAGE DEPTH
�Number of planes
�Depth of each planeboolean = 1 bit (21) 2 values: {0,1}byte = 8 bits (28) 256 values: {0,255}integer = 16 bits (216) 65536 values: {-32767,32765}...
Necessity of digital coding!
dz1
dz2
Thematic resolution
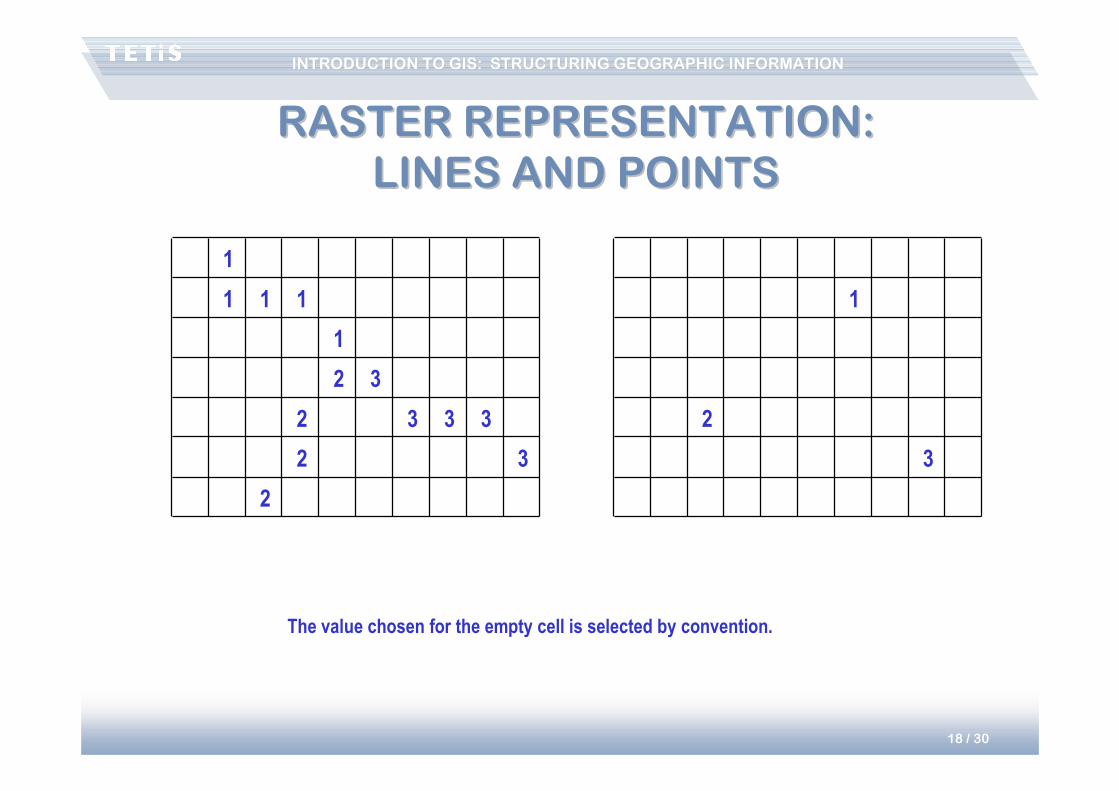
18 / 30
INTRODUCTION TO GIS: STRUCTURING GEOGRAPHIC INFORMATIONINTRODUCTION TO GIS: STRUCTURING GEOGRAPHIC INFORMATION
1
1 1 1
1
2
2
2
2
3
3 3 3
3
RASTER REPRESENTATION: RASTER REPRESENTATION:
LINES AND POINTSLINES AND POINTS
1
2
3
The value chosen for the empty cell is selected by convention.

19 / 30
INTRODUCTION TO GIS: STRUCTURING GEOGRAPHIC INFORMATIONINTRODUCTION TO GIS: STRUCTURING GEOGRAPHIC INFORMATION
RASTER REPRESENTATION: RASTER REPRESENTATION:
CONTINUOUS DATACONTINUOUS DATA
11.4 11.5 11.6 11.8 11.9 12.2 12.5 12.4 12.212.0
11.4 11.6 11.7 11.9 11.9 12.4 12.6 12.6 12.412.0
11.5 11.7 11.8 11.9 12.4
11.7 11.9 12.0 12.5 12.6
11.8 12.1 12.4 12.5 12.8
12.0 12.2 12.5 12.7 12.9
12.5 12.5 12.8
12.6 12.6 12.4 12.111.9
13.0 13.1 12.6 12.312.1
13.0 13.2 12.7 12.412.0
13.4 13.6 13.1 12.712.4
13.7 13.9 13.6 13.212.613.1 13.2
Direct representation of the
variable
Associated data: statistical
summary
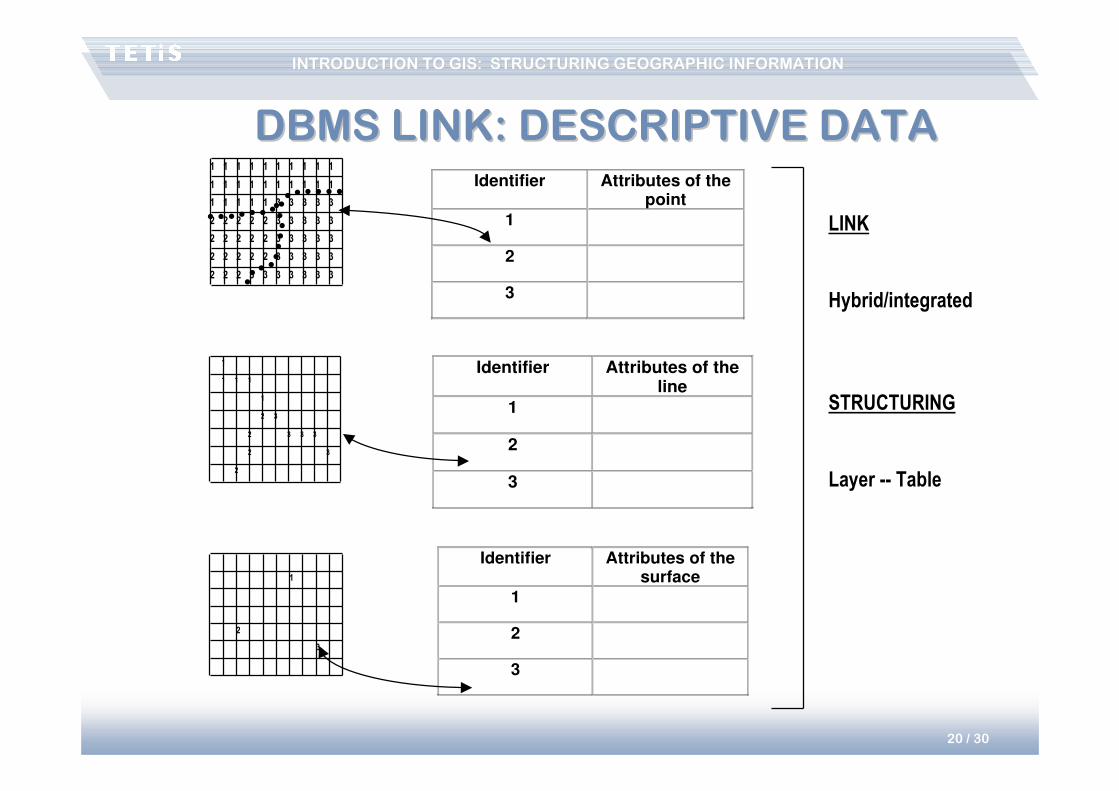
20 / 30
INTRODUCTION TO GIS: STRUCTURING GEOGRAPHIC INFORMATIONINTRODUCTION TO GIS: STRUCTURING GEOGRAPHIC INFORMATION
DBMS LINK: DESCRIPTIVE DATADBMS LINK: DESCRIPTIVE DATAIdentifier Attributes of the
point
1
2
3
Identifier Attributes of the line
1
2
3
Identifier Attributes of the surface
1
2
3
LINK
Hybrid/integrated
STRUCTURING
Layer -- Table
1 1 1 1 1 1 1 1 1 1
1 1 1 1 1 1 1 1 1 1
1 1 1 1 1
2 2 2 2 2
2 2 2 2 2
2 2 2 2 2
2 2 2
3 3 3 3 3
3 3 3 3 3
3 3 3 3 3
3 3 3 3 3
3 3 3 3 33 3
1
1 1 1
1
2
2
2
2
3
3 3 3
3
1
2
3

21 / 30
INTRODUCTION TO GIS: STRUCTURING GEOGRAPHIC INFORMATIONINTRODUCTION TO GIS: STRUCTURING GEOGRAPHIC INFORMATION
RASTER REPRESENTATION: IMAGE DATARASTER REPRESENTATION: IMAGE DATA
Map (scanned)
Orthophotography
Digital Elevation Model

22 / 30
INTRODUCTION TO GIS: STRUCTURING GEOGRAPHIC INFORMATIONINTRODUCTION TO GIS: STRUCTURING GEOGRAPHIC INFORMATION
FROM VECTOR TO RASTER: RASTERIZATION
FROM RASTER TO VECTOR: VECTORIZATION
VECTOR/RASTER CONVERSIONSVECTOR/RASTER CONVERSIONS

23 / 30
INTRODUCTION TO GIS: STRUCTURING GEOGRAPHIC INFORMATIONINTRODUCTION TO GIS: STRUCTURING GEOGRAPHIC INFORMATION
VECTOR AND RASTER: VECTOR AND RASTER:
COMPLEMENTARITYCOMPLEMENTARITY• Raster:
– Grid of ‘independent’ cells
– Matrix calculations
– Redundancy – volume of information
• Vector:– Objects +- structured
– Information with low or no redundancy (depending on the structuring)
– Link with external databases
• Complementarity raster-vector
• Improvements in hardware architectures– Processor power / disk space
– Developments in raster solutions / image processing

24 / 30
INTRODUCTION TO GIS: STRUCTURING GEOGRAPHIC INFORMATIONINTRODUCTION TO GIS: STRUCTURING GEOGRAPHIC INFORMATION
SCALE AND ACCURACY SCALE AND ACCURACY -- 11
• Definition:Constant ratio between lengths measured on the map and the
corresponding lengths measured on the land.
• Expression:– Algebraic expression = scale ratio
map at 1:25,000
– Graphical expression by a scale bar representing the ratio
Graphical expression of scale: INDISPENSABLE
• Semantic confusion

25 / 30
INTRODUCTION TO GIS: STRUCTURING GEOGRAPHIC INFORMATIONINTRODUCTION TO GIS: STRUCTURING GEOGRAPHIC INFORMATION
• Significance of the scale:– Representation ratio
– Level of analysis of the studied phenomena
– Geometric accuracy of the information
• Level of approach of geographic space– Size of a zone representable at a given scale:
• A4 sheet: 600 km2 at 1:100,000
• … : 6 km2 at 1:10,000
– Level of analysis:
Compartment scale, regional scale, national scale
• Geometric accuracy of the information
SCALE AND ACCURACY SCALE AND ACCURACY -- 22

26 / 30
INTRODUCTION TO GIS: STRUCTURING GEOGRAPHIC INFORMATIONINTRODUCTION TO GIS: STRUCTURING GEOGRAPHIC INFORMATION
• Scale = representation ratioAccuracy = quality of geometric information
• 2 dimensions of accuracy:– resolution = size of an ‘elementary’ pixel
– localization accuracy: localization error
• Scale/accuracy confusion: 2 causes– assumption of the reader: each point is significant
– assumption of the producer: no unnecessary quality
• With ‘undesirable’ consequencesthe zoom syndrome
SCALE AND ACCURACY SCALE AND ACCURACY -- 33

27 / 30
INTRODUCTION TO GIS: STRUCTURING GEOGRAPHIC INFORMATIONINTRODUCTION TO GIS: STRUCTURING GEOGRAPHIC INFORMATION
GEOGRAPHIC DATA QUALITY GEOGRAPHIC DATA QUALITY -- 11
Hardwares
Softwares
Methods
Users
Data
• Key-element of
any GIS project
• 70 to 80 % of
total project costs

28 / 30
INTRODUCTION TO GIS: STRUCTURING GEOGRAPHIC INFORMATIONINTRODUCTION TO GIS: STRUCTURING GEOGRAPHIC INFORMATION
GEOGRAPHIC DATA QUALITY GEOGRAPHIC DATA QUALITY -- 22
• Acquiring data from:– Institutional: public agencies
– Private providers
– External contractors
– Internal digitalization
GIS software incorporate tools to create layer:
– features digitalization,
– calculation on one or many existing plans,
– Image processing

29 / 30
INTRODUCTION TO GIS: STRUCTURING GEOGRAPHIC INFORMATIONINTRODUCTION TO GIS: STRUCTURING GEOGRAPHIC INFORMATION
GEOGRAPHIC DATA QUALITY GEOGRAPHIC DATA QUALITY -- 33
• Which use ?– To use or extract information from this document
– As based map (illustration or filling)
– To take measurements
– To analyze simultaneously several information plans (spatial
analysis)
• Whatever use, consider :– Precision of imported data
– Level of detail
– Reference system used (compatibility with local database)
– Data property (copyright)
Information
to be stored
in metadata

30 / 30
INTRODUCTION TO GIS: STRUCTURING GEOGRAPHIC INFORMATIONINTRODUCTION TO GIS: STRUCTURING GEOGRAPHIC INFORMATION
METADATA, TO GUARANTEE DATA METADATA, TO GUARANTEE DATA
QUALITYQUALITY
• Metadata = "data about data"– The procedures followed to acquire the data
– The precision et methods of measurements
– The age of the data and update
– The data coding
– The geographic referencing
– The geometry
– The attributes
• Absence of metadata– False interpretation
– Bad usage
– Erroneous perception of precision
Example of metadata's appearance
ArcCatalog (ESRI)

1
Territories, Environment, Remote Sensing & Spatial Information Joint Research Unit Cemagref - CIRAD - ENGREF
Pierre BAZILE
GIS: concepts, methods & toolsGIS: concepts, methods & tools
METIER METIER GraduateGraduate Training Course no. 2 Training Course no. 2 –– Montpellier Montpellier -- FebruaryFebruary 20072007
Information Management in Information Management in EnvironmentalEnvironmental SciencesSciences
Introduction to GISIntroduction to GIS
Structuring of geographic informationStructuring of geographic information

2 / 30
INTRODUCTION TO GIS: STRUCTURING GEOGRAPHIC INFORMATIONINTRODUCTION TO GIS: STRUCTURING GEOGRAPHIC INFORMATION
INFORMATION SYSTEM AND ORGANIZATIONINFORMATION SYSTEM AND ORGANIZATION
CONTROL SYSTEM
INFORMATION SYSTEM
Problem Decision
Requests Information
Inputs
Outputs
EXTERNAL
UNIVERSE
INFORMATION
BASE
STATIC
Data, rules, and
constraints of the
external universe
DYNAMIC
INFORMATION
PROCESSOR
Actions
Personnel

3 / 30
INTRODUCTION TO GIS: STRUCTURING GEOGRAPHIC INFORMATIONINTRODUCTION TO GIS: STRUCTURING GEOGRAPHIC INFORMATION
AUTOMATIZATION OF THE INFORMATION SYSTEMAUTOMATIZATION OF THE INFORMATION SYSTEM
AUTOMATIZED INFORMATION SYSTEM
Inputs
Outputs
FORMALISABLE
UNIVERSE
INFORMATION
BASE
STATIC DYNAMIC
INFORMATION
PROCESSOR
Personnel
Data
model
Computer
Software: DBMS
(Database management system)

4 / 30
INTRODUCTION TO GIS: STRUCTURING GEOGRAPHIC INFORMATIONINTRODUCTION TO GIS: STRUCTURING GEOGRAPHIC INFORMATION
SPATIAL REFERENCE INFORMATION SYSTEMSPATIAL REFERENCE INFORMATION SYSTEM
INFORMATION SYSTEM
Inputs
Outputs
INFORMATION
BASE
STATIC DYNAMIC
INFORMATION
PROCESSOR
Personnel
Semantic
data
model
Software: GISSpatial
data
model
Software: DBMS
Computer
(Geographic infomation system)
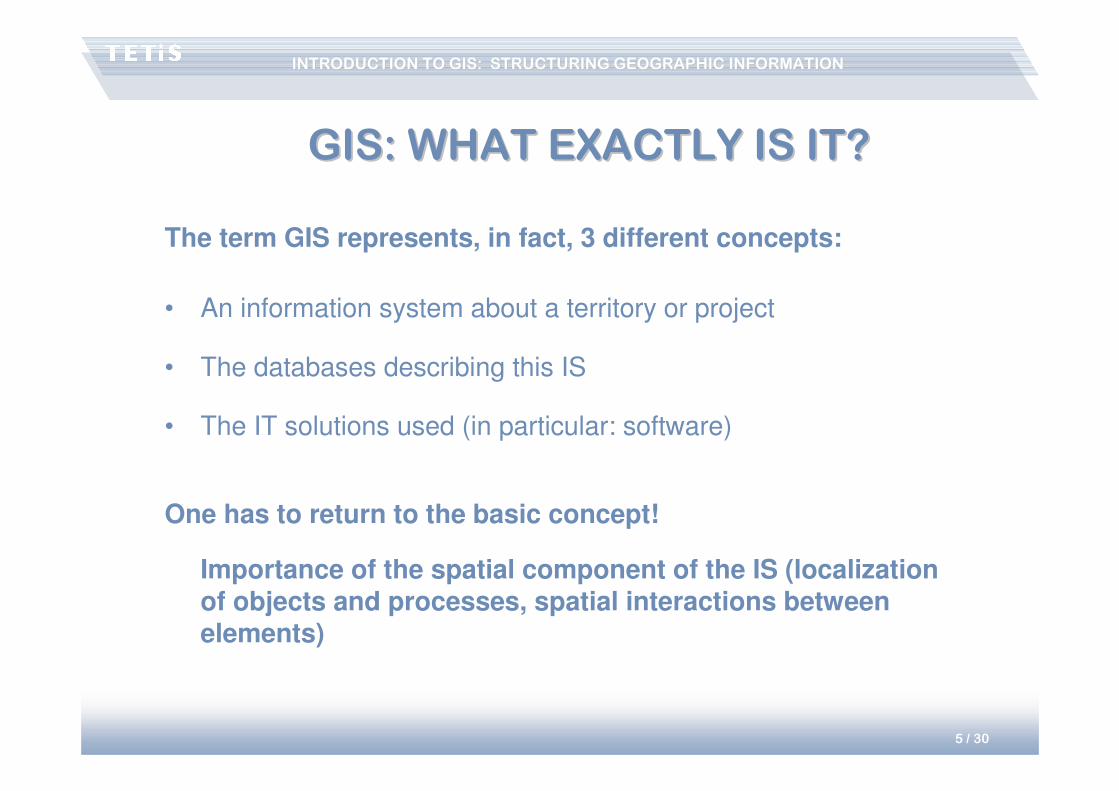
5 / 30
INTRODUCTION TO GIS: STRUCTURING GEOGRAPHIC INFORMATIONINTRODUCTION TO GIS: STRUCTURING GEOGRAPHIC INFORMATION
GIS: WHAT EXACTLY IS IT?GIS: WHAT EXACTLY IS IT?
The term GIS represents, in fact, 3 different concepts:
• An information system about a territory or project
• The databases describing this IS
• The IT solutions used (in particular: software)
One has to return to the basic concept!
Importance of the spatial component of the IS (localization of objects and processes, spatial interactions between elements)

6 / 30
INTRODUCTION TO GIS: STRUCTURING GEOGRAPHIC INFORMATIONINTRODUCTION TO GIS: STRUCTURING GEOGRAPHIC INFORMATION
REPRESENTING GEOGRAPHICAL DATAREPRESENTING GEOGRAPHICAL DATA
Duality of Geographical Information:
• Graphical information:The geographical objects, their localization, their topological relationships
• Thematic information:The descriptors of these objects, of these localizations
‘semantic’ data
500 Metres0
N

7 / 30
INTRODUCTION TO GIS: STRUCTURING GEOGRAPHIC INFORMATIONINTRODUCTION TO GIS: STRUCTURING GEOGRAPHIC INFORMATION
REPRESENTING GRAPHIC DATAREPRESENTING GRAPHIC DATA
Semantic
database
Semantic
database
Entities
Relationship
Spatial
representation
Spatial
representation
Entities
Relationships
Point
Line
Surface
Continuous
Tables
Adjacency
Inclusion
Proximity
Path
Link

8 / 30
INTRODUCTION TO GIS: STRUCTURING GEOGRAPHIC INFORMATIONINTRODUCTION TO GIS: STRUCTURING GEOGRAPHIC INFORMATION
CODING GEOMETRY : TWO MODESCODING GEOMETRY : TWO MODES
• image vs ‘line drawings’
• raster vs vector

9 / 30
INTRODUCTION TO GIS: STRUCTURING GEOGRAPHIC INFORMATIONINTRODUCTION TO GIS: STRUCTURING GEOGRAPHIC INFORMATION
VECTOR REPRESENTATIONVECTOR REPRESENTATION
bâtiment
route
lac

10 / 30
INTRODUCTION TO GIS: STRUCTURING GEOGRAPHIC INFORMATIONINTRODUCTION TO GIS: STRUCTURING GEOGRAPHIC INFORMATION
VECTOR REPRESENTATION: VECTOR REPRESENTATION:
‘SPAGHETTI’‘SPAGHETTI’
Point: Id,x,y +
Line: Id,
x0,y0x1,y1x2,y2.--------
xn,yn
Surface: Id,
x0,y0x1,y1x2,y2--------
xn,yn(x0,y0)
1 2
1 2 3
4 5 6
P1 P2
x1,y1 x2,y2
x2,y2 x3,y3
x5,y5 x6,y6
x4,y4 x5,y5x1,y1 x2,y2
Data redundancy
Undefined relationships

11 / 30
INTRODUCTION TO GIS: STRUCTURING GEOGRAPHIC INFORMATIONINTRODUCTION TO GIS: STRUCTURING GEOGRAPHIC INFORMATION
VECTOR REPRESENTATION:VECTOR REPRESENTATION:
NETWORK TOPOLOGYNETWORK TOPOLOGY
Point: Id,x,y +
Line: Id, (L)
Nax1,y1x2,y2.--------
Nb
Node: Id,x,y
Surface: Id,
L1L2----
Ln
1 2
1 2 3
4 5 6
No redundancy
Management of connectedness
L1 L2 L3
N1
N2
L1
N1x1,y1
x4,y4
N2
L2
N1N2
L3
N1x3,y3
x6,y6
N2
P1
L1
L2
P2
L2
L3
N1
x2,y2
N2
x5,y5

12 / 30
INTRODUCTION TO GIS: STRUCTURING GEOGRAPHIC INFORMATIONINTRODUCTION TO GIS: STRUCTURING GEOGRAPHIC INFORMATION
VECTOR REPRESENTATION: VECTOR REPRESENTATION:
SURFACE TOPOLOGYSURFACE TOPOLOGY
1 2
1 2 3
4 5 6
Management of connectedness
Management of contiguity
Point: Id,x,y +
Line: Id, (L), Pg,PdNax1,y1x2,y2.--------
Nb
Node: Id,x,y
Surface: Id,
L1L2----
Ln
L1 L2 L3
N1
N2
L1
N1
N2
P1U
L2
N1
N2
P2P1
L3
N1
N2
U
P2
P1
L1
L2
P2
L2
L3
N1
x2,y2
N2
x5,y5

13 / 30
INTRODUCTION TO GIS: STRUCTURING GEOGRAPHIC INFORMATIONINTRODUCTION TO GIS: STRUCTURING GEOGRAPHIC INFORMATION
‘SPAGHETTI’ MODEL‘SPAGHETTI’ MODEL
• Entities
– point: x, y coordinates
– line: list of x,y coordinates corresponding to nodes
– sometimes polygons: set of x,y coordinates, forming a loop: the first coordinate
couple = last coordinate couple
� The spaghetti mode produces a visual effect of polygons but, most often, no polygon
entity is stored
• No spatial relationships between objects– unjoined arcs – unclosed polygons
� polygons cannot form a surface
– intersections without nodes at the crossing of two arcs
– Adjacent polygons that overlap or separated by ‘blanks’
Appearence
!
Reality

14 / 30
INTRODUCTION TO GIS: STRUCTURING GEOGRAPHIC INFORMATIONINTRODUCTION TO GIS: STRUCTURING GEOGRAPHIC INFORMATION
TOPOLOGICAL MODELTOPOLOGICAL MODEL
• Managing the connectedness and contiguity of objects
• 2 types of topology: – Planar topology
– Network topology
• Topological entities:– With permanent storage of the topology
• e.g.: ArcInfo coverage
– Taking into account only when editing (creating, updating); this data is called pseudo-topological.
• e.g.: shp (ArcView) or tab (MapInfo)
– With defined topological rules, varying depending on context
• e.g.: feature class within feature dataset in a geodatabase (ArcGIS)

15 / 30
INTRODUCTION TO GIS: STRUCTURING GEOGRAPHIC INFORMATIONINTRODUCTION TO GIS: STRUCTURING GEOGRAPHIC INFORMATION
DBMS LINK DESCRIPTIVE DATADBMS LINK DESCRIPTIVE DATA
Identifier Attributes of the surface
1
2
3
+1
+3+2
Identifier Attributes of the point
1
2
3
1
23
Identifier Attributes of the line
1
2
3
+1
+2
+3
LINK
Weak
Strong
Hybrid/Integrated
STRUCTURING
Layer -- Table
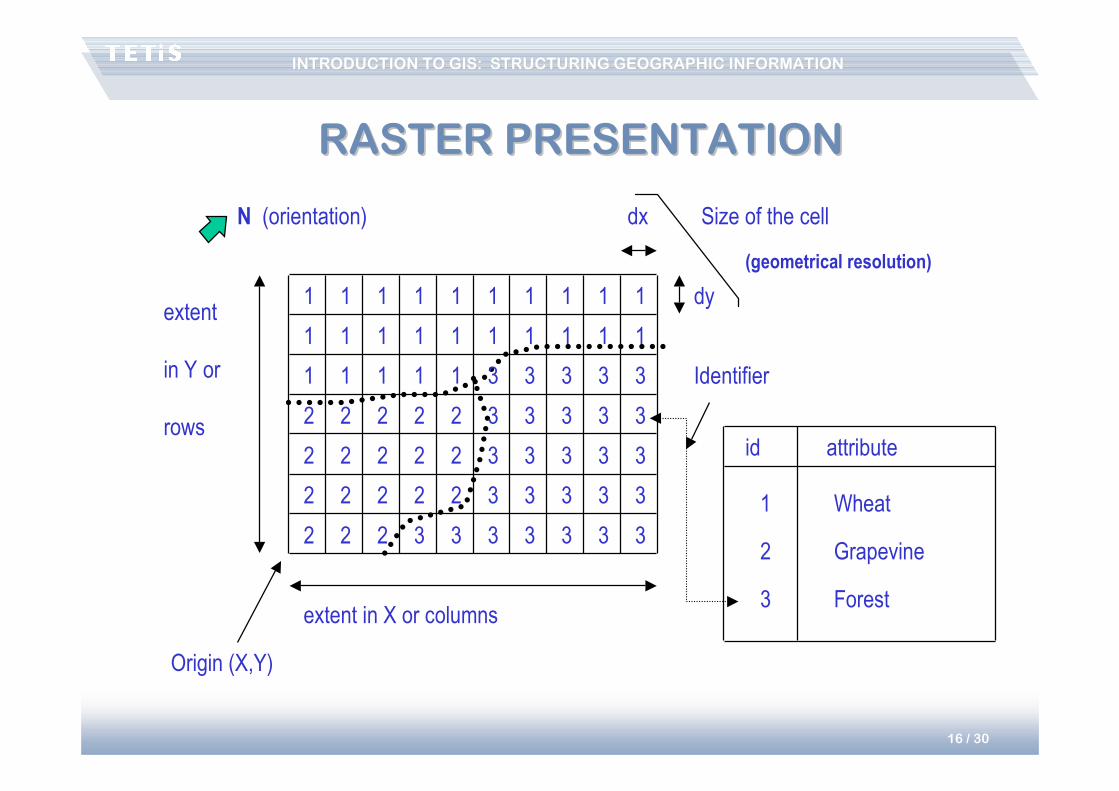
16 / 30
INTRODUCTION TO GIS: STRUCTURING GEOGRAPHIC INFORMATIONINTRODUCTION TO GIS: STRUCTURING GEOGRAPHIC INFORMATION
1 1 1 1 1 1 1 1 1 1
1 1 1 1 1 1 1 1 1 1
1 1 1 1 1
2 2 2 2 2
2 2 2 2 2
2 2 2 2 2
2 2 2
3 3 3 3 3
3 3 3 3 3
3 3 3 3 3
3 3 3 3 3
3 3 3 3 33 3
extent
in Y or
rows
extent in X or columns
dx
dy
Size of the cell
(geometrical resolution)
Origin (X,Y)
N (orientation)
id attribute
1
2
3
Wheat
Grapevine
Forest
Identifier
RASTER PRESENTATIONRASTER PRESENTATION

17 / 30
INTRODUCTION TO GIS: STRUCTURING GEOGRAPHIC INFORMATIONINTRODUCTION TO GIS: STRUCTURING GEOGRAPHIC INFORMATION
RASTER REPRESENTATION: IMAGE DEPTHRASTER REPRESENTATION: IMAGE DEPTH
�Number of planes
�Depth of each planeboolean = 1 bit (21) 2 values: {0,1}byte = 8 bits (28) 256 values: {0,255}integer = 16 bits (216) 65536 values: {-32767,32765}...
Necessity of digital coding!
dz1
dz2
Thematic resolution

18 / 30
INTRODUCTION TO GIS: STRUCTURING GEOGRAPHIC INFORMATIONINTRODUCTION TO GIS: STRUCTURING GEOGRAPHIC INFORMATION
1
1 1 1
1
2
2
2
2
3
3 3 3
3
RASTER REPRESENTATION: RASTER REPRESENTATION:
LINES AND POINTSLINES AND POINTS
1
2
3
The value chosen for the empty cell is selected by convention.

19 / 30
INTRODUCTION TO GIS: STRUCTURING GEOGRAPHIC INFORMATIONINTRODUCTION TO GIS: STRUCTURING GEOGRAPHIC INFORMATION
RASTER REPRESENTATION: RASTER REPRESENTATION:
CONTINUOUS DATACONTINUOUS DATA
11.4 11.5 11.6 11.8 11.9 12.2 12.5 12.4 12.212.0
11.4 11.6 11.7 11.9 11.9 12.4 12.6 12.6 12.412.0
11.5 11.7 11.8 11.9 12.4
11.7 11.9 12.0 12.5 12.6
11.8 12.1 12.4 12.5 12.8
12.0 12.2 12.5 12.7 12.9
12.5 12.5 12.8
12.6 12.6 12.4 12.111.9
13.0 13.1 12.6 12.312.1
13.0 13.2 12.7 12.412.0
13.4 13.6 13.1 12.712.4
13.7 13.9 13.6 13.212.613.1 13.2
Direct representation of the
variable
Associated data: statistical
summary

20 / 30
INTRODUCTION TO GIS: STRUCTURING GEOGRAPHIC INFORMATIONINTRODUCTION TO GIS: STRUCTURING GEOGRAPHIC INFORMATION
DBMS LINK: DESCRIPTIVE DATADBMS LINK: DESCRIPTIVE DATAIdentifier Attributes of the
point
1
2
3
Identifier Attributes of the line
1
2
3
Identifier Attributes of the surface
1
2
3
LINK
Hybrid/integrated
STRUCTURING
Layer -- Table
1 1 1 1 1 1 1 1 1 1
1 1 1 1 1 1 1 1 1 1
1 1 1 1 1
2 2 2 2 2
2 2 2 2 2
2 2 2 2 2
2 2 2
3 3 3 3 3
3 3 3 3 3
3 3 3 3 3
3 3 3 3 3
3 3 3 3 33 3
1
1 1 1
1
2
2
2
2
3
3 3 3
3
1
2
3

21 / 30
INTRODUCTION TO GIS: STRUCTURING GEOGRAPHIC INFORMATIONINTRODUCTION TO GIS: STRUCTURING GEOGRAPHIC INFORMATION
RASTER REPRESENTATION: IMAGE DATARASTER REPRESENTATION: IMAGE DATA
Map (scanned)
Orthophotography
Digital Elevation Model

22 / 30
INTRODUCTION TO GIS: STRUCTURING GEOGRAPHIC INFORMATIONINTRODUCTION TO GIS: STRUCTURING GEOGRAPHIC INFORMATION
FROM VECTOR TO RASTER: RASTERIZATION
FROM RASTER TO VECTOR: VECTORIZATION
VECTOR/RASTER CONVERSIONSVECTOR/RASTER CONVERSIONS
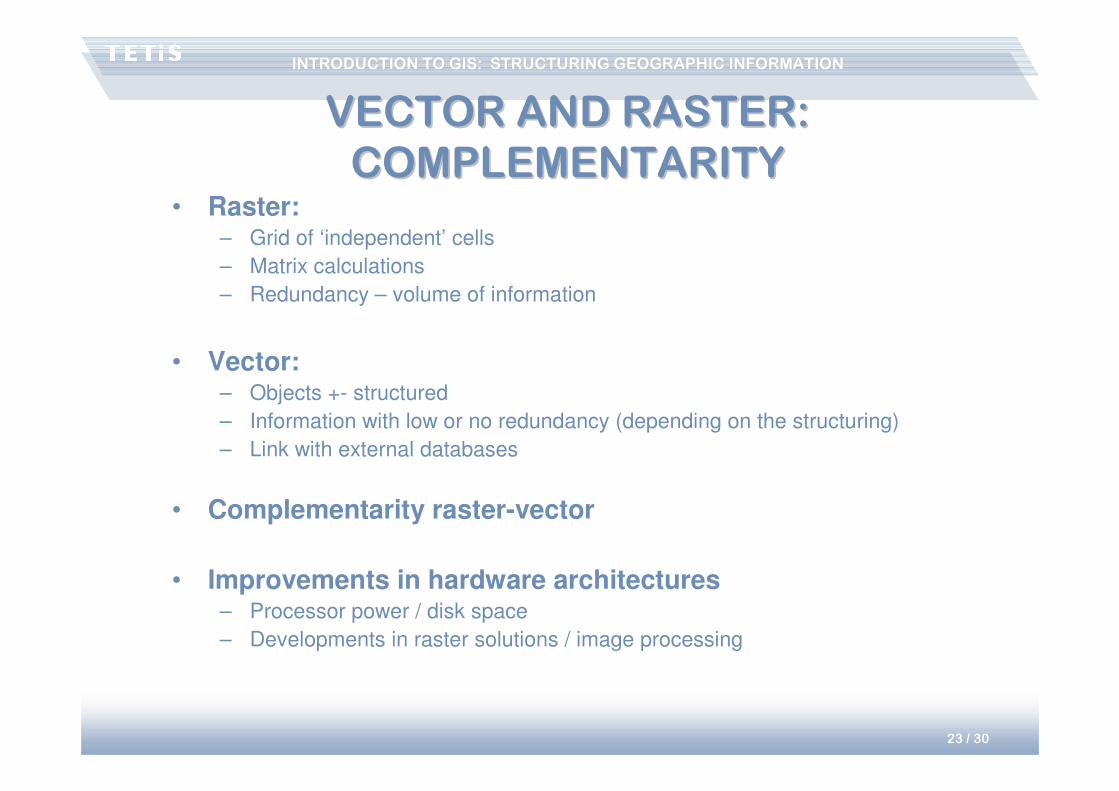
23 / 30
INTRODUCTION TO GIS: STRUCTURING GEOGRAPHIC INFORMATIONINTRODUCTION TO GIS: STRUCTURING GEOGRAPHIC INFORMATION
VECTOR AND RASTER: VECTOR AND RASTER:
COMPLEMENTARITYCOMPLEMENTARITY• Raster:
– Grid of ‘independent’ cells
– Matrix calculations
– Redundancy – volume of information
• Vector:– Objects +- structured
– Information with low or no redundancy (depending on the structuring)
– Link with external databases
• Complementarity raster-vector
• Improvements in hardware architectures– Processor power / disk space
– Developments in raster solutions / image processing

24 / 30
INTRODUCTION TO GIS: STRUCTURING GEOGRAPHIC INFORMATIONINTRODUCTION TO GIS: STRUCTURING GEOGRAPHIC INFORMATION
SCALE AND ACCURACY SCALE AND ACCURACY -- 11
• Definition:Constant ratio between lengths measured on the map and the
corresponding lengths measured on the land.
• Expression:– Algebraic expression = scale ratio
map at 1:25,000
– Graphical expression by a scale bar representing the ratio
Graphical expression of scale: INDISPENSABLE
• Semantic confusion

25 / 30
INTRODUCTION TO GIS: STRUCTURING GEOGRAPHIC INFORMATIONINTRODUCTION TO GIS: STRUCTURING GEOGRAPHIC INFORMATION
• Significance of the scale:– Representation ratio
– Level of analysis of the studied phenomena
– Geometric accuracy of the information
• Level of approach of geographic space– Size of a zone representable at a given scale:
• A4 sheet: 600 km2 at 1:100,000
• … : 6 km2 at 1:10,000
– Level of analysis:
Compartment scale, regional scale, national scale
• Geometric accuracy of the information
SCALE AND ACCURACY SCALE AND ACCURACY -- 22

26 / 30
INTRODUCTION TO GIS: STRUCTURING GEOGRAPHIC INFORMATIONINTRODUCTION TO GIS: STRUCTURING GEOGRAPHIC INFORMATION
• Scale = representation ratioAccuracy = quality of geometric information
• 2 dimensions of accuracy:– resolution = size of an ‘elementary’ pixel
– localization accuracy: localization error
• Scale/accuracy confusion: 2 causes– assumption of the reader: each point is significant
– assumption of the producer: no unnecessary quality
• With ‘undesirable’ consequencesthe zoom syndrome
SCALE AND ACCURACY SCALE AND ACCURACY -- 33

27 / 30
INTRODUCTION TO GIS: STRUCTURING GEOGRAPHIC INFORMATIONINTRODUCTION TO GIS: STRUCTURING GEOGRAPHIC INFORMATION
GEOGRAPHIC DATA QUALITY GEOGRAPHIC DATA QUALITY -- 11
Hardwares
Softwares
Methods
Users
Data
• Key-element of
any GIS project
• 70 to 80 % of
total project costs

28 / 30
INTRODUCTION TO GIS: STRUCTURING GEOGRAPHIC INFORMATIONINTRODUCTION TO GIS: STRUCTURING GEOGRAPHIC INFORMATION
GEOGRAPHIC DATA QUALITY GEOGRAPHIC DATA QUALITY -- 22
• Acquiring data from:– Institutional: public agencies
– Private providers
– External contractors
– Internal digitalization
GIS software incorporate tools to create layer:
– features digitalization,
– calculation on one or many existing plans,
– Image processing

29 / 30
INTRODUCTION TO GIS: STRUCTURING GEOGRAPHIC INFORMATIONINTRODUCTION TO GIS: STRUCTURING GEOGRAPHIC INFORMATION
GEOGRAPHIC DATA QUALITY GEOGRAPHIC DATA QUALITY -- 33
• Which use ?– To use or extract information from this document
– As based map (illustration or filling)
– To take measurements
– To analyze simultaneously several information plans (spatial
analysis)
• Whatever use, consider :– Precision of imported data
– Level of detail
– Reference system used (compatibility with local database)
– Data property (copyright)
Information
to be stored
in metadata

30 / 30
INTRODUCTION TO GIS: STRUCTURING GEOGRAPHIC INFORMATIONINTRODUCTION TO GIS: STRUCTURING GEOGRAPHIC INFORMATION
METADATA, TO GUARANTEE DATA METADATA, TO GUARANTEE DATA
QUALITYQUALITY
• Metadata = "data about data"– The procedures followed to acquire the data
– The precision et methods of measurements
– The age of the data and update
– The data coding
– The geographic referencing
– The geometry
– The attributes
• Absence of metadata– False interpretation
– Bad usage
– Erroneous perception of precision
Example of metadata's appearance
ArcCatalog (ESRI)

1
Territories, Environment, Remote Sensing & Spatial Information Joint Research Unit Cemagref - CIRAD - ENGREF
Pierre BAZILE
GIS: concepts, methods & toolsGIS: concepts, methods & tools
METIER METIER GraduateGraduate Training Course no. 2 Training Course no. 2 –– Montpellier Montpellier -- FebruaryFebruary 20072007
Information Management in Information Management in EnvironmentalEnvironmental SciencesSciences
Introduction to GISIntroduction to GIS
Structuring of geographic informationStructuring of geographic information

2 / 30
INTRODUCTION TO GIS: STRUCTURING GEOGRAPHIC INFORMATIONINTRODUCTION TO GIS: STRUCTURING GEOGRAPHIC INFORMATION
INFORMATION SYSTEM AND ORGANIZATIONINFORMATION SYSTEM AND ORGANIZATION
CONTROL SYSTEM
INFORMATION SYSTEM
Problem Decision
Requests Information
Inputs
Outputs
EXTERNAL
UNIVERSE
INFORMATION
BASE
STATIC
Data, rules, and
constraints of the
external universe
DYNAMIC
INFORMATION
PROCESSOR
Actions
Personnel

3 / 30
INTRODUCTION TO GIS: STRUCTURING GEOGRAPHIC INFORMATIONINTRODUCTION TO GIS: STRUCTURING GEOGRAPHIC INFORMATION
AUTOMATIZATION OF THE INFORMATION SYSTEMAUTOMATIZATION OF THE INFORMATION SYSTEM
AUTOMATIZED INFORMATION SYSTEM
Inputs
Outputs
FORMALISABLE
UNIVERSE
INFORMATION
BASE
STATIC DYNAMIC
INFORMATION
PROCESSOR
Personnel
Data
model
Computer
Software: DBMS
(Database management system)

4 / 30
INTRODUCTION TO GIS: STRUCTURING GEOGRAPHIC INFORMATIONINTRODUCTION TO GIS: STRUCTURING GEOGRAPHIC INFORMATION
SPATIAL REFERENCE INFORMATION SYSTEMSPATIAL REFERENCE INFORMATION SYSTEM
INFORMATION SYSTEM
Inputs
Outputs
INFORMATION
BASE
STATIC DYNAMIC
INFORMATION
PROCESSOR
Personnel
Semantic
data
model
Software: GISSpatial
data
model
Software: DBMS
Computer
(Geographic infomation system)

5 / 30
INTRODUCTION TO GIS: STRUCTURING GEOGRAPHIC INFORMATIONINTRODUCTION TO GIS: STRUCTURING GEOGRAPHIC INFORMATION
GIS: WHAT EXACTLY IS IT?GIS: WHAT EXACTLY IS IT?
The term GIS represents, in fact, 3 different concepts:
• An information system about a territory or project
• The databases describing this IS
• The IT solutions used (in particular: software)
One has to return to the basic concept!
Importance of the spatial component of the IS (localization of objects and processes, spatial interactions between elements)

6 / 30
INTRODUCTION TO GIS: STRUCTURING GEOGRAPHIC INFORMATIONINTRODUCTION TO GIS: STRUCTURING GEOGRAPHIC INFORMATION
REPRESENTING GEOGRAPHICAL DATAREPRESENTING GEOGRAPHICAL DATA
Duality of Geographical Information:
• Graphical information:The geographical objects, their localization, their topological relationships
• Thematic information:The descriptors of these objects, of these localizations
‘semantic’ data
500 Metres0
N

7 / 30
INTRODUCTION TO GIS: STRUCTURING GEOGRAPHIC INFORMATIONINTRODUCTION TO GIS: STRUCTURING GEOGRAPHIC INFORMATION
REPRESENTING GRAPHIC DATAREPRESENTING GRAPHIC DATA
Semantic
database
Semantic
database
Entities
Relationship
Spatial
representation
Spatial
representation
Entities
Relationships
Point
Line
Surface
Continuous
Tables
Adjacency
Inclusion
Proximity
Path
Link

8 / 30
INTRODUCTION TO GIS: STRUCTURING GEOGRAPHIC INFORMATIONINTRODUCTION TO GIS: STRUCTURING GEOGRAPHIC INFORMATION
CODING GEOMETRY : TWO MODESCODING GEOMETRY : TWO MODES
• image vs ‘line drawings’
• raster vs vector

9 / 30
INTRODUCTION TO GIS: STRUCTURING GEOGRAPHIC INFORMATIONINTRODUCTION TO GIS: STRUCTURING GEOGRAPHIC INFORMATION
VECTOR REPRESENTATIONVECTOR REPRESENTATION
bâtiment
route
lac

10 / 30
INTRODUCTION TO GIS: STRUCTURING GEOGRAPHIC INFORMATIONINTRODUCTION TO GIS: STRUCTURING GEOGRAPHIC INFORMATION
VECTOR REPRESENTATION: VECTOR REPRESENTATION:
‘SPAGHETTI’‘SPAGHETTI’
Point: Id,x,y +
Line: Id,
x0,y0x1,y1x2,y2.--------
xn,yn
Surface: Id,
x0,y0x1,y1x2,y2--------
xn,yn(x0,y0)
1 2
1 2 3
4 5 6
P1 P2
x1,y1 x2,y2
x2,y2 x3,y3
x5,y5 x6,y6
x4,y4 x5,y5x1,y1 x2,y2
Data redundancy
Undefined relationships
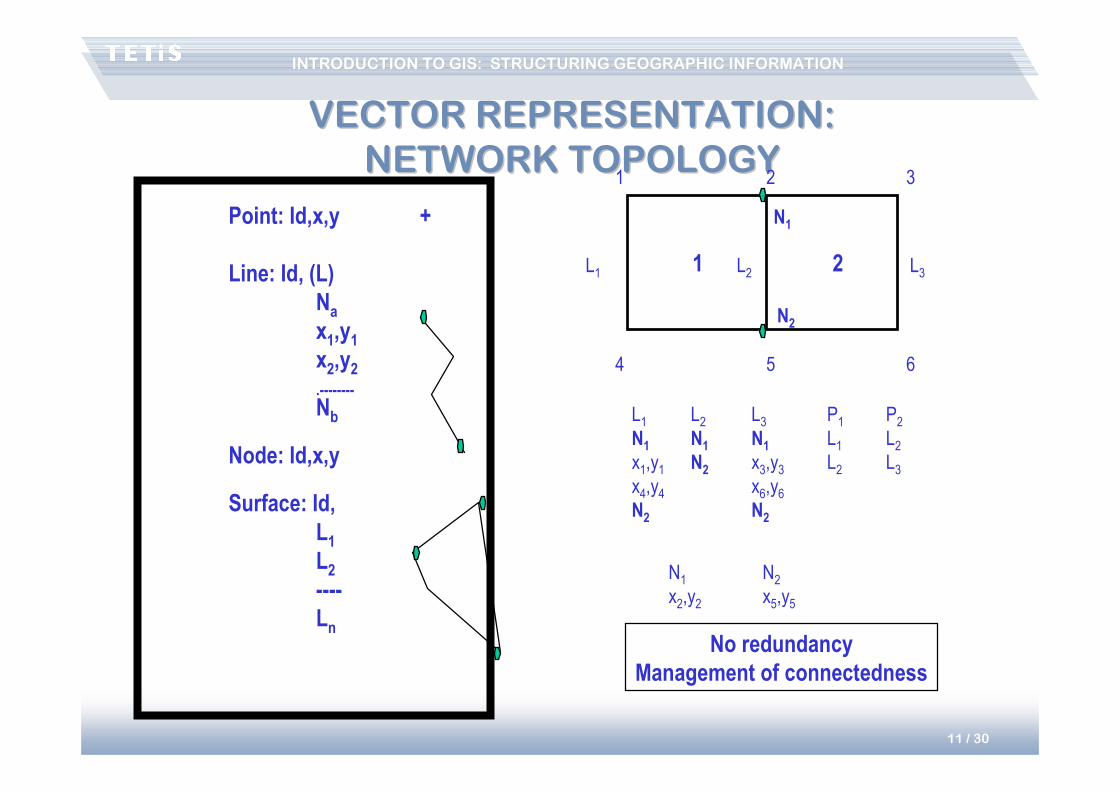
11 / 30
INTRODUCTION TO GIS: STRUCTURING GEOGRAPHIC INFORMATIONINTRODUCTION TO GIS: STRUCTURING GEOGRAPHIC INFORMATION
VECTOR REPRESENTATION:VECTOR REPRESENTATION:
NETWORK TOPOLOGYNETWORK TOPOLOGY
Point: Id,x,y +
Line: Id, (L)
Nax1,y1x2,y2.--------
Nb
Node: Id,x,y
Surface: Id,
L1L2----
Ln
1 2
1 2 3
4 5 6
No redundancy
Management of connectedness
L1 L2 L3
N1
N2
L1
N1x1,y1
x4,y4
N2
L2
N1N2
L3
N1x3,y3
x6,y6
N2
P1
L1
L2
P2
L2
L3
N1
x2,y2
N2
x5,y5

12 / 30
INTRODUCTION TO GIS: STRUCTURING GEOGRAPHIC INFORMATIONINTRODUCTION TO GIS: STRUCTURING GEOGRAPHIC INFORMATION
VECTOR REPRESENTATION: VECTOR REPRESENTATION:
SURFACE TOPOLOGYSURFACE TOPOLOGY
1 2
1 2 3
4 5 6
Management of connectedness
Management of contiguity
Point: Id,x,y +
Line: Id, (L), Pg,PdNax1,y1x2,y2.--------
Nb
Node: Id,x,y
Surface: Id,
L1L2----
Ln
L1 L2 L3
N1
N2
L1
N1
N2
P1U
L2
N1
N2
P2P1
L3
N1
N2
U
P2
P1
L1
L2
P2
L2
L3
N1
x2,y2
N2
x5,y5

13 / 30
INTRODUCTION TO GIS: STRUCTURING GEOGRAPHIC INFORMATIONINTRODUCTION TO GIS: STRUCTURING GEOGRAPHIC INFORMATION
‘SPAGHETTI’ MODEL‘SPAGHETTI’ MODEL
• Entities
– point: x, y coordinates
– line: list of x,y coordinates corresponding to nodes
– sometimes polygons: set of x,y coordinates, forming a loop: the first coordinate
couple = last coordinate couple
� The spaghetti mode produces a visual effect of polygons but, most often, no polygon
entity is stored
• No spatial relationships between objects– unjoined arcs – unclosed polygons
� polygons cannot form a surface
– intersections without nodes at the crossing of two arcs
– Adjacent polygons that overlap or separated by ‘blanks’
Appearence
!
Reality

14 / 30
INTRODUCTION TO GIS: STRUCTURING GEOGRAPHIC INFORMATIONINTRODUCTION TO GIS: STRUCTURING GEOGRAPHIC INFORMATION
TOPOLOGICAL MODELTOPOLOGICAL MODEL
• Managing the connectedness and contiguity of objects
• 2 types of topology: – Planar topology
– Network topology
• Topological entities:– With permanent storage of the topology
• e.g.: ArcInfo coverage
– Taking into account only when editing (creating, updating); this data is called pseudo-topological.
• e.g.: shp (ArcView) or tab (MapInfo)
– With defined topological rules, varying depending on context
• e.g.: feature class within feature dataset in a geodatabase (ArcGIS)

15 / 30
INTRODUCTION TO GIS: STRUCTURING GEOGRAPHIC INFORMATIONINTRODUCTION TO GIS: STRUCTURING GEOGRAPHIC INFORMATION
DBMS LINK DESCRIPTIVE DATADBMS LINK DESCRIPTIVE DATA
Identifier Attributes of the surface
1
2
3
+1
+3+2
Identifier Attributes of the point
1
2
3
1
23
Identifier Attributes of the line
1
2
3
+1
+2
+3
LINK
Weak
Strong
Hybrid/Integrated
STRUCTURING
Layer -- Table

16 / 30
INTRODUCTION TO GIS: STRUCTURING GEOGRAPHIC INFORMATIONINTRODUCTION TO GIS: STRUCTURING GEOGRAPHIC INFORMATION
1 1 1 1 1 1 1 1 1 1
1 1 1 1 1 1 1 1 1 1
1 1 1 1 1
2 2 2 2 2
2 2 2 2 2
2 2 2 2 2
2 2 2
3 3 3 3 3
3 3 3 3 3
3 3 3 3 3
3 3 3 3 3
3 3 3 3 33 3
extent
in Y or
rows
extent in X or columns
dx
dy
Size of the cell
(geometrical resolution)
Origin (X,Y)
N (orientation)
id attribute
1
2
3
Wheat
Grapevine
Forest
Identifier
RASTER PRESENTATIONRASTER PRESENTATION

17 / 30
INTRODUCTION TO GIS: STRUCTURING GEOGRAPHIC INFORMATIONINTRODUCTION TO GIS: STRUCTURING GEOGRAPHIC INFORMATION
RASTER REPRESENTATION: IMAGE DEPTHRASTER REPRESENTATION: IMAGE DEPTH
�Number of planes
�Depth of each planeboolean = 1 bit (21) 2 values: {0,1}byte = 8 bits (28) 256 values: {0,255}integer = 16 bits (216) 65536 values: {-32767,32765}...
Necessity of digital coding!
dz1
dz2
Thematic resolution

18 / 30
INTRODUCTION TO GIS: STRUCTURING GEOGRAPHIC INFORMATIONINTRODUCTION TO GIS: STRUCTURING GEOGRAPHIC INFORMATION
1
1 1 1
1
2
2
2
2
3
3 3 3
3
RASTER REPRESENTATION: RASTER REPRESENTATION:
LINES AND POINTSLINES AND POINTS
1
2
3
The value chosen for the empty cell is selected by convention.

19 / 30
INTRODUCTION TO GIS: STRUCTURING GEOGRAPHIC INFORMATIONINTRODUCTION TO GIS: STRUCTURING GEOGRAPHIC INFORMATION
RASTER REPRESENTATION: RASTER REPRESENTATION:
CONTINUOUS DATACONTINUOUS DATA
11.4 11.5 11.6 11.8 11.9 12.2 12.5 12.4 12.212.0
11.4 11.6 11.7 11.9 11.9 12.4 12.6 12.6 12.412.0
11.5 11.7 11.8 11.9 12.4
11.7 11.9 12.0 12.5 12.6
11.8 12.1 12.4 12.5 12.8
12.0 12.2 12.5 12.7 12.9
12.5 12.5 12.8
12.6 12.6 12.4 12.111.9
13.0 13.1 12.6 12.312.1
13.0 13.2 12.7 12.412.0
13.4 13.6 13.1 12.712.4
13.7 13.9 13.6 13.212.613.1 13.2
Direct representation of the
variable
Associated data: statistical
summary

20 / 30
INTRODUCTION TO GIS: STRUCTURING GEOGRAPHIC INFORMATIONINTRODUCTION TO GIS: STRUCTURING GEOGRAPHIC INFORMATION
DBMS LINK: DESCRIPTIVE DATADBMS LINK: DESCRIPTIVE DATAIdentifier Attributes of the
point
1
2
3
Identifier Attributes of the line
1
2
3
Identifier Attributes of the surface
1
2
3
LINK
Hybrid/integrated
STRUCTURING
Layer -- Table
1 1 1 1 1 1 1 1 1 1
1 1 1 1 1 1 1 1 1 1
1 1 1 1 1
2 2 2 2 2
2 2 2 2 2
2 2 2 2 2
2 2 2
3 3 3 3 3
3 3 3 3 3
3 3 3 3 3
3 3 3 3 3
3 3 3 3 33 3
1
1 1 1
1
2
2
2
2
3
3 3 3
3
1
2
3

21 / 30
INTRODUCTION TO GIS: STRUCTURING GEOGRAPHIC INFORMATIONINTRODUCTION TO GIS: STRUCTURING GEOGRAPHIC INFORMATION
RASTER REPRESENTATION: IMAGE DATARASTER REPRESENTATION: IMAGE DATA
Map (scanned)
Orthophotography
Digital Elevation Model

22 / 30
INTRODUCTION TO GIS: STRUCTURING GEOGRAPHIC INFORMATIONINTRODUCTION TO GIS: STRUCTURING GEOGRAPHIC INFORMATION
FROM VECTOR TO RASTER: RASTERIZATION
FROM RASTER TO VECTOR: VECTORIZATION
VECTOR/RASTER CONVERSIONSVECTOR/RASTER CONVERSIONS

23 / 30
INTRODUCTION TO GIS: STRUCTURING GEOGRAPHIC INFORMATIONINTRODUCTION TO GIS: STRUCTURING GEOGRAPHIC INFORMATION
VECTOR AND RASTER: VECTOR AND RASTER:
COMPLEMENTARITYCOMPLEMENTARITY• Raster:
– Grid of ‘independent’ cells
– Matrix calculations
– Redundancy – volume of information
• Vector:– Objects +- structured
– Information with low or no redundancy (depending on the structuring)
– Link with external databases
• Complementarity raster-vector
• Improvements in hardware architectures– Processor power / disk space
– Developments in raster solutions / image processing

24 / 30
INTRODUCTION TO GIS: STRUCTURING GEOGRAPHIC INFORMATIONINTRODUCTION TO GIS: STRUCTURING GEOGRAPHIC INFORMATION
SCALE AND ACCURACY SCALE AND ACCURACY -- 11
• Definition:Constant ratio between lengths measured on the map and the
corresponding lengths measured on the land.
• Expression:– Algebraic expression = scale ratio
map at 1:25,000
– Graphical expression by a scale bar representing the ratio
Graphical expression of scale: INDISPENSABLE
• Semantic confusion

25 / 30
INTRODUCTION TO GIS: STRUCTURING GEOGRAPHIC INFORMATIONINTRODUCTION TO GIS: STRUCTURING GEOGRAPHIC INFORMATION
• Significance of the scale:– Representation ratio
– Level of analysis of the studied phenomena
– Geometric accuracy of the information
• Level of approach of geographic space– Size of a zone representable at a given scale:
• A4 sheet: 600 km2 at 1:100,000
• … : 6 km2 at 1:10,000
– Level of analysis:
Compartment scale, regional scale, national scale
• Geometric accuracy of the information
SCALE AND ACCURACY SCALE AND ACCURACY -- 22

26 / 30
INTRODUCTION TO GIS: STRUCTURING GEOGRAPHIC INFORMATIONINTRODUCTION TO GIS: STRUCTURING GEOGRAPHIC INFORMATION
• Scale = representation ratioAccuracy = quality of geometric information
• 2 dimensions of accuracy:– resolution = size of an ‘elementary’ pixel
– localization accuracy: localization error
• Scale/accuracy confusion: 2 causes– assumption of the reader: each point is significant
– assumption of the producer: no unnecessary quality
• With ‘undesirable’ consequencesthe zoom syndrome
SCALE AND ACCURACY SCALE AND ACCURACY -- 33

27 / 30
INTRODUCTION TO GIS: STRUCTURING GEOGRAPHIC INFORMATIONINTRODUCTION TO GIS: STRUCTURING GEOGRAPHIC INFORMATION
GEOGRAPHIC DATA QUALITY GEOGRAPHIC DATA QUALITY -- 11
Hardwares
Softwares
Methods
Users
Data
• Key-element of
any GIS project
• 70 to 80 % of
total project costs

28 / 30
INTRODUCTION TO GIS: STRUCTURING GEOGRAPHIC INFORMATIONINTRODUCTION TO GIS: STRUCTURING GEOGRAPHIC INFORMATION
GEOGRAPHIC DATA QUALITY GEOGRAPHIC DATA QUALITY -- 22
• Acquiring data from:– Institutional: public agencies
– Private providers
– External contractors
– Internal digitalization
GIS software incorporate tools to create layer:
– features digitalization,
– calculation on one or many existing plans,
– Image processing

29 / 30
INTRODUCTION TO GIS: STRUCTURING GEOGRAPHIC INFORMATIONINTRODUCTION TO GIS: STRUCTURING GEOGRAPHIC INFORMATION
GEOGRAPHIC DATA QUALITY GEOGRAPHIC DATA QUALITY -- 33
• Which use ?– To use or extract information from this document
– As based map (illustration or filling)
– To take measurements
– To analyze simultaneously several information plans (spatial
analysis)
• Whatever use, consider :– Precision of imported data
– Level of detail
– Reference system used (compatibility with local database)
– Data property (copyright)
Information
to be stored
in metadata
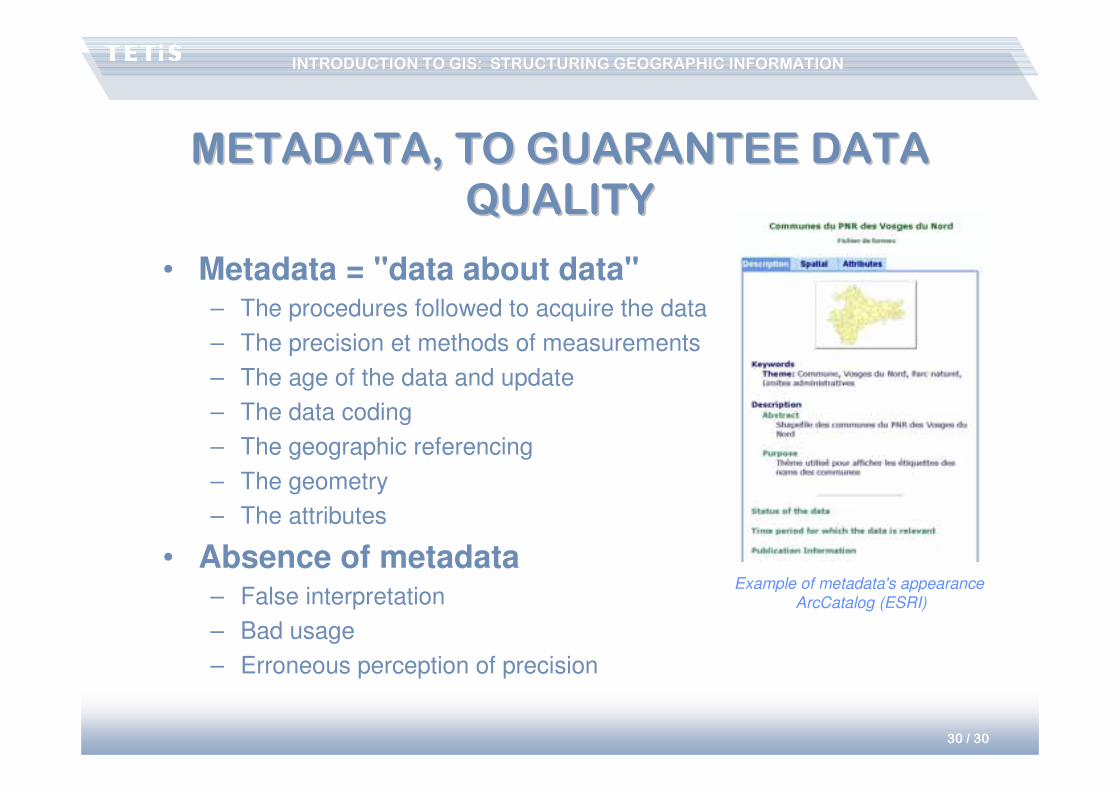
30 / 30
INTRODUCTION TO GIS: STRUCTURING GEOGRAPHIC INFORMATIONINTRODUCTION TO GIS: STRUCTURING GEOGRAPHIC INFORMATION
METADATA, TO GUARANTEE DATA METADATA, TO GUARANTEE DATA
QUALITYQUALITY
• Metadata = "data about data"– The procedures followed to acquire the data
– The precision et methods of measurements
– The age of the data and update
– The data coding
– The geographic referencing
– The geometry
– The attributes
• Absence of metadata– False interpretation
– Bad usage
– Erroneous perception of precision
Example of metadata's appearance
ArcCatalog (ESRI)

1
Territories, Environment, Remote Sensing & Spatial Information Joint Research Unit Cemagref - CIRAD - ENGREF
Pierre BAZILE
GIS: concepts, methods & toolsGIS: concepts, methods & tools
METIER METIER GraduateGraduate Training Course no. 2 Training Course no. 2 –– Montpellier Montpellier -- FebruaryFebruary 20072007
Information Management in Information Management in EnvironmentalEnvironmental SciencesSciences
Introduction to GISIntroduction to GIS
Structuring of geographic informationStructuring of geographic information

2 / 30
INTRODUCTION TO GIS: STRUCTURING GEOGRAPHIC INFORMATIONINTRODUCTION TO GIS: STRUCTURING GEOGRAPHIC INFORMATION
INFORMATION SYSTEM AND ORGANIZATIONINFORMATION SYSTEM AND ORGANIZATION
CONTROL SYSTEM
INFORMATION SYSTEM
Problem Decision
Requests Information
Inputs
Outputs
EXTERNAL
UNIVERSE
INFORMATION
BASE
STATIC
Data, rules, and
constraints of the
external universe
DYNAMIC
INFORMATION
PROCESSOR
Actions
Personnel

3 / 30
INTRODUCTION TO GIS: STRUCTURING GEOGRAPHIC INFORMATIONINTRODUCTION TO GIS: STRUCTURING GEOGRAPHIC INFORMATION
AUTOMATIZATION OF THE INFORMATION SYSTEMAUTOMATIZATION OF THE INFORMATION SYSTEM
AUTOMATIZED INFORMATION SYSTEM
Inputs
Outputs
FORMALISABLE
UNIVERSE
INFORMATION
BASE
STATIC DYNAMIC
INFORMATION
PROCESSOR
Personnel
Data
model
Computer
Software: DBMS
(Database management system)

4 / 30
INTRODUCTION TO GIS: STRUCTURING GEOGRAPHIC INFORMATIONINTRODUCTION TO GIS: STRUCTURING GEOGRAPHIC INFORMATION
SPATIAL REFERENCE INFORMATION SYSTEMSPATIAL REFERENCE INFORMATION SYSTEM
INFORMATION SYSTEM
Inputs
Outputs
INFORMATION
BASE
STATIC DYNAMIC
INFORMATION
PROCESSOR
Personnel
Semantic
data
model
Software: GISSpatial
data
model
Software: DBMS
Computer
(Geographic infomation system)

5 / 30
INTRODUCTION TO GIS: STRUCTURING GEOGRAPHIC INFORMATIONINTRODUCTION TO GIS: STRUCTURING GEOGRAPHIC INFORMATION
GIS: WHAT EXACTLY IS IT?GIS: WHAT EXACTLY IS IT?
The term GIS represents, in fact, 3 different concepts:
• An information system about a territory or project
• The databases describing this IS
• The IT solutions used (in particular: software)
One has to return to the basic concept!
Importance of the spatial component of the IS (localization of objects and processes, spatial interactions between elements)

6 / 30
INTRODUCTION TO GIS: STRUCTURING GEOGRAPHIC INFORMATIONINTRODUCTION TO GIS: STRUCTURING GEOGRAPHIC INFORMATION
REPRESENTING GEOGRAPHICAL DATAREPRESENTING GEOGRAPHICAL DATA
Duality of Geographical Information:
• Graphical information:The geographical objects, their localization, their topological relationships
• Thematic information:The descriptors of these objects, of these localizations
‘semantic’ data
500 Metres0
N

7 / 30
INTRODUCTION TO GIS: STRUCTURING GEOGRAPHIC INFORMATIONINTRODUCTION TO GIS: STRUCTURING GEOGRAPHIC INFORMATION
REPRESENTING GRAPHIC DATAREPRESENTING GRAPHIC DATA
Semantic
database
Semantic
database
Entities
Relationship
Spatial
representation
Spatial
representation
Entities
Relationships
Point
Line
Surface
Continuous
Tables
Adjacency
Inclusion
Proximity
Path
Link

8 / 30
INTRODUCTION TO GIS: STRUCTURING GEOGRAPHIC INFORMATIONINTRODUCTION TO GIS: STRUCTURING GEOGRAPHIC INFORMATION
CODING GEOMETRY : TWO MODESCODING GEOMETRY : TWO MODES
• image vs ‘line drawings’
• raster vs vector

9 / 30
INTRODUCTION TO GIS: STRUCTURING GEOGRAPHIC INFORMATIONINTRODUCTION TO GIS: STRUCTURING GEOGRAPHIC INFORMATION
VECTOR REPRESENTATIONVECTOR REPRESENTATION
bâtiment
route
lac

10 / 30
INTRODUCTION TO GIS: STRUCTURING GEOGRAPHIC INFORMATIONINTRODUCTION TO GIS: STRUCTURING GEOGRAPHIC INFORMATION
VECTOR REPRESENTATION: VECTOR REPRESENTATION:
‘SPAGHETTI’‘SPAGHETTI’
Point: Id,x,y +
Line: Id,
x0,y0x1,y1x2,y2.--------
xn,yn
Surface: Id,
x0,y0x1,y1x2,y2--------
xn,yn(x0,y0)
1 2
1 2 3
4 5 6
P1 P2
x1,y1 x2,y2
x2,y2 x3,y3
x5,y5 x6,y6
x4,y4 x5,y5x1,y1 x2,y2
Data redundancy
Undefined relationships

11 / 30
INTRODUCTION TO GIS: STRUCTURING GEOGRAPHIC INFORMATIONINTRODUCTION TO GIS: STRUCTURING GEOGRAPHIC INFORMATION
VECTOR REPRESENTATION:VECTOR REPRESENTATION:
NETWORK TOPOLOGYNETWORK TOPOLOGY
Point: Id,x,y +
Line: Id, (L)
Nax1,y1x2,y2.--------
Nb
Node: Id,x,y
Surface: Id,
L1L2----
Ln
1 2
1 2 3
4 5 6
No redundancy
Management of connectedness
L1 L2 L3
N1
N2
L1
N1x1,y1
x4,y4
N2
L2
N1N2
L3
N1x3,y3
x6,y6
N2
P1
L1
L2
P2
L2
L3
N1
x2,y2
N2
x5,y5

12 / 30
INTRODUCTION TO GIS: STRUCTURING GEOGRAPHIC INFORMATIONINTRODUCTION TO GIS: STRUCTURING GEOGRAPHIC INFORMATION
VECTOR REPRESENTATION: VECTOR REPRESENTATION:
SURFACE TOPOLOGYSURFACE TOPOLOGY
1 2
1 2 3
4 5 6
Management of connectedness
Management of contiguity
Point: Id,x,y +
Line: Id, (L), Pg,PdNax1,y1x2,y2.--------
Nb
Node: Id,x,y
Surface: Id,
L1L2----
Ln
L1 L2 L3
N1
N2
L1
N1
N2
P1U
L2
N1
N2
P2P1
L3
N1
N2
U
P2
P1
L1
L2
P2
L2
L3
N1
x2,y2
N2
x5,y5
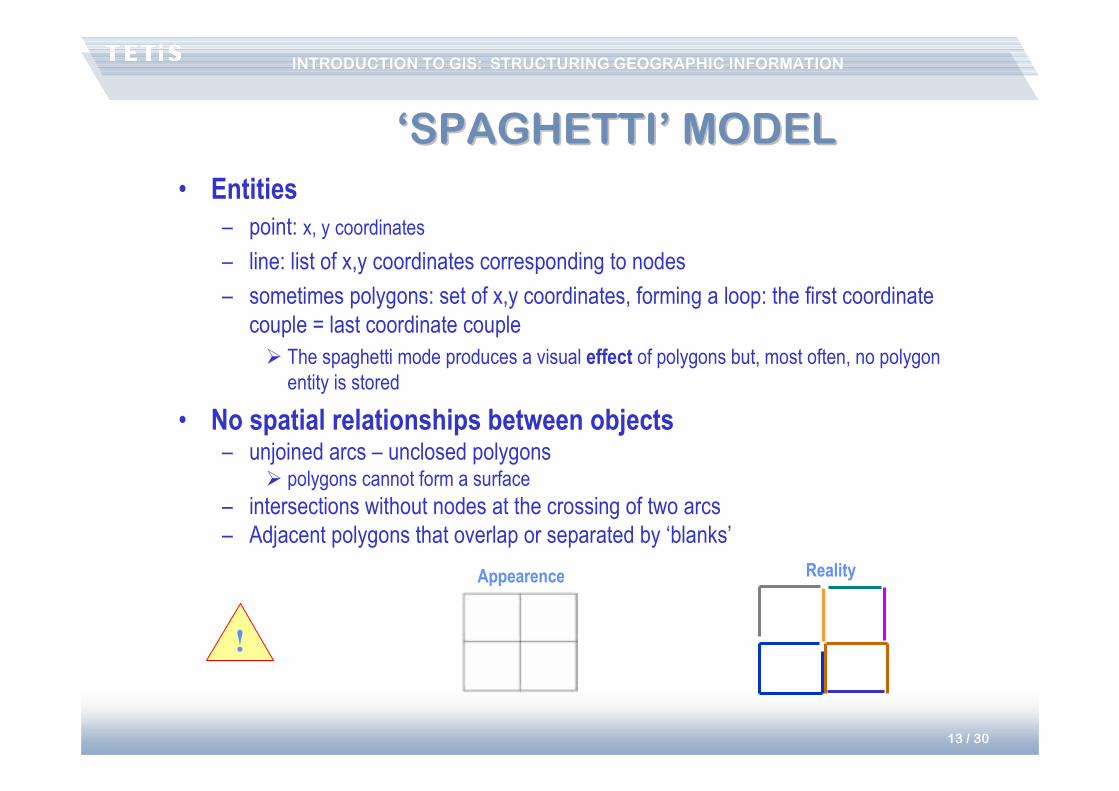
13 / 30
INTRODUCTION TO GIS: STRUCTURING GEOGRAPHIC INFORMATIONINTRODUCTION TO GIS: STRUCTURING GEOGRAPHIC INFORMATION
‘SPAGHETTI’ MODEL‘SPAGHETTI’ MODEL
• Entities
– point: x, y coordinates
– line: list of x,y coordinates corresponding to nodes
– sometimes polygons: set of x,y coordinates, forming a loop: the first coordinate
couple = last coordinate couple
� The spaghetti mode produces a visual effect of polygons but, most often, no polygon
entity is stored
• No spatial relationships between objects– unjoined arcs – unclosed polygons
� polygons cannot form a surface
– intersections without nodes at the crossing of two arcs
– Adjacent polygons that overlap or separated by ‘blanks’
Appearence
!
Reality

14 / 30
INTRODUCTION TO GIS: STRUCTURING GEOGRAPHIC INFORMATIONINTRODUCTION TO GIS: STRUCTURING GEOGRAPHIC INFORMATION
TOPOLOGICAL MODELTOPOLOGICAL MODEL
• Managing the connectedness and contiguity of objects
• 2 types of topology: – Planar topology
– Network topology
• Topological entities:– With permanent storage of the topology
• e.g.: ArcInfo coverage
– Taking into account only when editing (creating, updating); this data is called pseudo-topological.
• e.g.: shp (ArcView) or tab (MapInfo)
– With defined topological rules, varying depending on context
• e.g.: feature class within feature dataset in a geodatabase (ArcGIS)

15 / 30
INTRODUCTION TO GIS: STRUCTURING GEOGRAPHIC INFORMATIONINTRODUCTION TO GIS: STRUCTURING GEOGRAPHIC INFORMATION
DBMS LINK DESCRIPTIVE DATADBMS LINK DESCRIPTIVE DATA
Identifier Attributes of the surface
1
2
3
+1
+3+2
Identifier Attributes of the point
1
2
3
1
23
Identifier Attributes of the line
1
2
3
+1
+2
+3
LINK
Weak
Strong
Hybrid/Integrated
STRUCTURING
Layer -- Table

16 / 30
INTRODUCTION TO GIS: STRUCTURING GEOGRAPHIC INFORMATIONINTRODUCTION TO GIS: STRUCTURING GEOGRAPHIC INFORMATION
1 1 1 1 1 1 1 1 1 1
1 1 1 1 1 1 1 1 1 1
1 1 1 1 1
2 2 2 2 2
2 2 2 2 2
2 2 2 2 2
2 2 2
3 3 3 3 3
3 3 3 3 3
3 3 3 3 3
3 3 3 3 3
3 3 3 3 33 3
extent
in Y or
rows
extent in X or columns
dx
dy
Size of the cell
(geometrical resolution)
Origin (X,Y)
N (orientation)
id attribute
1
2
3
Wheat
Grapevine
Forest
Identifier
RASTER PRESENTATIONRASTER PRESENTATION

17 / 30
INTRODUCTION TO GIS: STRUCTURING GEOGRAPHIC INFORMATIONINTRODUCTION TO GIS: STRUCTURING GEOGRAPHIC INFORMATION
RASTER REPRESENTATION: IMAGE DEPTHRASTER REPRESENTATION: IMAGE DEPTH
�Number of planes
�Depth of each planeboolean = 1 bit (21) 2 values: {0,1}byte = 8 bits (28) 256 values: {0,255}integer = 16 bits (216) 65536 values: {-32767,32765}...
Necessity of digital coding!
dz1
dz2
Thematic resolution

18 / 30
INTRODUCTION TO GIS: STRUCTURING GEOGRAPHIC INFORMATIONINTRODUCTION TO GIS: STRUCTURING GEOGRAPHIC INFORMATION
1
1 1 1
1
2
2
2
2
3
3 3 3
3
RASTER REPRESENTATION: RASTER REPRESENTATION:
LINES AND POINTSLINES AND POINTS
1
2
3
The value chosen for the empty cell is selected by convention.

19 / 30
INTRODUCTION TO GIS: STRUCTURING GEOGRAPHIC INFORMATIONINTRODUCTION TO GIS: STRUCTURING GEOGRAPHIC INFORMATION
RASTER REPRESENTATION: RASTER REPRESENTATION:
CONTINUOUS DATACONTINUOUS DATA
11.4 11.5 11.6 11.8 11.9 12.2 12.5 12.4 12.212.0
11.4 11.6 11.7 11.9 11.9 12.4 12.6 12.6 12.412.0
11.5 11.7 11.8 11.9 12.4
11.7 11.9 12.0 12.5 12.6
11.8 12.1 12.4 12.5 12.8
12.0 12.2 12.5 12.7 12.9
12.5 12.5 12.8
12.6 12.6 12.4 12.111.9
13.0 13.1 12.6 12.312.1
13.0 13.2 12.7 12.412.0
13.4 13.6 13.1 12.712.4
13.7 13.9 13.6 13.212.613.1 13.2
Direct representation of the
variable
Associated data: statistical
summary

20 / 30
INTRODUCTION TO GIS: STRUCTURING GEOGRAPHIC INFORMATIONINTRODUCTION TO GIS: STRUCTURING GEOGRAPHIC INFORMATION
DBMS LINK: DESCRIPTIVE DATADBMS LINK: DESCRIPTIVE DATAIdentifier Attributes of the
point
1
2
3
Identifier Attributes of the line
1
2
3
Identifier Attributes of the surface
1
2
3
LINK
Hybrid/integrated
STRUCTURING
Layer -- Table
1 1 1 1 1 1 1 1 1 1
1 1 1 1 1 1 1 1 1 1
1 1 1 1 1
2 2 2 2 2
2 2 2 2 2
2 2 2 2 2
2 2 2
3 3 3 3 3
3 3 3 3 3
3 3 3 3 3
3 3 3 3 3
3 3 3 3 33 3
1
1 1 1
1
2
2
2
2
3
3 3 3
3
1
2
3
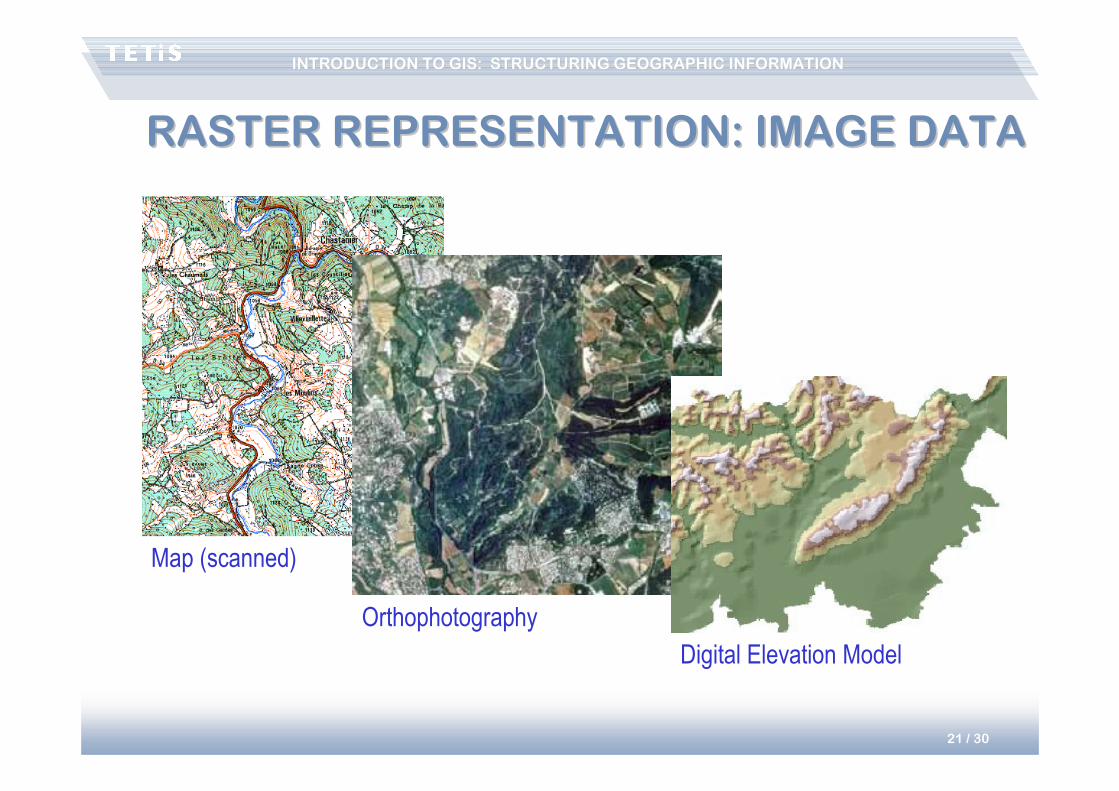
21 / 30
INTRODUCTION TO GIS: STRUCTURING GEOGRAPHIC INFORMATIONINTRODUCTION TO GIS: STRUCTURING GEOGRAPHIC INFORMATION
RASTER REPRESENTATION: IMAGE DATARASTER REPRESENTATION: IMAGE DATA
Map (scanned)
Orthophotography
Digital Elevation Model

22 / 30
INTRODUCTION TO GIS: STRUCTURING GEOGRAPHIC INFORMATIONINTRODUCTION TO GIS: STRUCTURING GEOGRAPHIC INFORMATION
FROM VECTOR TO RASTER: RASTERIZATION
FROM RASTER TO VECTOR: VECTORIZATION
VECTOR/RASTER CONVERSIONSVECTOR/RASTER CONVERSIONS

23 / 30
INTRODUCTION TO GIS: STRUCTURING GEOGRAPHIC INFORMATIONINTRODUCTION TO GIS: STRUCTURING GEOGRAPHIC INFORMATION
VECTOR AND RASTER: VECTOR AND RASTER:
COMPLEMENTARITYCOMPLEMENTARITY• Raster:
– Grid of ‘independent’ cells
– Matrix calculations
– Redundancy – volume of information
• Vector:– Objects +- structured
– Information with low or no redundancy (depending on the structuring)
– Link with external databases
• Complementarity raster-vector
• Improvements in hardware architectures– Processor power / disk space
– Developments in raster solutions / image processing

24 / 30
INTRODUCTION TO GIS: STRUCTURING GEOGRAPHIC INFORMATIONINTRODUCTION TO GIS: STRUCTURING GEOGRAPHIC INFORMATION
SCALE AND ACCURACY SCALE AND ACCURACY -- 11
• Definition:Constant ratio between lengths measured on the map and the
corresponding lengths measured on the land.
• Expression:– Algebraic expression = scale ratio
map at 1:25,000
– Graphical expression by a scale bar representing the ratio
Graphical expression of scale: INDISPENSABLE
• Semantic confusion

25 / 30
INTRODUCTION TO GIS: STRUCTURING GEOGRAPHIC INFORMATIONINTRODUCTION TO GIS: STRUCTURING GEOGRAPHIC INFORMATION
• Significance of the scale:– Representation ratio
– Level of analysis of the studied phenomena
– Geometric accuracy of the information
• Level of approach of geographic space– Size of a zone representable at a given scale:
• A4 sheet: 600 km2 at 1:100,000
• … : 6 km2 at 1:10,000
– Level of analysis:
Compartment scale, regional scale, national scale
• Geometric accuracy of the information
SCALE AND ACCURACY SCALE AND ACCURACY -- 22

26 / 30
INTRODUCTION TO GIS: STRUCTURING GEOGRAPHIC INFORMATIONINTRODUCTION TO GIS: STRUCTURING GEOGRAPHIC INFORMATION
• Scale = representation ratioAccuracy = quality of geometric information
• 2 dimensions of accuracy:– resolution = size of an ‘elementary’ pixel
– localization accuracy: localization error
• Scale/accuracy confusion: 2 causes– assumption of the reader: each point is significant
– assumption of the producer: no unnecessary quality
• With ‘undesirable’ consequencesthe zoom syndrome
SCALE AND ACCURACY SCALE AND ACCURACY -- 33

27 / 30
INTRODUCTION TO GIS: STRUCTURING GEOGRAPHIC INFORMATIONINTRODUCTION TO GIS: STRUCTURING GEOGRAPHIC INFORMATION
GEOGRAPHIC DATA QUALITY GEOGRAPHIC DATA QUALITY -- 11
Hardwares
Softwares
Methods
Users
Data
• Key-element of
any GIS project
• 70 to 80 % of
total project costs

28 / 30
INTRODUCTION TO GIS: STRUCTURING GEOGRAPHIC INFORMATIONINTRODUCTION TO GIS: STRUCTURING GEOGRAPHIC INFORMATION
GEOGRAPHIC DATA QUALITY GEOGRAPHIC DATA QUALITY -- 22
• Acquiring data from:– Institutional: public agencies
– Private providers
– External contractors
– Internal digitalization
GIS software incorporate tools to create layer:
– features digitalization,
– calculation on one or many existing plans,
– Image processing

29 / 30
INTRODUCTION TO GIS: STRUCTURING GEOGRAPHIC INFORMATIONINTRODUCTION TO GIS: STRUCTURING GEOGRAPHIC INFORMATION
GEOGRAPHIC DATA QUALITY GEOGRAPHIC DATA QUALITY -- 33
• Which use ?– To use or extract information from this document
– As based map (illustration or filling)
– To take measurements
– To analyze simultaneously several information plans (spatial
analysis)
• Whatever use, consider :– Precision of imported data
– Level of detail
– Reference system used (compatibility with local database)
– Data property (copyright)
Information
to be stored
in metadata

30 / 30
INTRODUCTION TO GIS: STRUCTURING GEOGRAPHIC INFORMATIONINTRODUCTION TO GIS: STRUCTURING GEOGRAPHIC INFORMATION
METADATA, TO GUARANTEE DATA METADATA, TO GUARANTEE DATA
QUALITYQUALITY
• Metadata = "data about data"– The procedures followed to acquire the data
– The precision et methods of measurements
– The age of the data and update
– The data coding
– The geographic referencing
– The geometry
– The attributes
• Absence of metadata– False interpretation
– Bad usage
– Erroneous perception of precision
Example of metadata's appearance
ArcCatalog (ESRI)

1
Territories, Environment, Remote Sensing & Spatial Information Joint Research Unit Cemagref - CIRAD - ENGREF
Pierre BAZILE
GIS: concepts, methods & toolsGIS: concepts, methods & tools
METIER METIER GraduateGraduate Training Course no. 2 Training Course no. 2 –– Montpellier Montpellier -- FebruaryFebruary 20072007
Information Management in Information Management in EnvironmentalEnvironmental SciencesSciences
Introduction to GISIntroduction to GIS
Structuring of geographic informationStructuring of geographic information

2 / 30
INTRODUCTION TO GIS: STRUCTURING GEOGRAPHIC INFORMATIONINTRODUCTION TO GIS: STRUCTURING GEOGRAPHIC INFORMATION
INFORMATION SYSTEM AND ORGANIZATIONINFORMATION SYSTEM AND ORGANIZATION
CONTROL SYSTEM
INFORMATION SYSTEM
Problem Decision
Requests Information
Inputs
Outputs
EXTERNAL
UNIVERSE
INFORMATION
BASE
STATIC
Data, rules, and
constraints of the
external universe
DYNAMIC
INFORMATION
PROCESSOR
Actions
Personnel

3 / 30
INTRODUCTION TO GIS: STRUCTURING GEOGRAPHIC INFORMATIONINTRODUCTION TO GIS: STRUCTURING GEOGRAPHIC INFORMATION
AUTOMATIZATION OF THE INFORMATION SYSTEMAUTOMATIZATION OF THE INFORMATION SYSTEM
AUTOMATIZED INFORMATION SYSTEM
Inputs
Outputs
FORMALISABLE
UNIVERSE
INFORMATION
BASE
STATIC DYNAMIC
INFORMATION
PROCESSOR
Personnel
Data
model
Computer
Software: DBMS
(Database management system)

4 / 30
INTRODUCTION TO GIS: STRUCTURING GEOGRAPHIC INFORMATIONINTRODUCTION TO GIS: STRUCTURING GEOGRAPHIC INFORMATION
SPATIAL REFERENCE INFORMATION SYSTEMSPATIAL REFERENCE INFORMATION SYSTEM
INFORMATION SYSTEM
Inputs
Outputs
INFORMATION
BASE
STATIC DYNAMIC
INFORMATION
PROCESSOR
Personnel
Semantic
data
model
Software: GISSpatial
data
model
Software: DBMS
Computer
(Geographic infomation system)

5 / 30
INTRODUCTION TO GIS: STRUCTURING GEOGRAPHIC INFORMATIONINTRODUCTION TO GIS: STRUCTURING GEOGRAPHIC INFORMATION
GIS: WHAT EXACTLY IS IT?GIS: WHAT EXACTLY IS IT?
The term GIS represents, in fact, 3 different concepts:
• An information system about a territory or project
• The databases describing this IS
• The IT solutions used (in particular: software)
One has to return to the basic concept!
Importance of the spatial component of the IS (localization of objects and processes, spatial interactions between elements)

6 / 30
INTRODUCTION TO GIS: STRUCTURING GEOGRAPHIC INFORMATIONINTRODUCTION TO GIS: STRUCTURING GEOGRAPHIC INFORMATION
REPRESENTING GEOGRAPHICAL DATAREPRESENTING GEOGRAPHICAL DATA
Duality of Geographical Information:
• Graphical information:The geographical objects, their localization, their topological relationships
• Thematic information:The descriptors of these objects, of these localizations
‘semantic’ data
500 Metres0
N

7 / 30
INTRODUCTION TO GIS: STRUCTURING GEOGRAPHIC INFORMATIONINTRODUCTION TO GIS: STRUCTURING GEOGRAPHIC INFORMATION
REPRESENTING GRAPHIC DATAREPRESENTING GRAPHIC DATA
Semantic
database
Semantic
database
Entities
Relationship
Spatial
representation
Spatial
representation
Entities
Relationships
Point
Line
Surface
Continuous
Tables
Adjacency
Inclusion
Proximity
Path
Link

8 / 30
INTRODUCTION TO GIS: STRUCTURING GEOGRAPHIC INFORMATIONINTRODUCTION TO GIS: STRUCTURING GEOGRAPHIC INFORMATION
CODING GEOMETRY : TWO MODESCODING GEOMETRY : TWO MODES
• image vs ‘line drawings’
• raster vs vector
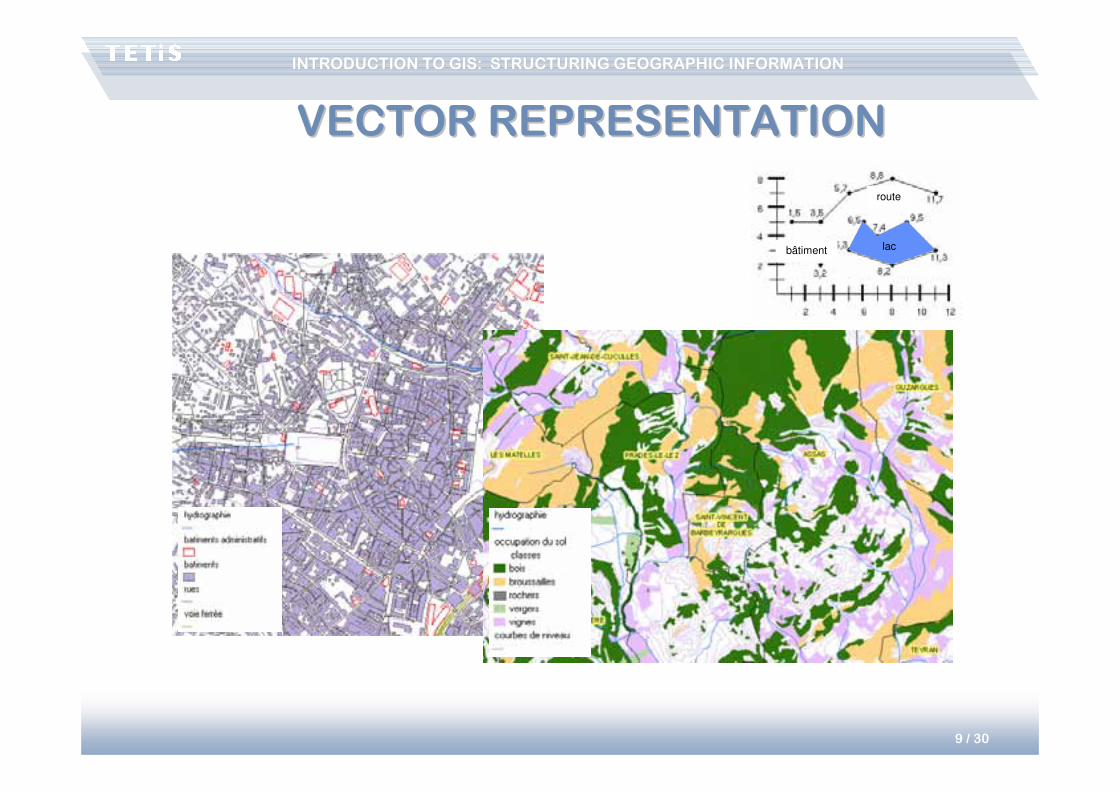
9 / 30
INTRODUCTION TO GIS: STRUCTURING GEOGRAPHIC INFORMATIONINTRODUCTION TO GIS: STRUCTURING GEOGRAPHIC INFORMATION
VECTOR REPRESENTATIONVECTOR REPRESENTATION
bâtiment
route
lac

10 / 30
INTRODUCTION TO GIS: STRUCTURING GEOGRAPHIC INFORMATIONINTRODUCTION TO GIS: STRUCTURING GEOGRAPHIC INFORMATION
VECTOR REPRESENTATION: VECTOR REPRESENTATION:
‘SPAGHETTI’‘SPAGHETTI’
Point: Id,x,y +
Line: Id,
x0,y0x1,y1x2,y2.--------
xn,yn
Surface: Id,
x0,y0x1,y1x2,y2--------
xn,yn(x0,y0)
1 2
1 2 3
4 5 6
P1 P2
x1,y1 x2,y2
x2,y2 x3,y3
x5,y5 x6,y6
x4,y4 x5,y5x1,y1 x2,y2
Data redundancy
Undefined relationships

11 / 30
INTRODUCTION TO GIS: STRUCTURING GEOGRAPHIC INFORMATIONINTRODUCTION TO GIS: STRUCTURING GEOGRAPHIC INFORMATION
VECTOR REPRESENTATION:VECTOR REPRESENTATION:
NETWORK TOPOLOGYNETWORK TOPOLOGY
Point: Id,x,y +
Line: Id, (L)
Nax1,y1x2,y2.--------
Nb
Node: Id,x,y
Surface: Id,
L1L2----
Ln
1 2
1 2 3
4 5 6
No redundancy
Management of connectedness
L1 L2 L3
N1
N2
L1
N1x1,y1
x4,y4
N2
L2
N1N2
L3
N1x3,y3
x6,y6
N2
P1
L1
L2
P2
L2
L3
N1
x2,y2
N2
x5,y5

12 / 30
INTRODUCTION TO GIS: STRUCTURING GEOGRAPHIC INFORMATIONINTRODUCTION TO GIS: STRUCTURING GEOGRAPHIC INFORMATION
VECTOR REPRESENTATION: VECTOR REPRESENTATION:
SURFACE TOPOLOGYSURFACE TOPOLOGY
1 2
1 2 3
4 5 6
Management of connectedness
Management of contiguity
Point: Id,x,y +
Line: Id, (L), Pg,PdNax1,y1x2,y2.--------
Nb
Node: Id,x,y
Surface: Id,
L1L2----
Ln
L1 L2 L3
N1
N2
L1
N1
N2
P1U
L2
N1
N2
P2P1
L3
N1
N2
U
P2
P1
L1
L2
P2
L2
L3
N1
x2,y2
N2
x5,y5

13 / 30
INTRODUCTION TO GIS: STRUCTURING GEOGRAPHIC INFORMATIONINTRODUCTION TO GIS: STRUCTURING GEOGRAPHIC INFORMATION
‘SPAGHETTI’ MODEL‘SPAGHETTI’ MODEL
• Entities
– point: x, y coordinates
– line: list of x,y coordinates corresponding to nodes
– sometimes polygons: set of x,y coordinates, forming a loop: the first coordinate
couple = last coordinate couple
� The spaghetti mode produces a visual effect of polygons but, most often, no polygon
entity is stored
• No spatial relationships between objects– unjoined arcs – unclosed polygons
� polygons cannot form a surface
– intersections without nodes at the crossing of two arcs
– Adjacent polygons that overlap or separated by ‘blanks’
Appearence
!
Reality

14 / 30
INTRODUCTION TO GIS: STRUCTURING GEOGRAPHIC INFORMATIONINTRODUCTION TO GIS: STRUCTURING GEOGRAPHIC INFORMATION
TOPOLOGICAL MODELTOPOLOGICAL MODEL
• Managing the connectedness and contiguity of objects
• 2 types of topology: – Planar topology
– Network topology
• Topological entities:– With permanent storage of the topology
• e.g.: ArcInfo coverage
– Taking into account only when editing (creating, updating); this data is called pseudo-topological.
• e.g.: shp (ArcView) or tab (MapInfo)
– With defined topological rules, varying depending on context
• e.g.: feature class within feature dataset in a geodatabase (ArcGIS)

15 / 30
INTRODUCTION TO GIS: STRUCTURING GEOGRAPHIC INFORMATIONINTRODUCTION TO GIS: STRUCTURING GEOGRAPHIC INFORMATION
DBMS LINK DESCRIPTIVE DATADBMS LINK DESCRIPTIVE DATA
Identifier Attributes of the surface
1
2
3
+1
+3+2
Identifier Attributes of the point
1
2
3
1
23
Identifier Attributes of the line
1
2
3
+1
+2
+3
LINK
Weak
Strong
Hybrid/Integrated
STRUCTURING
Layer -- Table

16 / 30
INTRODUCTION TO GIS: STRUCTURING GEOGRAPHIC INFORMATIONINTRODUCTION TO GIS: STRUCTURING GEOGRAPHIC INFORMATION
1 1 1 1 1 1 1 1 1 1
1 1 1 1 1 1 1 1 1 1
1 1 1 1 1
2 2 2 2 2
2 2 2 2 2
2 2 2 2 2
2 2 2
3 3 3 3 3
3 3 3 3 3
3 3 3 3 3
3 3 3 3 3
3 3 3 3 33 3
extent
in Y or
rows
extent in X or columns
dx
dy
Size of the cell
(geometrical resolution)
Origin (X,Y)
N (orientation)
id attribute
1
2
3
Wheat
Grapevine
Forest
Identifier
RASTER PRESENTATIONRASTER PRESENTATION

17 / 30
INTRODUCTION TO GIS: STRUCTURING GEOGRAPHIC INFORMATIONINTRODUCTION TO GIS: STRUCTURING GEOGRAPHIC INFORMATION
RASTER REPRESENTATION: IMAGE DEPTHRASTER REPRESENTATION: IMAGE DEPTH
�Number of planes
�Depth of each planeboolean = 1 bit (21) 2 values: {0,1}byte = 8 bits (28) 256 values: {0,255}integer = 16 bits (216) 65536 values: {-32767,32765}...
Necessity of digital coding!
dz1
dz2
Thematic resolution

18 / 30
INTRODUCTION TO GIS: STRUCTURING GEOGRAPHIC INFORMATIONINTRODUCTION TO GIS: STRUCTURING GEOGRAPHIC INFORMATION
1
1 1 1
1
2
2
2
2
3
3 3 3
3
RASTER REPRESENTATION: RASTER REPRESENTATION:
LINES AND POINTSLINES AND POINTS
1
2
3
The value chosen for the empty cell is selected by convention.

19 / 30
INTRODUCTION TO GIS: STRUCTURING GEOGRAPHIC INFORMATIONINTRODUCTION TO GIS: STRUCTURING GEOGRAPHIC INFORMATION
RASTER REPRESENTATION: RASTER REPRESENTATION:
CONTINUOUS DATACONTINUOUS DATA
11.4 11.5 11.6 11.8 11.9 12.2 12.5 12.4 12.212.0
11.4 11.6 11.7 11.9 11.9 12.4 12.6 12.6 12.412.0
11.5 11.7 11.8 11.9 12.4
11.7 11.9 12.0 12.5 12.6
11.8 12.1 12.4 12.5 12.8
12.0 12.2 12.5 12.7 12.9
12.5 12.5 12.8
12.6 12.6 12.4 12.111.9
13.0 13.1 12.6 12.312.1
13.0 13.2 12.7 12.412.0
13.4 13.6 13.1 12.712.4
13.7 13.9 13.6 13.212.613.1 13.2
Direct representation of the
variable
Associated data: statistical
summary

20 / 30
INTRODUCTION TO GIS: STRUCTURING GEOGRAPHIC INFORMATIONINTRODUCTION TO GIS: STRUCTURING GEOGRAPHIC INFORMATION
DBMS LINK: DESCRIPTIVE DATADBMS LINK: DESCRIPTIVE DATAIdentifier Attributes of the
point
1
2
3
Identifier Attributes of the line
1
2
3
Identifier Attributes of the surface
1
2
3
LINK
Hybrid/integrated
STRUCTURING
Layer -- Table
1 1 1 1 1 1 1 1 1 1
1 1 1 1 1 1 1 1 1 1
1 1 1 1 1
2 2 2 2 2
2 2 2 2 2
2 2 2 2 2
2 2 2
3 3 3 3 3
3 3 3 3 3
3 3 3 3 3
3 3 3 3 3
3 3 3 3 33 3
1
1 1 1
1
2
2
2
2
3
3 3 3
3
1
2
3

21 / 30
INTRODUCTION TO GIS: STRUCTURING GEOGRAPHIC INFORMATIONINTRODUCTION TO GIS: STRUCTURING GEOGRAPHIC INFORMATION
RASTER REPRESENTATION: IMAGE DATARASTER REPRESENTATION: IMAGE DATA
Map (scanned)
Orthophotography
Digital Elevation Model

22 / 30
INTRODUCTION TO GIS: STRUCTURING GEOGRAPHIC INFORMATIONINTRODUCTION TO GIS: STRUCTURING GEOGRAPHIC INFORMATION
FROM VECTOR TO RASTER: RASTERIZATION
FROM RASTER TO VECTOR: VECTORIZATION
VECTOR/RASTER CONVERSIONSVECTOR/RASTER CONVERSIONS

23 / 30
INTRODUCTION TO GIS: STRUCTURING GEOGRAPHIC INFORMATIONINTRODUCTION TO GIS: STRUCTURING GEOGRAPHIC INFORMATION
VECTOR AND RASTER: VECTOR AND RASTER:
COMPLEMENTARITYCOMPLEMENTARITY• Raster:
– Grid of ‘independent’ cells
– Matrix calculations
– Redundancy – volume of information
• Vector:– Objects +- structured
– Information with low or no redundancy (depending on the structuring)
– Link with external databases
• Complementarity raster-vector
• Improvements in hardware architectures– Processor power / disk space
– Developments in raster solutions / image processing

24 / 30
INTRODUCTION TO GIS: STRUCTURING GEOGRAPHIC INFORMATIONINTRODUCTION TO GIS: STRUCTURING GEOGRAPHIC INFORMATION
SCALE AND ACCURACY SCALE AND ACCURACY -- 11
• Definition:Constant ratio between lengths measured on the map and the
corresponding lengths measured on the land.
• Expression:– Algebraic expression = scale ratio
map at 1:25,000
– Graphical expression by a scale bar representing the ratio
Graphical expression of scale: INDISPENSABLE
• Semantic confusion

25 / 30
INTRODUCTION TO GIS: STRUCTURING GEOGRAPHIC INFORMATIONINTRODUCTION TO GIS: STRUCTURING GEOGRAPHIC INFORMATION
• Significance of the scale:– Representation ratio
– Level of analysis of the studied phenomena
– Geometric accuracy of the information
• Level of approach of geographic space– Size of a zone representable at a given scale:
• A4 sheet: 600 km2 at 1:100,000
• … : 6 km2 at 1:10,000
– Level of analysis:
Compartment scale, regional scale, national scale
• Geometric accuracy of the information
SCALE AND ACCURACY SCALE AND ACCURACY -- 22

26 / 30
INTRODUCTION TO GIS: STRUCTURING GEOGRAPHIC INFORMATIONINTRODUCTION TO GIS: STRUCTURING GEOGRAPHIC INFORMATION
• Scale = representation ratioAccuracy = quality of geometric information
• 2 dimensions of accuracy:– resolution = size of an ‘elementary’ pixel
– localization accuracy: localization error
• Scale/accuracy confusion: 2 causes– assumption of the reader: each point is significant
– assumption of the producer: no unnecessary quality
• With ‘undesirable’ consequencesthe zoom syndrome
SCALE AND ACCURACY SCALE AND ACCURACY -- 33
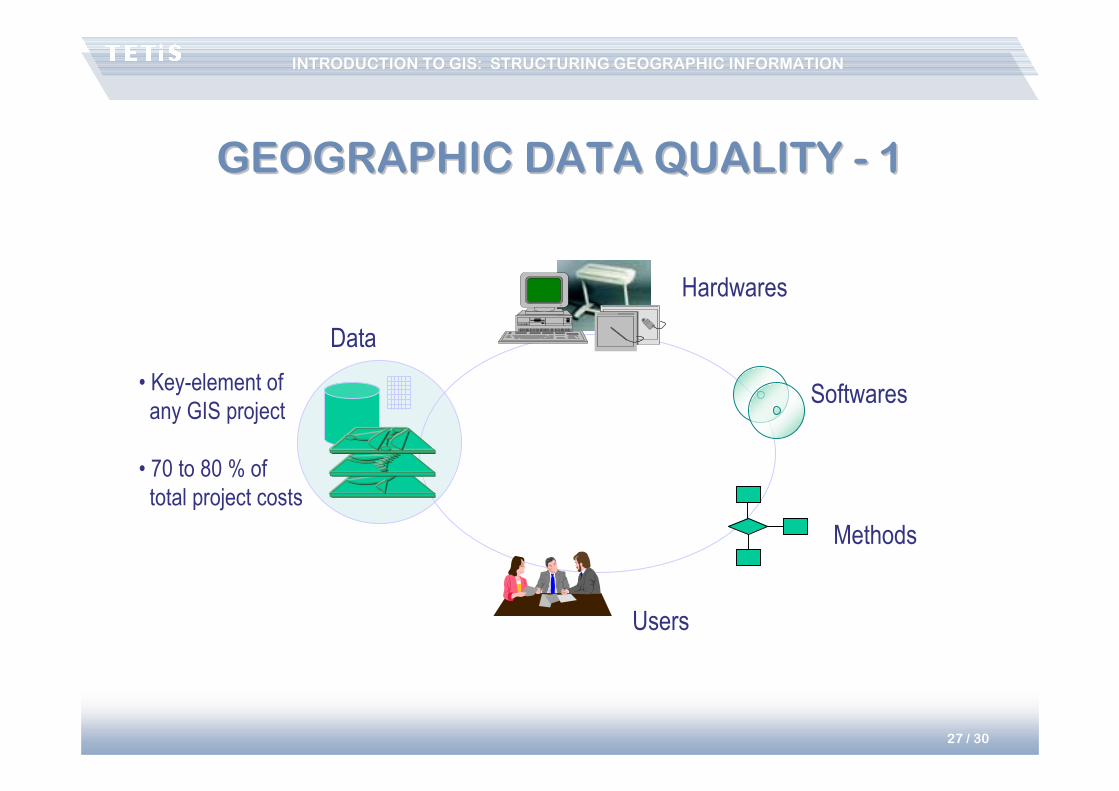
27 / 30
INTRODUCTION TO GIS: STRUCTURING GEOGRAPHIC INFORMATIONINTRODUCTION TO GIS: STRUCTURING GEOGRAPHIC INFORMATION
GEOGRAPHIC DATA QUALITY GEOGRAPHIC DATA QUALITY -- 11
Hardwares
Softwares
Methods
Users
Data
• Key-element of
any GIS project
• 70 to 80 % of
total project costs

28 / 30
INTRODUCTION TO GIS: STRUCTURING GEOGRAPHIC INFORMATIONINTRODUCTION TO GIS: STRUCTURING GEOGRAPHIC INFORMATION
GEOGRAPHIC DATA QUALITY GEOGRAPHIC DATA QUALITY -- 22
• Acquiring data from:– Institutional: public agencies
– Private providers
– External contractors
– Internal digitalization
GIS software incorporate tools to create layer:
– features digitalization,
– calculation on one or many existing plans,
– Image processing
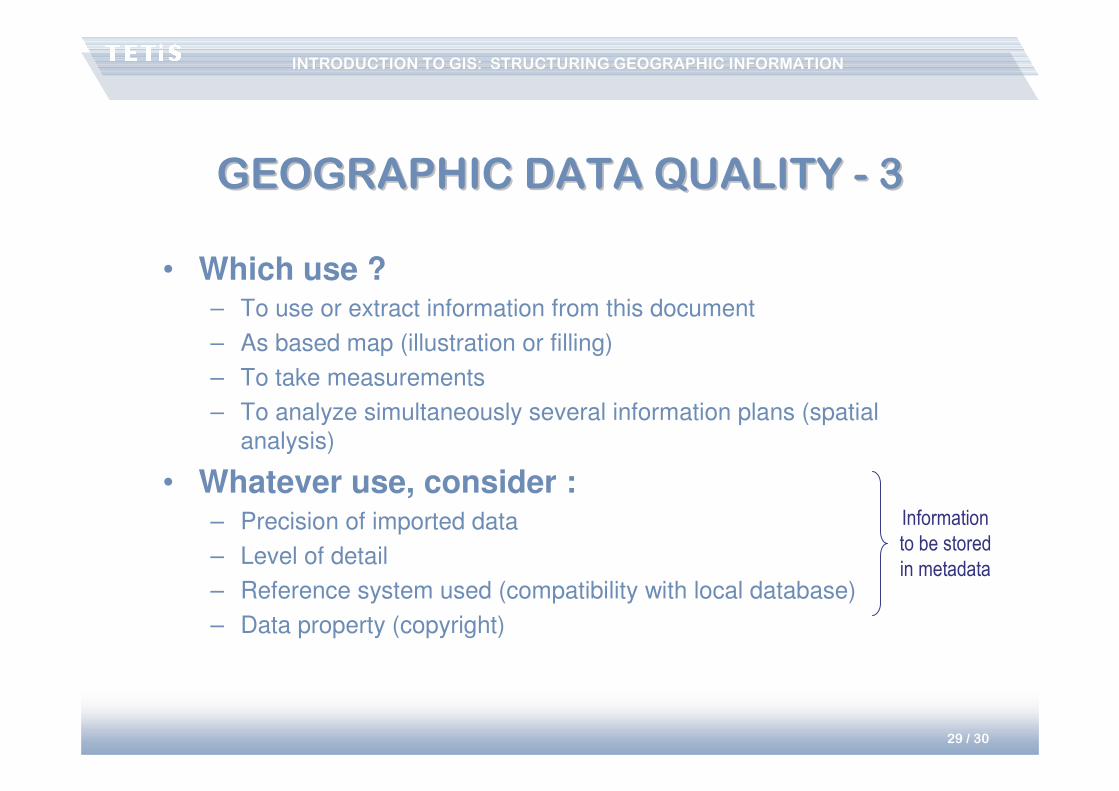
29 / 30
INTRODUCTION TO GIS: STRUCTURING GEOGRAPHIC INFORMATIONINTRODUCTION TO GIS: STRUCTURING GEOGRAPHIC INFORMATION
GEOGRAPHIC DATA QUALITY GEOGRAPHIC DATA QUALITY -- 33
• Which use ?– To use or extract information from this document
– As based map (illustration or filling)
– To take measurements
– To analyze simultaneously several information plans (spatial
analysis)
• Whatever use, consider :– Precision of imported data
– Level of detail
– Reference system used (compatibility with local database)
– Data property (copyright)
Information
to be stored
in metadata

30 / 30
INTRODUCTION TO GIS: STRUCTURING GEOGRAPHIC INFORMATIONINTRODUCTION TO GIS: STRUCTURING GEOGRAPHIC INFORMATION
METADATA, TO GUARANTEE DATA METADATA, TO GUARANTEE DATA
QUALITYQUALITY
• Metadata = "data about data"– The procedures followed to acquire the data
– The precision et methods of measurements
– The age of the data and update
– The data coding
– The geographic referencing
– The geometry
– The attributes
• Absence of metadata– False interpretation
– Bad usage
– Erroneous perception of precision
Example of metadata's appearance
ArcCatalog (ESRI)

1
Territories, Environment, Remote Sensing & Spatial Information Joint Research Unit Cemagref - CIRAD - ENGREF
Pierre BAZILE
GIS: concepts, methods & toolsGIS: concepts, methods & tools
METIER METIER GraduateGraduate Training Course no. 2 Training Course no. 2 –– Montpellier Montpellier -- FebruaryFebruary 20072007
Information Management in Information Management in EnvironmentalEnvironmental SciencesSciences
Introduction to GISIntroduction to GIS
Structuring of geographic informationStructuring of geographic information

2 / 30
INTRODUCTION TO GIS: STRUCTURING GEOGRAPHIC INFORMATIONINTRODUCTION TO GIS: STRUCTURING GEOGRAPHIC INFORMATION
INFORMATION SYSTEM AND ORGANIZATIONINFORMATION SYSTEM AND ORGANIZATION
CONTROL SYSTEM
INFORMATION SYSTEM
Problem Decision
Requests Information
Inputs
Outputs
EXTERNAL
UNIVERSE
INFORMATION
BASE
STATIC
Data, rules, and
constraints of the
external universe
DYNAMIC
INFORMATION
PROCESSOR
Actions
Personnel

3 / 30
INTRODUCTION TO GIS: STRUCTURING GEOGRAPHIC INFORMATIONINTRODUCTION TO GIS: STRUCTURING GEOGRAPHIC INFORMATION
AUTOMATIZATION OF THE INFORMATION SYSTEMAUTOMATIZATION OF THE INFORMATION SYSTEM
AUTOMATIZED INFORMATION SYSTEM
Inputs
Outputs
FORMALISABLE
UNIVERSE
INFORMATION
BASE
STATIC DYNAMIC
INFORMATION
PROCESSOR
Personnel
Data
model
Computer
Software: DBMS
(Database management system)

4 / 30
INTRODUCTION TO GIS: STRUCTURING GEOGRAPHIC INFORMATIONINTRODUCTION TO GIS: STRUCTURING GEOGRAPHIC INFORMATION
SPATIAL REFERENCE INFORMATION SYSTEMSPATIAL REFERENCE INFORMATION SYSTEM
INFORMATION SYSTEM
Inputs
Outputs
INFORMATION
BASE
STATIC DYNAMIC
INFORMATION
PROCESSOR
Personnel
Semantic
data
model
Software: GISSpatial
data
model
Software: DBMS
Computer
(Geographic infomation system)

5 / 30
INTRODUCTION TO GIS: STRUCTURING GEOGRAPHIC INFORMATIONINTRODUCTION TO GIS: STRUCTURING GEOGRAPHIC INFORMATION
GIS: WHAT EXACTLY IS IT?GIS: WHAT EXACTLY IS IT?
The term GIS represents, in fact, 3 different concepts:
• An information system about a territory or project
• The databases describing this IS
• The IT solutions used (in particular: software)
One has to return to the basic concept!
Importance of the spatial component of the IS (localization of objects and processes, spatial interactions between elements)

6 / 30
INTRODUCTION TO GIS: STRUCTURING GEOGRAPHIC INFORMATIONINTRODUCTION TO GIS: STRUCTURING GEOGRAPHIC INFORMATION
REPRESENTING GEOGRAPHICAL DATAREPRESENTING GEOGRAPHICAL DATA
Duality of Geographical Information:
• Graphical information:The geographical objects, their localization, their topological relationships
• Thematic information:The descriptors of these objects, of these localizations
‘semantic’ data
500 Metres0
N

7 / 30
INTRODUCTION TO GIS: STRUCTURING GEOGRAPHIC INFORMATIONINTRODUCTION TO GIS: STRUCTURING GEOGRAPHIC INFORMATION
REPRESENTING GRAPHIC DATAREPRESENTING GRAPHIC DATA
Semantic
database
Semantic
database
Entities
Relationship
Spatial
representation
Spatial
representation
Entities
Relationships
Point
Line
Surface
Continuous
Tables
Adjacency
Inclusion
Proximity
Path
Link

8 / 30
INTRODUCTION TO GIS: STRUCTURING GEOGRAPHIC INFORMATIONINTRODUCTION TO GIS: STRUCTURING GEOGRAPHIC INFORMATION
CODING GEOMETRY : TWO MODESCODING GEOMETRY : TWO MODES
• image vs ‘line drawings’
• raster vs vector

9 / 30
INTRODUCTION TO GIS: STRUCTURING GEOGRAPHIC INFORMATIONINTRODUCTION TO GIS: STRUCTURING GEOGRAPHIC INFORMATION
VECTOR REPRESENTATIONVECTOR REPRESENTATION
bâtiment
route
lac

10 / 30
INTRODUCTION TO GIS: STRUCTURING GEOGRAPHIC INFORMATIONINTRODUCTION TO GIS: STRUCTURING GEOGRAPHIC INFORMATION
VECTOR REPRESENTATION: VECTOR REPRESENTATION:
‘SPAGHETTI’‘SPAGHETTI’
Point: Id,x,y +
Line: Id,
x0,y0x1,y1x2,y2.--------
xn,yn
Surface: Id,
x0,y0x1,y1x2,y2--------
xn,yn(x0,y0)
1 2
1 2 3
4 5 6
P1 P2
x1,y1 x2,y2
x2,y2 x3,y3
x5,y5 x6,y6
x4,y4 x5,y5x1,y1 x2,y2
Data redundancy
Undefined relationships

11 / 30
INTRODUCTION TO GIS: STRUCTURING GEOGRAPHIC INFORMATIONINTRODUCTION TO GIS: STRUCTURING GEOGRAPHIC INFORMATION
VECTOR REPRESENTATION:VECTOR REPRESENTATION:
NETWORK TOPOLOGYNETWORK TOPOLOGY
Point: Id,x,y +
Line: Id, (L)
Nax1,y1x2,y2.--------
Nb
Node: Id,x,y
Surface: Id,
L1L2----
Ln
1 2
1 2 3
4 5 6
No redundancy
Management of connectedness
L1 L2 L3
N1
N2
L1
N1x1,y1
x4,y4
N2
L2
N1N2
L3
N1x3,y3
x6,y6
N2
P1
L1
L2
P2
L2
L3
N1
x2,y2
N2
x5,y5

12 / 30
INTRODUCTION TO GIS: STRUCTURING GEOGRAPHIC INFORMATIONINTRODUCTION TO GIS: STRUCTURING GEOGRAPHIC INFORMATION
VECTOR REPRESENTATION: VECTOR REPRESENTATION:
SURFACE TOPOLOGYSURFACE TOPOLOGY
1 2
1 2 3
4 5 6
Management of connectedness
Management of contiguity
Point: Id,x,y +
Line: Id, (L), Pg,PdNax1,y1x2,y2.--------
Nb
Node: Id,x,y
Surface: Id,
L1L2----
Ln
L1 L2 L3
N1
N2
L1
N1
N2
P1U
L2
N1
N2
P2P1
L3
N1
N2
U
P2
P1
L1
L2
P2
L2
L3
N1
x2,y2
N2
x5,y5

13 / 30
INTRODUCTION TO GIS: STRUCTURING GEOGRAPHIC INFORMATIONINTRODUCTION TO GIS: STRUCTURING GEOGRAPHIC INFORMATION
‘SPAGHETTI’ MODEL‘SPAGHETTI’ MODEL
• Entities
– point: x, y coordinates
– line: list of x,y coordinates corresponding to nodes
– sometimes polygons: set of x,y coordinates, forming a loop: the first coordinate
couple = last coordinate couple
� The spaghetti mode produces a visual effect of polygons but, most often, no polygon
entity is stored
• No spatial relationships between objects– unjoined arcs – unclosed polygons
� polygons cannot form a surface
– intersections without nodes at the crossing of two arcs
– Adjacent polygons that overlap or separated by ‘blanks’
Appearence
!
Reality

14 / 30
INTRODUCTION TO GIS: STRUCTURING GEOGRAPHIC INFORMATIONINTRODUCTION TO GIS: STRUCTURING GEOGRAPHIC INFORMATION
TOPOLOGICAL MODELTOPOLOGICAL MODEL
• Managing the connectedness and contiguity of objects
• 2 types of topology: – Planar topology
– Network topology
• Topological entities:– With permanent storage of the topology
• e.g.: ArcInfo coverage
– Taking into account only when editing (creating, updating); this data is called pseudo-topological.
• e.g.: shp (ArcView) or tab (MapInfo)
– With defined topological rules, varying depending on context
• e.g.: feature class within feature dataset in a geodatabase (ArcGIS)

15 / 30
INTRODUCTION TO GIS: STRUCTURING GEOGRAPHIC INFORMATIONINTRODUCTION TO GIS: STRUCTURING GEOGRAPHIC INFORMATION
DBMS LINK DESCRIPTIVE DATADBMS LINK DESCRIPTIVE DATA
Identifier Attributes of the surface
1
2
3
+1
+3+2
Identifier Attributes of the point
1
2
3
1
23
Identifier Attributes of the line
1
2
3
+1
+2
+3
LINK
Weak
Strong
Hybrid/Integrated
STRUCTURING
Layer -- Table

16 / 30
INTRODUCTION TO GIS: STRUCTURING GEOGRAPHIC INFORMATIONINTRODUCTION TO GIS: STRUCTURING GEOGRAPHIC INFORMATION
1 1 1 1 1 1 1 1 1 1
1 1 1 1 1 1 1 1 1 1
1 1 1 1 1
2 2 2 2 2
2 2 2 2 2
2 2 2 2 2
2 2 2
3 3 3 3 3
3 3 3 3 3
3 3 3 3 3
3 3 3 3 3
3 3 3 3 33 3
extent
in Y or
rows
extent in X or columns
dx
dy
Size of the cell
(geometrical resolution)
Origin (X,Y)
N (orientation)
id attribute
1
2
3
Wheat
Grapevine
Forest
Identifier
RASTER PRESENTATIONRASTER PRESENTATION

17 / 30
INTRODUCTION TO GIS: STRUCTURING GEOGRAPHIC INFORMATIONINTRODUCTION TO GIS: STRUCTURING GEOGRAPHIC INFORMATION
RASTER REPRESENTATION: IMAGE DEPTHRASTER REPRESENTATION: IMAGE DEPTH
�Number of planes
�Depth of each planeboolean = 1 bit (21) 2 values: {0,1}byte = 8 bits (28) 256 values: {0,255}integer = 16 bits (216) 65536 values: {-32767,32765}...
Necessity of digital coding!
dz1
dz2
Thematic resolution

18 / 30
INTRODUCTION TO GIS: STRUCTURING GEOGRAPHIC INFORMATIONINTRODUCTION TO GIS: STRUCTURING GEOGRAPHIC INFORMATION
1
1 1 1
1
2
2
2
2
3
3 3 3
3
RASTER REPRESENTATION: RASTER REPRESENTATION:
LINES AND POINTSLINES AND POINTS
1
2
3
The value chosen for the empty cell is selected by convention.

19 / 30
INTRODUCTION TO GIS: STRUCTURING GEOGRAPHIC INFORMATIONINTRODUCTION TO GIS: STRUCTURING GEOGRAPHIC INFORMATION
RASTER REPRESENTATION: RASTER REPRESENTATION:
CONTINUOUS DATACONTINUOUS DATA
11.4 11.5 11.6 11.8 11.9 12.2 12.5 12.4 12.212.0
11.4 11.6 11.7 11.9 11.9 12.4 12.6 12.6 12.412.0
11.5 11.7 11.8 11.9 12.4
11.7 11.9 12.0 12.5 12.6
11.8 12.1 12.4 12.5 12.8
12.0 12.2 12.5 12.7 12.9
12.5 12.5 12.8
12.6 12.6 12.4 12.111.9
13.0 13.1 12.6 12.312.1
13.0 13.2 12.7 12.412.0
13.4 13.6 13.1 12.712.4
13.7 13.9 13.6 13.212.613.1 13.2
Direct representation of the
variable
Associated data: statistical
summary

20 / 30
INTRODUCTION TO GIS: STRUCTURING GEOGRAPHIC INFORMATIONINTRODUCTION TO GIS: STRUCTURING GEOGRAPHIC INFORMATION
DBMS LINK: DESCRIPTIVE DATADBMS LINK: DESCRIPTIVE DATAIdentifier Attributes of the
point
1
2
3
Identifier Attributes of the line
1
2
3
Identifier Attributes of the surface
1
2
3
LINK
Hybrid/integrated
STRUCTURING
Layer -- Table
1 1 1 1 1 1 1 1 1 1
1 1 1 1 1 1 1 1 1 1
1 1 1 1 1
2 2 2 2 2
2 2 2 2 2
2 2 2 2 2
2 2 2
3 3 3 3 3
3 3 3 3 3
3 3 3 3 3
3 3 3 3 3
3 3 3 3 33 3
1
1 1 1
1
2
2
2
2
3
3 3 3
3
1
2
3

21 / 30
INTRODUCTION TO GIS: STRUCTURING GEOGRAPHIC INFORMATIONINTRODUCTION TO GIS: STRUCTURING GEOGRAPHIC INFORMATION
RASTER REPRESENTATION: IMAGE DATARASTER REPRESENTATION: IMAGE DATA
Map (scanned)
Orthophotography
Digital Elevation Model
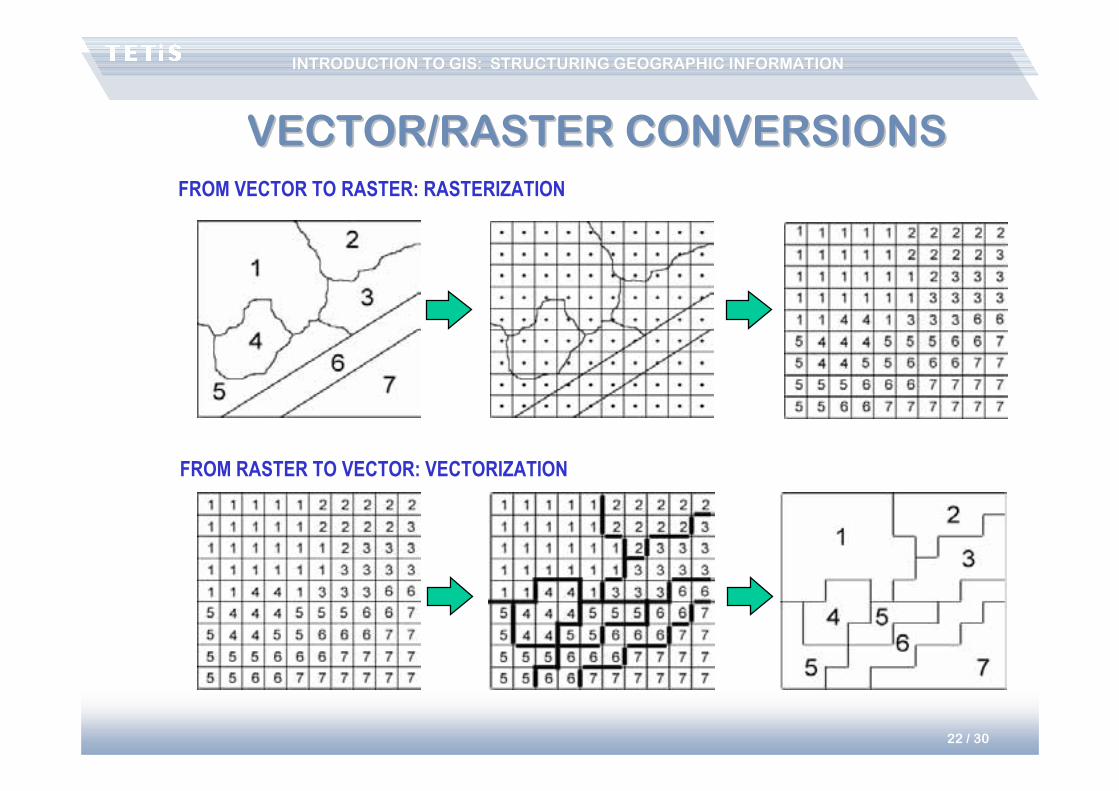
22 / 30
INTRODUCTION TO GIS: STRUCTURING GEOGRAPHIC INFORMATIONINTRODUCTION TO GIS: STRUCTURING GEOGRAPHIC INFORMATION
FROM VECTOR TO RASTER: RASTERIZATION
FROM RASTER TO VECTOR: VECTORIZATION
VECTOR/RASTER CONVERSIONSVECTOR/RASTER CONVERSIONS

23 / 30
INTRODUCTION TO GIS: STRUCTURING GEOGRAPHIC INFORMATIONINTRODUCTION TO GIS: STRUCTURING GEOGRAPHIC INFORMATION
VECTOR AND RASTER: VECTOR AND RASTER:
COMPLEMENTARITYCOMPLEMENTARITY• Raster:
– Grid of ‘independent’ cells
– Matrix calculations
– Redundancy – volume of information
• Vector:– Objects +- structured
– Information with low or no redundancy (depending on the structuring)
– Link with external databases
• Complementarity raster-vector
• Improvements in hardware architectures– Processor power / disk space
– Developments in raster solutions / image processing

24 / 30
INTRODUCTION TO GIS: STRUCTURING GEOGRAPHIC INFORMATIONINTRODUCTION TO GIS: STRUCTURING GEOGRAPHIC INFORMATION
SCALE AND ACCURACY SCALE AND ACCURACY -- 11
• Definition:Constant ratio between lengths measured on the map and the
corresponding lengths measured on the land.
• Expression:– Algebraic expression = scale ratio
map at 1:25,000
– Graphical expression by a scale bar representing the ratio
Graphical expression of scale: INDISPENSABLE
• Semantic confusion

25 / 30
INTRODUCTION TO GIS: STRUCTURING GEOGRAPHIC INFORMATIONINTRODUCTION TO GIS: STRUCTURING GEOGRAPHIC INFORMATION
• Significance of the scale:– Representation ratio
– Level of analysis of the studied phenomena
– Geometric accuracy of the information
• Level of approach of geographic space– Size of a zone representable at a given scale:
• A4 sheet: 600 km2 at 1:100,000
• … : 6 km2 at 1:10,000
– Level of analysis:
Compartment scale, regional scale, national scale
• Geometric accuracy of the information
SCALE AND ACCURACY SCALE AND ACCURACY -- 22

26 / 30
INTRODUCTION TO GIS: STRUCTURING GEOGRAPHIC INFORMATIONINTRODUCTION TO GIS: STRUCTURING GEOGRAPHIC INFORMATION
• Scale = representation ratioAccuracy = quality of geometric information
• 2 dimensions of accuracy:– resolution = size of an ‘elementary’ pixel
– localization accuracy: localization error
• Scale/accuracy confusion: 2 causes– assumption of the reader: each point is significant
– assumption of the producer: no unnecessary quality
• With ‘undesirable’ consequencesthe zoom syndrome
SCALE AND ACCURACY SCALE AND ACCURACY -- 33

27 / 30
INTRODUCTION TO GIS: STRUCTURING GEOGRAPHIC INFORMATIONINTRODUCTION TO GIS: STRUCTURING GEOGRAPHIC INFORMATION
GEOGRAPHIC DATA QUALITY GEOGRAPHIC DATA QUALITY -- 11
Hardwares
Softwares
Methods
Users
Data
• Key-element of
any GIS project
• 70 to 80 % of
total project costs

28 / 30
INTRODUCTION TO GIS: STRUCTURING GEOGRAPHIC INFORMATIONINTRODUCTION TO GIS: STRUCTURING GEOGRAPHIC INFORMATION
GEOGRAPHIC DATA QUALITY GEOGRAPHIC DATA QUALITY -- 22
• Acquiring data from:– Institutional: public agencies
– Private providers
– External contractors
– Internal digitalization
GIS software incorporate tools to create layer:
– features digitalization,
– calculation on one or many existing plans,
– Image processing

29 / 30
INTRODUCTION TO GIS: STRUCTURING GEOGRAPHIC INFORMATIONINTRODUCTION TO GIS: STRUCTURING GEOGRAPHIC INFORMATION
GEOGRAPHIC DATA QUALITY GEOGRAPHIC DATA QUALITY -- 33
• Which use ?– To use or extract information from this document
– As based map (illustration or filling)
– To take measurements
– To analyze simultaneously several information plans (spatial
analysis)
• Whatever use, consider :– Precision of imported data
– Level of detail
– Reference system used (compatibility with local database)
– Data property (copyright)
Information
to be stored
in metadata

30 / 30
INTRODUCTION TO GIS: STRUCTURING GEOGRAPHIC INFORMATIONINTRODUCTION TO GIS: STRUCTURING GEOGRAPHIC INFORMATION
METADATA, TO GUARANTEE DATA METADATA, TO GUARANTEE DATA
QUALITYQUALITY
• Metadata = "data about data"– The procedures followed to acquire the data
– The precision et methods of measurements
– The age of the data and update
– The data coding
– The geographic referencing
– The geometry
– The attributes
• Absence of metadata– False interpretation
– Bad usage
– Erroneous perception of precision
Example of metadata's appearance
ArcCatalog (ESRI)