gis data assessment for region ii of chile – implications for rural international water resource...
TRANSCRIPT

GIS Data Assessment for Region II of Chile – Implications for Rural International Water Resource Databases
Benjamin Bass
Hydrogeology/Environmental Geology Undergraduate
November 29th, 2011GIS in Water Resources Presentation
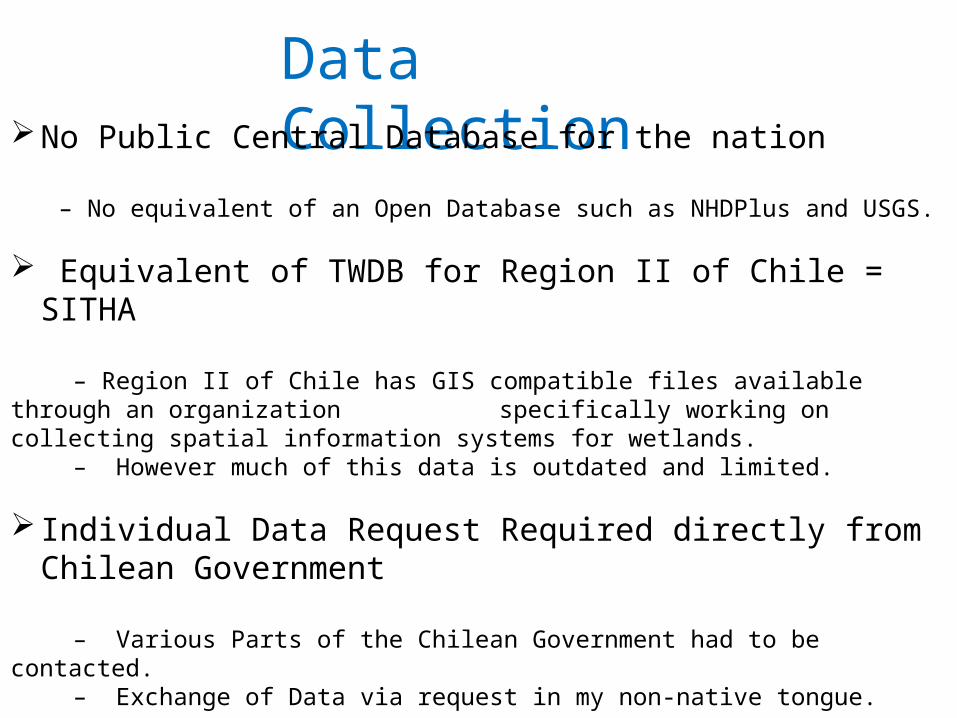
Data CollectionNo Public Central Database for the nation
– No equivalent of an Open Database such as NHDPlus and USGS.
Equivalent of TWDB for Region II of Chile = SITHA
– Region II of Chile has GIS compatible files available through an organization specifically working on collecting spatial information systems for wetlands. – However much of this data is outdated and limited.
Individual Data Request Required directly from Chilean Government
– Various Parts of the Chilean Government had to be contacted. – Exchange of Data via request in my non-native tongue.
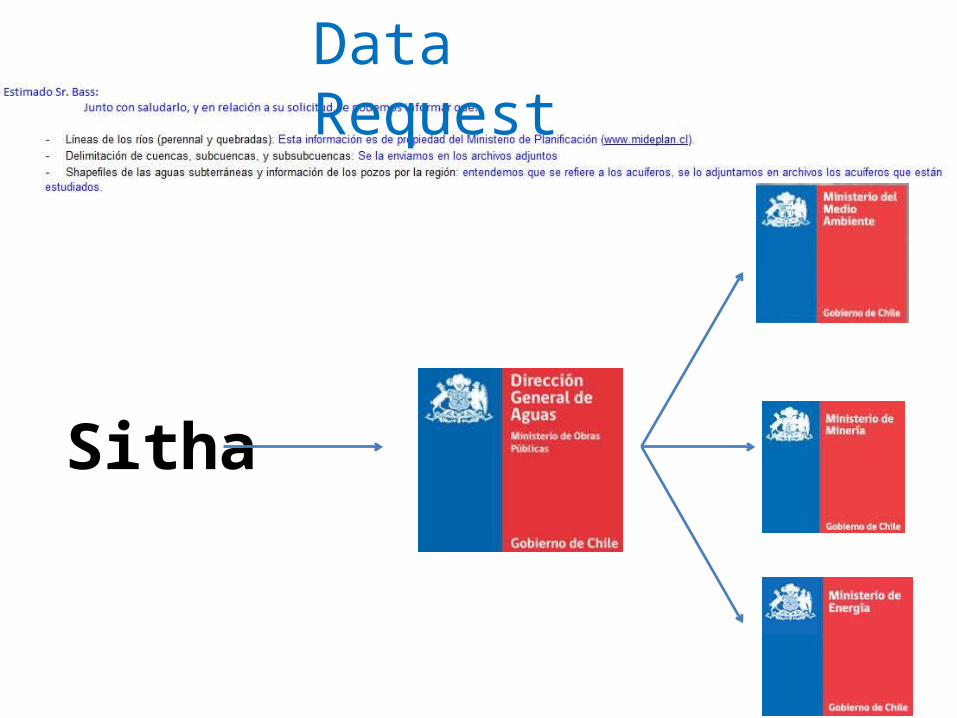
Data Request
Sitha

Summary of Talk
General Spatial Analysis
Trials and Tribulations of Watershed Delineation Analysis
Local Study on Copper Mines and their effects on Water Quality
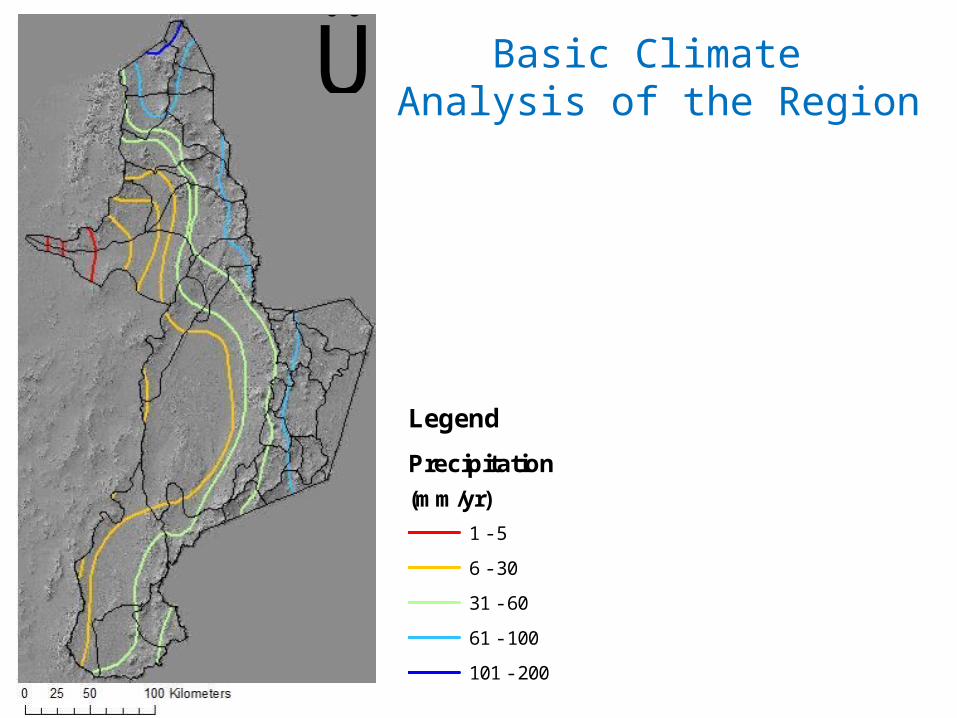
Basic Climate Analysis of the Region
Legend
Precipitation
(mm/yr)
1 - 5
6 - 30
31 - 60
61 - 100
101 - 200
Ü
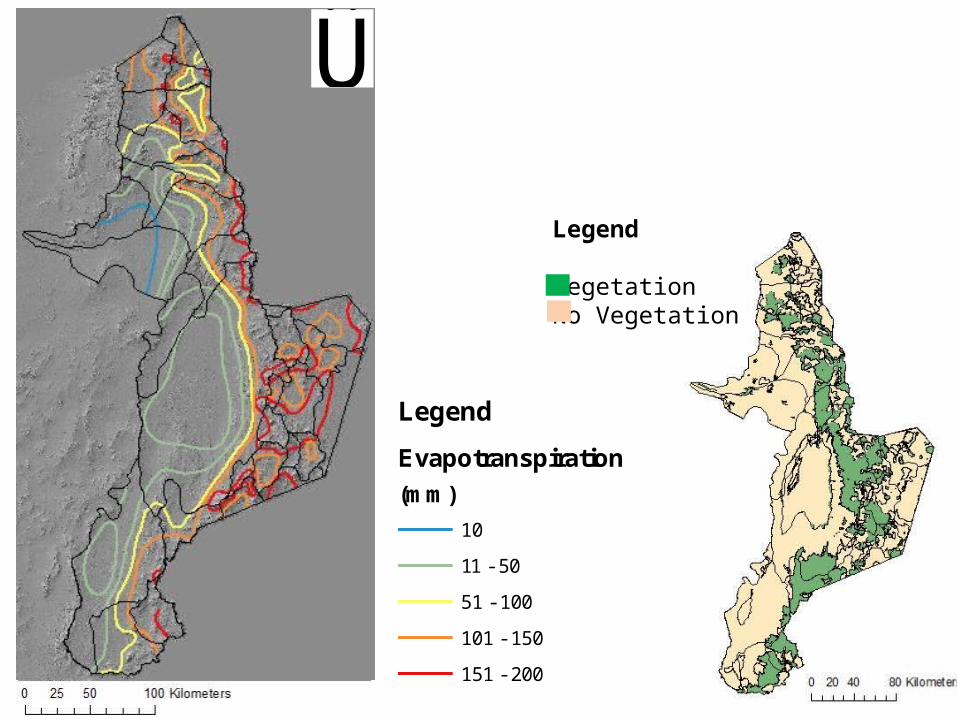
Legend
Evapotranspiration
(mm)
10
11 - 50
51 - 100
101 - 150
151 - 200
Legend
Vegetation No Vegetation
Ü
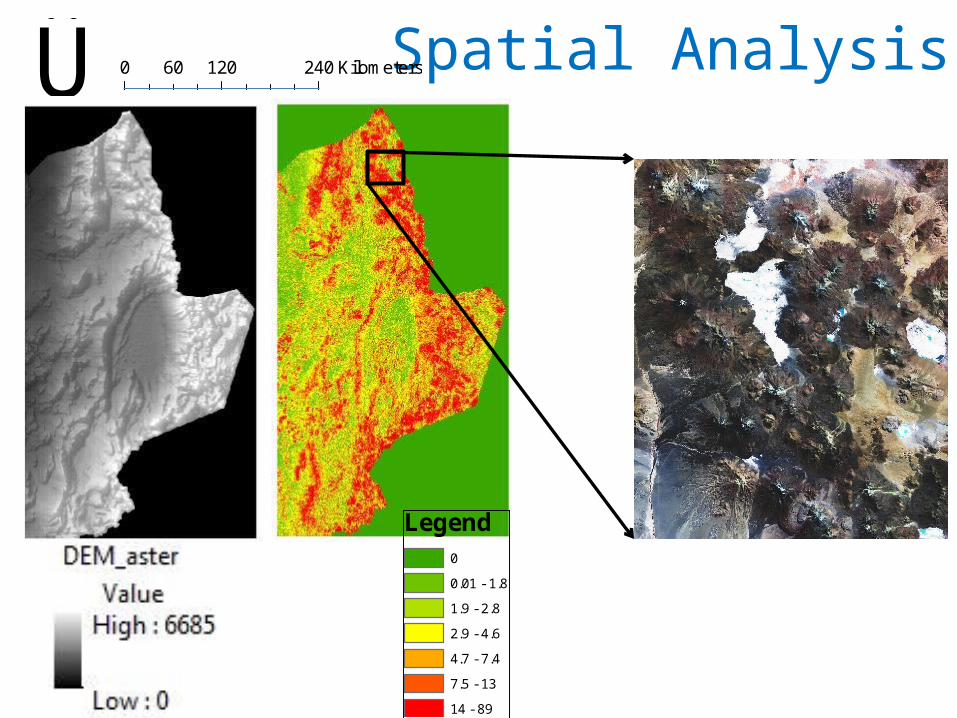
Spatial Analysis0 120 24060 KilometersÜ
Legend0
0.01 - 1.8
1.9 - 2.8
2.9 - 4.6
4.7 - 7.4
7.5 - 13
14 - 89
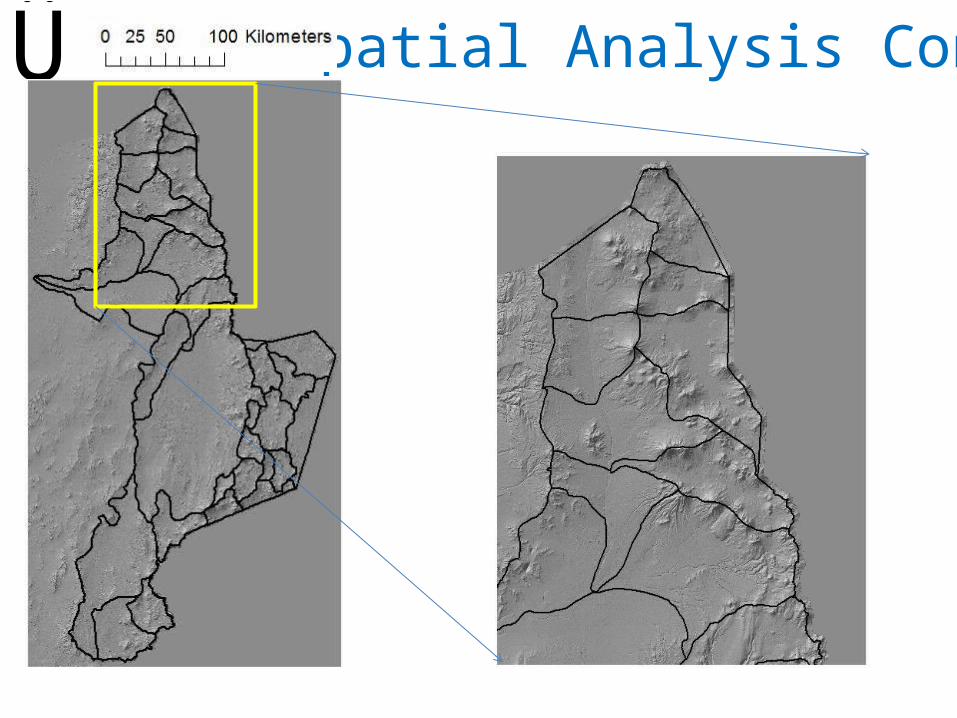
Spatial Analysis Cont…Ü
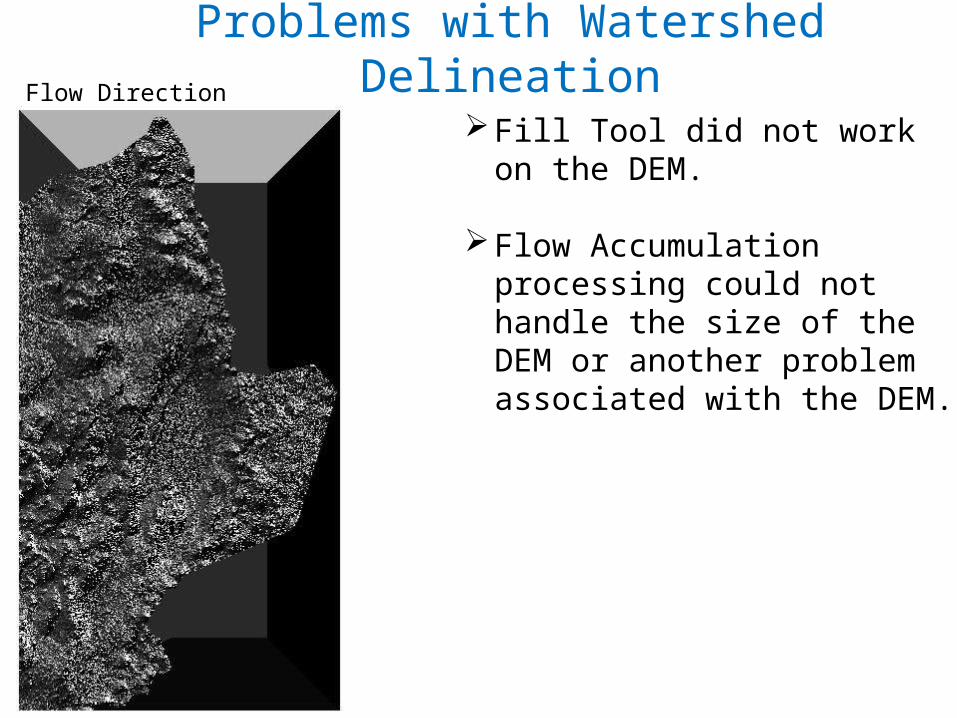
Fill Tool did not work on the DEM.
Flow Accumulation processing could not handle the size of the DEM or another problem associated with the DEM.
Problems with Watershed DelineationFlow Direction
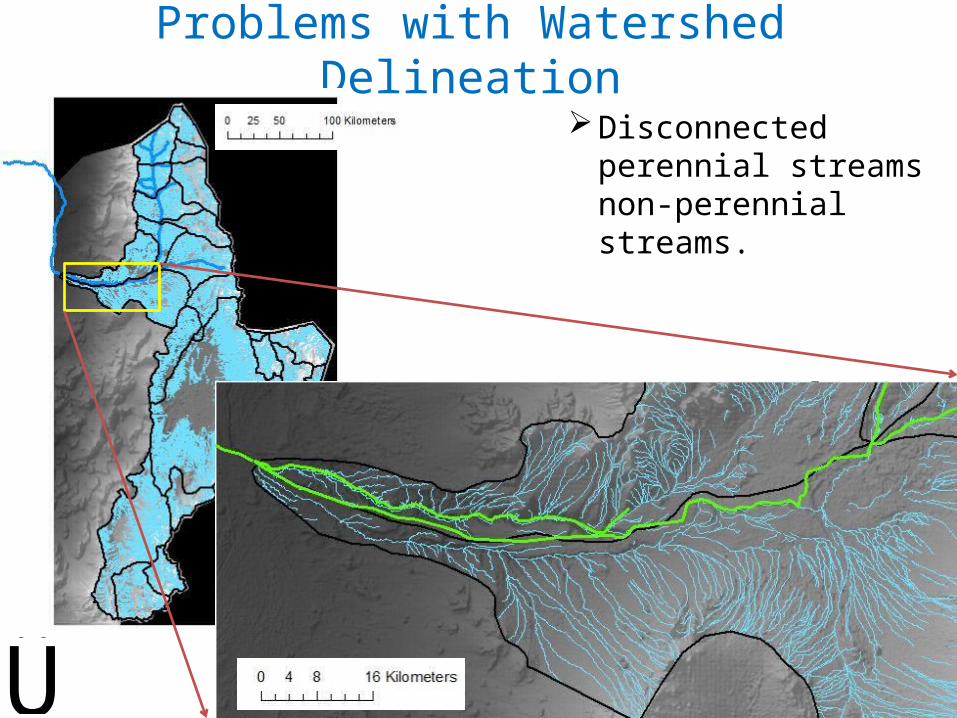
Problems with Watershed Delineation
Ü
Disconnected perennial streams non-perennial streams.
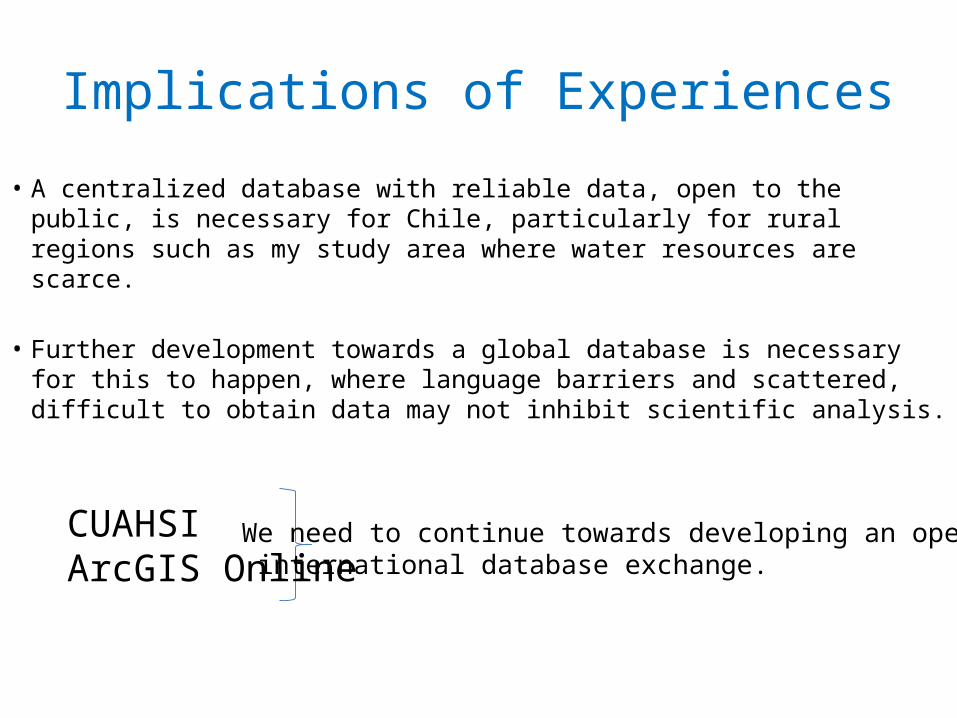
Implications of Experiences• A centralized database with reliable data, open to the public, is necessary
for Chile, particularly for rural regions such as my study area where water resources are scarce.
• Further development towards a global database is necessary for this to happen, where language barriers and scattered, difficult to obtain data may not inhibit scientific analysis.
We need to continue towards developing an open international database exchange.
CUAHSIArcGIS Online
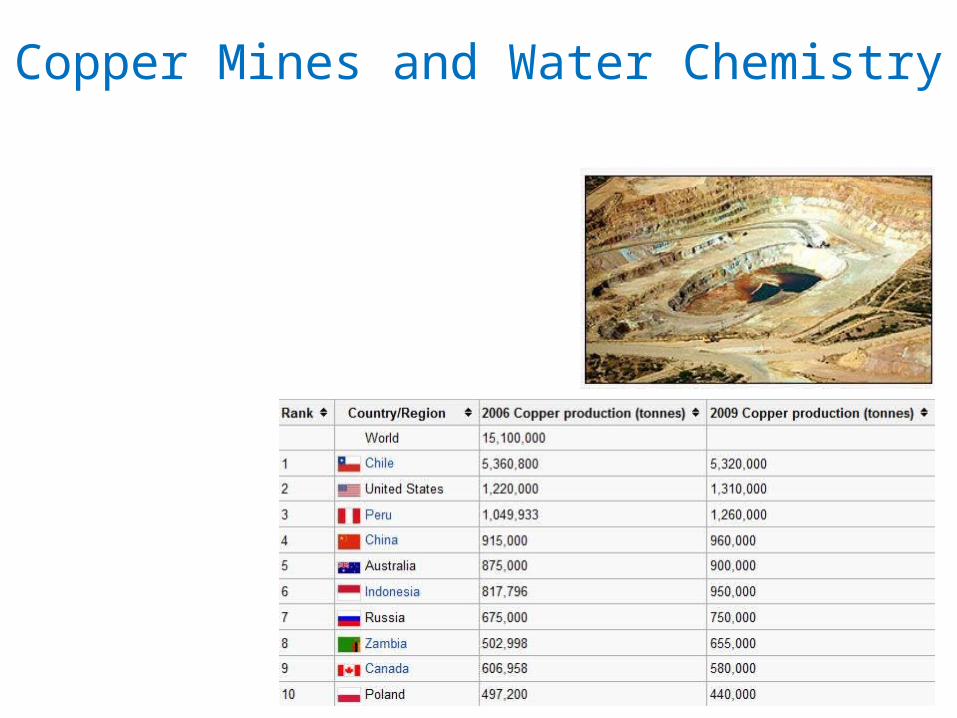
Copper Mines and Water Chemistry
Ü
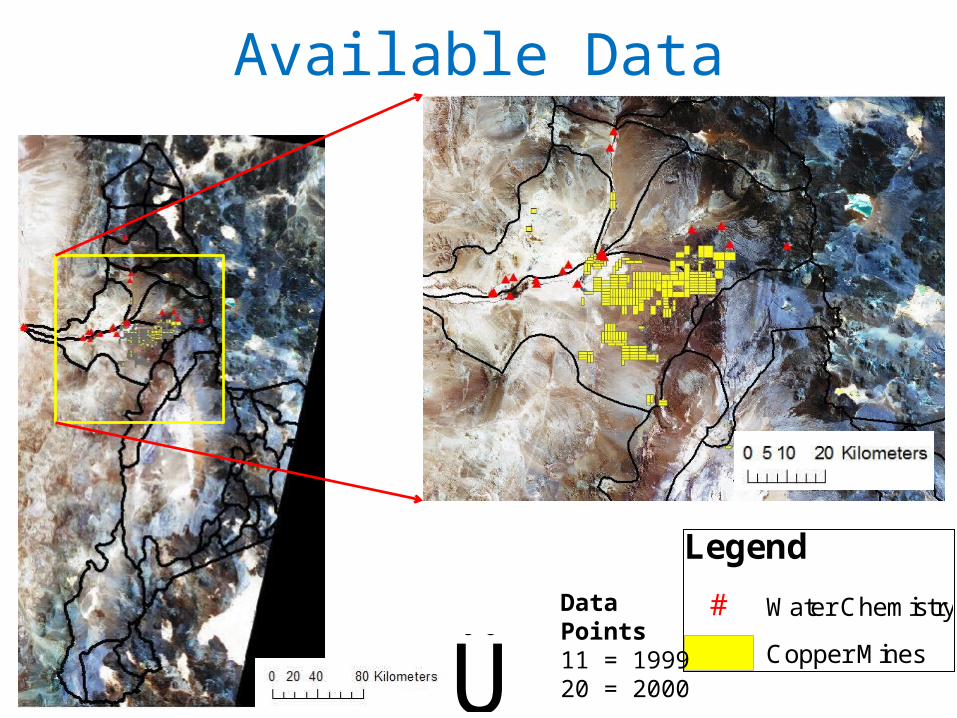
Legend
# Water Chemistry
Copper Mines
Available Data
Data Points11 = 199920 = 2000
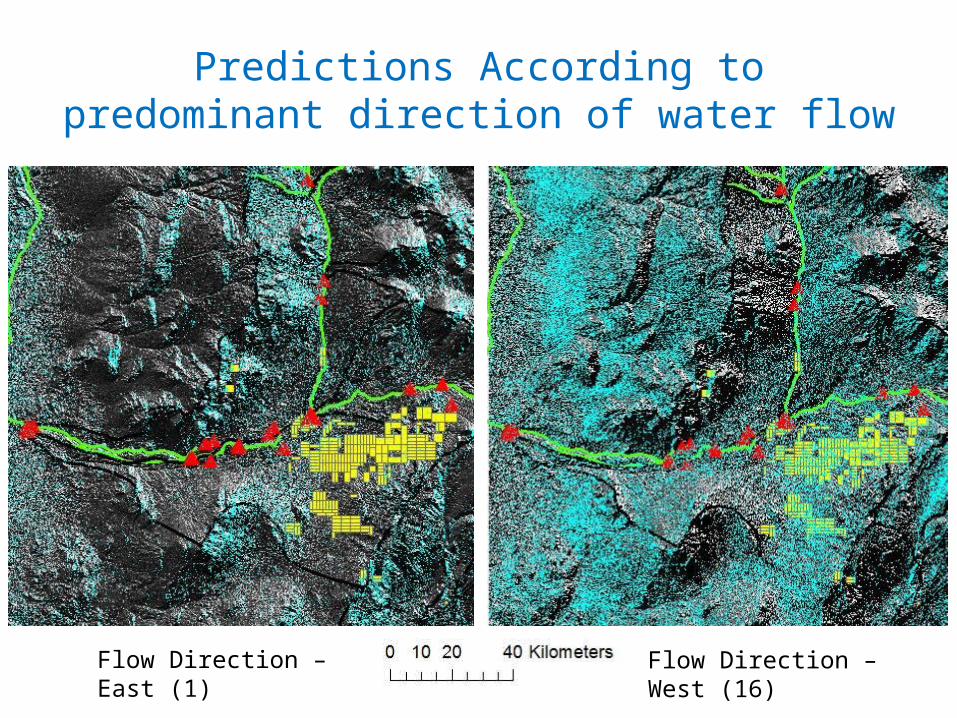
Predictions According to predominant direction of water flow
Flow Direction – East (1) Flow Direction – West (16)
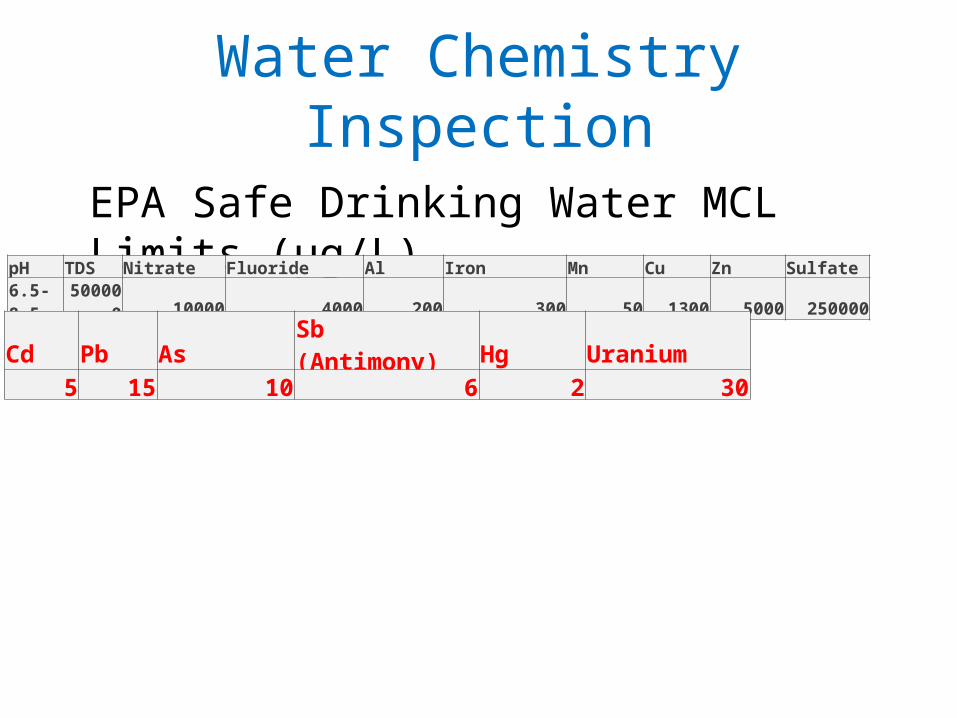
Water Chemistry Inspection
EPA Safe Drinking Water MCL Limits (µg/L)pH TDS Nitrate Fluoride Al Iron Mn Cu Zn Sulfate 6.5-8.5 500000 10000 4000 200 300 50 1300 5000 250000
Cd Pb As Sb (Antimony) Hg Uranium5 15 10 6 2 30
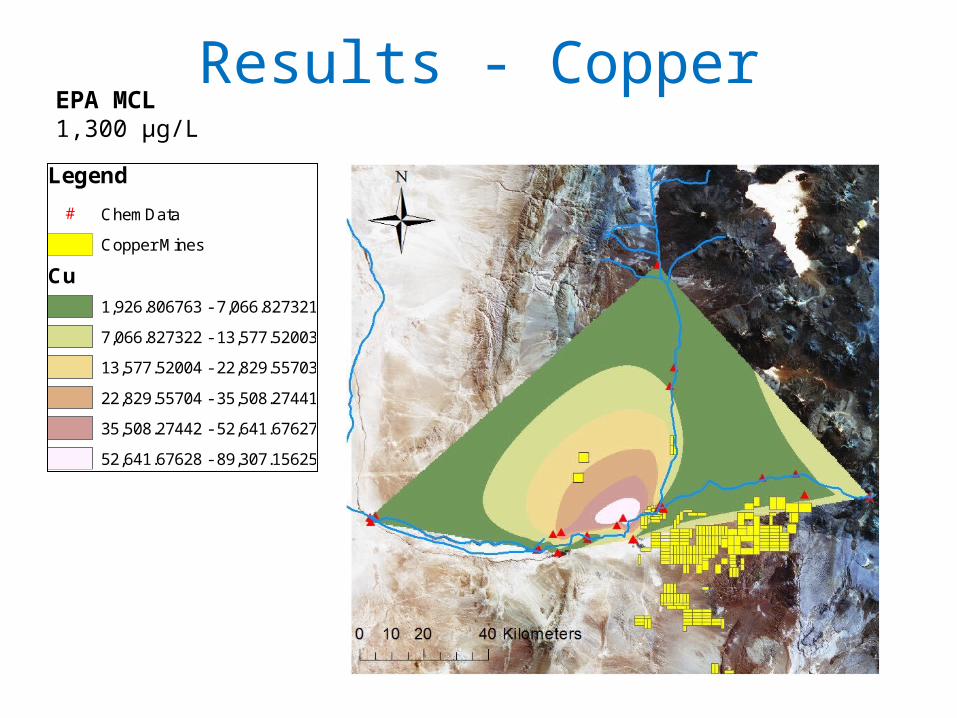
Results - Copper
Legend
# ChemData
Copper Mines
Cu
1,926.806763 - 7,066.827321
7,066.827322 - 13,577.52003
13,577.52004 - 22,829.55703
22,829.55704 - 35,508.27441
35,508.27442 - 52,641.67627
52,641.67628 - 89,307.15625
EPA MCL1,300 µg/L
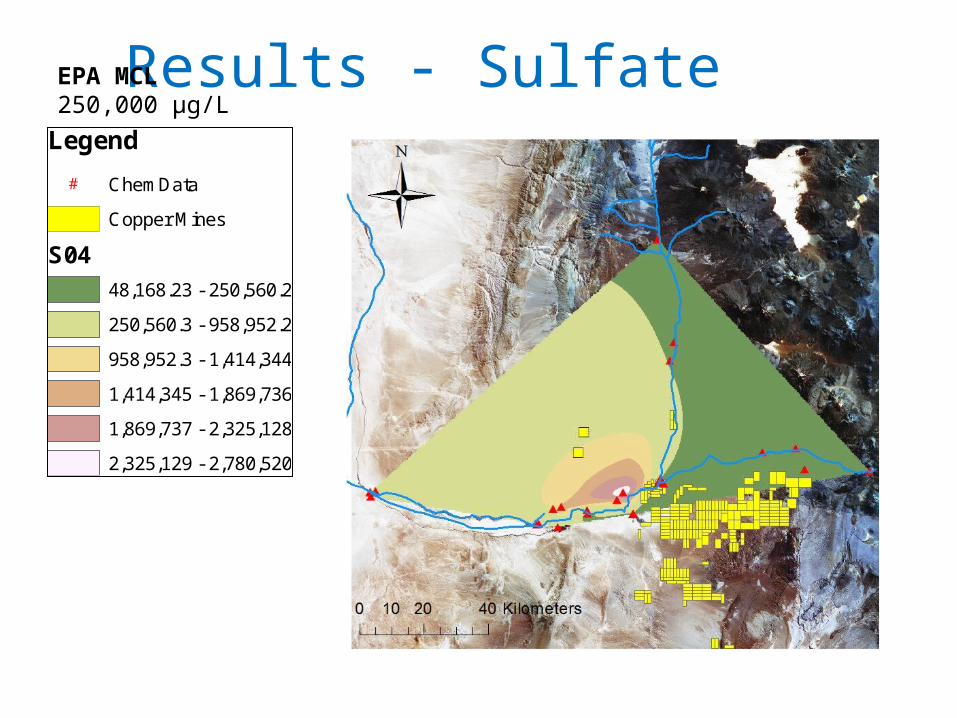
Results - SulfateLegend
# ChemData
Copper Mines
S0448,168.23 - 250,560.2
250,560.3 - 958,952.2
958,952.3 - 1,414,344
1,414,345 - 1,869,736
1,869,737 - 2,325,128
2,325,129 - 2,780,520
EPA MCL250,000 µg/L
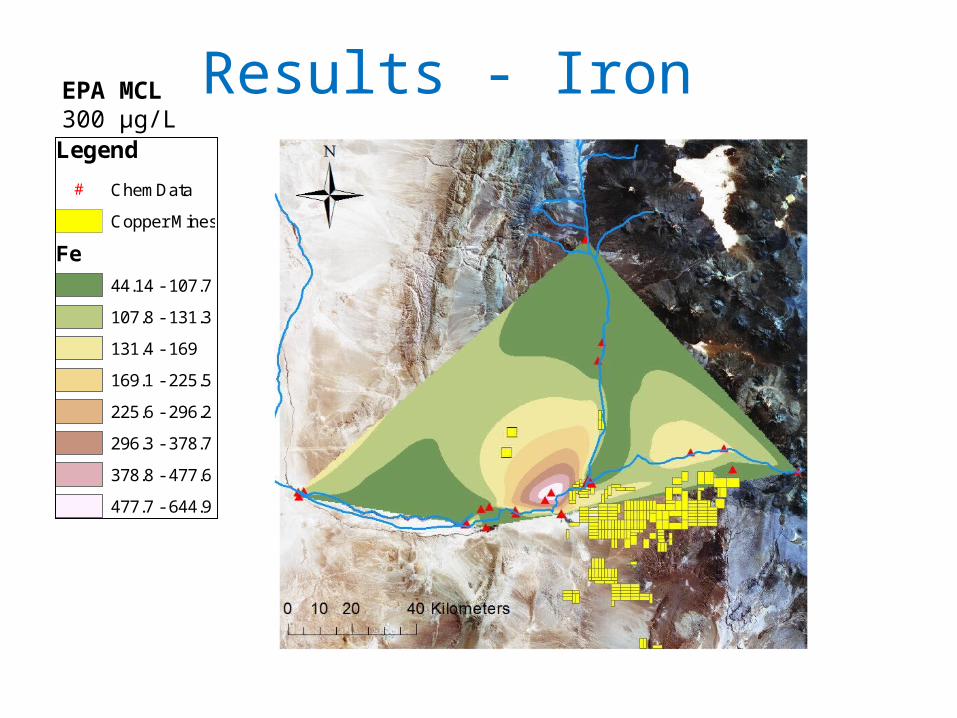
Legend
# ChemData
Copper Mines
Fe
44.14 - 107.7
107.8 - 131.3
131.4 - 169
169.1 - 225.5
225.6 - 296.2
296.3 - 378.7
378.8 - 477.6
477.7 - 644.9
Results - IronEPA MCL300 µg/L
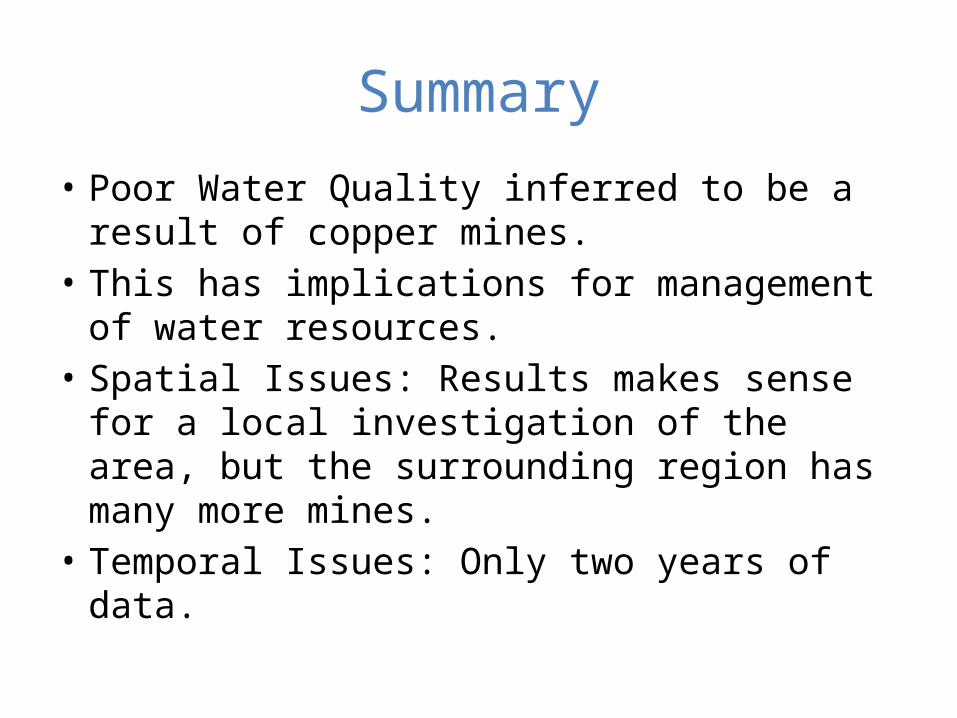
Summary
• Poor Water Quality inferred to be a result of copper mines.
• This has implications for management of water resources.
• Spatial Issues: Results makes sense for a local investigation of the area, but the surrounding region has many more mines.
• Temporal Issues: Only two years of data.
Data Sources and References
• Sitha.cl• Direccion General de Aguas – Gobierno de Chile• Ministerio del medio ambiente – Gobierno de Chile• Environmental Protection Agency
Thank you!