gis groundwater mapping, parksville, bc phase i report:...
TRANSCRIPT
GIS Groundwater Mapping, Parksville, BC - Phase I Report: Data Capture
. , I . . . . ' 1
7 . Mike Wei and Dave Johanson Groundwater Section
Water Management Branch
February, 2000
0 GIS Groundwater arksville, BC-Phase I: Data Capture
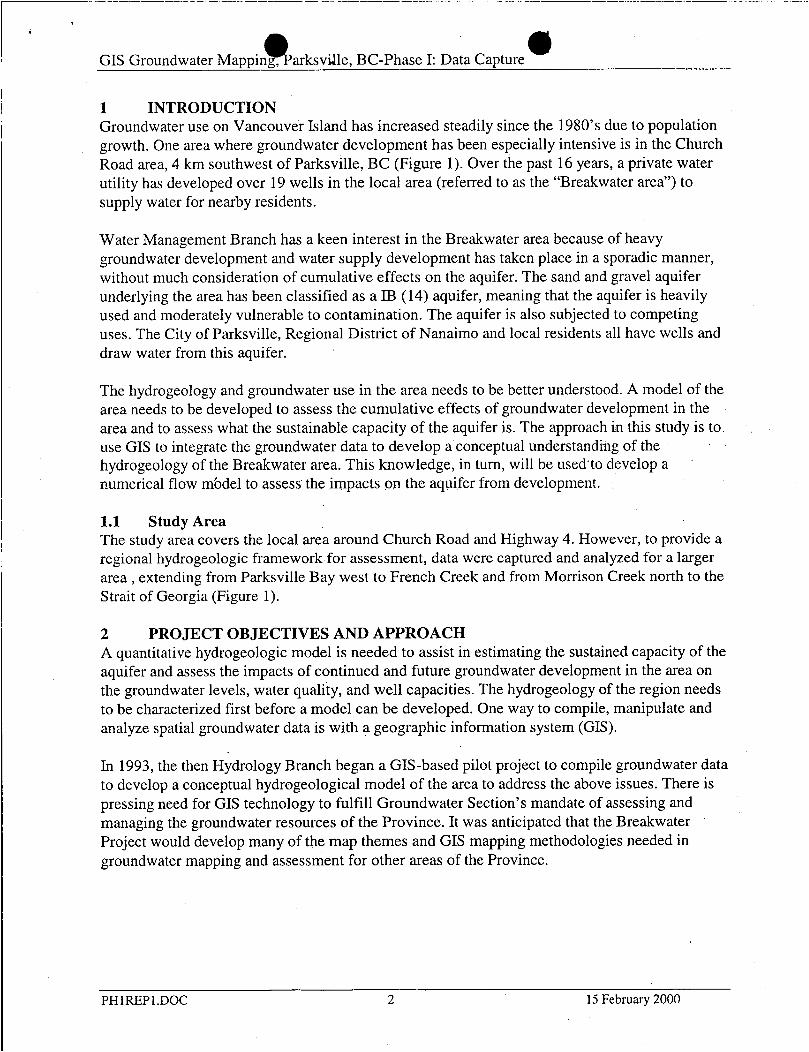
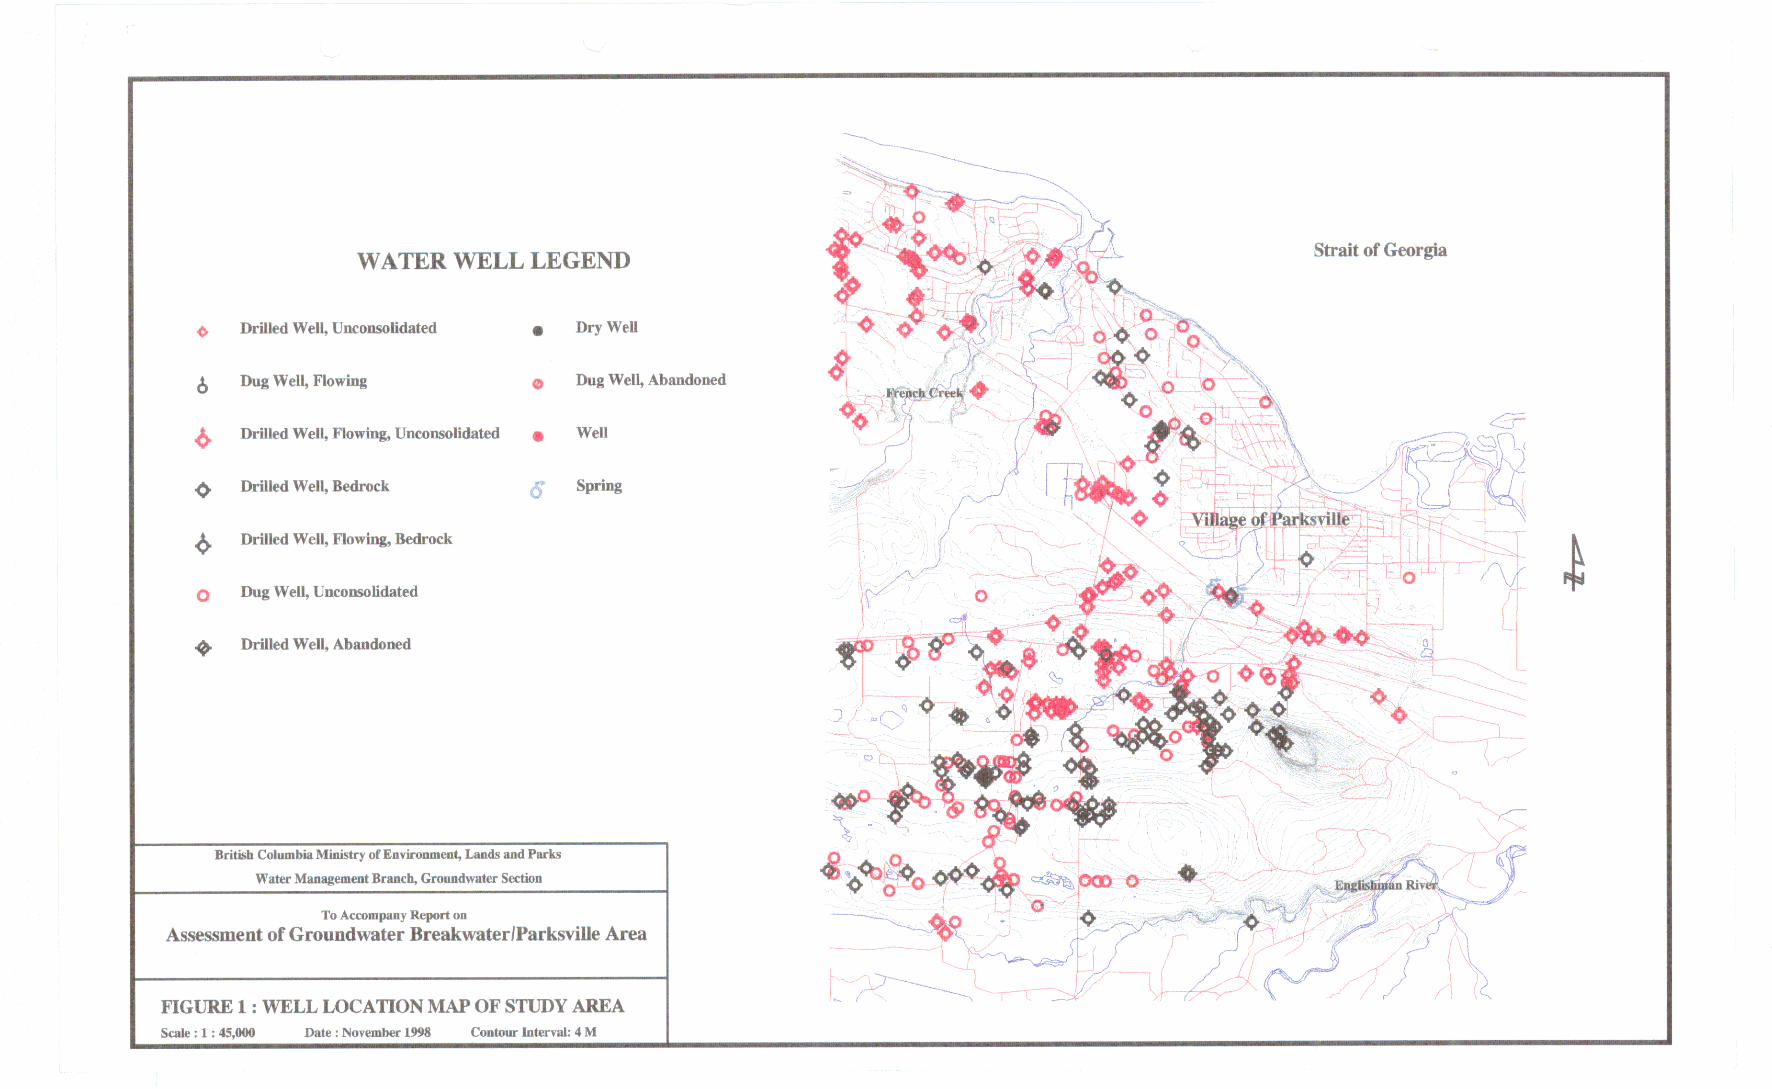
1 INTRODUCTION Groundwater use on Vancouver Island has increased steadily since the 1980’s due to population growth. One area where groundwater development has been especially intensive is in the Church Road area, 4 km southwest of Parksville, BC (Figure 1). Over the past 16 years, a private water utility has developed over 19 wells in the local area (referred to as the “Breakwater area,’) to supply water for nearby residents.
Water Management Branch has a keen interest in the Breakwater area because of heavy groundwater development and water supply dewelopment has taken place in a sporadic manner, without much consideration of cumulative effects on the aquifer. The sand and gravel aquifer underlying the area has been classified as a IB (14) aquifer, meaning that the aquifer is heavily used and moderately vulnerable to contamination. The aquifer is also subjected to competing uses. The City of Parksville, Regional District of Nanaimo and local residents all have wells and draw water from this aquifer.
The hydrogeology and groundwater use in the area needs to be better understood. A model of the area needs to be developed to assess the cumulative effects of groundwater development in the area and to assess what the sustainable capacity of the aquifer is. The approach in this study is to use GIS to integrate the groundwater data to develop a conceptual understanding of the hydrogeology of the Breakwater area. This knowledge, in turn, will be used‘to develop a numerical flow mbdel to assess the impacts on the aquifer from development.
1.1 Study Area The study area covers the local area around Church Road and Highway 4. However, to provide a regional hydrogeologic framework for assessment, data were captured and analyzed for a larger area , extending from Parksville Bay west to French Creek and from Morrison Creek north to the Strait of Georgia (Figure 1).
2 PROJECT OBJECTIVES AND APPROACH A quantitative hydrogeologic model is needed to assist in estimating the sustained capacity of the aquifer and assess the impacts of continued and future groundwater development in the area on the groundwater levels, water quality, and well capacities. The hydrogeology of the region needs to be characterized first before a model can be developed. One way to compile, manipulate and analyze spatial groundwater data is with a geographic information system (GIS).
In 1993, the then Hydrology Branch began a GIS-based pilot project to compile groundwater data to develop a conceptual hydrogeological model of the area to address the above issues. There is pressing need for GIS technology to fulfill Groundwater Section’s mandate of assessing and managing the groundwater resources of the Province. It was anticipated that the Breakwater Project would develop many of the map themes and GIS mapping methodologies needed in groundwater mapping and assessment for other areas of the Province.
PH1REPI.DOC 2 15 February 2000
WATER WELL LEGEND Strait of Georgia
e a GIS Groundwater Mapping, Parksville, BC-Phase I: Data Capture
Surficial geology and other information
. . . . . . .
. . . . . I
. .
Analyze coverages and surficial geology information and characterize the regional hydrogeology
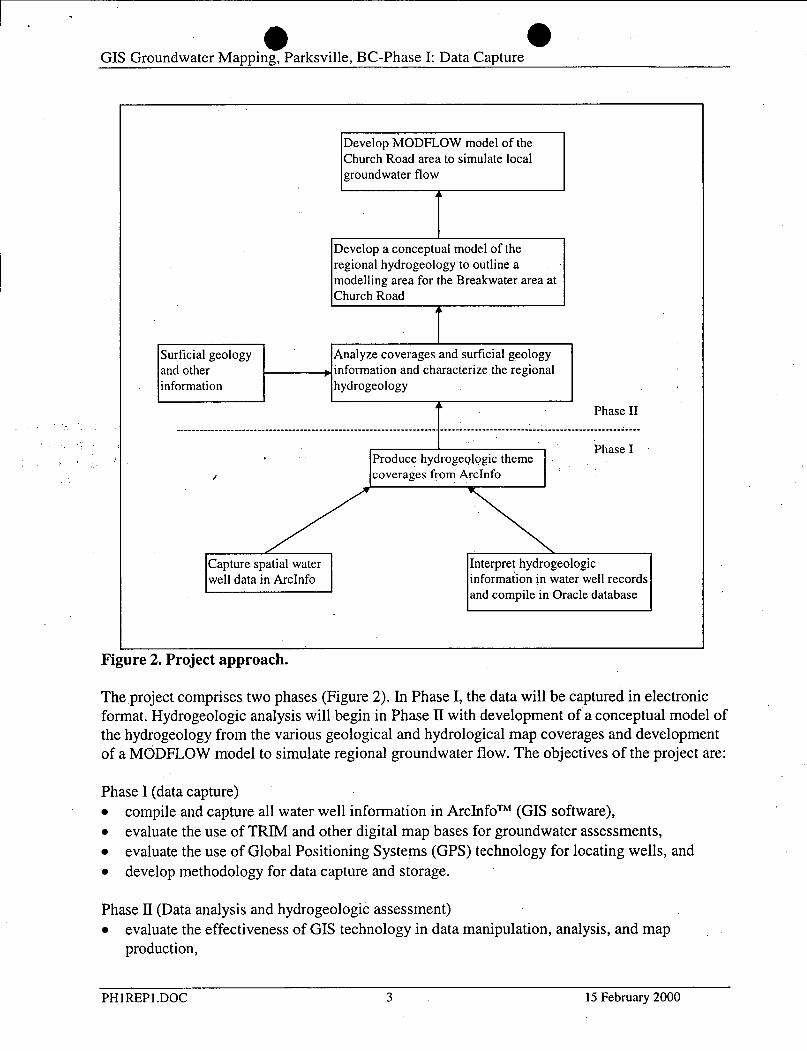
Develop MODFLOW model of the Church Road area to simulate local groundwater flow
________________________________________---------------------------.--_----_---------_----------------------------------
/
Produce hydiogeologic theme ,
coverages fi om ArcInfo
information in water well records and compile in Oracle database
Capture spatial water well data in ArcInfo
Figure 2. Project approach.
IInterpret hydrogeologic
The project comprises two phases (Figure 2). In Phase I, the data will be captured in electronic format. Hydrogeologic analysis will begin in Phase II with development of a conceptual model of the hydrogeology from the various geological and hydrological map coverages and development of a MODFLOW model to simulate regional groundwater flow. The objectives of the project are:
Phase I (data capture)
0
compile and capture all water well information in ArcInfoTM (GIs software), evaluate the use of TRIM and other digital map bases for groundwater assessments, evaluate the use of Global Positioning Systems (GPS) technology for locating wells, and develop methodology for data capture and storage.
Phase II (Data analysis and hydrogeologic assessment) evaluate the effectiveness of GIS technology in data manipulation, analysis, and map production,
PHlREPl .DOC 3 15 February 2000
e 0 GIS Groundwater Mapping, Parksville, BC-Phase I: Data Capture
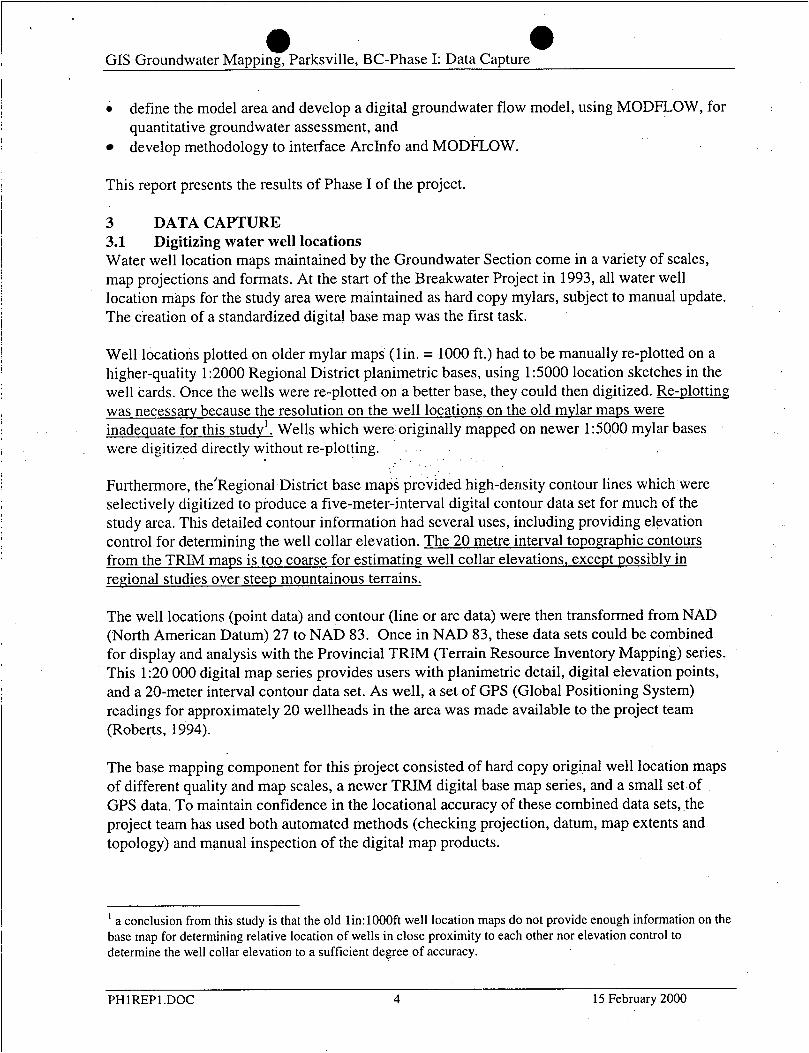
0 define the model area and develop a digital groundwater flow model, using MODFLOW, for quantitative groundwater assessment, and develop methodology to interface ArcInfo and MODFLOW.
This report presents the results of Phase I of the project.
3 DATA CAPTURE 3.1 Digitizing water well locations Water well location maps maintained by the Groundwater Section come in a variety of scales, map projections and formats. At the start of the Breakwater Project in 1993, all water well location maps for the study area were maintained as hard copy mylars, subject to manual update. The creation of a standardized digital base map was the first task.
Well locations plotted on older mylar maps (lin. = 1000 ft.) had to be manually re-plotted on a higher-quality 1 :2000 Regional District planimetric bases, using 15000 location sketches in the well cards. Once the wells were re-plotted on a better base, they could then digitized. Re-plotting was necessary because the resolution on the well locations on the old mylar maps were inadequate for this study’. Wells which were originally mapped on newer 15000 mylar bases were digitized directly without re-plotting.
Furthermore, the’Regiona1 District base maps provided high-demity contour lines which were selectively digitized to produce a five-meter-interval digital contour data set for much of the study area. This detailed contour information had several uses, including providing elevation control for determining the well collar elevation. The 20 metre interval topographic contours from the TRIM maps is too coarse for estimatinp - well collar elevations, except possibly in regional studies over steep mountainous terrains.
The well locations (point data) and contour (line or arc data) were then transformed from NAD (North American Datum) 27 to NAD 83. Once in NAD 83, these data sets could be combined for display and analysis with the Provincial TRIM (Terrain Resource Inventory Mapping) series. This 1:20 000 digital map series provides users with planimetric detail, digital elevation points, and a 20-meter interval contour data set. As well, a set of GPS (Global Positioning System) readings for approximately 20 wellheads in the area was made available to the project team (Roberts, 1994).
The base mapping component for this project consisted of hard copy original well location maps of different quality and map scales, a newer TRIM digital base map series, and a small set of GPS data. To maintain confidence in the locational accuracy of these combined data sets, the project team has used both automated methods (checking projection, datum, map extents and topology) and manual inspection of the digital map products.
’ a conclusion from this study is that the old 1in:lOOOft well location maps do not provide enough information on the base map for determining relative location of wells in close proximity to each other nor elevation control to determine the well collar elevation to a sufficient degree of accuracy.
PH 1 REP 1 .DOC 4 15 February 2000
e 0 GIS Groundwater Mapping, Parksville, BC-Phase I: Data Capture
3.2 Interpreting well records Once all the wells were plotted on 1:5000 and 1:2000 scale paper maps for digitizing, collar elevations for all the wells were estimated by manually interpolating between topographic contours (2 metre contours from the 15000 scale maps and 1 metre contours from the 1:2000 scale maps). Well collar elevations are required to map the water table and piezometric surfaces of the aquifers and determine the surface elevation of the underlying bedrock (Table 1). Collar elevations were also used to compare against the GPS elevations to evaluate the suitability of elevations taken from large scale topographic maps for regional groundwater mapping.
All the well records in the study area available at the time were reviewed. The local stratigraphy (Fyles, 1963) indicates that there are three types of geological deposits where aquifers could occur (Figure 3): 1) shallow groundwater occurs in the uppermost sand and gravel and till unit, 2) sand and minor gravel aquifer in the Quadra Sand unit; this is the aquifer tapped by the Breakwater wells, and 3) groundwater in the fractured sedimentary bedrock aquifer, underlying the Quadra Sand aquifer. This information was used to correlate the wells to the aquifers. Wherever possible, the following parameters were determineainterpreted from the well record information (Table 1):
collar elevation static water elevation (collar elevation minus static water level) aquifer type’(shal1ow groundwater in the shallow sand and gravel and till units? sand and gravel in the Quadra Sand unit? or fractured bedrock?) depth to top of aquifer (interpreted from lithology in the well record; applies to the Quadra Sand aquifer and bedrock aquifer) elevation of top of aquifer (collar elevation minus depth to top of aquifer; applies to the Quadra Sand aquifer and bedrock aquifer) thickness of Quadra Sand aquifer depth to bedrock (interpreted from lithology in the well record) bedrock surface elevation (collar elevation minus depth to bedrock) well specific capacity (interpreted from production data in the well record) aquifer transmissivity (data only for the Quadra Sand and the bedrock aquifer; estimated from pumping test data or from specific capacity data in the well record)
PH1REPl.DOC 5 15 February 2000

e 0 GIS Groundwater Mapping, Parksville, BC-Phase I: Data Capture
Table 1. Well and hydrogeologic parameters determined from base mapping and
well collar elevation depth to water
static water elevation aquifer type
depth to top of aquifer
elevation of top of aquifer
thickness of aquifer
depth to bedrock
bedrock surface elevation
specific capacity transmissivity
I well records. BO interpolated from topographic maps with 1- and 2-metre contour intervals interpreted from the well record
collar elevation minus the reported depth to water in the well record there are three categories of aquifer types for the area: 1) for shallow groundwater in sand and gravel seams in the till unit or between the till and underlying bedrock, 2) the Quadra Sand2, and 3) in the underlying sedimentarv bedrock Interpreted from the well record as the depth from land surface to top of Quadra Sand aquifer
elevation of the top of the Quadra Sand aquifer determined by collar ele\.,atiori minus depth to top of aquifer interpreted from the well record as the difference between the bottom and top of the Quadra Sand aquifer
interpreted from the well record where pumping rate and drawdown are reported
~
the collar elevation minus the depth to bedrock
interpreted from the well record
determined from pumping test data or from the specific capacity and applies to the Quadra Sand and bedrock aquifers
assume the amount of casing stickup for all wells are the same seasonal and temporal variation in water level is not considered: see also Figure 4 seasonal and temporal variation in water level is not considered see also Figure 3
depth to top of aquifer where aquifer is confined and depth to water level (assumed to be the water table) where aquifer is unconfined; see also Figure 3
for wells that were not drilled through the entire thickness of the Quadra Sand, the thickness of the aquifer is given as a “greater than” value; see also Figure 3 where a well is deep (> 30 m) but did not encounter the bedrock surface; the depth to bedrock is given as a “greater than” value: see also Figure 3 where a well is deep (> 30 m) but did not encounter the bedrock surface, the bedrock surface elevation is given as a “less than” value the specific capacity was not normalized to any specified pumping time transmissivity is estimated from specific capacity using the method described in Driscoll. 1986
Some consultants believe the sand and gravel aquifers in the area occur as “patches”, and not as a continuous unit. These “patches” are difficult to map from one well to another and in a regional study of this type, mapping specific “patches” was not possible. In this study, it is recognized that the Quadra Sand comprises heterogeneous sediments and in some places even older, pre-Quadra deposits but the whole unit is interpreted as a regional aquifer complex of varying transmissivity.
2
PH 1 REP1 .DOC 6 15 February 2000
e 0 GIS Groundwater Mapping, Parksville, BC-Phase I: Data Capture
v
Red well symbols in Figure 1
Black well symbols in Figure 1
1
I DTW
1 DTA
i b
I
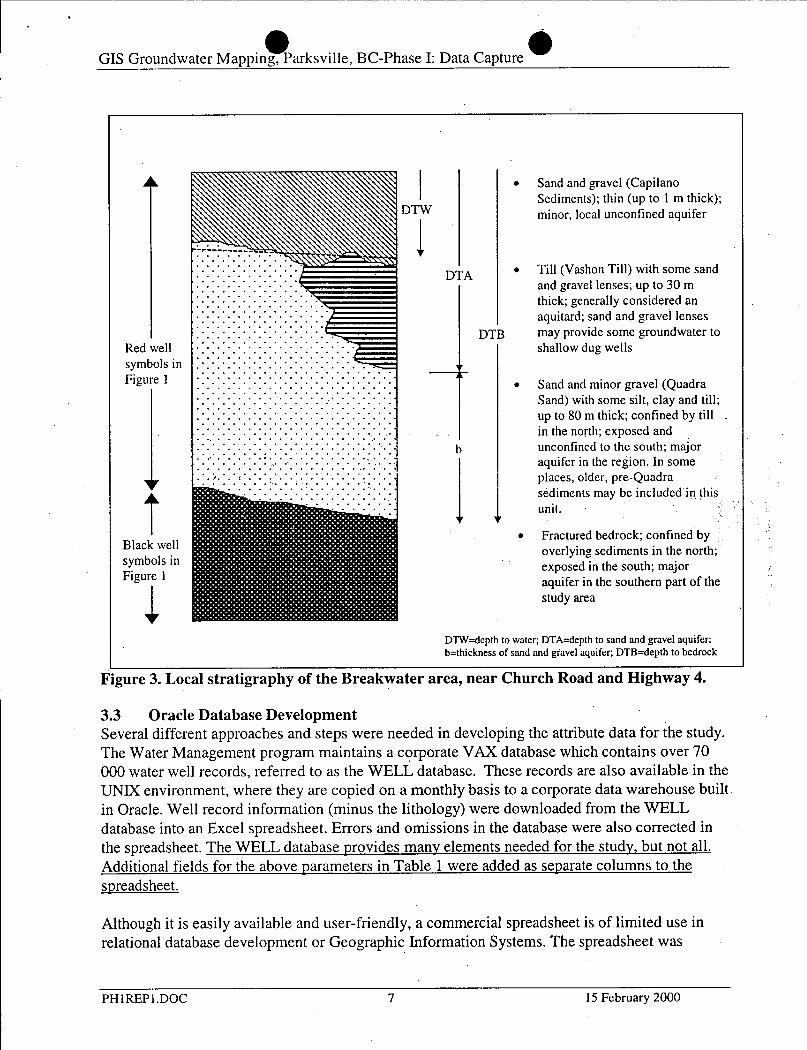
Sand and gravel (Capilano Sediments); thin (up to 1 m thick); minor, local unconfined aquifer
Till (Vashon Till) with some sand and gravel lenses; up to 30 m thick; generally considered an aquitard; sand and gravel lenses may provide some groundwater to shallow dug wells
Sand and minor gravel (Quadra Sand) with some silt, clay and till; up to 80 m thick; confined by till in the north; exposed and unconfined to the south; major aquifer in the region. In some places, older, pre-Quadra sediments may be included in this unit.
Fractured bedrock; confined by overlying sediments in the north; exposed in the south; major aquifer in the southern part of the study area
DTW=depth to water; DTA=depth to sand and gravel aquifer; b=thickness of sand and gravel aquifer; DTB=depth to bedrock
gure 3. Local stratigraphy of the Breakwater area, near Church Road and Highway 4.
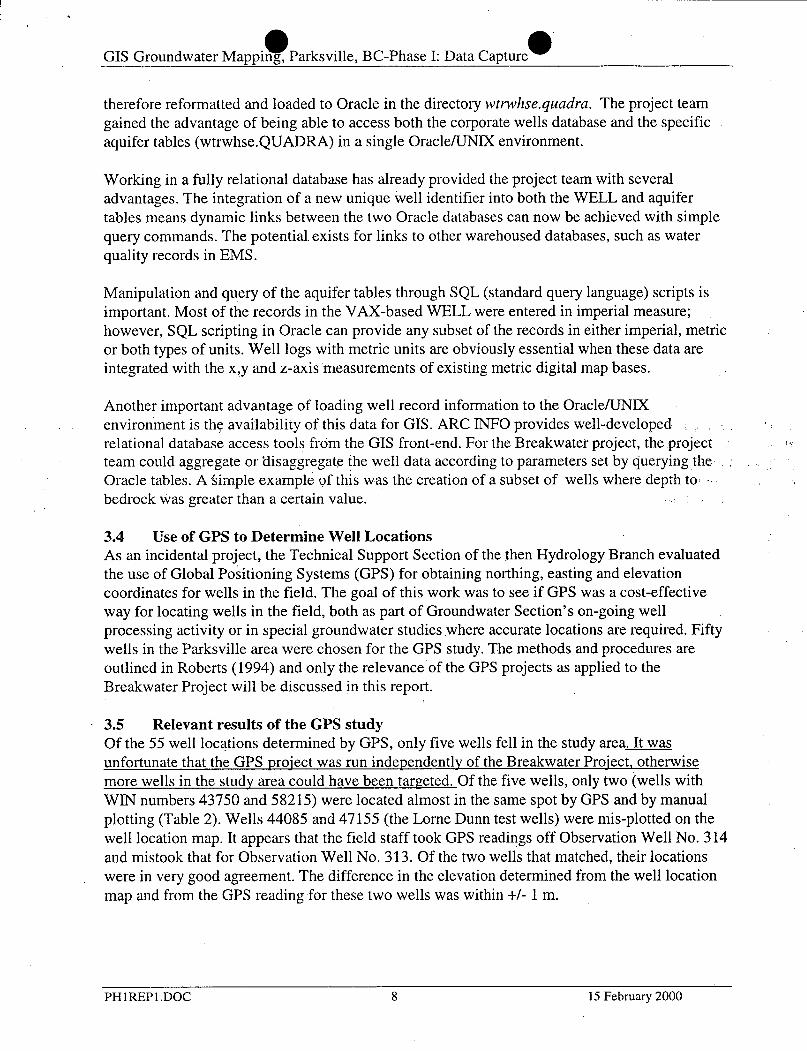
3.3 Oracle Database Development Several different approaches and steps were needed in developing the attribute data for the study. The Water Management program maintains a corporate VAX database which contains over 70 000 water well records, referred to as the WELL database. These records are also available in the UNIX environment, where they are copied on a monthly basis to a corporate data warehouse built in Oracle. Well record information (minus the lithology) were downloaded from the WELL database into an Excel spreadsheet. Errors and omissions in the database were also corrected in the spreadsheet. The WELL database provides many elements needed for the study, but not all. Additional fields for the above parameters in Table 1 were added as separate columns to the spreadsheet.
Although it is easily available and user-friendly, a commercial spreadsheet is of limited use in relational database development or Geographic Information Systems. The spreadsheet was
PH 1 REP 1 .DOC 7 15 February 2000
0 0 GIS Groundwater Mapping, Parksville, BC-Phase I: Data Capture
therefore reformatted and loaded to Oracle in the directory wtnvhse.quudru. The project team gained the advantage of being able to access both the corporate wells database and the specific aquifer tables (wtrwhse.QUADRA) in a single Oracle/UNIX environment.
Working in a fully relational database has already provided the project team with several advantages. The integration of a new unique well identifier into both the WELL and aquifer tables means dynamic links between the two Oracle databases can now be achieved with simple query commands. The potential. exists for links to other warehoused databases, such as water quality records in EMS.
Manipulation and query of the aquifer tables through SQL (standard query language) scripts is important. Most of the records in the VAX-based WELL were entered in imperial measure; however, SQL scripting in Oracle can provide any subset of the records in either imperial, metric or both types of units. Well logs with metric units are obviously essential when these data are integrated with the x,y and z-axis measurements of existing metric digital map bases.
Another important advantage of loading well record information to the OracleKJNIX environment is the availability of this data for GIS. ARC INFO provides well-developed relational database access tools from the GIS front-end. For the Breakwater project, the project team could aggregzte or 'disaggregate the well data according to parameters set by querying the Oracle tables. A Simple example of this was the creation of a subset of wells where depth to bedrock was greater than a certain value.
.
3.4 As an incidental project, the Technical Support Section of the then Hydrology Branch evaluated the use of Global Positioning Systems (GPS) for obtaining northing, easting and elevation coordinates for wells in the field. The goal of this work was to see if GPS was a cost-effective way for locating wells in the field, both as part of Groundwater Section's on-going well processing activity or in special groundwater studies where accurate locations are required. Fifty wells in the Parksville area were chosen for the GPS study. The methods and procedures are outlined in Roberts (1994) and only the relevance of the GPS projects as applied to the Breakwater Project will be discussed in this report.
Use of GPS to Determine Well Locations
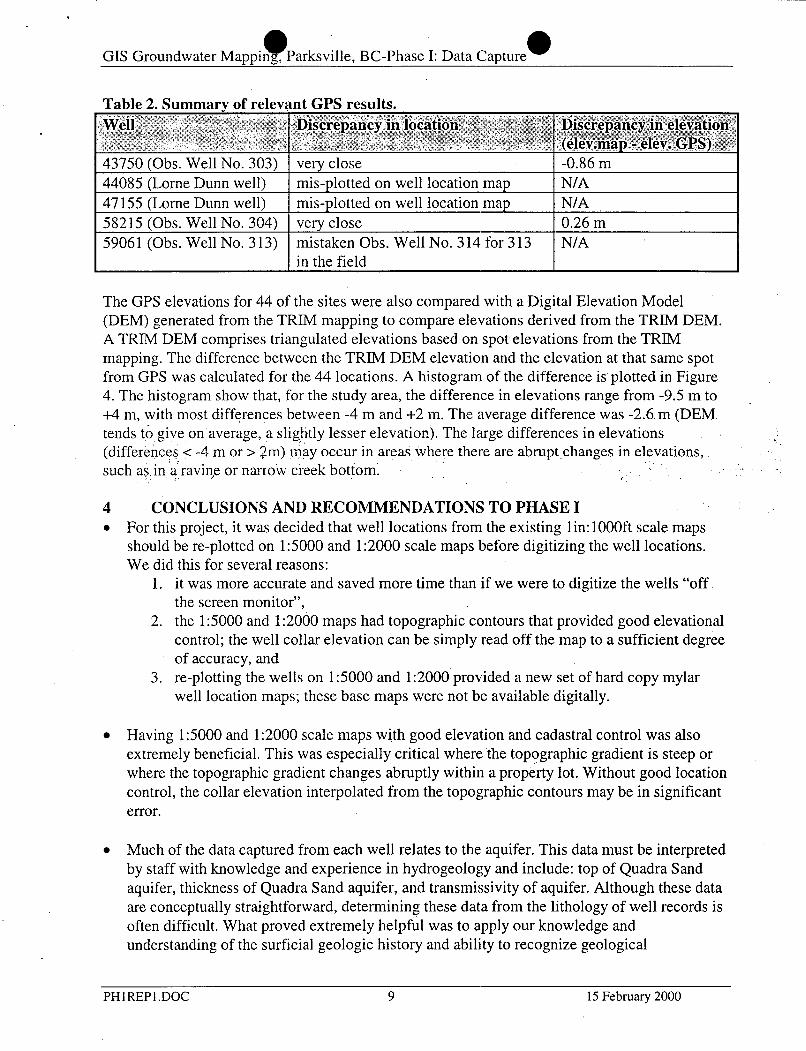
. 3.5 Relevant results of the GPS study Of the 55 well locations determined by GPS, only five wells fell in the study area. It was unfortunate that the GPS project was run independently of the Breakwater Proiect, otherwise more wells in the study area could have been targeted. Of the five wells, only two (wells with WIN numbers 43750 and 58215) were located almost in the same spot by GPS and by manual plotting (Table 2). Wells 44085 and 47155 (the Lorne Dunn test wells) were mis-plotted on the well location map. It appears that the field staff took GPS readings off Observation Well No. 314 and mistook that for Observation Well No. 3 13. Of the two wells that matched, their locations were in very good agreement. The difference in the elevation determined from the well location map and from the GPS reading for these two wells was within +/- 1 m.
PHlREP1.DOC 8 15 February 2000
GIS Groundwater Mapping, 0 Parksville, BC-Phase I: Data Capture e
Well Discrepancy in location Table 2. Summarv of relevant GPS results.
Discrepancy in elevation (elev.hap - elev. GPS)
43750 (Obs. Well No. 303) 44085 (Lorne Dunn well) 47 155 (Lorne Dunn well)
very close -0.86 m mis-plotted on well location map mis-dotted on well location maD
N/A N/A
I 58215 (Obs. Well No. 304) I verv close I 0.26m I 59061 (Obs. Well No. 3 13) mistaken Obs. Well No. 3 14 for 3 13 I I in the field
N/A
The GPS elevations for 44 of the sites were also compared with a Digital Elevation Model (DEM) generated from the TRIM mapping to compare elevations derived from the TRIM DEM. A TRIM DEM comprises triangulated elevations based on spot elevations from the TRIM mapping. The difference between the TRIM DEM elevation and the elevation at that same spot from GPS was calculated for the 44 locations. A histogram of the difference is plotted in Figure 4. The histogram show that, for the study area, the difference in elevations range from -9.5 m to +4 m, with most differences between -4 m and +2 in. The average difference was -2.6 m (DEM tends to give on average, a slightly lesser elevation). The large differences in elevations (differences < -4 m or > 2m) may occur in areas where there are abrupt changes in elevations, such as in iraviqe or nariow creek bottom.
4 0
CONCLUSION§ AND RECOMMENDATIONS TO PHASE I For this project, it was decided that well locations from the existing 1in:lOOOft scale maps should be re-plotted on 1:5000 and 1:2000 scale maps before digitizing the well locations. We did this for several reasons:
1. it was more accurate and saved more time than if we were to digitize the wells “off the screen monitor”,
2. the 1:5000 and 1:2000 maps had topographic contours that provided good elevational control; the well collar elevation can be simply read off the map to a sufficient degree of accuracy, and
3. re-plotting the wells on 1:5000 and 1:2000 provided a new set of hard copy mylar well location maps; these base maps were not be available digitally.
Having 1:5000 and 1:2000 scale maps with good elevation and cadastral control was also extremely beneficial. This was especially critical where the topographic gradient is steep or where the topographic gradient changes abruptly within a property lot. Without good location control, the collar elevation interpolated from the topographic contours may be in significant error.
Much of the data captured from each well relates to the aquifer. This data must be interpreted by staff with knowledge and experience in hydrogeology and include: top of Quadra Sand aquifer, thickness of Quadra Sand aquifer, and transmissivity of aquifer. Although these data are conceptually straightforward, determining these data from the lithology of well records is often difficult. What proved extremely helpful was to apply our knowledge and understanding of the surficial geologic history and ability to recognize geological
PHI REP1 .DOC 9 15 February 2000
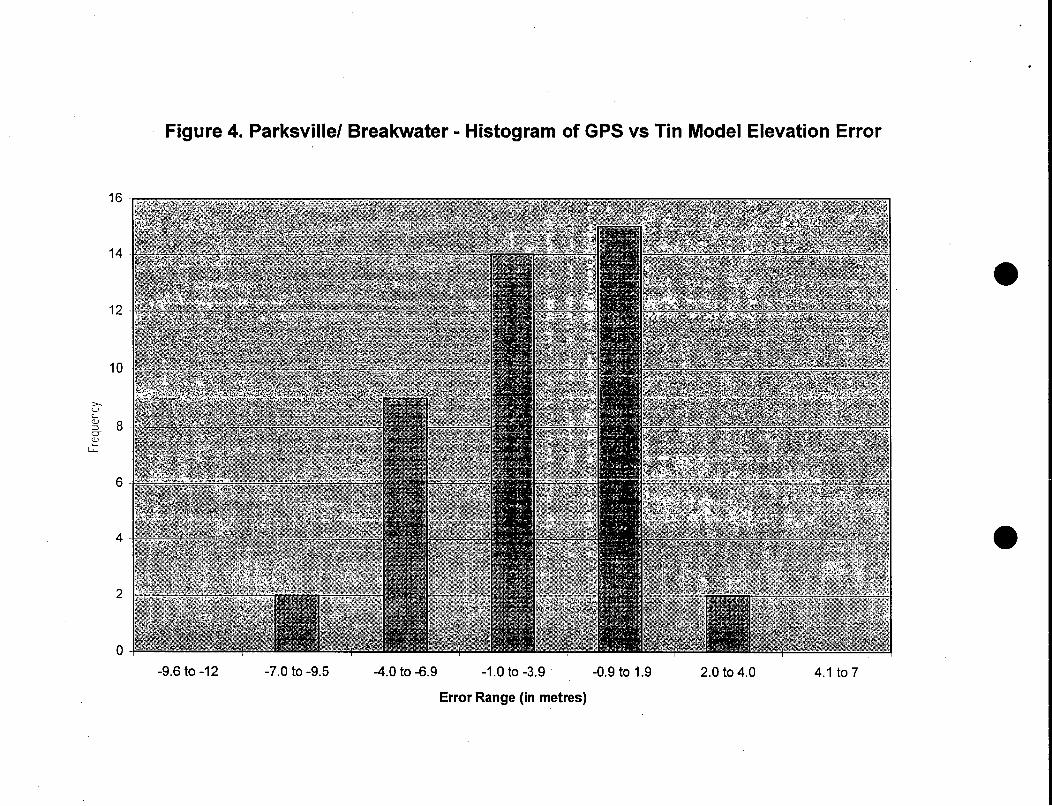
Figure 4. Parksville/ Breakwater - Histogram of GPS vs Tin Model Elevation Error
16
14
12
10
8
6
4
2
0
-9.6 to -12 -7.0 to -9.5 -4.0 to -6.9 -1 .o to -3.9 -0.9 to 1.9 2.0 to 4.0 4.1 t07
Error Range (in metres)
0 GIS Groundwater BC-Phase I: Data Capture
environments from the lithology to determine where, stratigraphically, does the Quadra Sand begin and end (bottom and top).
The sparse number of wells surveyed by GPS within the study area showed that better communication and coordination should have occurred between the GPS well location project (run by the Inventory and Mapping Unit and former Technical Support Section) and the Breakwater project. Although the GPS project fulfilled its goal of obtaining geographic coordinates and elevations for 50 wells in the Parksville area, coordination between the projects could have more wells to be located by GPS in the Breakwater study area so that the difference in accuracy of well locations from GPS and from well location mapping can be assessed.
The current WELL database does not have the fields to include aquifer data interpreted from each well record (e.g., top of aquifer, aquifer thickness, aquifer transmissivity). Strong consideration should be given to enhancing the WELL database with additional fields to accept aquifer data from detailed groundwater studies, such as the Breakwater study.
0 It is recommended that Phase IT of the Breakwater study proceed as a next step. The goal of Phase IT would be t@ characterize the hydrogeology of the study area and develop a conceptual model of groundwater flow for a MODFLOW model. Tasks fcx Phase ZT include:
1. updatihg the existing Oracle database with wells that were dri!led in the 1 a t 5 yeas, 2. develop maps of static water elevation, depth to water, top of Quadra Sand aquifer,
thickness of Quadra Sand aquifer, elevatior. of top of bedrock, and depth Lo top of bedrock to characterize the groundwater flow and hydrogeology of the study area
3. conduct some field work to obtain well and water level information in critical areas and water chemistry data, where required,
4. define the model area, including conditions of boundaries.
5 REFERENCES Driscoll, F.G., 1986. Groundwater and Wells. 2"d ed. Johnson Division, St. Paul, Minnesota. 1089 pp.
Fyles, J.G., 1963. Suflcial Geology of Horne Lake and Parksville Map-Areas, Vancouver Island, British Columbia. Geological Survey of Canada, Memoir 3 18.
Roberts, G., 1994. Parksville GPS on Well Sites - Test and Evaluation. Unpublished report, Survey Data Systems Unit, Technical Support Section, Hydrology Branch, Water Management Division, Ministry of Environment, Lands and Parks.
PH 1 REP 1 .DOC 10 15 February 2000
e 0 GIS Groundwater Mapping, Parksville, BC-Phase I: Data Capture
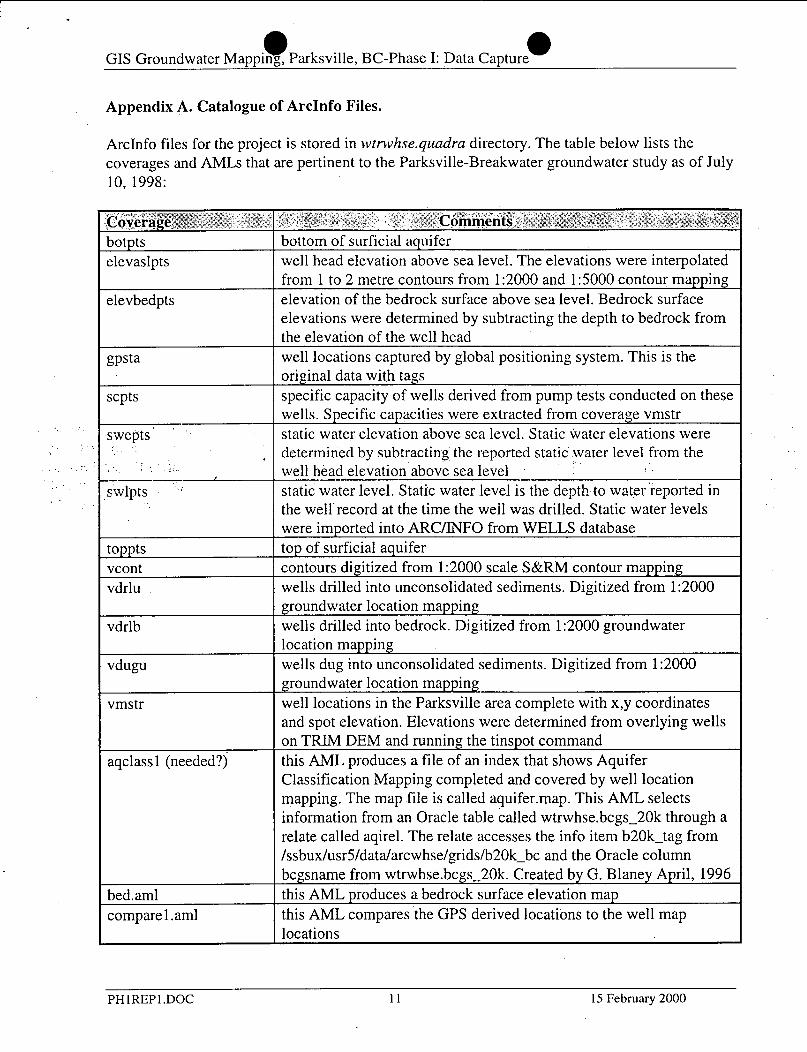
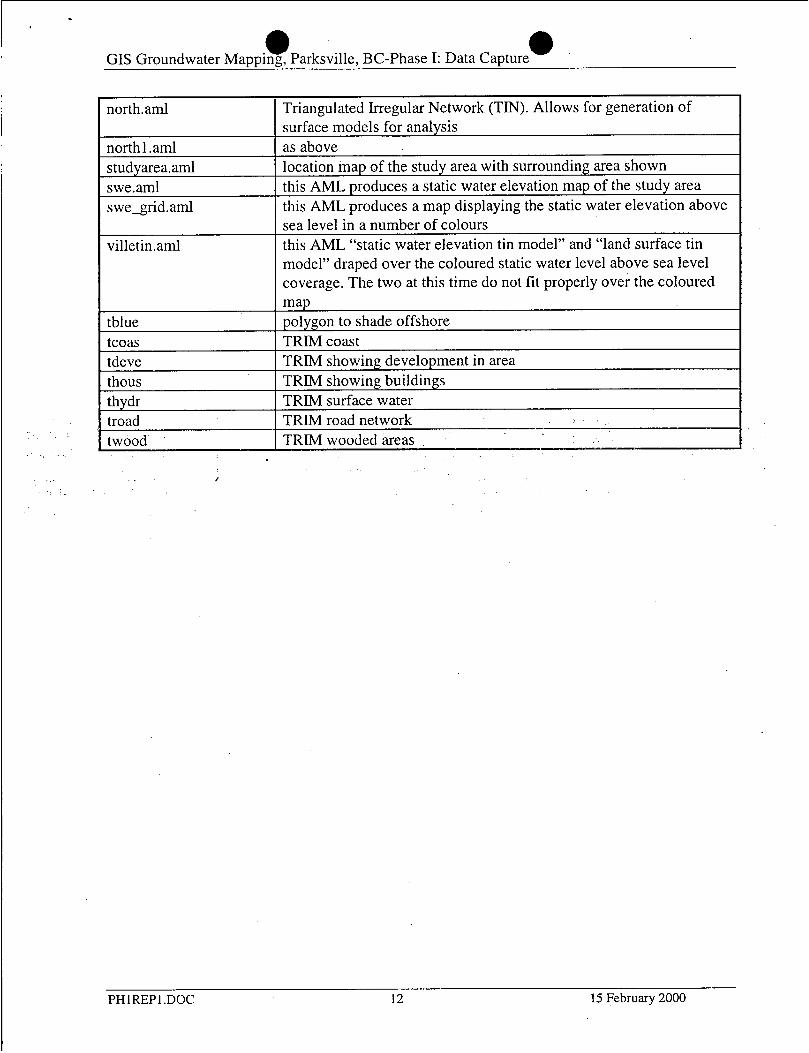
Appendix A. Catalogue of ArcInfo Files.
ArcInfo files for the project is stored in wtnvhse.quadra directory. The table below lists the coverages and AMLs that are pertinent to the Parksville-Breakwater groundwater study as of July 10, 1998:
Coyerage '
botpts elevaslpts
elevbedpts
scpts
sivepts
swlpts ~
toppts vcont vdrlu
vdrlb
vdugu
vmstr
aqclassl (needed?)
bed.am1 compare1 .am1
9 . Comments , d *
bottom of surficial aquifer well head elevation above sea level. The elevations were interpolated from 1 to 2 metre contours from 1:2000 and 1:5000 contour mapping elevation of the bedrock surface above sea level. Bedrock surface elevations were determined by subtracting the depth to bedrock from the elevation of the well head well locations captured by global positioning system. This is the original data with tags specific capacity of wells derived from pump tests conducted on these wells. Specific capacities were extracted from coverage vmstr static water elevation above sea level. Static water elevations were determined by subtracting the reported static water level from the well head elevation above sea level static water level. Static water level is the depth to water reported in the well record at the time the weil was drilled. Static water levels were imDorted into ARC/INFO from WELLS database top of surficial aquifer contours digitized from 1:2000 scale S&RM contour mapping wells drilled into unconsolidated sediments. Digitized from 1 :2000 groundwater location mapping wells drilled into bedrock. Digitized from 1 :2000 groundwater location mapping wells dug into unconsolidated sediments. Digitized from 1 :2000 groundwater location mapping well locations in the Parksville area complete with x,y coordinates and spot elevation. Elevations were determined from overlying wells on TRIM DEM and running the tinspot command this AML produces a file of an index that shows Aquifer Classification Mapping completed and covered by well location mapping. The map file is called aquifer.map. This AML selects information from an Oracle table called wtrwhse.bcgs-20k through a relate called aqirel. The relate accesses the info item b20k-tag from /ssbux/usr5/data/arcwhse/grids/b2Ok-b~ and the Oracle column bcgsname from wtrwhse.bcgs-20k. Created by G. Blaney April, 1996 this AML produces a bedrock surface elevation map this AML compares the GPS derived locations to the well map locations
PH 1 REP 1 .DOC 1 1 15 February 2000
a e GIS Groundwater Mapping, Parksville, BC-Phase I: Data Capture
north.am1
north1 .am1 s tudyarea. am1 swe.aml swe-grid. am1
villetin.am1
tblue tcoas tdeve thous thydr troad twood
Triangulated Irregular Network (TIN). Allows for generation of surface models for analysis as above location map of the study area with surrounding area shown this AML produces a static water elevation map of the study area this AML produces a map displaying the static water elevation above sea level in a number of colours this AML “static water elevation tin model” and “land surface tin model” draped over the coloured static water level above sea level coverage. The two at this time do not fit properly over the coloured map polygon to shade offshore TRIM coast TRIM showing development in area TRIM showing buildings TRIM surface water TRIM road network TRIM wooded areas
PH 1 REP 1 .DOC 12 15 February 2000
e 0 GIS Groundwater Mapping, Parksville, BC-Phase I: Data Capture
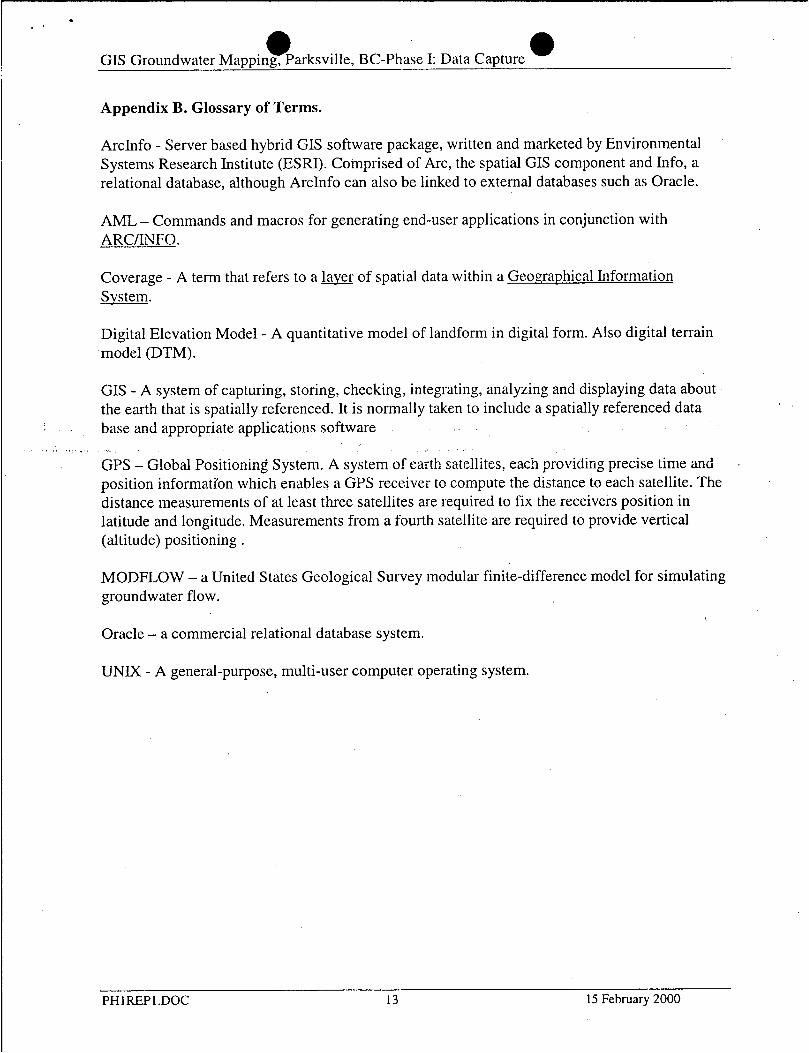
Appendix B. Glossary of Terms.
ArcInfo - Server based hybrid GIS software package, written and marketed by Environmental Systems Research Institute (ESRI). Comprised of Arc, the spatial GIS component and Info, a relational database, although ArcInfo can also be linked to external databases such as Oracle.
AML - Commands and macros for generating end-user applications in conjunction with ARCDNFO.
Coverage - A term that refers to a layer of spatial data within a Geom-aphical Information System.
Digital Elevation Model - A quantitative model of landform in digital form. Also digital terrain model (DTM).
GIS - A system of capturing, storing, checking, integrating, analyzing and displaying data about the earth that is spatially referenced. It is normally taken to include a spatially referenced data base and appropriate applications software
GPS - Global Positioning System. A system of earth satellites, each providing precise time and position informatibn which enables a GPS receiver to compute the distance to each satellite. The distance measurements of at least three satellites are required to fix the receivers position in latitude and longitude. Measurements from a foui-th satellite are required to provide vertical (altitude) positioning .
MODFLOW - a United States Geological Survey modular finite-difference model for simulating groundwater flow.
Oracle - a commercial relational database system.
UNIX - A general-purpose, multi-user computer operating system.
~~
PH 1 REP1 .DOC 13 15 February 2000