gis-iap-esripug2013 oil spill sensitivity mapping
TRANSCRIPT

“Insert” then choose “Picture” – select your picture.
Right click your picture and “Send to back”.
The world’s leading sustainability consultancy
Oil Spill Response PlanningCoastal and Marine Environmental Sensitivity Mapping
The world’s leading sustainability consultancy
Simon Ross
8th May 2013
ESRI PUG Conference

The world’s leading sustainability consultancy
Overview
Understanding Environmental Sensitivities
■ What are they?
■ Why do we map them?
Environmental Sensitivity Mapping Process
Lessons Learned and Future Developments
The world’s leading sustainability consultancy
What Are Environmental Sensitivities?
IMO/IPIECA Definition
Resources, habitats, sites or activities are considered
sensitive to oil spills because they are:
1. of environmental, economic, or cultural importance;
2. at risk of coming in contact with spilled oil; and
3. likely to be affected once oiled or affected by the oil even without
direct contact.
(Michel, Christopherson and Whiple, 1994).

The world’s leading sustainability consultancy
Why Map Environmental Sensitivities?
Sensitivity mapping enables:
■ Most sensitive sites/resources to be identified
■ Priorities for spill response and clean up to be defined
Successful sensitivity mapping informs the development of:
■ Oil spill response strategy and contingency plans
■ Waste management strategies
■ Response equipment deployment
■ Response maps and databases

The world’s leading sustainability consultancy
1. Define the Study Area
2. Identify Data Sources
3. Collect Information
4. Assess Sensitivity
5. Apply Results
Source: IMO/IPIECA
ESM – A staged approach

The world’s leading sustainability consultancy
ESM: 1. Define the Study Area
http://gomex.erma.noaa.gov/erma.html (Map Data © Google 2012)

The world’s leading sustainability consultancy
ESM: 2. Identify Data Sources
+ logistical/ operational features
1. Characterize Study Area
• What are the potential sensitivities?
• What team of specialists is required?
2. Existing Data Review
• Existing sensitivity maps
• Public and Commercial databases
• Remote Sensing
• Field Survey
3. Data Collection Strategy
• Prioritize data collection –cost/benefit
• Agree strategy with project stakeholders

The world’s leading sustainability consultancy
ESM: 2. Identify Data Sources – Data Strategy
Category Feature Data Type
Gap
Exi
sts
Exi
stin
g G
IS D
ata
Lit
erat
ure
Rev
iew
Rem
ote
Sen
sin
g
In-C
ou
ntr
y (i
nc.
Fie
ld)
Work Phase
Basemap Satellite Imagery/Aerial Photos raster Y Y Y Phase 1 - Public Desktop
Basemap Topographic Maps raster Y Y Y Phase 2 - Desktop
Basemap Nautical Charts raster/vector Y Y Phase 1 - Public Desktop
Basemap Elevation raster Y Y Phase 1 - Public Desktop
Basemap Bathymetry raster/line Y Y Phase 1 - Public Desktop
Socio-economic
Administrative boundaries (i.e. states,
provinces etc. - including
demographic data)
polygon Y Y Y Phase 1 - Public Desktop
Socio-economicSettlements (towns, cities, villages -
including population numbers )point Y Y Y Y Phase 2 - Desktop
Socio-economicLand Transport (roads - primary,
secondary, tertiary; rail)line Y Y Y Phase 2 - Desktop
Socio-economicFerry and Shipping Routes (location
and intensity)line/raster Y Y Phase 2 - Desktop
Socio-economicCoastal Infrastructure (ports, jetties,
quays, water intakes, outfalls etc.)point Y Y Y Y Y Phase 3 - Field Survey
Socio-economicAirports and Helipads (including
runway length and capacitypoint/line Y Y Y Y Y Phase 3 - Field Survey
Onshore EnvironmentProtected Areas (designated or
planned)polygon Y Y Y Phase 1 - Public Desktop
Data Gap Closure

The world’s leading sustainability consultancy
ESM: 3. Collect Information
1. Needs Assessment
• What will geographic data be used for?
• How do stakeholders need to access GIS data?
2. System Design
• Data storage format and location
• Data model
• GIS data standards
• QA/QC protocols
3. Collect Data
• Follow data collection strategy and system design
• Track progress
The world’s leading sustainability consultancy
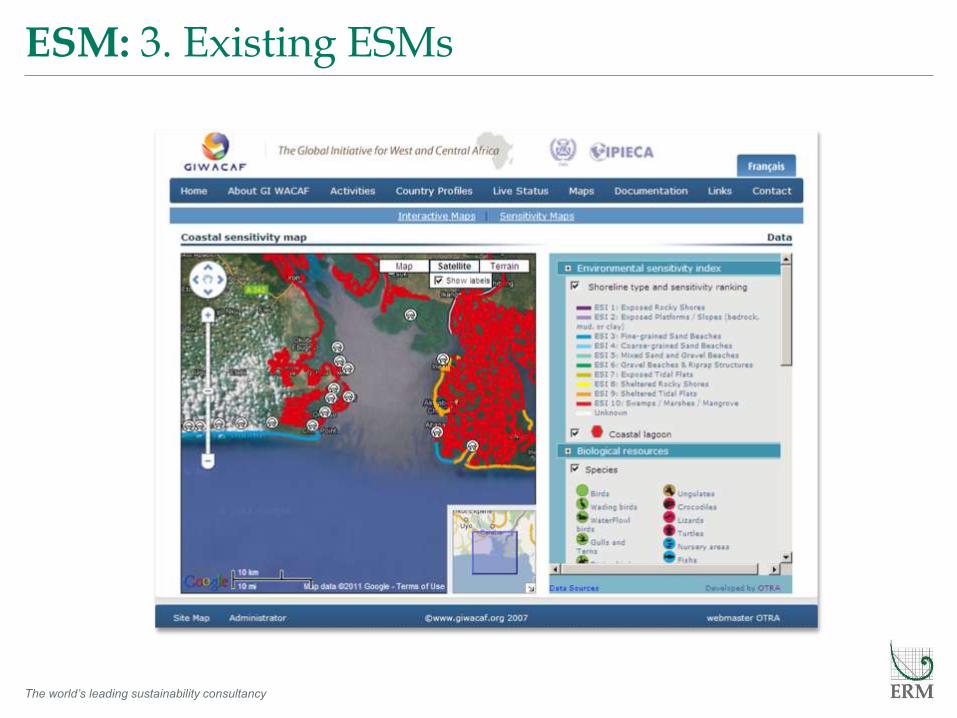
ESM: 3. Existing ESMs

The world’s leading sustainability consultancy
ESM: 3. Remote Sensing: Regional
The world’s leading sustainability consultancy
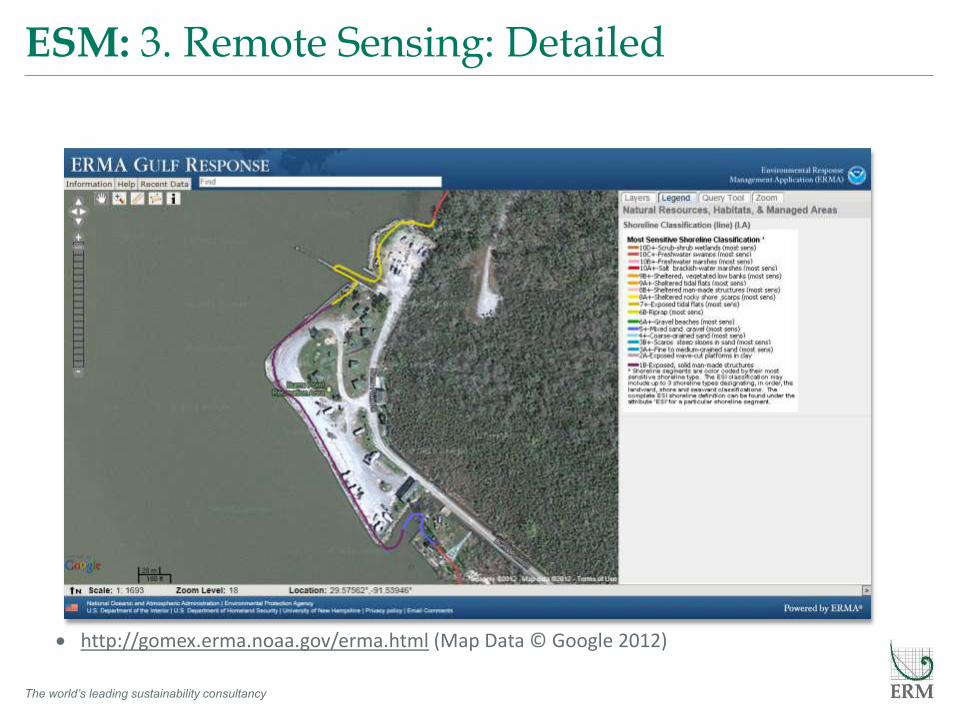
ESM: 3. Remote Sensing: Detailed
http://gomex.erma.noaa.gov/erma.html (Map Data © Google 2012)
The world’s leading sustainability consultancy
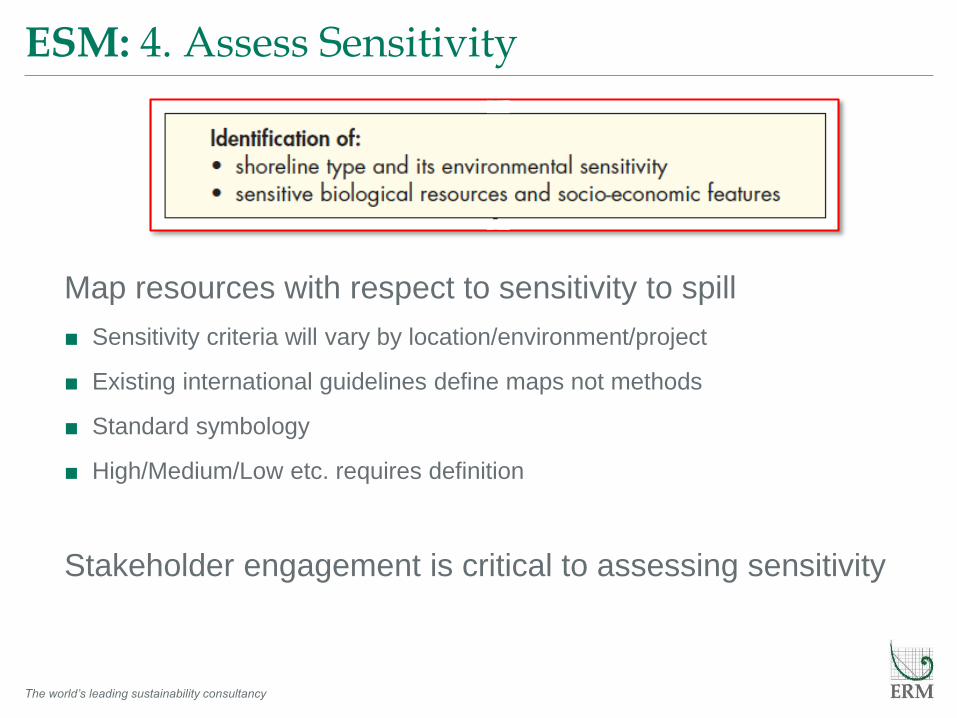
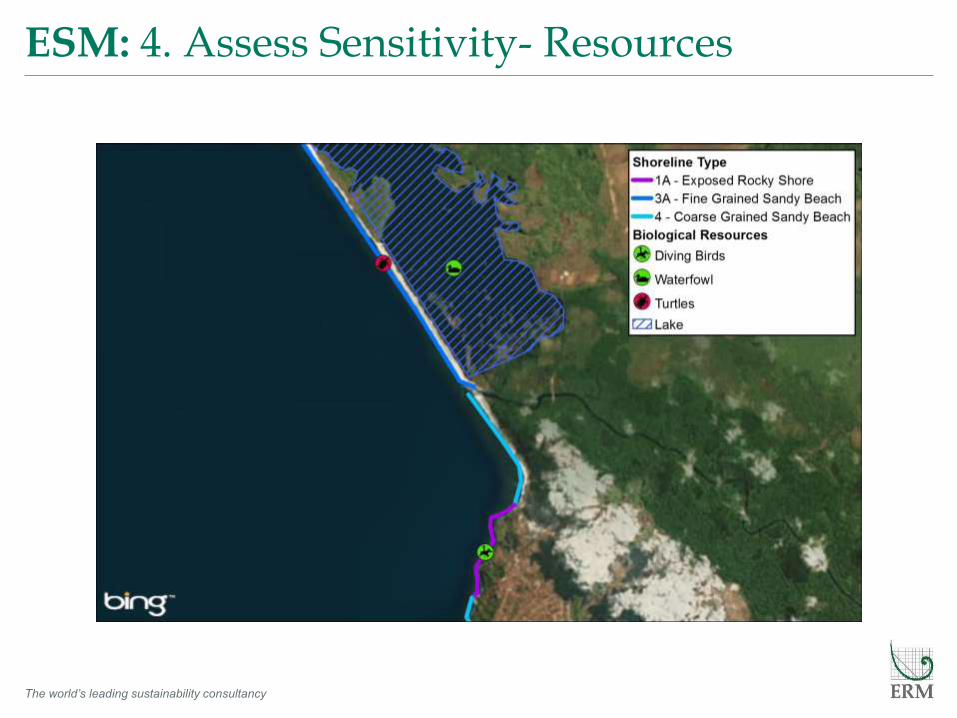
ESM: 4. Assess Sensitivity
Map resources with respect to sensitivity to spill
■ Sensitivity criteria will vary by location/environment/project
■ Existing international guidelines define maps not methods
■ Standard symbology
■ High/Medium/Low etc. requires definition
Stakeholder engagement is critical to assessing sensitivity

The world’s leading sustainability consultancy
ESM: 4. Assess Sensitivity- Shoreline
Well defined International Guidelines (IMO/IPIECA from NOAA)

The world’s leading sustainability consultancy
ESM: 4. Assess Sensitivity- Resources
The world’s leading sustainability consultancy
ESM: 4. Assess Sensitivity- Resources

The world’s leading sustainability consultancy
ESM: 4. Assess Sensitivity- Resources

The world’s leading sustainability consultancy
ESM: 4. Assess Sensitivity- Resources

The world’s leading sustainability consultancy
ESM: 4. Assess Sensitivity- Resources

The world’s leading sustainability consultancy
ESM: 5. Share and Apply Results
GIS provides an alternative to traditional maps:
Ensure most current data is used
Interactive map viewing at all required scales
Integrated data update and editing
Print custom maps on demand

The world’s leading sustainability consultancy
ESM: 5. Share and Apply Results – Web GIS

The world’s leading sustainability consultancy
ESM: Lessons Learned
Continuous Stakeholder Engagement required for:
■ Data collection activities
■ Sensitivity classification
■ Map and GIS system design
Definition of GIS data standards is critical for:
■ Managing data from multiple sources or providers
■ Maintaining quality control
■ Long-term management and update
Keep GIS systems simple:
■ Define critical functions
■ Make interfaces intuitive
■ Ensure high performance
The world’s leading sustainability consultancy
ESM: Conclusions
Maintaining ESMs on a GIS platform ensures:
■ Users always have the most recent information
■ Data can be transferred to other systems
■ Central tracking of data and quality
■ Easily scalable to manage during incident
System configuration transferrable to other projects:
■ Globally consistent platform for operator
■ Maintain local responsibility for data
■ Reduce organizational training and development costs
■ Reuse data for other projects