gis modeling - colorado.edu · example uncertainty modeling • global accuracy measures? • like...
TRANSCRIPT
GIS Modeling
Class 13: Uncertainty in „Source
Data“
Geography 4203 / 5203

Some Updates
Last Lecture
• We finished the conceptual part of uncertainty andspatial data quality
• You have seen some examples where uncertaintylead to a lack of the fitness of the data for theintended use (hydro-charts, bogs, forest in historicalmaps)
• We talked about general aspects of SDQ and wediscussed some first definitions of uncertainty/SDQtogether with some examples
• We started with looking at errror models for sourcedata such as CSE, Perkal band
Today‘s Outline
• We will continue with error models and uncertaintyassessment
• After looking at measurable errors in position (or ratio-scaled attributes) and methodological aspects how toassess these errors we will talk aboutcategorical/nominal data that rather fit the perspective ofraster-based modeling in a GIS
• We will go through the error table/confusion matrix anddiscuss some of the summary statistics available andwhere the limitations of using confusion matrices are
• You will see some examples of how to overcome theselimitations
Learning Objectives
• You will understand the terms, concepts and meaningsregarding uncertainty and spatial data quality
• You will be able to explain the differences between error,vagueness, ambiguity and what the elements of SDQ are
• You will know what the SDTS is and what stands behind thefamous five points
• Finally you will be able to explain and use simple error modelsfor positional and attribute accuracy (circular standard error,epsilon bands, confusion matrices)
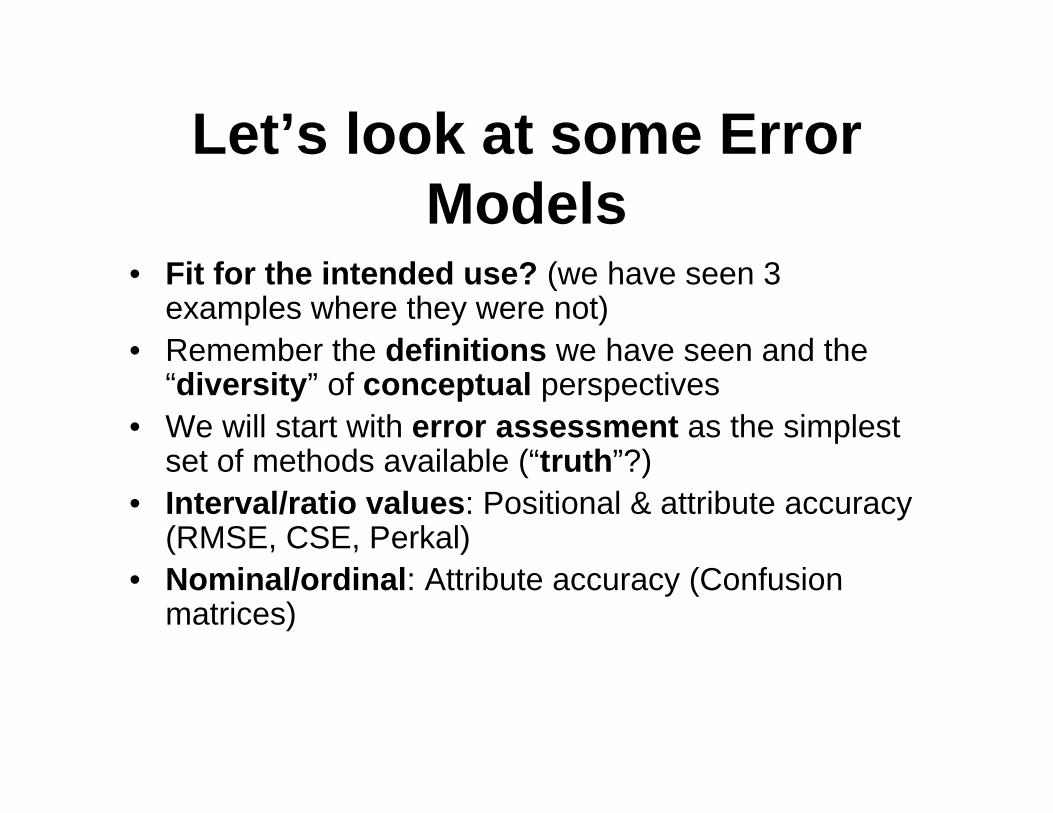
Let’s look at some Error
Models• Fit for the intended use? (we have seen 3
examples where they were not)
• Remember the definitions we have seen and the“diversity” of conceptual perspectives
• We will start with error assessment as the simplestset of methods available (“truth”?)
• Interval/ratio values: Positional & attribute accuracy(RMSE, CSE, Perkal)
• Nominal/ordinal: Attribute accuracy (Confusionmatrices)

How Dependent and
Systematic are my Errors?• … for positional and attribute uncertainty
• Land cover map -> change in land cover type movesboundary
• Chloropleth map -> Administrative boundary(position) predetermined - boundary won t changebecause of a change in an attribute
• For many classes, the class (attribute) ispredetermined e.g. street names - class doesn tchange because of positional uncertainty
• Systematic errors follow a pattern (constant orsystematically varying) and are easy to correct
Random Errors in Points
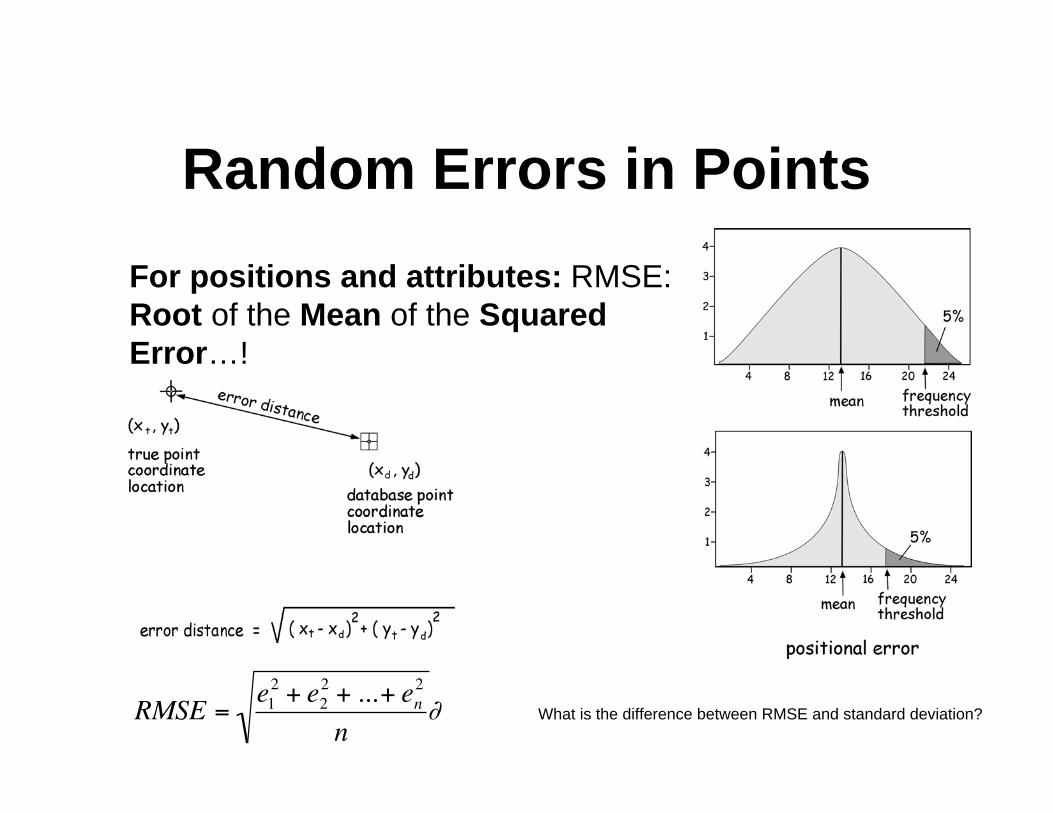
For positions and attributes: RMSE:
Root of the Mean of the Squared
Error…!
RMSE =e12
+ e22
+ ...+ en2
nWhat is the difference between RMSE and standard deviation?
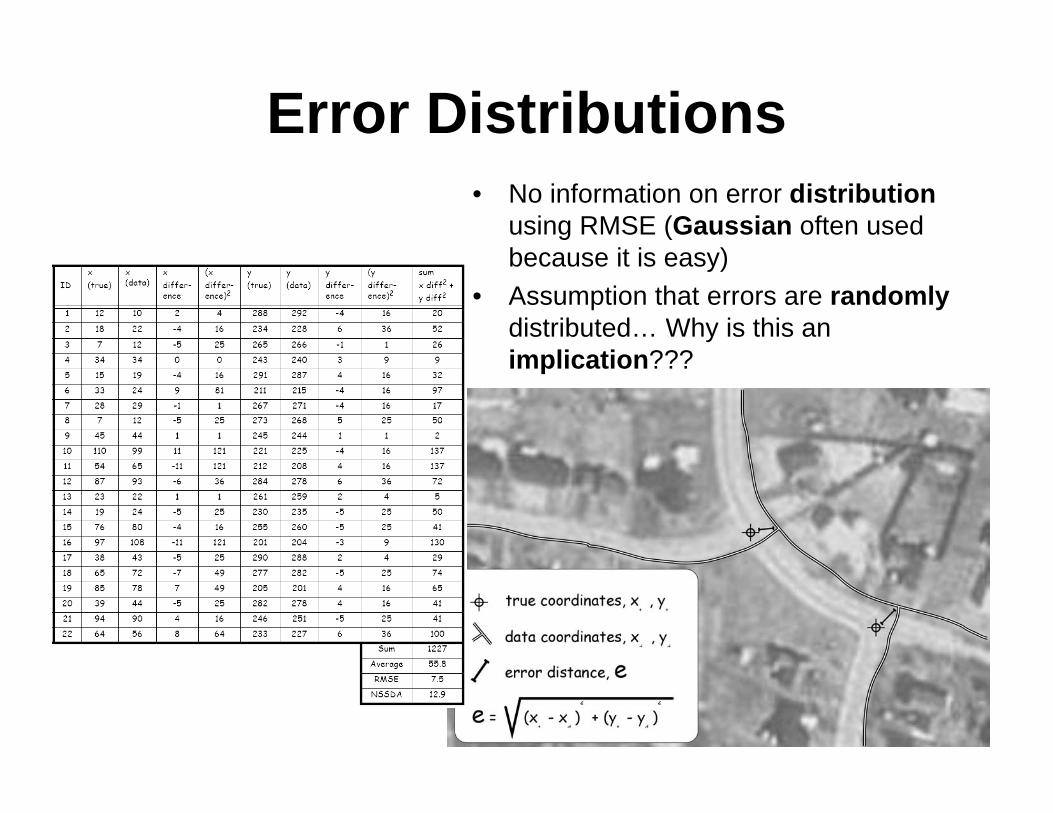
Error Distributions
• No information on error distribution
using RMSE (Gaussian often used
because it is easy)
• Assumption that errors are randomly
distributed… Why is this an
implication???
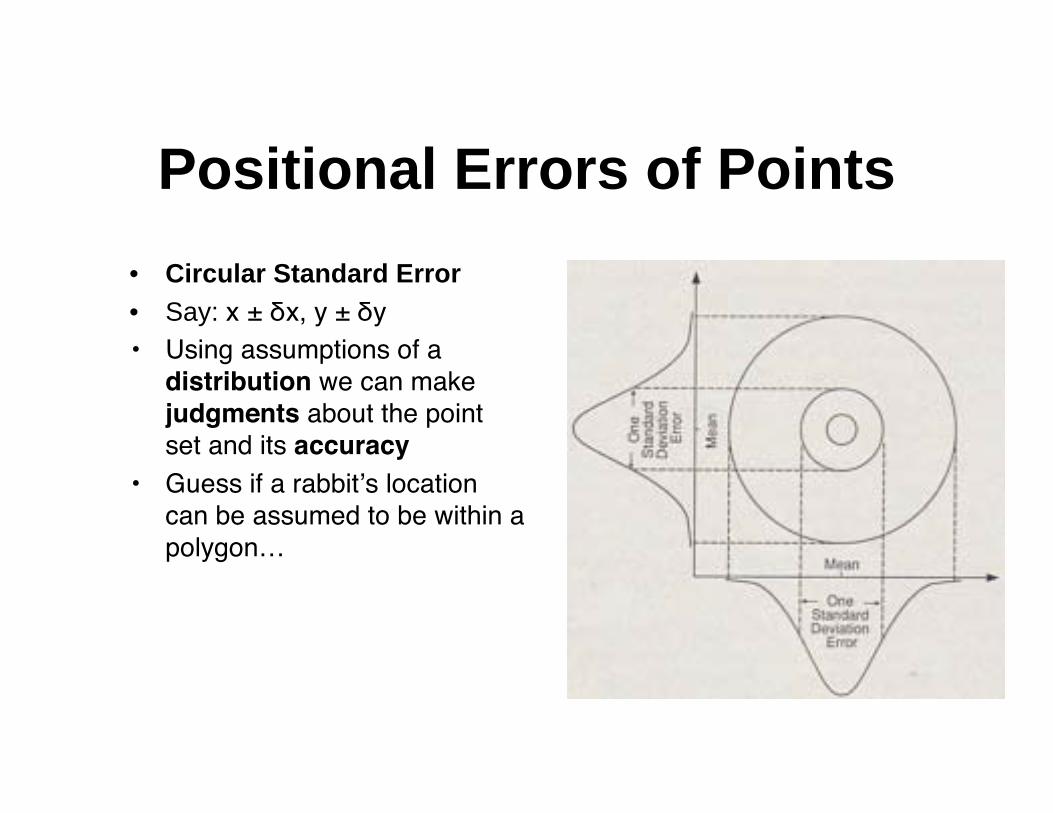
Positional Errors of Points
• Circular Standard Error
• Say: x ± x, y ± y• Using assumptions of adistribution we can makejudgments about the pointset and its accuracy
• Guess if a rabbit s locationcan be assumed to be within apolygon…

And what about Lines and
Polygons?Epsilon or Perkal Bands
Extension of the CSE to lines (their
vertices) to produe constant areas
around the lines
Back to the rabbit-polygon example
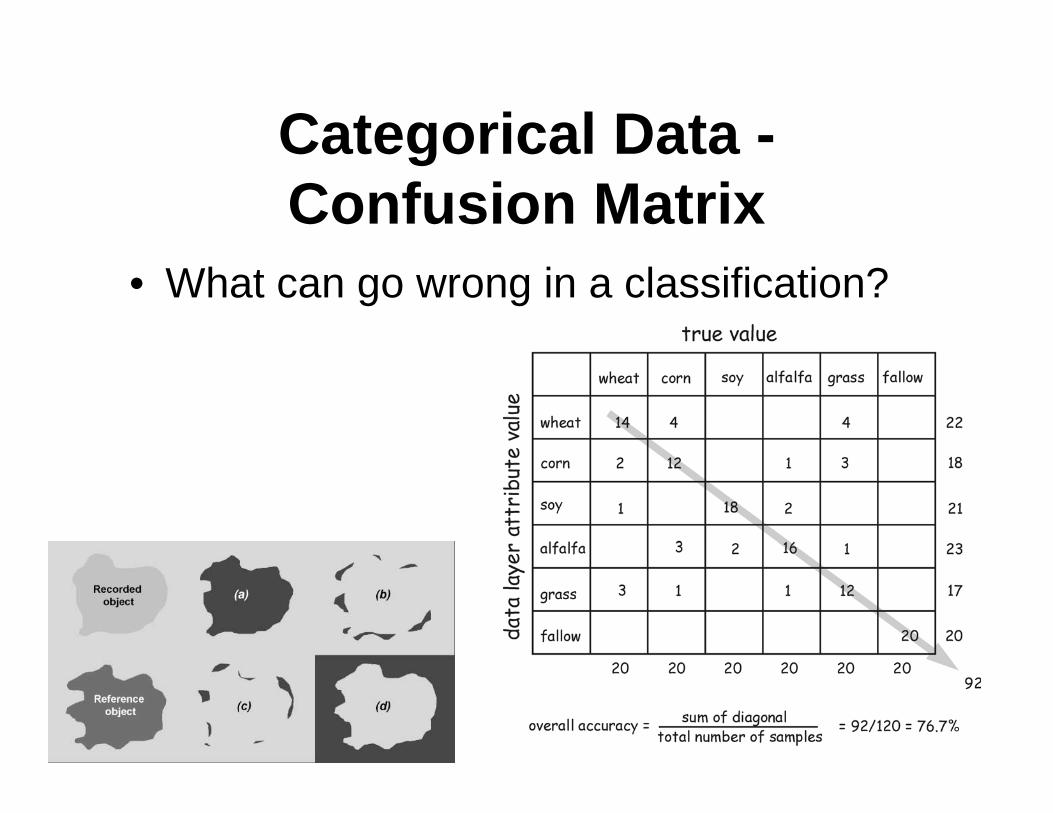
Categorical Data -
Confusion Matrix
• What can go wrong in a classification?

Summary Statistics
• Overall accuracy: Diagonal / Total• Error of ommission (Producer’s
acc.) : proportion of values in reality,which were interpreted as somethingelse: Sum of column s non-diagonalelements / column total (e.g: corn 8/20parcels were ommitted)
• Error of commission (User’s acc.):proportion of values which were inreality found to belong to anotherclass: Sum of row s non-diagonalelements / row total (e.g: For corn 6/18parcels were falsely assigned toanother class
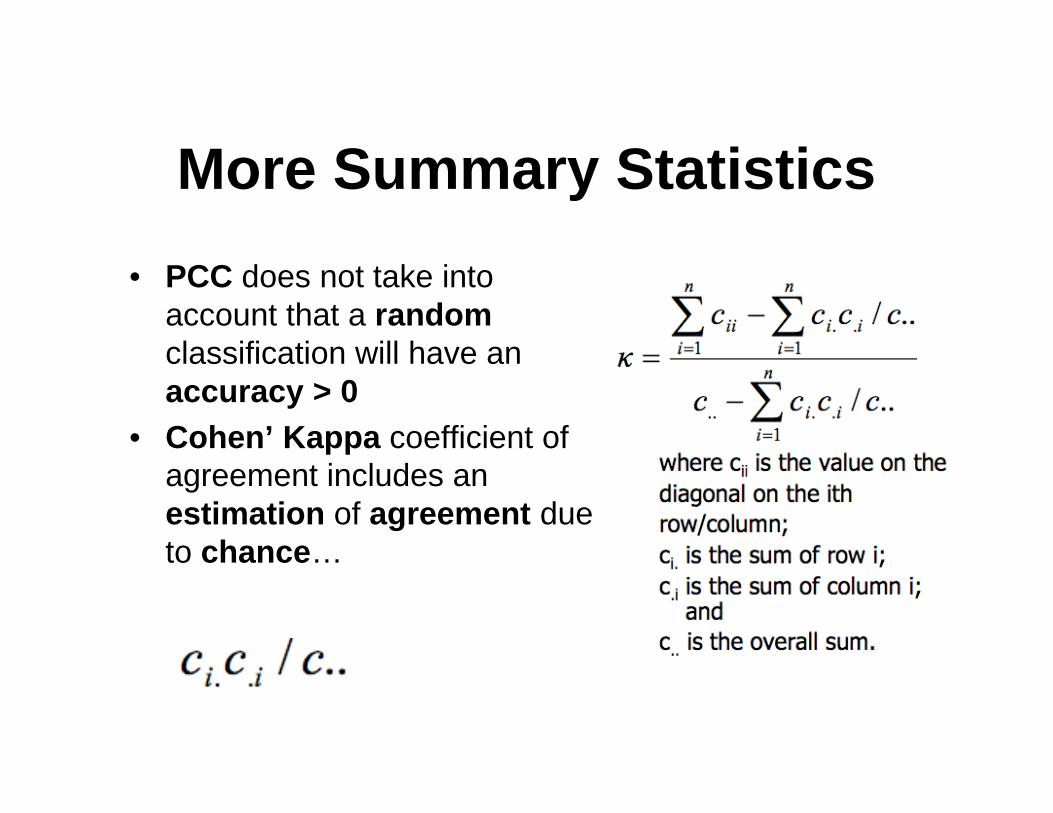
More Summary Statistics
• PCC does not take into
account that a random
classification will have an
accuracy > 0
• Cohen’ Kappa coefficient of
agreement includes an
estimation of agreement due
to chance…

More Summary Statistics

Kappa Example

How Different look the
Summary Statistics?
• How conservative?
• Chance agreement?
• Consideration of classes with low or
high proportions (robustness)

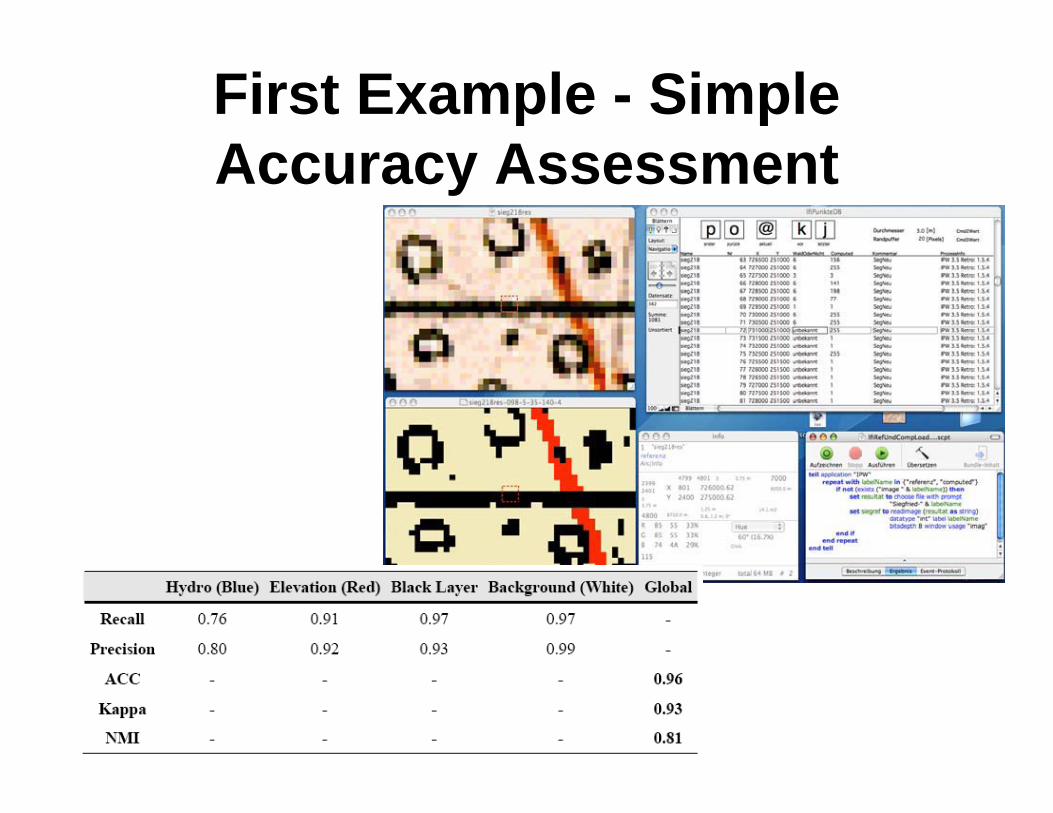
First Example - Simple
Accuracy Assessment
• Image extraction
result to be evaluated
against human
inspection efforts
First Example - Simple
Accuracy Assessment

What is lacking with
summary statistics?

What is lacking with
summary statistics?• Spatial orientation?
• Judgments for the local unit/entity?
• Development of Geographical weighting, local
summary statistics based on window operations
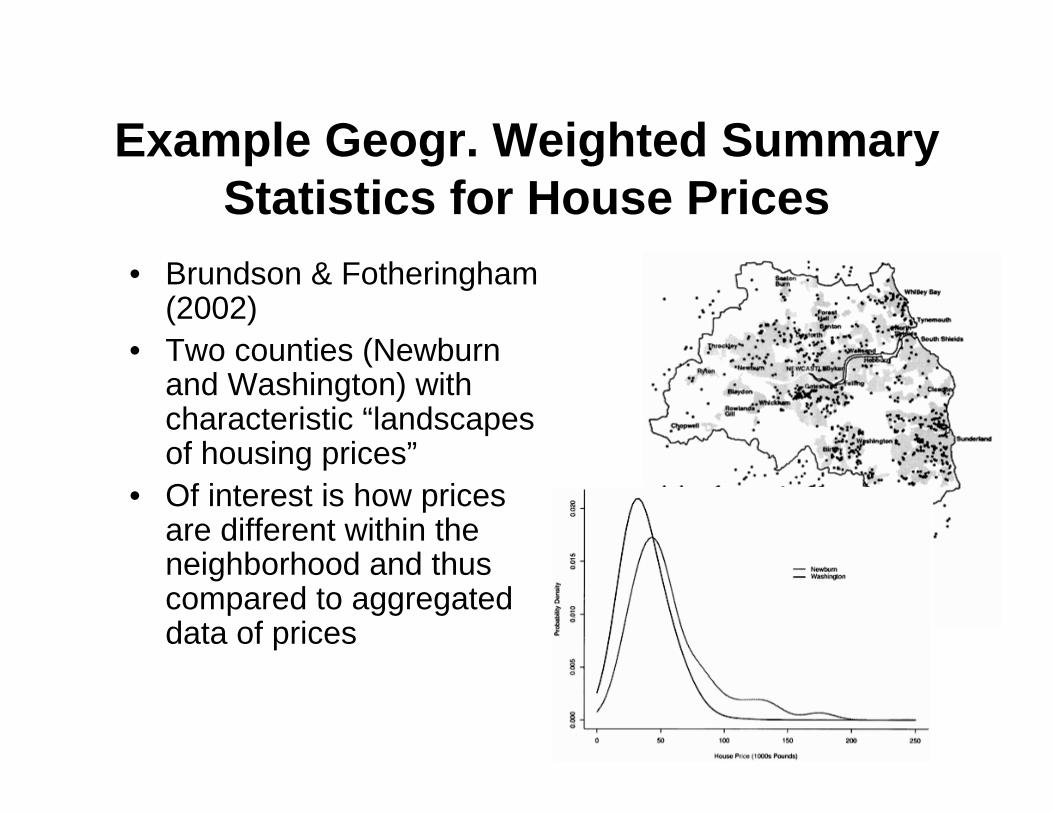
Example Geogr. Weighted Summary
Statistics for House Prices
• Brundson & Fotheringham(2002)
• Two counties (Newburnand Washington) withcharacteristic “landscapesof housing prices”
• Of interest is how pricesare different within theneighborhood and thuscompared to aggregateddata of prices
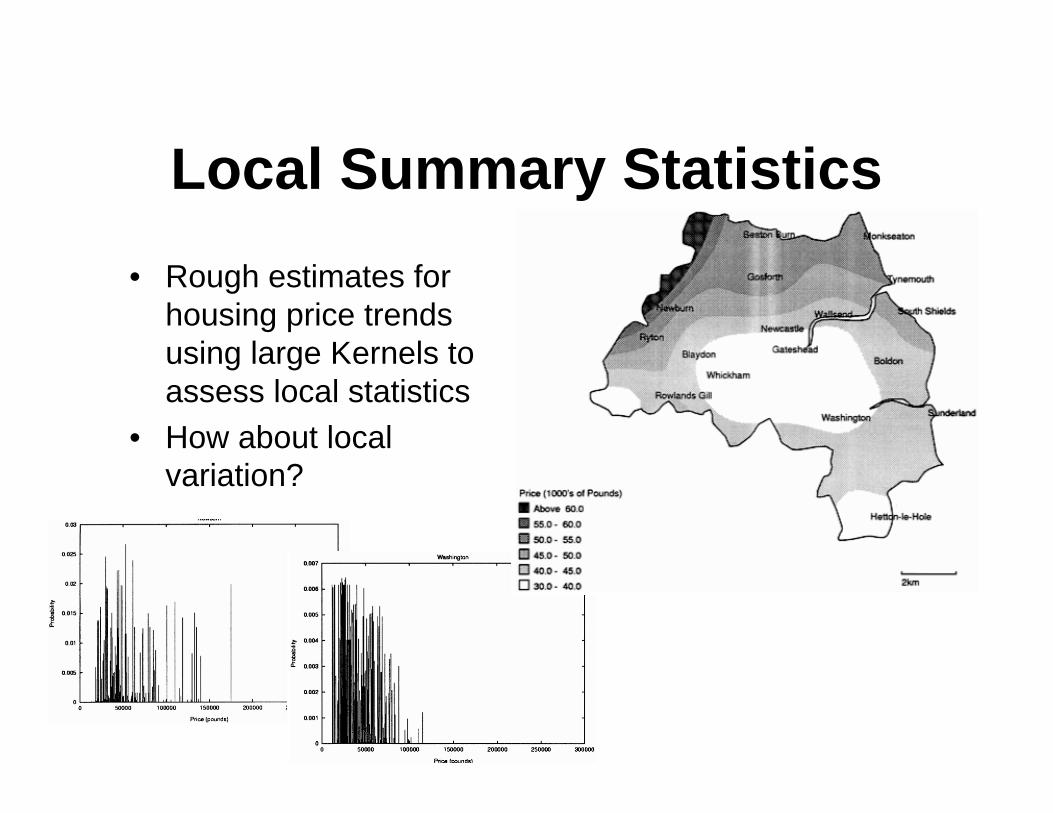
Local Summary Statistics
• Rough estimates for
housing price trends
using large Kernels to
assess local statistics
• How about local
variation?
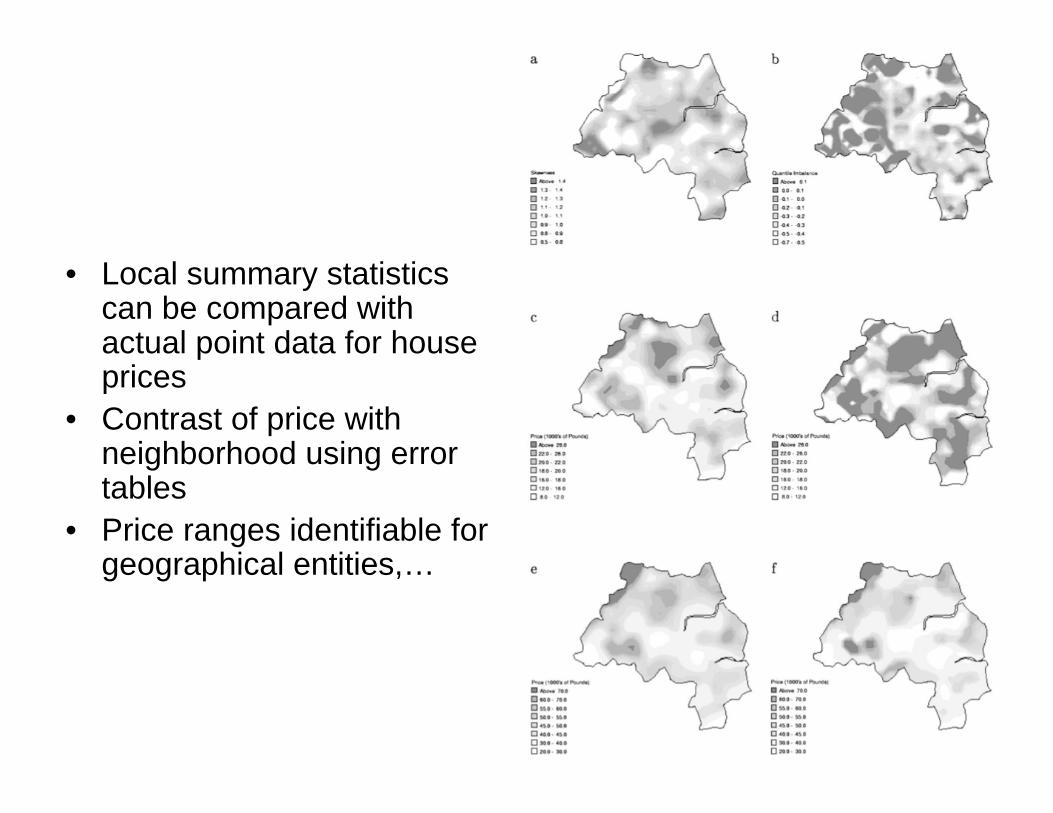
• Local summary statisticscan be compared withactual point data for houseprices
• Contrast of price withneighborhood using errortables
• Price ranges identifiable forgeographical entities,…
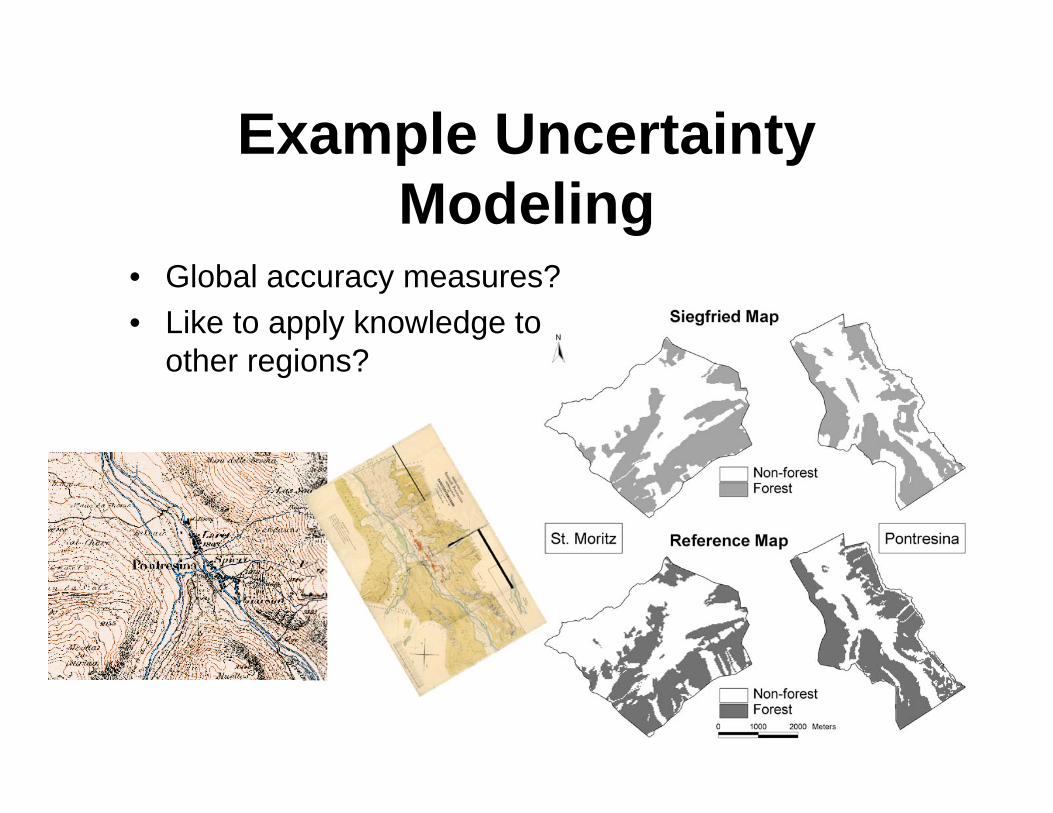
Example Uncertainty
Modeling• Global accuracy measures?
• Like to apply knowledge to
other regions?
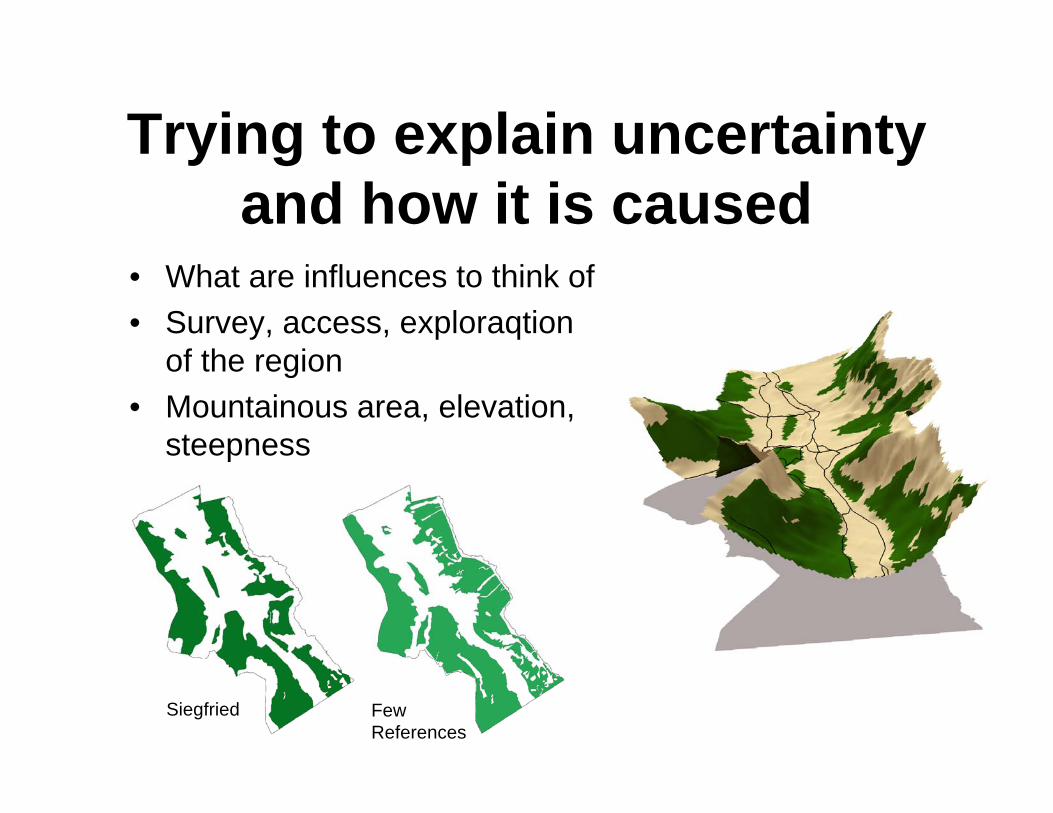
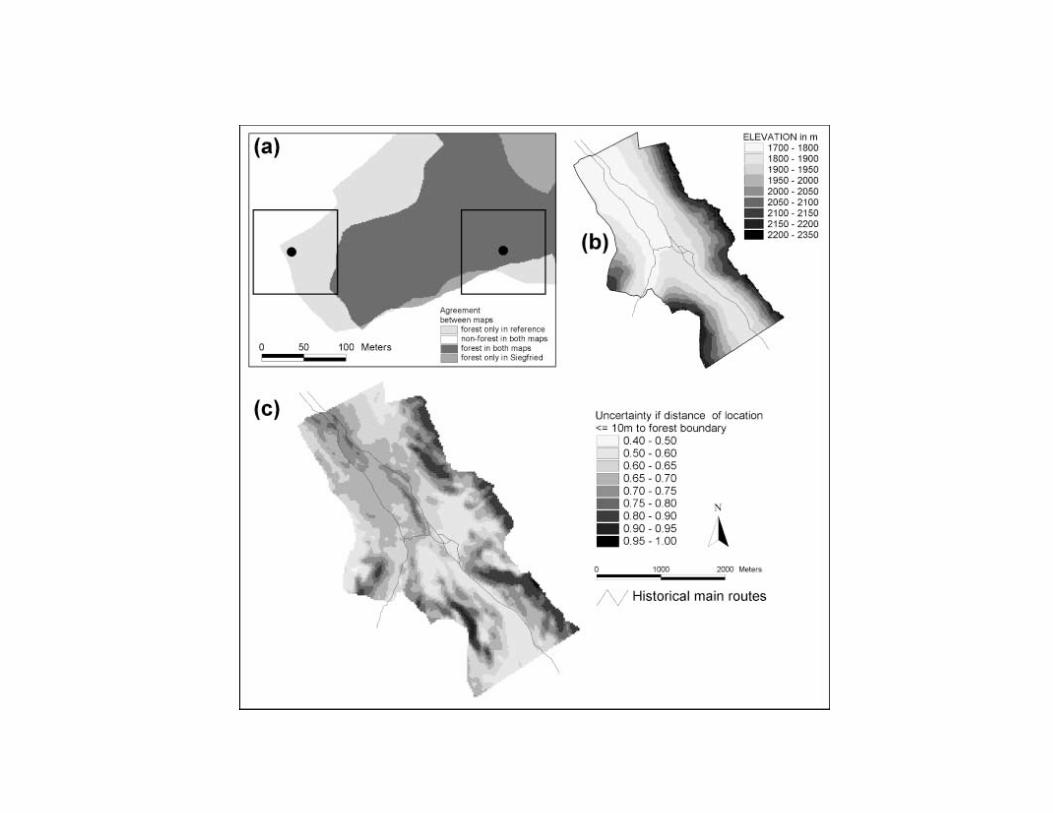
Trying to explain uncertainty
and how it is caused• What are influences to think of
• Survey, access, exploraqtion
of the region
• Mountainous area, elevation,
steepness
Siegfried Few
References

Modeling based on local
summary statistics
Explanation of local uncertainty based on independent
"explanatory" variables
vardep. = ƒ(varindep.)
Slope DEM
derivatives
Distance
measures
Local
uncertainty
or
mapping
quality
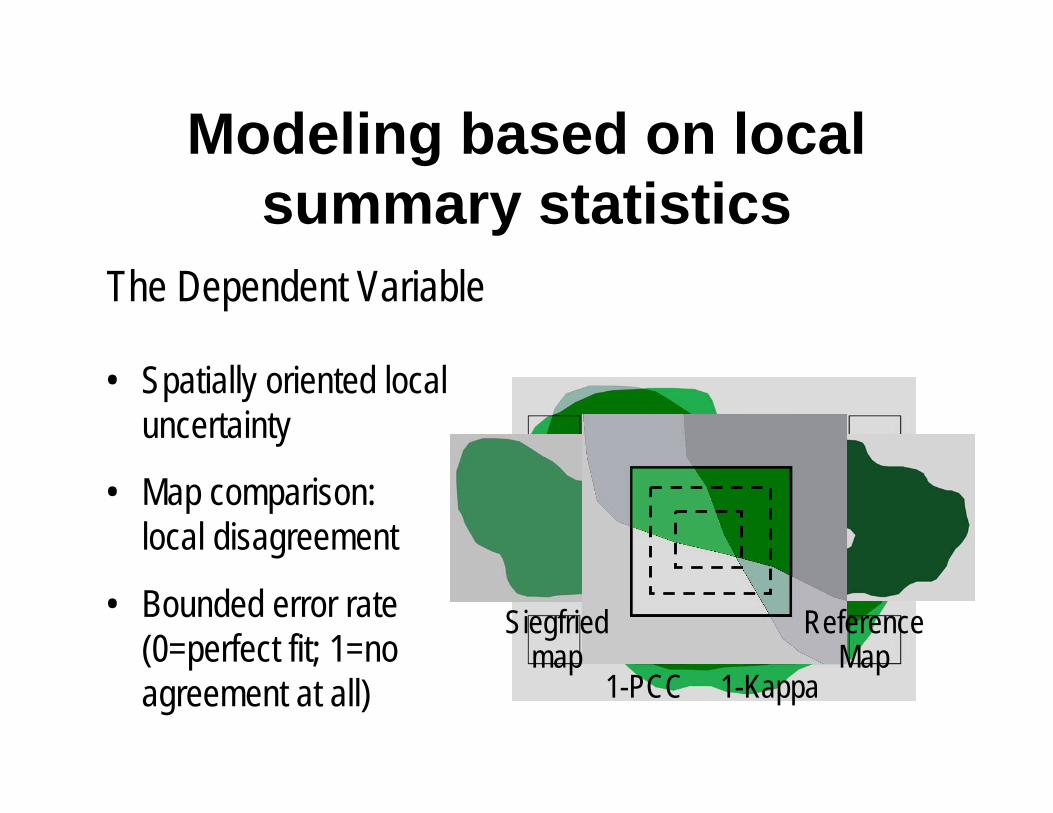
Modeling based on local
summary statistics
1-PCC 1-Kappa
• Spatially oriented local
uncertainty
• Map comparison:
local disagreement
• Bounded error rate
(0=perfect fit; 1=no
agreement at all)
The Dependent Variable
ReferenceMap
Siegfriedmap

Local uncertainty and the
Statistical Model
• Generalized Linear Models (GLM)
• Response [0,1]: uncertainty
• Link(Response) = LinearPredictorscomb
log( / (1 - )) = + XT
• Crosswise calibration and testing

Mapping local uncertainty
or quality
0 1…
Degree of local certainty (Kappa)

Summary• The assessment of uncertainty of our source data is
one of the basic requirements we should be aware of
• You have seen different error models such as CSE,Perkal or epsilon bands and their application forpositional error assessment for points, lines andpolygones
• We talked about the confusion matrix whichrepresents the most prominent assessment approachfor categorial/ nominal data in a classificationprocess
• You have seen some examples how to use and howto overcome limitations of the summary statisticsderived
References• Burrough, P.A. and McDonnell, R.A. (1998):Principles of Geographical Information
Systems. Second Edition. Oxford University Press.
• Jones, C.B. (1997): Geographical Information Systems and Computer Cartography.Longman.
• Longley et al. 2001. Geographic Information Systems and Science. Wiley.
• Fisher P 1999 Models of uncertainty in spatial data. In Longley P, Goodchild M F,Maguire D J, and Rhind D W (eds) Geographical Information Systems: Principles,Techniques, Management and Applications (Volume 1). New York, John Wiley andSons: 191–205
• Fisher P 2003 Data quality and uncertainty: Ships passing in the night! In Shi W,Goodchild M F, and Fisher P (eds) Proceedings of the Second InternationalSymposium on Spatial Data Quality. Hong Kong, Hong Kong Polytechnic University:17–22
• Guptill S C and C Morrison J L (eds) 1995 Elements of Spatial Data Quality. Oxford,Pergamon
• … if you like endless reference lists: Leyk et al., 2005 in TGIS