gis operations and spatial analysis turns raw data into useful information by adding greater...
TRANSCRIPT

GIS Operations and Spatial Analysis
• Turns raw data into useful information• by adding greater informative content and value
• Reveals patterns, trends, and anomalies that might otherwise be missed
• Provides a check on human intuition• by helping in situations where the eye might
deceive
• Thousands of techniques exist…
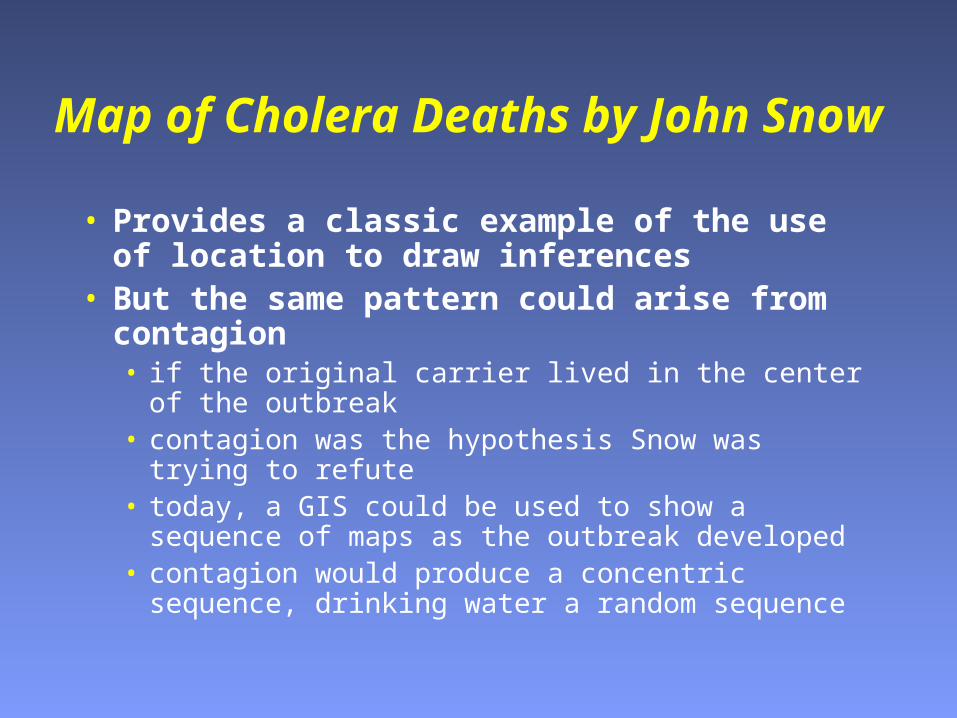
Map of Cholera Deaths by John Snow
• Provides a classic example of the use of location to draw inferences
• But the same pattern could arise from contagion• if the original carrier lived in the center of the outbreak• contagion was the hypothesis Snow was trying to
refute• today, a GIS could be used to show a sequence of
maps as the outbreak developed• contagion would produce a concentric sequence,
drinking water a random sequence


Map AlgebraMap Algebra
• C. Dana Tomlin (1983…)• implemented in many grid analysis
packages, including ArcGrid, Idrisi, MapII, ArcView Spatial Analyst
• Four classes of operations:• local• focal• zonal• incremental
DEMO

Local FunctionsLocal Functions
• work on single cells, one after another, value assigned to a cell depends on this cell only
• examples:• arithmetic operations with a constant, or with another
grid:
• also logical operations, comparisons (min, max, majority, minority, variety, etc.)
2 0 12 4 03 1
* 3 = 6 0 36 12 09 3
2 0 12 4 03 1
1 5 34 4 32 5 6
2 0 38 16 06 6
* =

Polygon Overlay, Discrete Object Case
In this example, two polygons are intersected to form 9 new polygons. One is formed from both input polygons; four are
formed by Polygon A and not Polygon B; and four are formed by Polygon B
and not Polygon A.
A B

Spurious or Sliver Polygons
• In any two such layers there will almost certainly be boundaries that are common to both layers• e.g. following rivers
• The two versions of such boundaries will not be coincident
• As a result large numbers of small sliver polygons will be created• these must somehow be removed• this is normally done using a user-defined tolerance

Focal FunctionsFocal Functions
• assign data value to a cell based on its neighborhood (variously defined)
• uses:• smoothing - moving averaging• edge detection• assessing variety, etc.
• examples: • focal sum - adds up values in cell neighborhood, and
assigns this value to the focal cell• focal mean - averages values in neighborhood,and assigns
the result to the focal cell• also: logical functions, other mathematical

Shapes of Neighborhoods Shapes of Neighborhoods
41
43 6
1
43 6
41
43 65 2
3 441
43 65 2
3 4

Kinds of NeighborhoodsKinds of Neighborhoods
• Neighborhood: a set of locations each of which bears a specified distance and/or directional relationship to a particular location called the neighborhood focus (D. Tomlin)• distance and directional neighbors• immediate and extended neighbors• metric and topological neighbors• neighbors of points, lines, areas...

Neighborhood OperationsNeighborhood Operations
41
43 6 X
some function
Functions:Total: X = 18 Variety: X = 4Average: X = 4 Median: X = 4Minimum: X = 1 Deviation: X = 0Maximum: X = 6 Std. dev.: X = 2Minority: X = 1 (or 3, or 6) Proportion: X = 40Majority: X = 4 . . .

Neighborhood StatisticsNeighborhood Statistics
• In Spatial Analyst you can specify:• shape of neighborhood: | Circle | Rectangle |
Doughnut | Wedge• size of neighborhood: radius (circle), inner and
outer radius (doughnut), radius, start and end angles (wedge), width and height (rectangle)
• operation: | Minimum | Maximum | | Mean | Median | Sum | Range | Standard Dev. | Majority | Minority | Variety |

Buffer: a Typical NeighborhoodBuffer: a Typical Neighborhood
• Buffers and offsets• Buffers in vector form
• either a chain of “sausages”• or a Voronoi network
• Buffers in raster form• a two-step operation: (1) create a map of
distances from the object; (2) reclassify it into a binary map

Buffering
Point
Polyline
Polygon

Applications of BuffersApplications of Buffers
• Exclusionary screening / ranking - in site selection studies
• Environmental regulations
Main question: how wide??
-depends on a variety of political / social / economic / cultural circumstances, often difficult to formalize... differs by states and counties

Zonal FunctionsZonal Functions
• assign values to all cells in a zone, based on values from another map
zonal grid + values grid => output grid
2 0 02 4 03 4
1 2 34 5 67 8 9
4 6 64 9 67 9
max
again, many types of functions are available

Global (incremental) FunctionsGlobal (incremental) Functions
• cell value for each cell depends on processing the entire grid
• examples:• computing distance from one cell (or group of cells) to all
other cells• distance can be weighted by some impedance factor => cost-
distance surfaces
• uses:• diffusion modeling• shortest path modeling, distance-based site selection • visibility analysis• connectivity and fragmentation in habitat analysis, etc.

Rules of Map CombinationRules of Map Combination
• Dominance• selects one value from those available,
other values ignored; an external rule is used for selection
• Contributory• values from each map contribute to the
result, typically combined with some arithmetic operation, ignoring interdependence of factors (each value contributes without regard to others)
• Interaction• interaction between factors is accounted
for, more flexible design
+

Dominance Rules: Excl. ScreeningDominance Rules: Excl. Screening
• Exclusionary screening• selects one value from the available set, ignoring
others, usually by an externally specified rule• exclusionary screening (“one strike and you’re out”)
• binary (yes/no)• typically an iterative process (two risks: either too much
area left, or too much excluded)
1 1 0 00 0 1 00 1 1 11 1 1 0
and
0 1 0 00 1 0 10 1 0 10 0 1 0
0 1 0 00 0 0 00 1 0 10 0 1 0
==>
in map calculator, with 0/1 themes, can simply multiply them
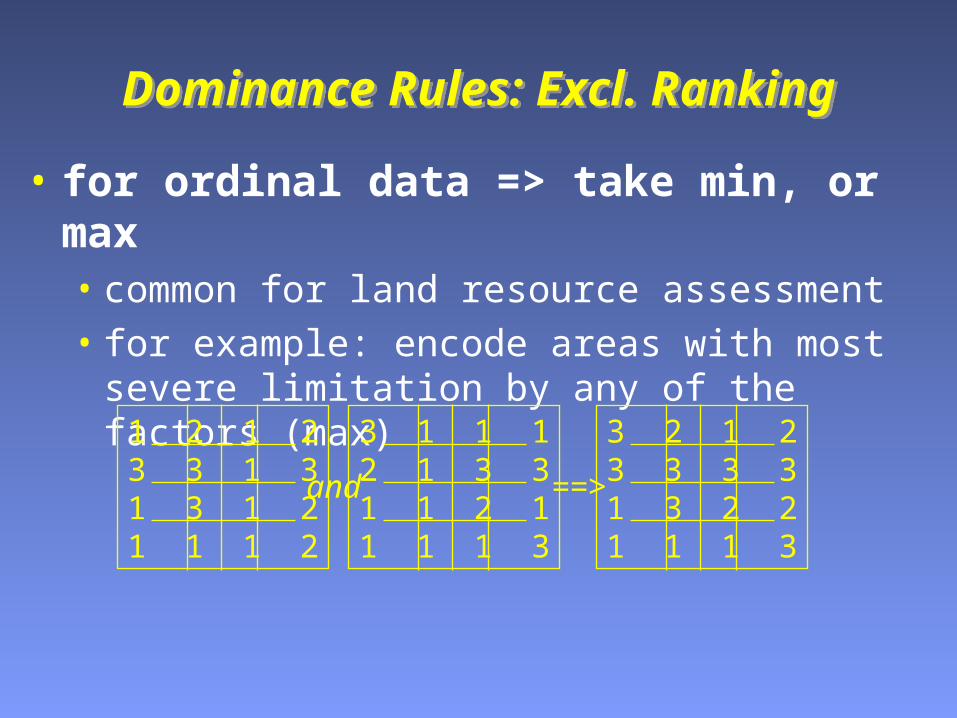
Dominance Rules: Excl. RankingDominance Rules: Excl. Ranking
• for ordinal data => take min, or max• common for land resource assessment• for example: encode areas with most severe
limitation by any of the factors (max)
1 2 1 23 3 1 31 3 1 21 1 1 2
and
3 1 1 12 1 3 31 1 2 11 1 1 3
3 2 1 23 3 3 31 3 2 21 1 1 3
==>
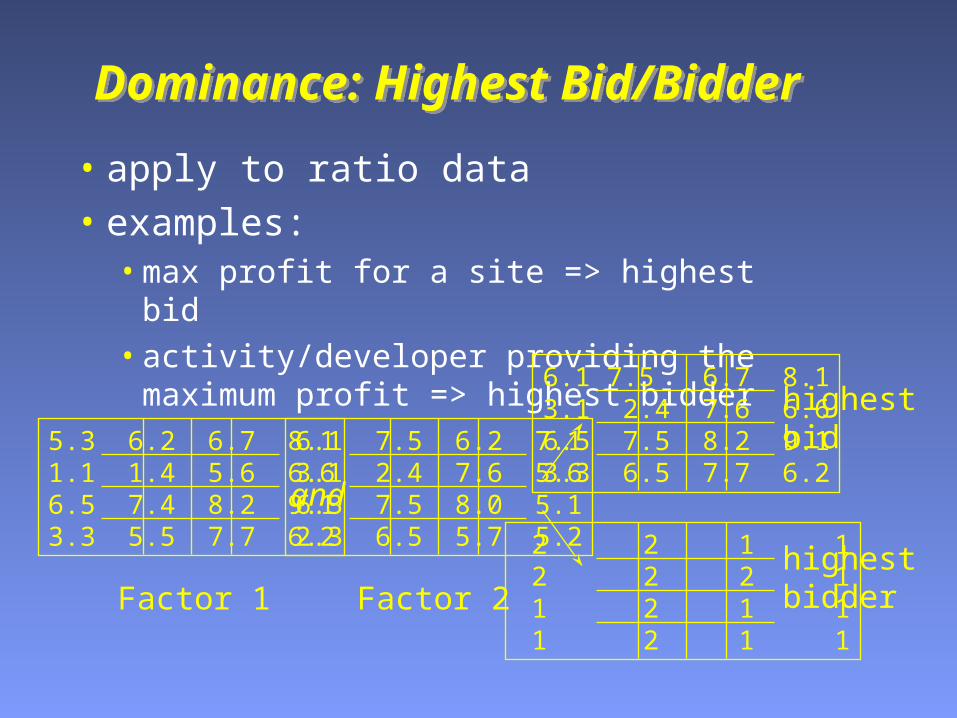
Dominance: Highest Bid/BidderDominance: Highest Bid/Bidder
• apply to ratio data • examples:
• max profit for a site => highest bid• activity/developer providing the maximum profit
=> highest bidder
5.3 6.2 6.7 8.11.1 1.4 5.6 6.66.5 7.4 8.2 9.13.3 5.5 7.7 6.2
6.1 7.5 6.2 7.13.1 2.4 7.6 5.66.3 7.5 8.0 5.12.3 6.5 5.7 5.2
Factor 1 Factor 2
6.1 7.5 6.7 8.13.1 2.4 7.6 6.66.5 7.5 8.2 9.13.3 6.5 7.7 6.2
2 2 1 1 2 2 2 1 1 2 1 1 1 2 1 1
and
highestbid
highestbidder

Contributory: Voting TabulationContributory: Voting Tabulation
• how many positive (or negative) factors occur at a location (number of votes cast)
• applies to nominal categories
1 1 0 00 0 1 00 1 1 11 1 1 0
+
0 1 0 00 1 0 10 1 0 10 0 1 0
1 2 0 00 1 1 10 2 1 21 1 2 0
==>
also, can produce the most frequent/least frequent value, etc.
… is an area excluded on two criteria twice as excluded as area excluded on one factor?...

Contributory: Weighted VotingContributory: Weighted Voting
• weights express relative importance of each factor, factors are still 0 and 1
1 1 0 00 0 1 00 1 1 11 1 1 0
+
0 1 0 00 1 0 10 1 0 10 0 1 0
3 8 0 00 5 3 50 8 3 83 3 8 0
==>3 x 5 x
weights of factors

Contributory: Linear CombinationContributory: Linear Combination
• each factor map is expressed as a set of site rankings
• these rankings are added up for each cell
1 2 1 23 3 1 31 3 1 21 1 1 2
+
3 1 1 12 1 3 31 1 2 11 1 1 3
4 3 2 35 4 4 62 4 3 32 2 2 5
==>
consider this:2 = 1 + 13 = 1 + 2 = 2 + 14 = 1 + 3 = 2 + 2 = 3 + 15 = 2 + 3 = 3 + 26 = 3 + 3
this is what happens when you add up ordinal data. Perhaps, convert them to ratio (dollars)?

Contributory: Weighting and RatingContributory: Weighting and Rating
• factor maps composed of rankings, weights externally assigned
• a rather problematic, though very popular method
Also, there is Non-linear combination (like USLE) -particularly sensitive to errors, zero values...
1 2 1 23 3 1 31 3 1 21 1 1 2
+
3 1 1 12 1 3 31 1 2 11 1 1 3
18 11 8 1119 14 18 24 8 14 13 11 8 8 8 21
==>3 x 5 x
weights of factors

How to Assign WeightsHow to Assign Weights
• Delphi techniques• to aid decision-makers in making value judgments;
elicit and refine group judgments where exact knowledge is unavailable
• rounds of “blind’ individual ratings by professionals• rounds of open discussion of differences• re-evaluations• often: categories and their sets are redefined• task: to obtain a reliable consensus
• Binary comparisons

Interaction Rules 1Interaction Rules 1
• “Gestalt”, or Integrated Survey• a field team is sent out to produce an integral map...
• Factor combination• all possible combinations are considered and rated
1 2 1 23 3 1 31 3 1 21 1 1 2
and
3 1 1 12 1 3 31 1 2 11 1 1 3
3 4 1 48 7 3 91 7 2 41 1 1 6
==>
1 : 1 & 12 : 1 & 23 : 1 & 34 : 2 & 15 : 2 & 26 : 2 & 37 : 3 & 18 : 3 & 29 : 3 & 3
legend
number of potential categories rises quickly,but fortunately just a small fraction survive

Interaction Rules 2Interaction Rules 2
• Interaction tables• values of one factor determine weights of
other factors, then weighting/rating scheme is applied
• Hierarchical rules of combination
• Binary comparisons
NOTE THAT ALL THESE METHODS -Dominance, Contributory, Interaction - APPLY TO OVERLAY, NEIGHBORHOODOPERAITONS, ZONAL OPERATIONS, etc. - everywhere where you need to combine values
