gis & spatial modeling - university of colorado boulder · gis & spatial modeling ... cell...
TRANSCRIPT
GIS & Spatial Modeling
Class 3: Raster Data and Tesselations
Geography 4203 / 5203

Some Updates
• Readings discussions
• Labs next week:
Monday group joins the Wednesday
group or comes on Friday 2-4pm
Readings Discussions -
How to…• Prepare a presentation (25min max) and go on with
a discussion
• Contents of your presentations:
Who is/are the authors
What is the central topic / field and the character ofthe paper (method./concept.)?
What is the methodological key part / theoreticalcontribution?
What is your opinion about the reading?
Open or unsolved questions and critiques?

Readings Discussions -
How to…• Materials and media:
Feel free! Whatever is useful in your eyes and makes thepresentation exciting.
• Discussion (approx. 20 min):
Prepare 4-5 interesting, challenging questions for the class
When getting answers insist until you think your questionshave really been thoroughly answered!
If no one raises his/her hand – just pick someone out! Youare the discussion leader.
• You can send me the material or come to me the daybefore to show and discuss the material (write me an email)

• We talked about key terms in GIScience suchas spatial analysis and spatial modeling
• I tried to give you an idea how to understandwhat people mean and which definitions andtaxonomies exist
• We have seen some examples which(hopefully) helped to approach the problem
• So can you say what a spatial modeler doesad why this can be different from what anspatial analyst does?
Last Lecture

Today‘s Outline
• Tesselations and spatial information
representation
• Review and deepening knowledge of
raster datasets , properties, structures
• Conceptual models for geographic
space
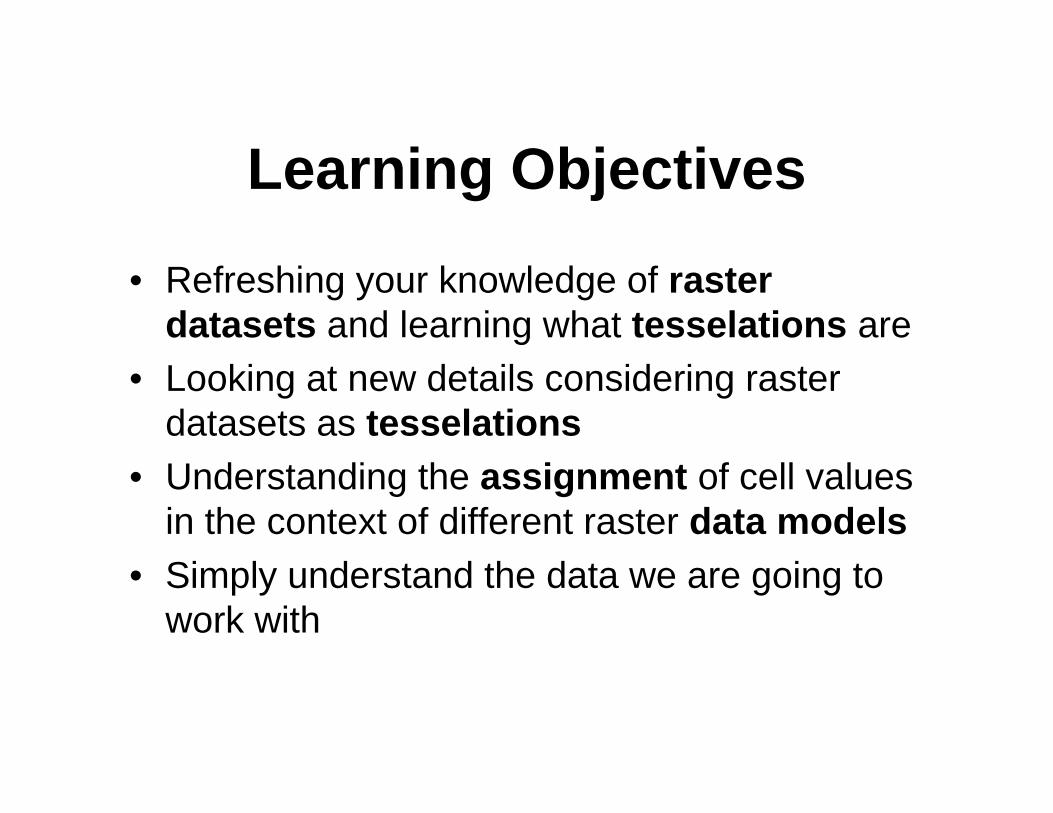
Learning Objectives
• Refreshing your knowledge of raster
datasets and learning what tesselations are
• Looking at new details considering raster
datasets as tesselations
• Understanding the assignment of cell values
in the context of different raster data models
• Simply understand the data we are going to
work with

Space and Tessellation
• “tessella” (Latin) - small cubical piece of clay, stone orglass used to make mosaics (Webster); "small square"(“tessera” - Greek for “four”)
• Ways of dividing our geographic space…
• … to represent space computationally
• Boots 2005 (Perspective on boundaries vs. on interiorof a region):

Representing Space
Computationally
• The process:
=> Conceptualizing the real world
=> Cartographic abstraction of thereality
=> Conversion to digital equivalent(e.g., tessellation)
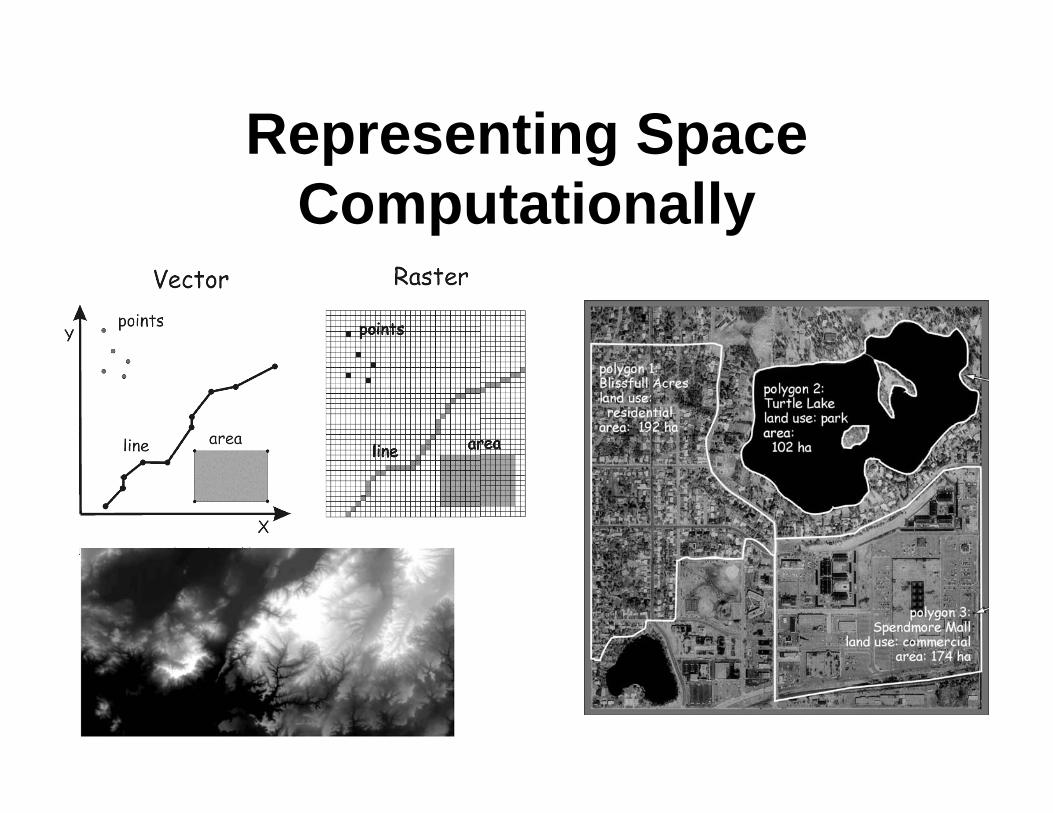
Representing Space
Computationally
Tessellations of Geographic
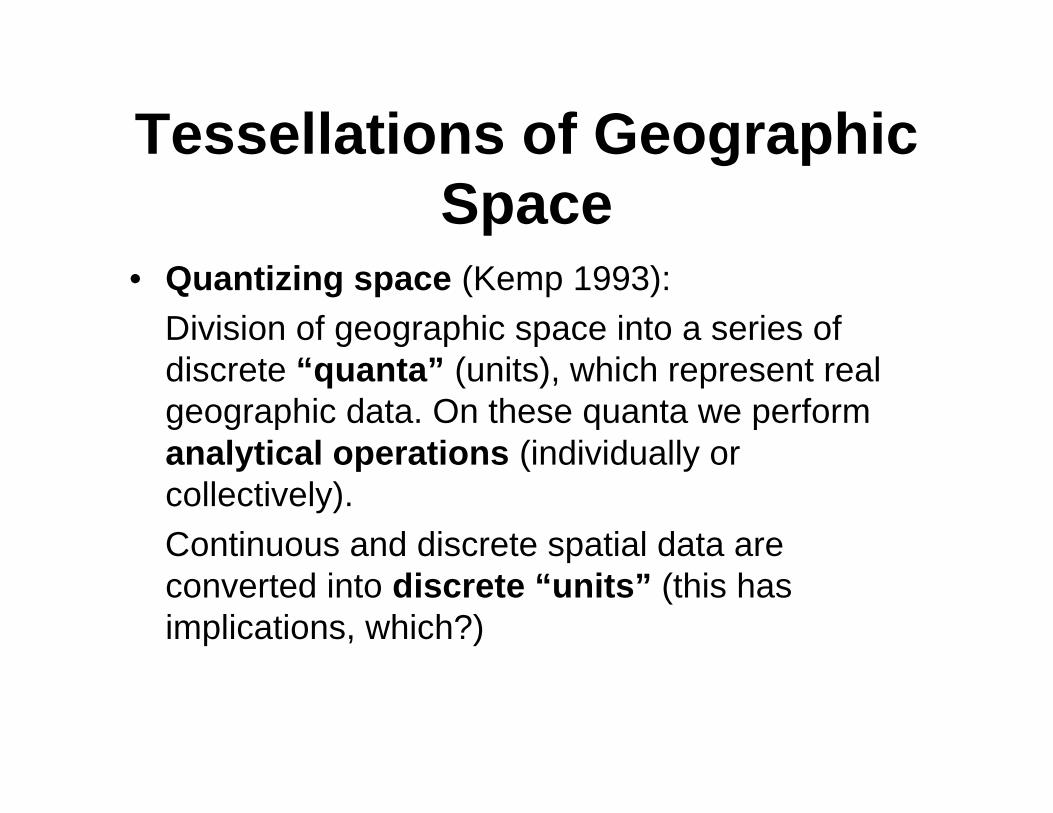
Space• Quantizing space (Kemp 1993):
Division of geographic space into a series of
discrete “quanta” (units), which represent real
geographic data. On these quanta we perform
analytical operations (individually or
collectively).
Continuous and discrete spatial data are
converted into discrete “units” (this has
implications, which?)
Tessellations and the
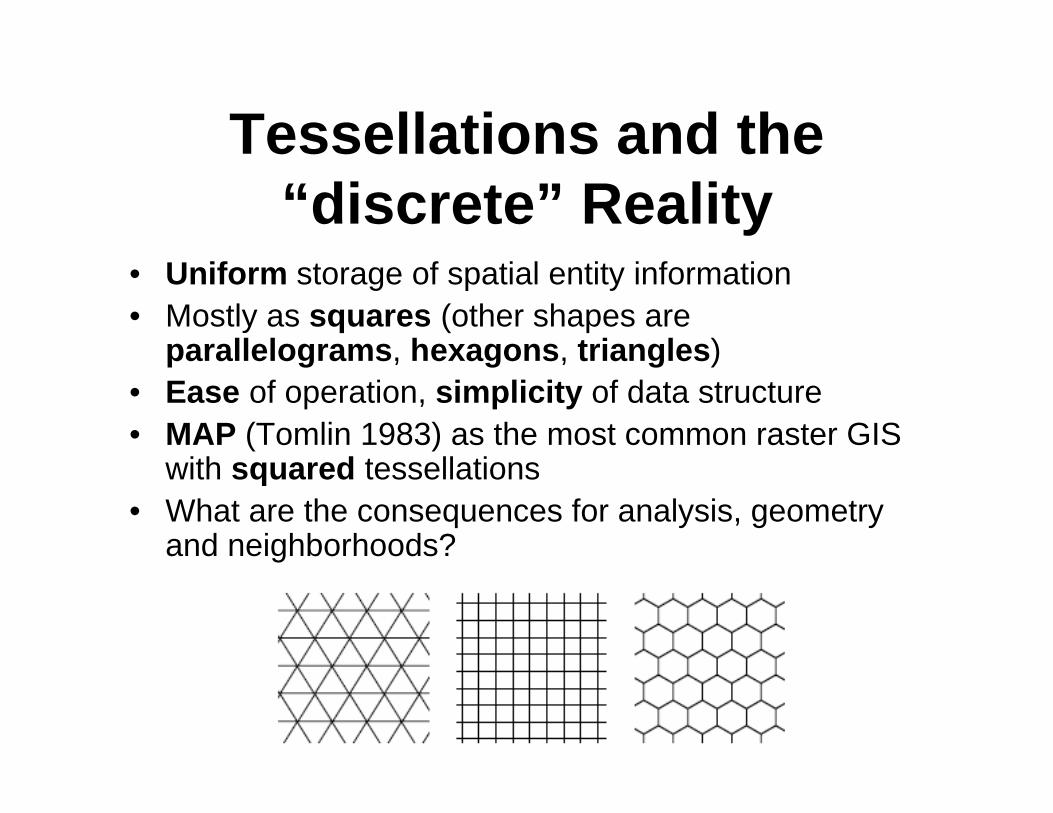
“discrete” Reality• Uniform storage of spatial entity information
• Mostly as squares (other shapes areparallelograms, hexagons, triangles)
• Ease of operation, simplicity of data structure
• MAP (Tomlin 1983) as the most common raster GISwith squared tessellations
• What are the consequences for analysis, geometryand neighborhoods?
Object Representation in
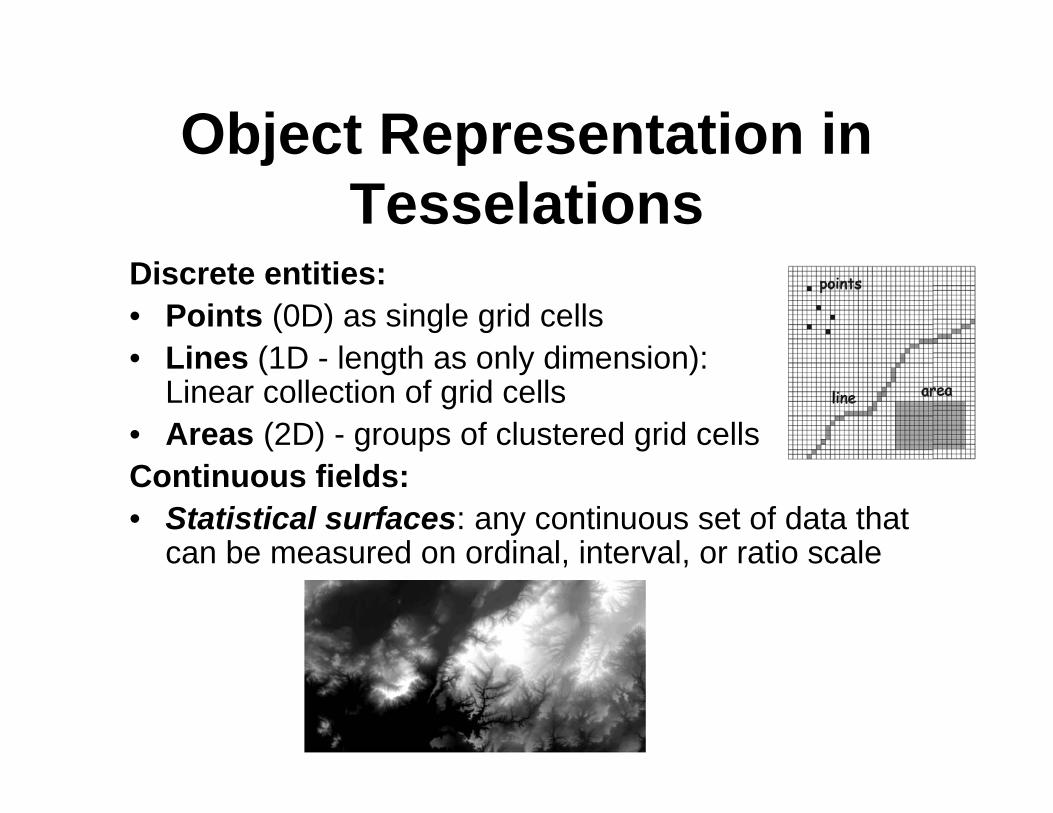
TesselationsDiscrete entities:
• Points (0D) as single grid cells
• Lines (1D - length as only dimension): Linear collection of grid cells
• Areas (2D) - groups of clustered grid cells
Continuous fields:
• Statistical surfaces: any continuous set of data thatcan be measured on ordinal, interval, or ratio scale
Back to Implications by
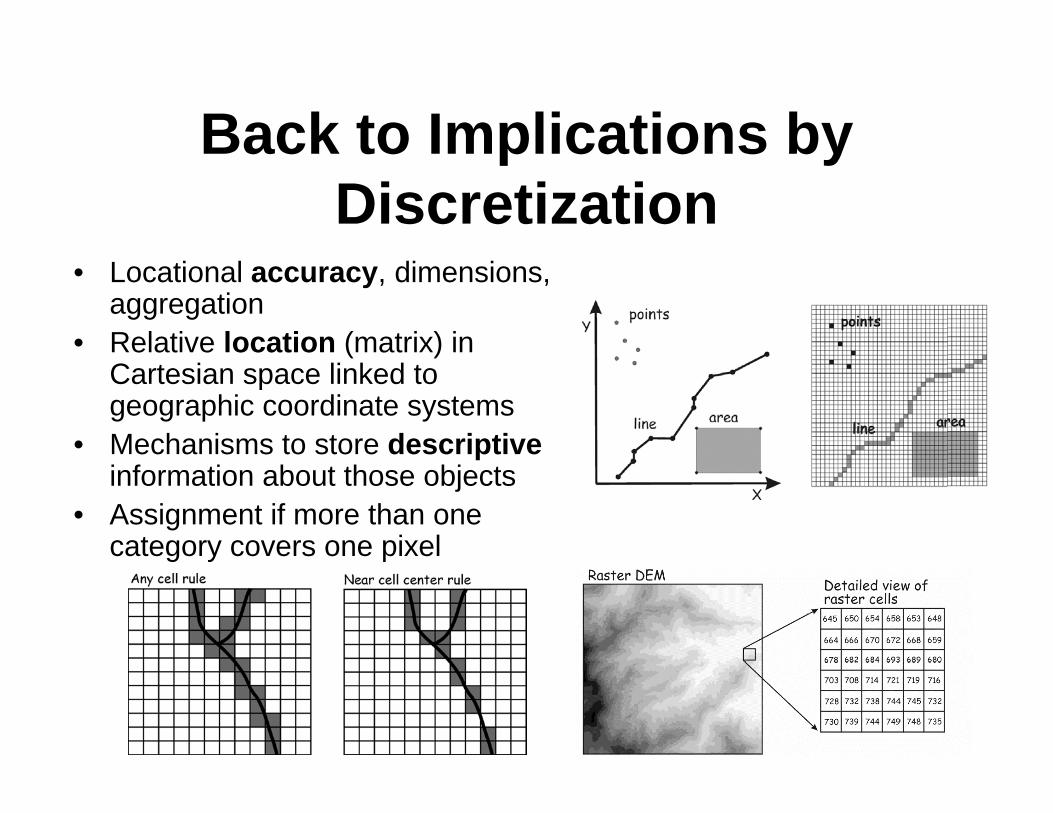
Discretization• Locational accuracy, dimensions,
aggregation
• Relative location (matrix) inCartesian space linked togeographic coordinate systems
• Mechanisms to store descriptiveinformation about those objects
• Assignment if more than onecategory covers one pixel
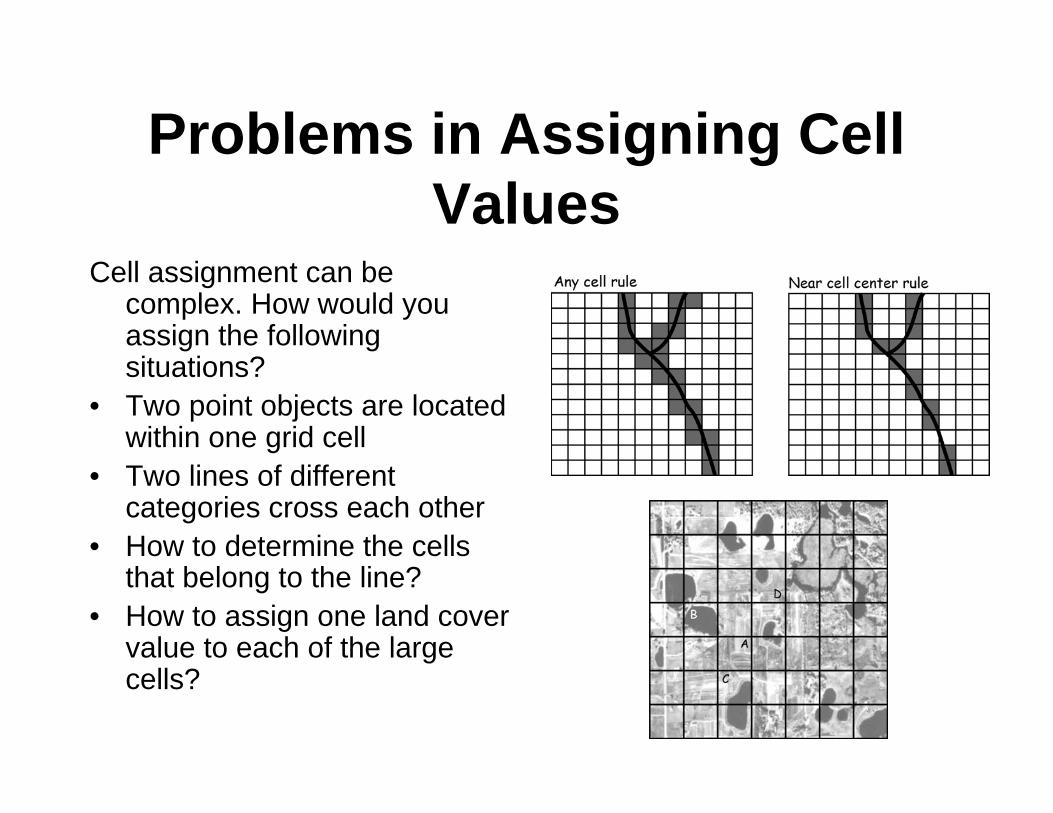
Problems in Assigning Cell
ValuesCell assignment can be
complex. How would youassign the followingsituations?
• Two point objects are locatedwithin one grid cell
• Two lines of differentcategories cross each other
• How to determine the cellsthat belong to the line?
• How to assign one land covervalue to each of the largecells?
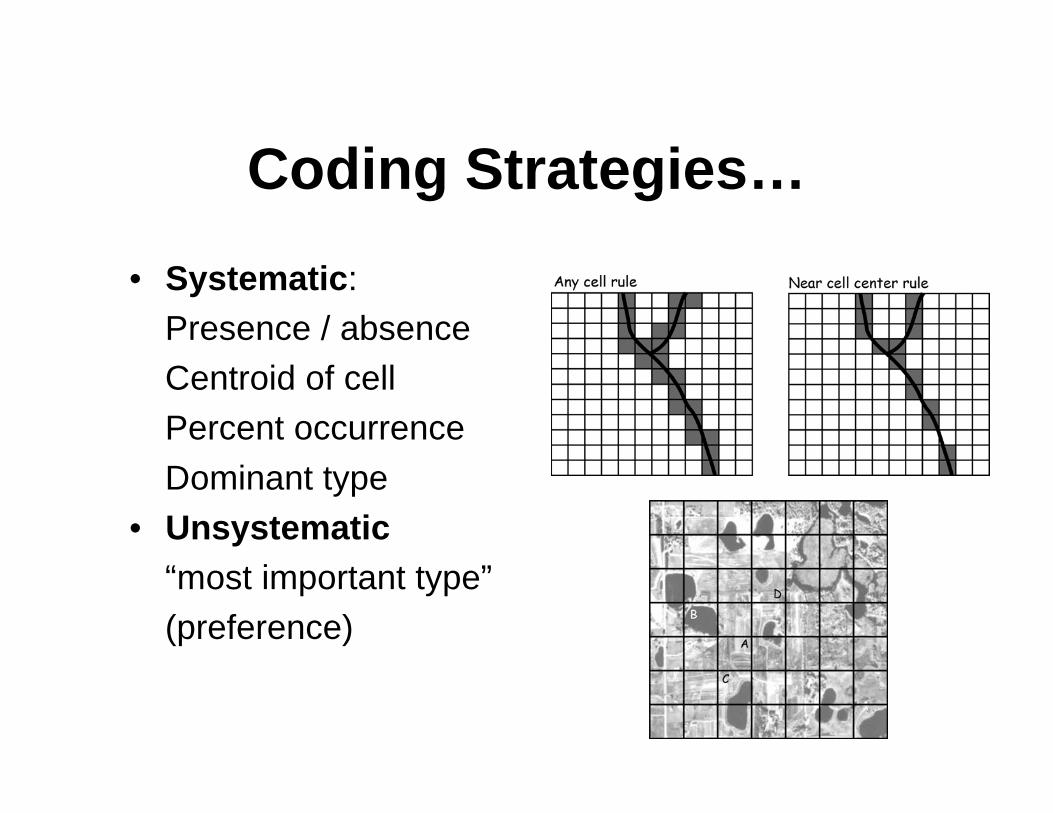
Coding Strategies…
• Systematic:
Presence / absence
Centroid of cell
Percent occurrence
Dominant type
• Unsystematic
“most important type”
(preference)

… and Raster Data Models
• Such cases can cause data explosions insimple raster models (MAGI, IMGRID,MAP) since all categories must be encodedfor each cell…
• Extended Raster:
Allows multiple descriptors for each grid cellin the attribute table (one-to-one, many-to-one, indexing)
Problem: We loose part of the simplestructure and create complex files
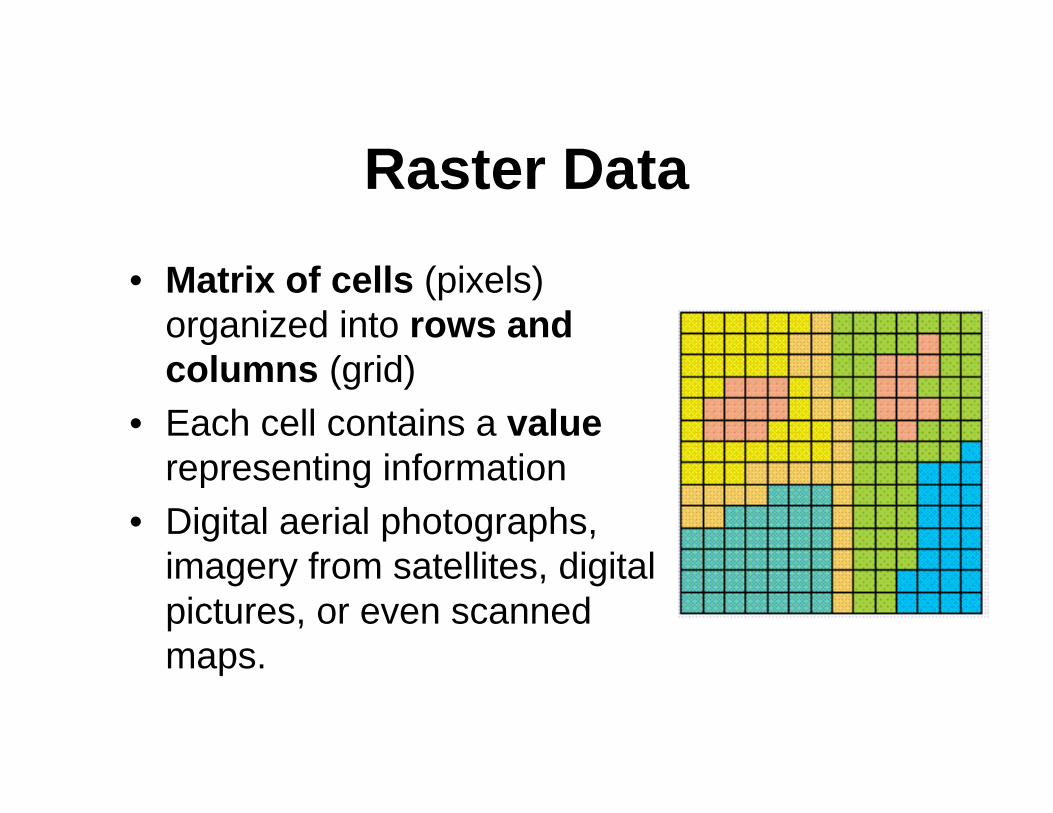
Raster Data
• Matrix of cells (pixels)
organized into rows and
columns (grid)
• Each cell contains a value
representing information
• Digital aerial photographs,
imagery from satellites, digital
pictures, or even scanned
maps.
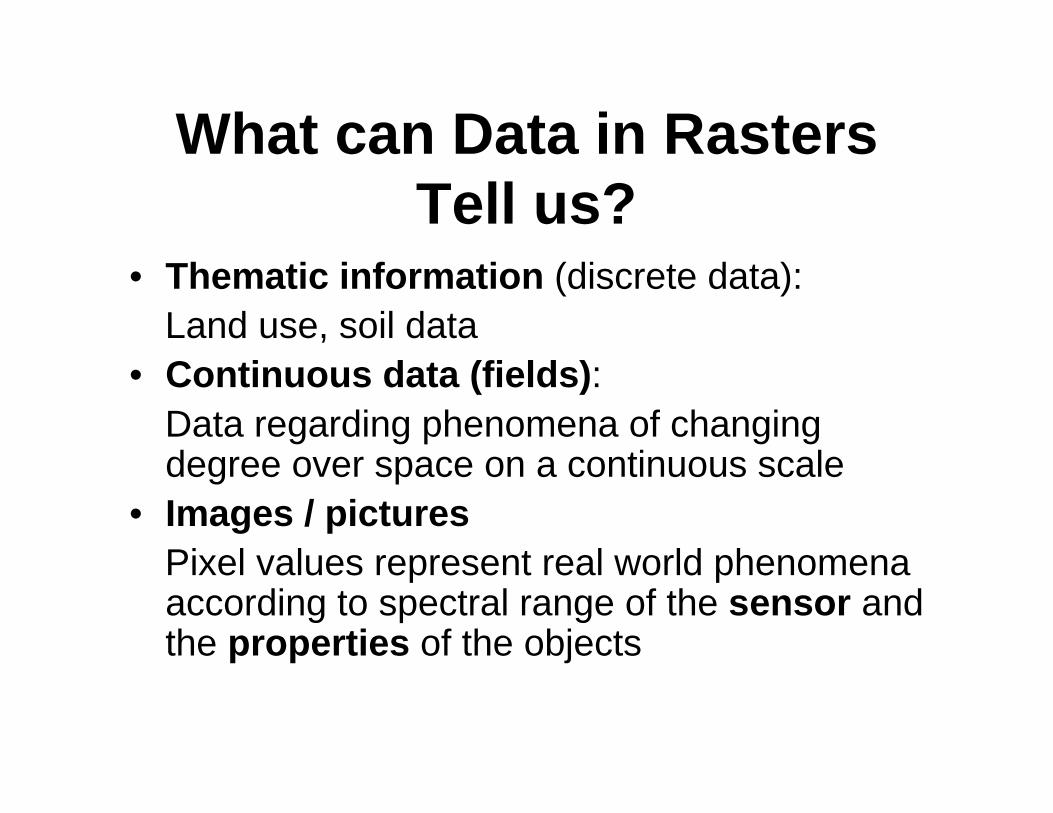
What can Data in Rasters
Tell us?• Thematic information (discrete data):
Land use, soil data
• Continuous data (fields):
Data regarding phenomena of changingdegree over space on a continuous scale
• Images / pictures
Pixel values represent real world phenomenaaccording to spectral range of the sensor andthe properties of the objects
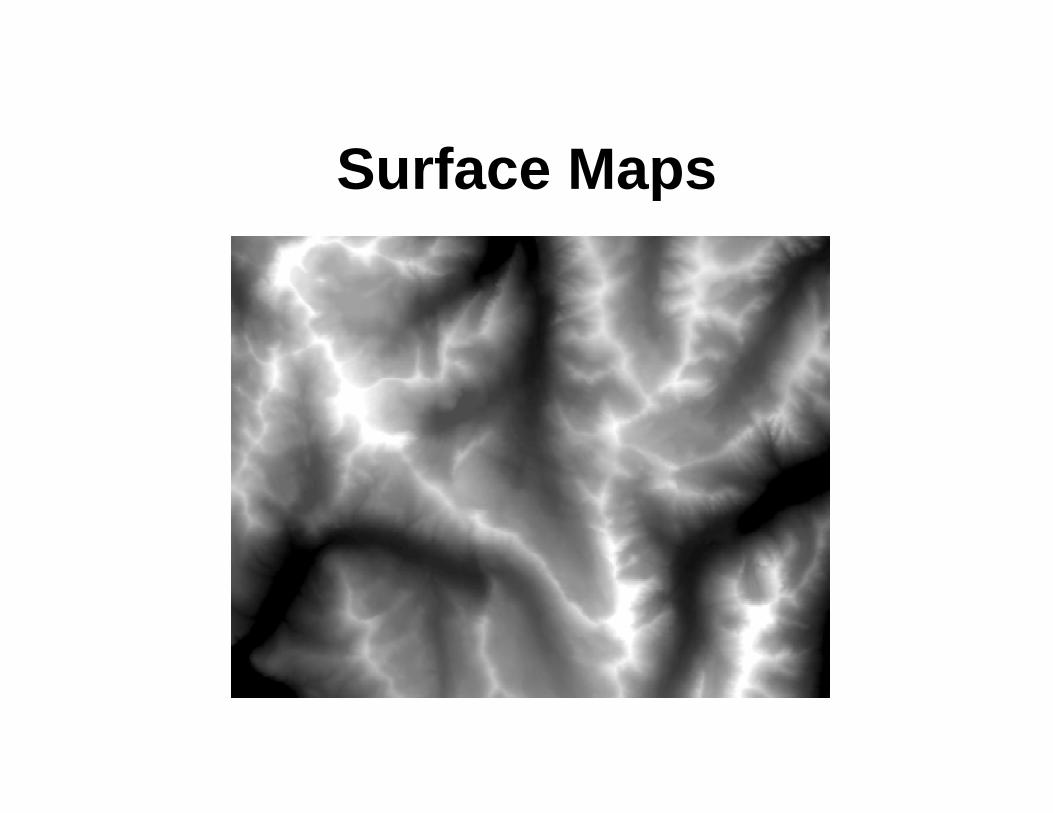
Surface Maps
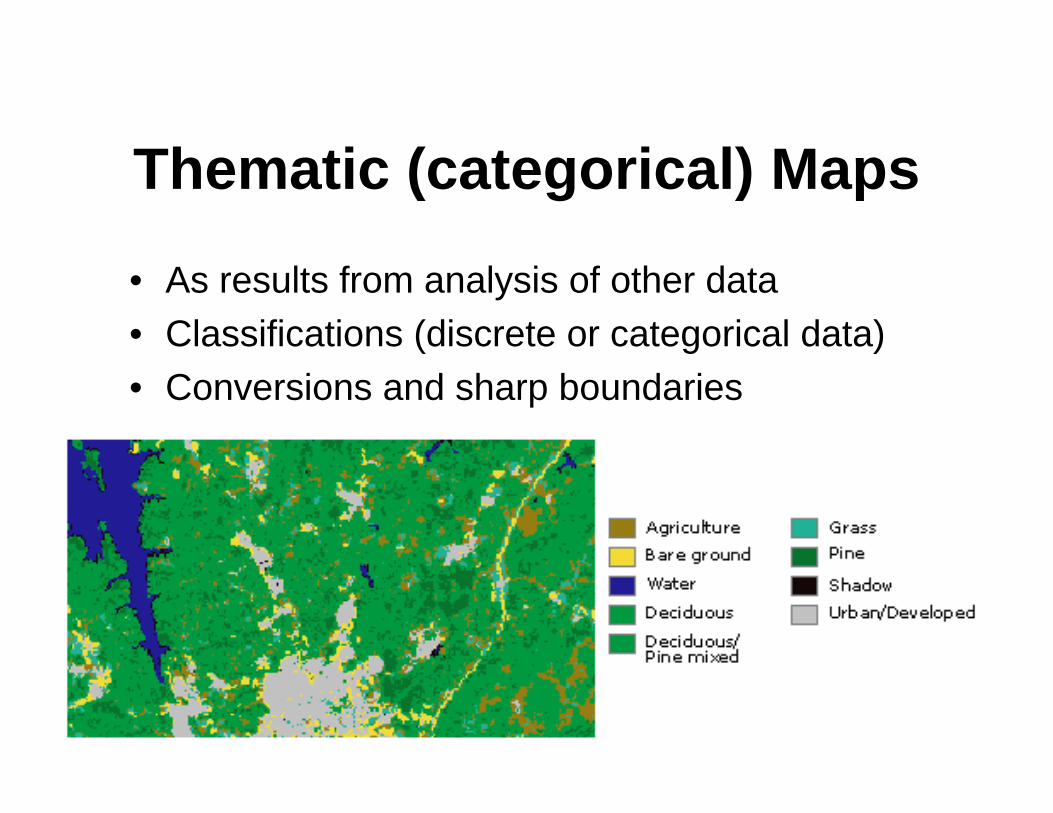
Thematic (categorical) Maps
• As results from analysis of other data
• Classifications (discrete or categorical data)
• Conversions and sharp boundaries
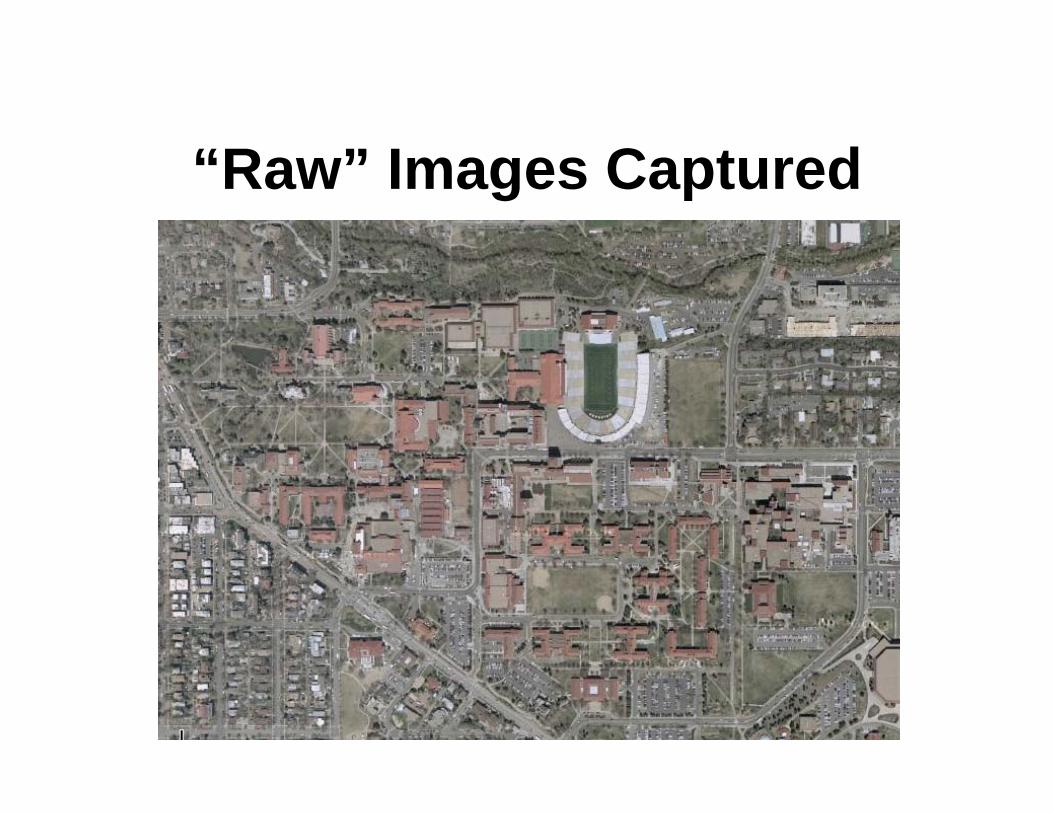
“Raw” Images Captured
Remind Some
Characteristics• Simple data structure that can represent discrete
entities (“approximations”), and continuousvalues
• Categories (land use), magnitudes (rainfall), heightor just spectral values
• Values as negative/positive, Boolean, Integer,floating point
• Easy linking between different overlaying datasets
• NoData - absence of data
• Limitations in accuracy due to cell sizes
• Size of datasets/accuracy <> resolution/cell size
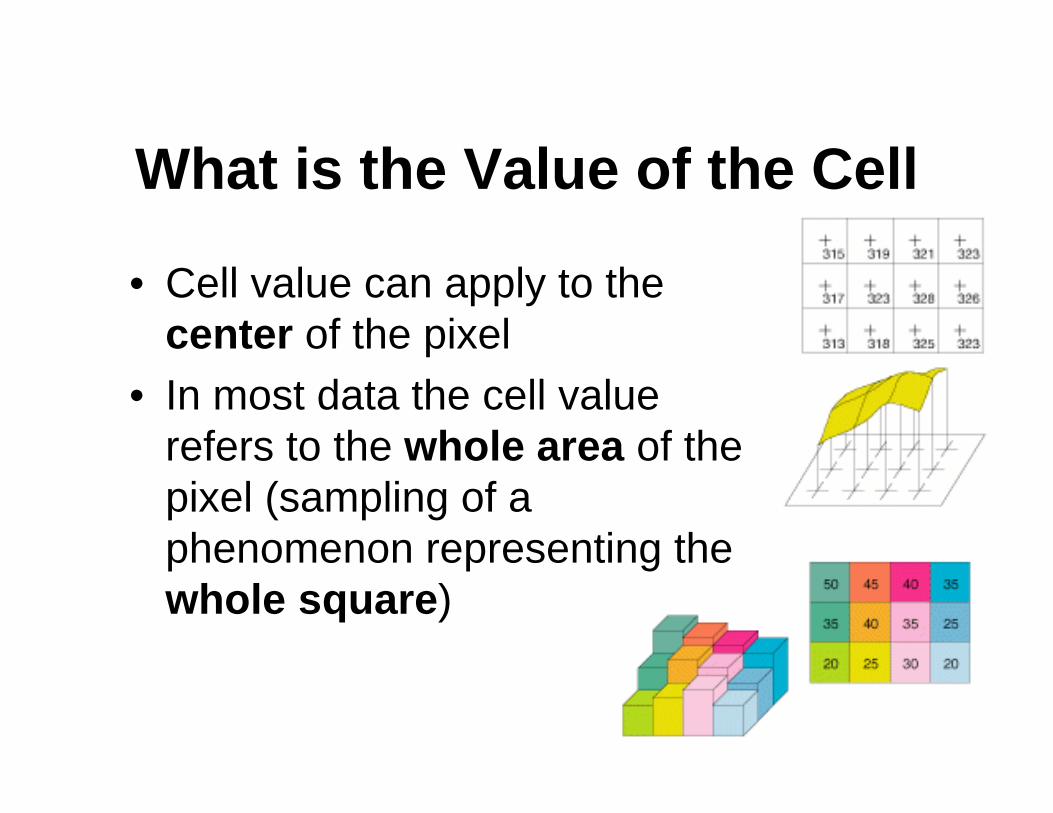
What is the Value of the Cell
• Cell value can apply to the
center of the pixel
• In most data the cell value
refers to the whole area of the
pixel (sampling of a
phenomenon representing the
whole square)
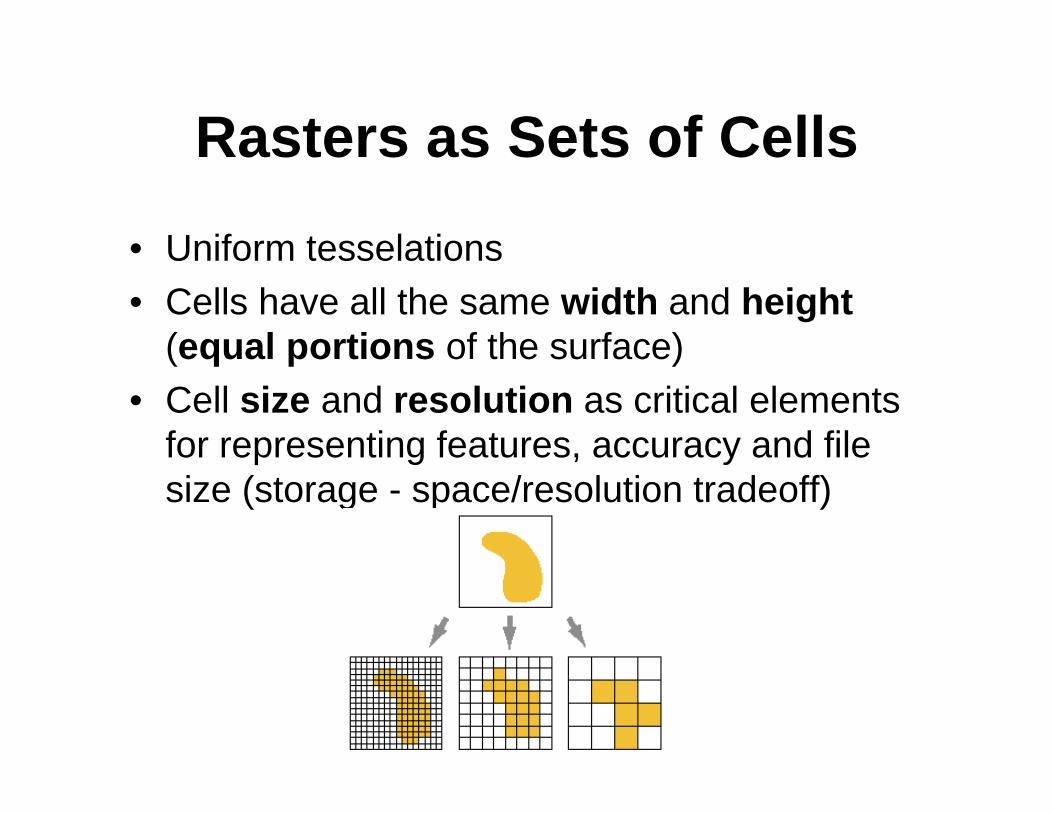
Rasters as Sets of Cells
• Uniform tesselations
• Cells have all the same width and height
(equal portions of the surface)
• Cell size and resolution as critical elements
for representing features, accuracy and file
size (storage - space/resolution tradeoff)

Rasters as Spatial
Representations• Locations of cells are defined by the number of
rows and columns in the matrix
• Cartesian coordinate system representation (row
|| to x, col || to y)
• Values of geographic coordinate systems,
accordingly
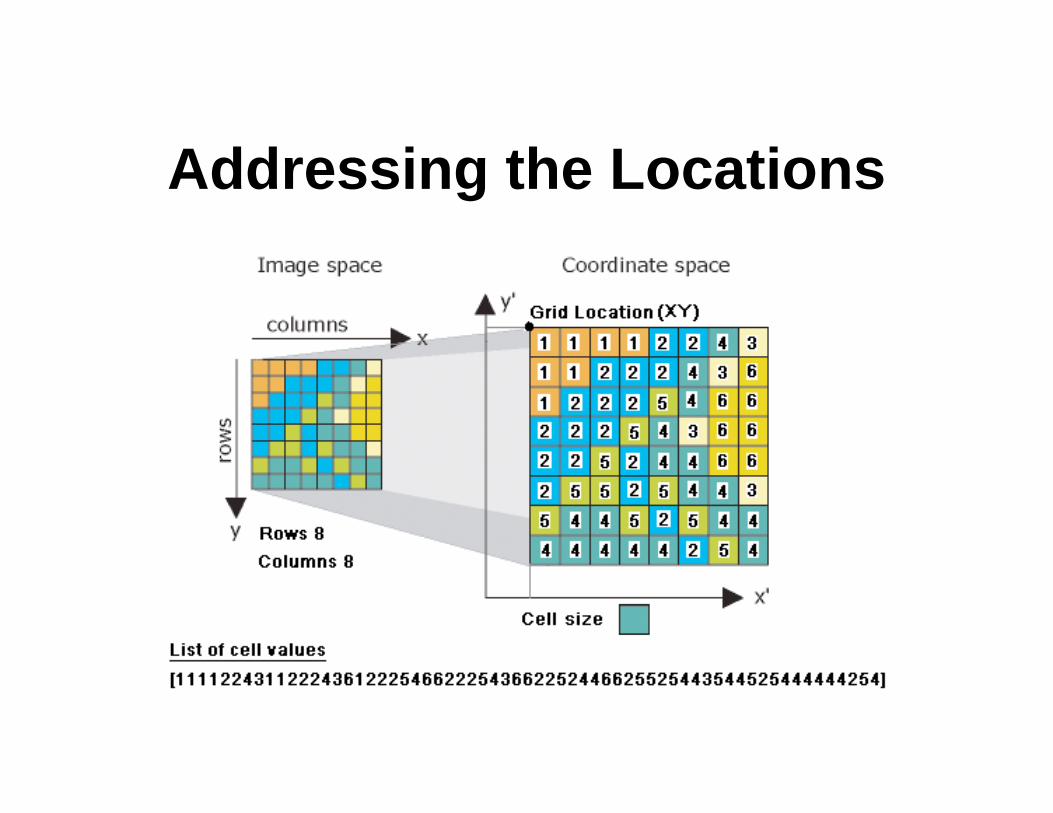
Addressing the Locations
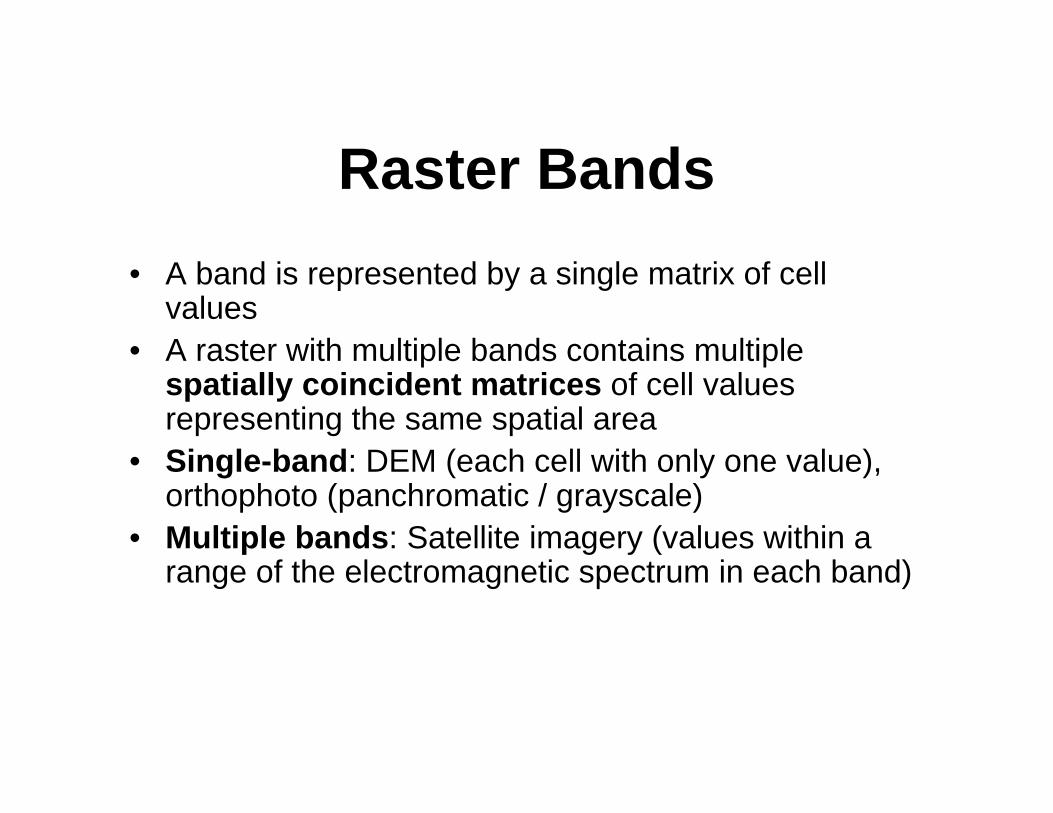
Raster Bands
• A band is represented by a single matrix of cellvalues
• A raster with multiple bands contains multiplespatially coincident matrices of cell valuesrepresenting the same spatial area
• Single-band: DEM (each cell with only one value),orthophoto (panchromatic / grayscale)
• Multiple bands: Satellite imagery (values within arange of the electromagnetic spectrum in each band)
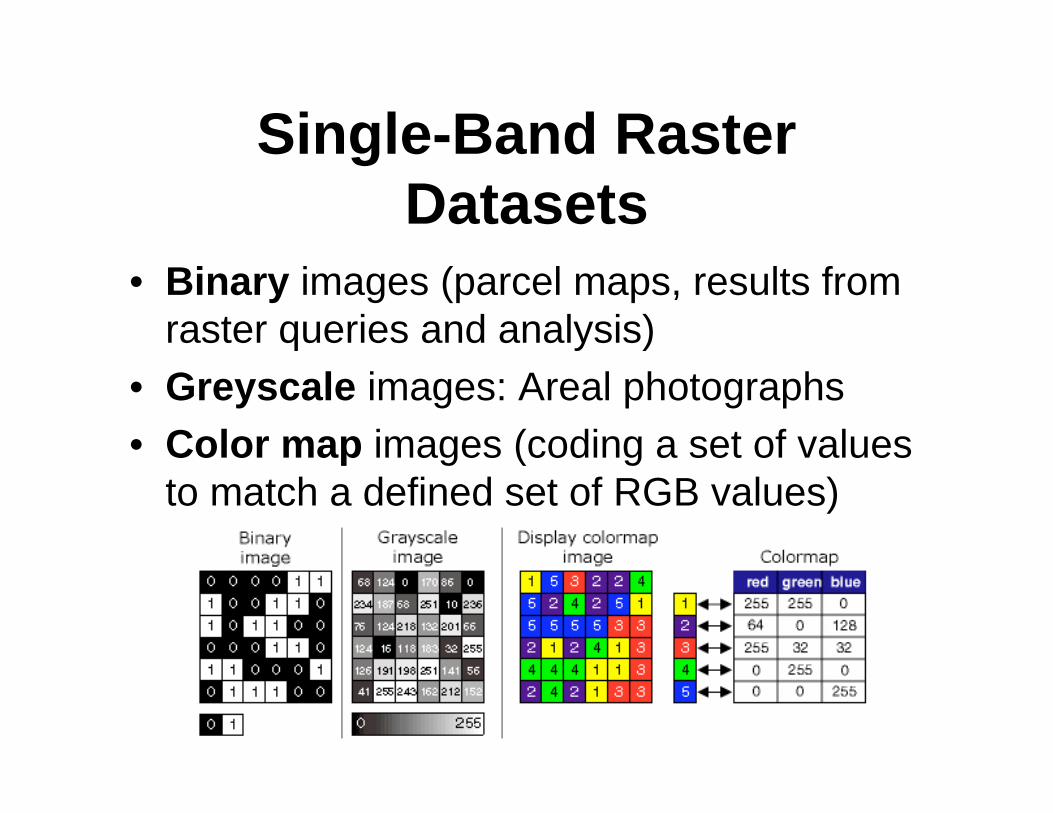
Single-Band Raster
Datasets
• Binary images (parcel maps, results from
raster queries and analysis)
• Greyscale images: Areal photographs
• Color map images (coding a set of values
to match a defined set of RGB values)
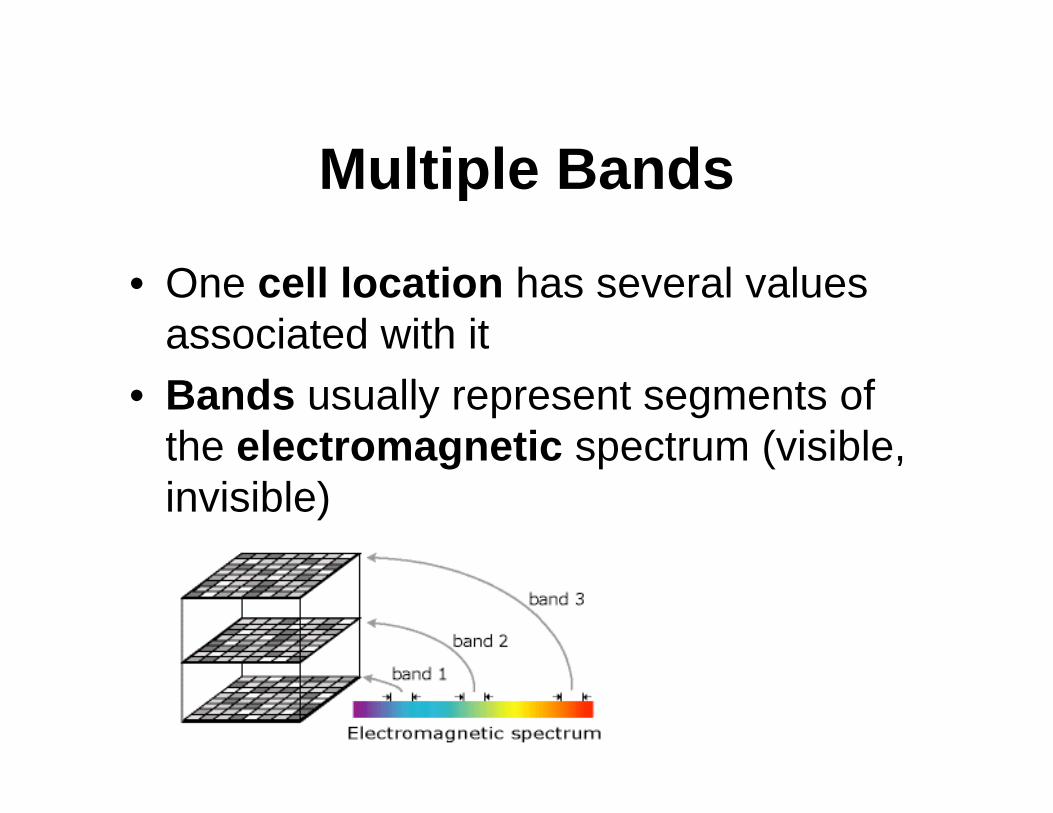
Multiple Bands
• One cell location has several values
associated with it
• Bands usually represent segments of
the electromagnetic spectrum (visible,
invisible)
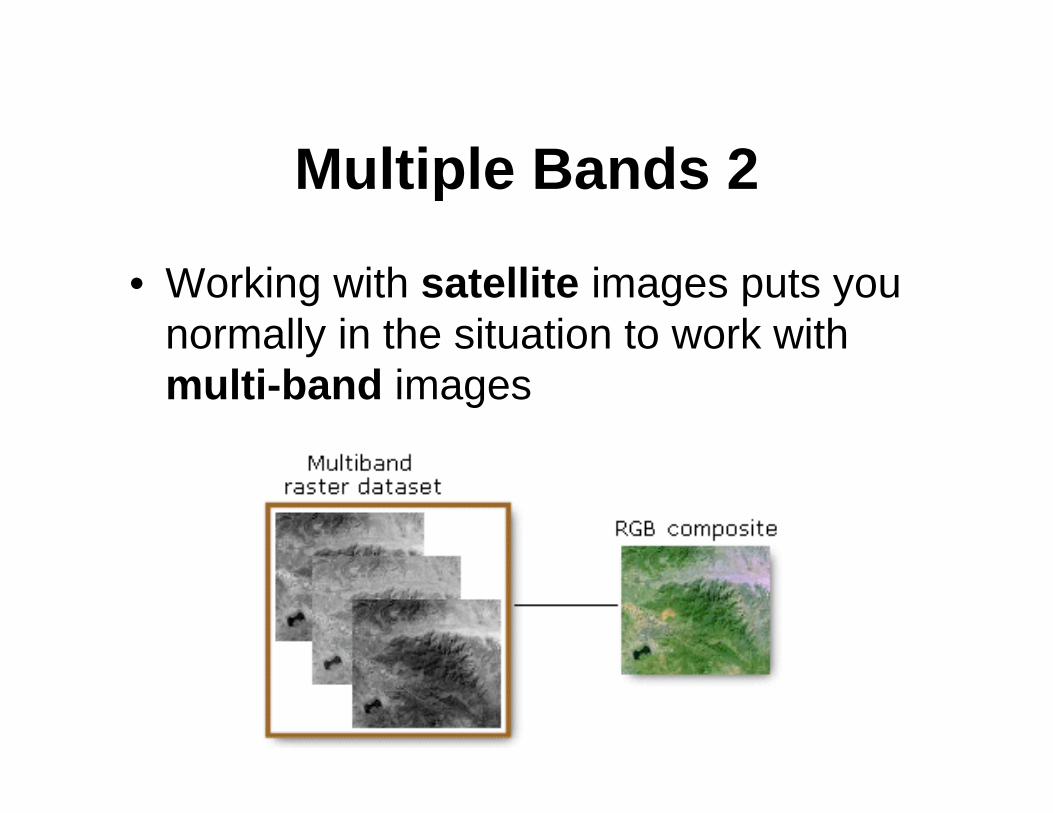
Multiple Bands 2
• Working with satellite images puts you
normally in the situation to work with
multi-band images
Types of Resolution
• Spatial resolution: Cell size
• Spectral resolution: Ability of the sensor todistinguish between wavelength intervals in theelectromagnetic spectrum
• Temporal resolution: Frequency for data captureat the same location
• Radiometric resolution: Ability of a sensor todistinguish objects viewed in the same part of theelectromagnetic spectrum, number of values in aband
Raster Dataset Information
• Format: File type for storing the raster
• Number of bands: Number of spatially coincidentlayers in the raster (min 1)
• Data type: Pixel type - int or float
• Data depth: Pixel or bit depth - possible range ofvalues stored in each band (depth=8 stores 2**8=256values (0 to 255); depth=16 stores 2**16=65536 values(0 to 65535)
• Statistics
• Extents: Left, right, top, and bottom coordinates
• Projection: Coordinate system
• Size: Number of rows & columns (uncompressed size)

Bit Depth

World Files for
Georeferencing Information
• Some image formats store GI in a header of the
image file (grids, img, GeoTIFF)
• Others use world (ASCII) files (.tfw)
• Origin of an image is ul (row values increase
downward), of a coord system ll

Critical Points in Working
with Raster Data
• Noise, false colors, mixed colors
• Object separation / identification
• Neighborhoods for Morphology operators
• Assignment and coding
• Edges, contours and transitions betweenobjects and background (blurring)