gis training: module 5 - world health...
TRANSCRIPT

2010
GIS Training: Module 5 Geocoding and importing health data
IER/HSI/GIS

ii
© World Health Organization All rights reserved.
The designations employed and the presentation of the material in this publication
do not imply the expression of any opinion whatsoever on the part of the World
Health Organization concerning the legal status of any country, territory, city or
area or of its authorities, or concerning the delimitation of its frontiers or
boundaries. Dotted lines on maps represent approximate borderlines for which there
may not yet be full agreement.
The mention of specific companies or of certain manufacturers' products does not
imply that they are endorsed or recommended by the World Health Organization in
preference to others of a similar nature that are not mentioned. Errors and
omissions excepted, the names of proprietary products are distinguished by initial
capital letters.
The World Health Organization does not warrant that the information contained in
this publication is complete and correct and shall not be liable for any damages
incurred as a result of its use.

Module 5: Geocoding and Importing Health
Data
Aim
The aim of this module is to introduce and understand the principals of geocoding
health data at country level, sub-national level, and city or settlement data.
Overview
Geocoding is a GIS operation that matches attribute data in one database with
similar attributes in a georeferenced database. The result can be displayed as a
feature on a map or used for analytical purposes. In practical terms, health data
must be associated with a spatial location in order to make it "mappable" and to
conduct geospatial analysis on it. Thus, the majority of disease data and health
care data must be linked to a spatial component in order to view it in a GIS
environment.
Learning Objectives
By the end of this module, you should be able to:
Understand the basis and importance of geocoding.
Learn about country level coding systems.
Learn about sub-national level reference datasets.
Understand how to access standard geocodes.
Adequately prepare a database for mapping.
Apply global standards for geocoding a database
Exercises
Geocoding country level health data
Geocoding sub-national level health data
Geocoding city/settlement level health data

ii
5-1 Geocoding and importing health data
November 4, 2010
5.1. Understanding Geocoding
5.1.1 What is Geocoding? The majority of disease data and health care data must be linked to a spatial
component to view them in a GIS environment. Simply put, to make health data
mappable and to subsequently conduct geospatial analyses the health data must
be associated with a spatial location.
Geocoding refers as a GIS operation that matches attribute data in one database
with similar attributes in a georeferenced database. The result can be displayed as
a feature on a map or used for analytical purposes.
There are two methods used to geocode data:
1. Joining health data to geographical areas – This process means
linking health data with geographic features (countries, regions,
subdivisions). The association is based on a common coding system that
must be part of both the health data and the geographic data.
2. Address matching to locate a health event – This process means
assigning geographic coordinates (latitude and longitude) to health data so
that it is readily mappable. It requires a reference dataset, which is the
underlying geographic database containing geographic features, and a
program or a specialized software application that calculates location of the
health events.
5.2. Country level coding systems In many instances, standard codes are already attached with health data. If not,
you may choose any one of the standard coding systems. This code allows for the
health data to be associated with a spatial location on a map and is the attribute
used for the spatial join.
Different country level coding systems are available and adopted by different
agencies. The standard coding systems used by WHO include ISO 3166-1 alpha-2
code and ISO 3166-1 alpha-3 code.
ISO 3166-1 alpha-2 code
ISO 3166-1 alpha-2 codes are two-letter country codes defined in ISO 3166-1, part
of the ISO 3166 standard published by the International Organization for
Standardization (ISO), to represent countries, dependent territories, and special
areas of geographical interest.
ISO 3166-1 alpha-3 code
ISO 3166-1 alpha-3 codes are three-letter country codes defined in ISO 3166-1,
part of the ISO 3166 standard published by the International Organization for
Standardization (ISO), to represent countries, dependent territories, and special
areas of geographical interest. They allow a better visual association between the
codes and the country names than the two-letter alpha-2 codes.
5-2 GIS Training: Module 5
November 4, 2010
The WHO standard map templates contain both ISO-2 and ISO-3 codes in the
geographic layers. It is important to note that the ISO-2 codes are two-letter
country codes and are most widely used. However, the ISO-3 code, the three letter
coding system, is recommended for thematic mapping at the national level.
5.3. Sub- national level coding systems For administrative or health subdivision, reference datasets used for geocoding are
composed of polygon data. There are many geographic databases for the world
administrative divisions that are often difficult to maintain up-to-date as sub-
national entities change on a regular basis.
The data sources can vary greatly in terms of coverage and accuracy. Most of the
time, different agencies within the country use different coding systems and might
have different numbers of units. This makes mapping sub-national data quite a
challenge. There are some standard reference databases and coding systems for
sub-national level at global scale. These are SALB codes, FAO GAUL codes,
GADM codes, and WHO HealthMapper codes. It would be advisable to receive
reference geographic data during the data collection process from the respective
countries. Use the codes attached to the geographic data to assign to your health
data. If this is not possible, one of the above reference geographic data can be
used. Each of the standard reference data sets has certain pros and cons. It is
advisable to contact the data owners of these reference data before deciding which
coding system to adopt for your health data. WHO generally seeks out sub-
national data from the sources in the following order: SALB, GAUL, GADM,
HealthMapper.
SALB
SALB is a UN project, which has been launched in the context of the activities of
United Nations Geographic Information Working Group (UNGIWG) to provide the
international community with a global standardized GIS layer containing the
delimitation of the administrative boundaries down to the 2nd sub-national level.
SALB is the data received from national mapping agencies of WHO member states
and is considered a UN official source. SALB contains a record of historical
changes of boundaries since 1990. In many cases, the codes are available, but not
the spatial data.
FAO GAUL
The Global Administrative Unit Layers (GAUL), an initiative implemented by
FAO, compiles and disseminates spatial information on administrative units for all
the countries in the world, providing a contribution to the standardization of the
spatial dataset representing administrative units. The GAUL always maintains
global layers with a unified coding system at country, first (e.g. regions), and
second administrative levels (e.g. districts). The GAUL is released once a year
and the target beneficiary of the GAUL data is the UN community, universities,
and other authorized international and national institutions/agencies.
Data might not be officially validated by authoritative national sources and cannot
be distributed to the general public.

5-3 Geocoding and importing health data
November 4, 2010
GADM dataset
GADM, the Database of Global Administrative Areas, is a spatial database of the
location of the world's administrative areas for use in GIS and similar software.
Administrative areas in this database are countries and lower level subdivisions
such as provinces, departments, districts, counties, etc. GADM describes where
these administrative areas are (the "spatial features"), and for each area it
provides some attributes, foremost being the name and variant names.
GADM was developed to support various activities, including georeferencing of
textual locality descriptions (the BioGeomancer project) and for mapping census
type data. The development is led by Robert Hijmans, in collaboration with Nell
Garcia and John Wieczorek. Major contributions have also been made by Arnel
Rala, and Aileen Maunahan at the International Rice Research Institute and by
Julian Kapoor at the Univeristy of California, Berkeley, Museum of Vertebrate
Zoology.
WHO HealthMapper dataset
The WHO HealthMapper dataset contains comprehensive data in terms of global
coverage. This is a collection of geospatial data from countries through various
health data collection mechanisms. These data are good for mapping, but require
further cleaning for advanced geospatial analysis. The purpose of this dataset is to
cater to the WHO health community and provide data visualization, not to
generate a standardized global coverage. It contains layers on a country-by-
country basis, down to third, fourth, and lowers levels. Updates are performed as
per request and need from the community.
The table below provides a brief overview of each of the reference datasets.
5.4. How to access standard geocodes Standard geocodes can be located in a variety of places. Below you will find
specific for finding geocodes at the country, sub-national, and city/settlement
levels. In addition, information is provided on a geocoding web services tool being
developed by WHO which will give access to geocodes used by WHO or the UN.
Country level geocodes
ISO 3166-1 alpha-2 code
SEARCH
ORDER NAME INFORMATION
1 FAO GAUL Description
Global Administrative Unit Layers (Levels 1
and 2)
Coverage Worldwide
2 SALB Description UN Second Administrative Level Boundaries
Coverage Worldwide but sparse
3 GADM Description Global Administrative areas
Coverage Worldwide
4 WHO
HealthMapper
Description Administrative divisions (Levels 1 to 4)/
Health Divisions (Levels 1 and 2)
Coverage Worldwide/
Worldwide but sparse
5-4 GIS Training: Module 5
November 4, 2010
A complete list of ISO-2 codes can be found on the International Organization
for Standardization website:
http://www.iso.org/iso/country_codes/iso_3166_code_lists/english_country_name
s_and_code_elements.htm
A complete list of ISO-3 codes is available by request from the International
Organization for Standardization (http://www.iso.org/iso/country_codes). A list
is also available on Wikipedia at
http://en.wikipedia.org/wiki/ISO_3166-1_alpha-3
Sub-national level geocodes
FAO GAUL
The GAUL layer can be downloaded from the FAO Geonetwork site at:
http://www.fao.org/geonetwork/srv/en/metadata.show?id=1269
SALB
The SALB layer can be downloaded from the UNGIWG SALB website at:
http://www.unsalb.org/
GADM
GADM layers are available for download from the GADM website at:
http://www.gadm.org/
WHO HealthMapper
The HealthMapper geocodes provide details of the exact location of
geospatial points (UNITID) or geospatial polygons (LVLID).
Units/points
Units are the smallest entities: towns, villages, schools, safe water points,
hospitals and health service centres
Different unit levels for the same country are hierarchically linked e.g. town
village school
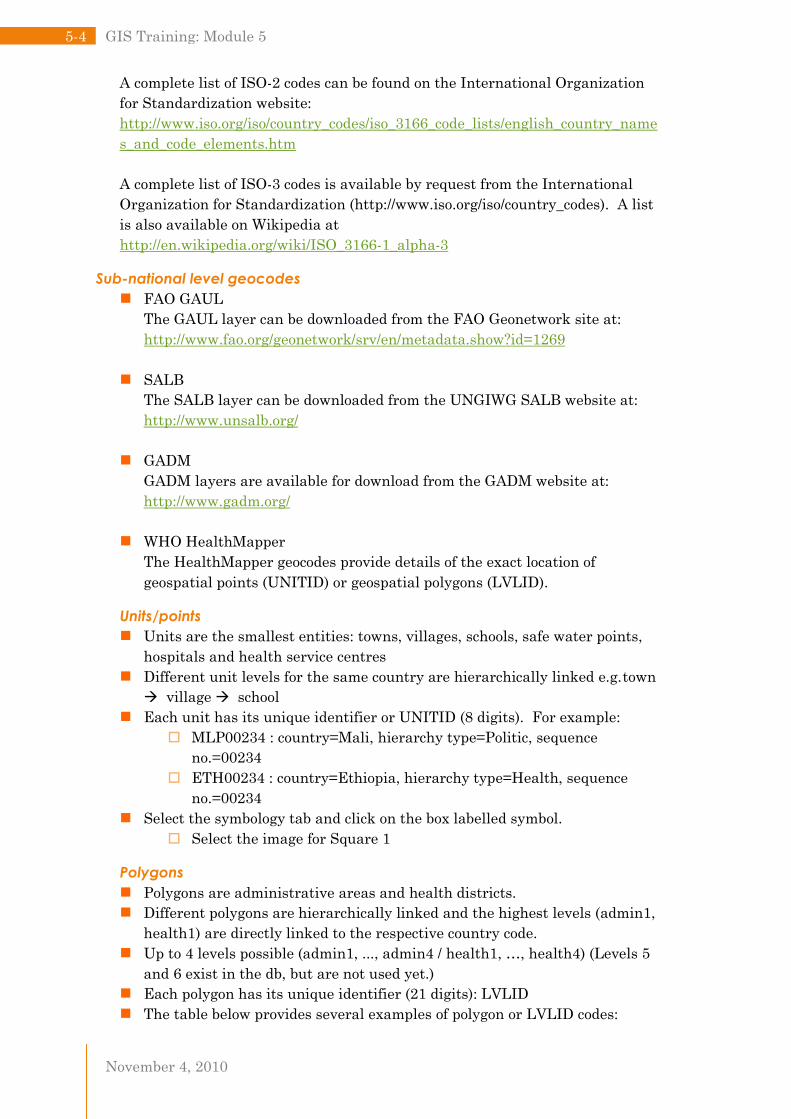
Each unit has its unique identifier or UNITID (8 digits). For example:
MLP00234 : country=Mali, hierarchy type=Politic, sequence
no.=00234
ETH00234 : country=Ethiopia, hierarchy type=Health, sequence
no.=00234
Select the symbology tab and click on the box labelled symbol.
Select the image for Square 1
Polygons
Polygons are administrative areas and health districts.
Different polygons are hierarchically linked and the highest levels (admin1,
health1) are directly linked to the respective country code.
Up to 4 levels possible (admin1, ..., admin4 / health1, …, health4) (Levels 5
and 6 exist in the db, but are not used yet.)
Each polygon has its unique identifier (21 digits): LVLID
The table below provides several examples of polygon or LVLID codes:

5-5 Geocoding and importing health data
November 4, 2010
S
e
q
u
1. S
1. Sequence number 324 of administrative sub-district level 3 in Mali.
2. Sequence number 324 of health sub-district level 3 in Ethiopia. No
health district level 2 defined, as surely not yet traced.
3. Burkina Faso country level.
You can get access to all the HealthMapper geocodes from views in SQL
server. The geocodes correspond to a global database containing geographic
data for all countries. The views are stored in a database on a production
server. You will find below the parameters to connect to it:
Server: GVA1SWLULUS
User: HealthmapGeocodeUser
Password: HealthmapGeocodeUser
SQL views for polygons:
Healthmap.dbo.vw_AdminLevel1
Healthmap.dbo.vw_AdminLevel2
Healthmap.dbo.vw_AdminLevel3
Healthmap.dbo.vw_AdminLevel4
SQL views for points:
Healthmap.dbo.vw_units
City/settlement level geocodes
There are various web services available for city level geocoding purposes. The
most frequently used geocoding web services are Google maps, Geonames, and
Yahoo map. These are available through various web sites. It is advisable to use
one of these web sites if you have few events to be geocoded.
You can use any of the following URLs to find the latitude and longitude of a place:
http://itouchmap.com/latlong.html
http://www.backups.nl/geocoding/index.html
http://www.opengeocoding.org/geocoding/geocod.html
http://www.gpsvisualizer.com/geocoding.html
http://www.mapchannels.com/GeocoderSimple.aspx
WHO geocoding services
Geocoding services will be created on the WHO web map server (ArcGIS server) to
give access to geocodes used by WHO or UN. This online service will work like the
ISO
country
code
Hierarchy
code
1 2 3 4 5 6 Note
ML P 002 001 324 000 000 000 (1)
ET H 002 000 324 000 000 000 (2)
BF P 002 000 000 000 000 000 (3)

5-6 GIS Training: Module 5
November 4, 2010
ArcGIS Online address locator and users will be able to access it with ArcGIS
desktop within WHO.
This geocoding framework will provide composite address locators and/or geocode
services. For administrative or health subdivision, the main reference datasets
used for geocoding will be made available through this service:
FAO GAUL
SALB
GADM
Healthmapper
At the moment, you can search the geocodes using the REST interface. REST,
shorthand for Representational State Transfer, is used as a mechanism to identify
and work with any Web resource, such as Web pages and Web resources.
Essentially, REST enables users to issue a series of operations or commands
against URLs and other Web resources (for example, URIs).
Step 1. Type the server URL http://gva1swjuno/ArcGIS/rest/services
Step 2. Click on Global_places
Step 3. Click on SALB admin2. You should see all the details concerning this
layer such as the geometry type and the list of fields.
Step 4. Click on Query layer.
Step 5. Enter Zambia as the CNTRY_NAME.
Step 6. For the result options, enter the return fields names with comma
separated: CNTRY_NAME,ADM2_NAME,ADM2_CODE

5-7 Geocoding and importing health data
November 4, 2010
Step 7. Click on Find. You should see the list of all the admin2 names and codes
for Zambia from the SALB reference dataset.
5.5. Preparing health data The more carefully you format your table, the better the geocoding process will
work. It is important that your data formatting is consistent throughout the
database. If you are using a spreadsheet to create this data set, make the first row
the field names, and start your actual records on the second row. Do not put in
other formatting or rows or columns, e.g., no titles, or spacer rows. The field names
should not include spaces or odd characters in the field name, and a maximum of
10 characters. Each row of data should contain only one province or one district
name.
It is advisable to use the geocodes from the reference dataset during the data
collection process. If it is not possible, you will need to format the dataset in order
to assign geocodes to the health data.
The Cholera Outbreaks 2010 table below is a good example of many of the issues
that can come up when dealing with geocoding sub-national level data. Can you
find some of the potential problems with this data set?

5-8 GIS Training: Module 5
November 4, 2010
CHOLERA OUTBREAKS 2010
Disease Start End Country Provinces / Districts WHO Region
Cholera 19-Oct-09 28-Mar-10 Zambia Lusaka, Copperbelt,
Southern
AFRO
Cholera 01-Jan-10 10-Apr-10 Mozambique Cabo Delgado, Niassa,
Zambezia, Sofala,
Nampula
AFRO
Answers:
1. No title and no spacer rows. The first line of the spreadsheet should be the
column names.
2. There should be no spaces in the field names.
3. There should only be one province/district per row.
A correct table should look like the following:
DISEASE START END COUNTRY PROVINCE/DISTRICT WHOREGION GEOCODE
Cholera 19-Oct-09 28-Mar-10 Zambia Lusaka AFRO `
Cholera 19-Oct-09 28-Mar-10 Zambia Copperbelt AFRO
Cholera 19-Oct-09 28-Mar-10 Zambia Southern AFRO
Cholera 01-Jan-10 10-Apr-10 Mozambique Cabo Delgado AFRO
Cholera 01-Jan-10 10-Apr-10 Mozambique Niassa AFRO
Cholera 01-Jan-10 10-Apr-10 Mozambique Zambezia AFRO
Cholera 01-Jan-10 10-Apr-10 Mozambique Sofala AFRO
Cholera 01-Jan-10 10-Apr-10 Mozambique Nampula AFRO

5-9 Geocoding and importing health data
November 4, 2010
Exercises: Geocoding health data The first step in geocoding health data is to determine the granularity or
resolution of available data. Is your data country level, sub-national level, or
city/settlement specific data? This set of exercises will explain how to geocode all
three types of health data.
Exercise 1: Geocoding country level data
For this exercise we will be geocoding a IMCI training coverage dataset
called IMCI_training_country_geocoding which can be found in the
MDX_geocoding folder.
Mostly disease data or health data are only represented at country level.
Capturing these data in GIS involves spatial joining. A spatial join is like
joining two tables by matching attribute values. In order to accomplish
this, both tables must have a common attribute. You will be using the
joining method for country level data.
Task 1. Choose reference data/standard coding scheme.
In many instances, standard codes are already attached with health data.
If not, you may choose any one of the standard coding schemes. This code
allows for the health data to be associated with a spatial location on a map
and is the attribute used for the spatial join mentioned above.
For this exercise we will be using the ISO-3 coding system.
Task 2. Task 2: Assign geocodes to the data.
The most common format of input data is Excel or MS Access but it can
also be from a variety of databases with OLEDB capabilities. You can
assign geocodes by transforming your input data (manual assignment) or
by using an excel spreadsheet with standard geocodes. For this exercise
we will review both methods.
Option 1: Modify your input data manually
To modify your input data manually take the following steps:
Step 1. Open the IMCI_training_country_geocoding data file.
Step 2. Create a new column called ISO3 in your data table.
Step 3. Add a unique country code for each country from the selected coding
system to the column. You can access a complete list of ISO-3 codes at
http://en.wikipedia.org/wiki/ISO_3166-1_alpha-3
Step 4. When you have completed entering data, you can save the excel
spreadsheet and close it.
Once the ISO3 columns have been added, your data table should look like
the following:

5-10 GIS Training: Module 5
November 4, 2010
NAME VALUE ISO3
Afghanistan 35.000 AFG Armenia 35.000 ARM Benin 65.000 BEN Bolivia 85.000 BOL Brazil 15.000 BRA Cote d'Ivoire 5.000 CIV Cameroon 5.000 CMR
Option 2: Use the data entry template with ISO codes
Another option is to use an excel worksheet created by WHO called the
DataEntryTemplate which will help to automate the process of assigning codes.
To modify your input data using the DataEntryTemplate, take the following steps:
Step 1. Open the excel spreadsheet called DataEntryTemplate.xls under the
folder MXD_geocoding, The list of countries is already populated along
with the ISO codes.
Step 2. You can enter your data in the last columns: indicator1, indicator2,
indicator3, indicator4. Enter the data from
IMCI_training_country_geocoding into the column indicator1.
Step 3. When you have completed entering data, you can save the excel
spreadsheet and close it.
Your data is now ready to be mapped.

5-11 Geocoding and importing health data
November 4, 2010
Exercise 2: Geocoding sub-national level data
For this exercise we will be geocoding a cholera outbreak dataset called
healthdata_subnational_formatted_result.xls which can be found in the
MDX_geocoding folder.
Disease data or health data can be reported by area name (administrative
subdivision, province, district, health subdivision, etc.). Capturing these
data in GIS involves geocoding using world administrative divisions as a
reference dataset then doing a spatial join to link the health data to the
geographic data.
Task 1. Choose reference data/standard coding scheme.
In many instances, standard codes are already attached with health data.
If not, you may choose any one of the standard coding schemes. This code
allows for the health data to be associated with a spatial location on a map
and is the attribute used for the spatial join mentioned above.
For this exercise we will be using the WHO HealthMapper coding
system.
Task 2. Assign geocodes to the data.
Step 1. Open the excel spreadsheet called
healthdata_subnational_formatted_result.xls
Step 2. Add a column 'GEOCODE' to your data sheet
Step 3. Your table should be similar to the one below
Step 4. Without closing Excel, save your excel spreadsheet.
Step 5. Start ArcMap and open the Global_detailed template located in the folder
MDX_geocoding.
Step 6. Save the map file with a new name under MXD_geocoding. Under File,
select Save as and name the file subnational_geodocoding.
Step 7. Click the Add Data button.
Step 8. Click the Connect to folder button.
Step 9. Connect to the folder corresponding to the GIS curriculum data sources
and click OK.
Step 10. In the Add Data dialog box, double-click on Geodatabase.mdb and select
the layer Merge_Admin1and2. Click Add.
Step 11. This layer contains all the administrative divisions for Africa with a
unique geocode (LVLID) for first, second, third and fourth administrative
levels.
Step 12. Right-click on the Merge_Admin1and2 layer and select Open attribute
table.
Step 13. In the table options menu, select Find and replace.

5-12 GIS Training: Module 5
November 4, 2010
Step 14. Enter the name of the administrative division to search "Lusaka" and click
Find Next.
Step 15. You should find the row corresponding to the Lusaka province.
Step 16. Right-click on the LVLID (ZMP001000000000000000) and select copy.
Step 17. Switch to your excel spreadsheet
healthdata_subnationallevel_formatted.xls
Step 18. Paste the LVLID for Lusaka in the column Geocode.
Step 19. Repeat the same operation for each row.
Step 20. At the end of the process your table should correspond to the one below.
Disease Start End Country Provinces
/ Districts
WHO
Reg.
Geocode
Cholera 19-
Oct-
09
28-
Mar
-10
Zambia Lusaka AFRO ZMP0010000
00000000000
Cholera 19-
Oct-
09
28-
Mar
-10
Zambia Copperbelt AFRO ZMP0020000
00000000000
Cholera 19-
Oct-
09
28-
Mar
-10
Zambia Southern AFRO ZMP0080000
00000000000
Cholera 01-
Jan-
10
10-
Apr-
10
Mozambique Cabo
Delgado
AFRO MZP0060000
00000000000
Cholera 01-
Jan-
10
10-
Apr-
10
Mozambique Niassa AFRO MZP0070000
00000000000
Cholera 01-
Jan-
10
10-
Apr-
10
Mozambique Zambezia AFRO MZP0100000
00000000000
Cholera 01-
Jan-
10
10-
Apr-
10
Mozambique Sofala AFRO MZP0080000
00000000000
Cholera 01-
Jan-
10
10-
Apr-
10
Mozambique Nampula AFRO MZP0010000
00000000000
Step 21. Save the excel spreadsheet and close it.
Your data is now ready to be mapped.
5-13 Geocoding and importing health data
November 4, 2010
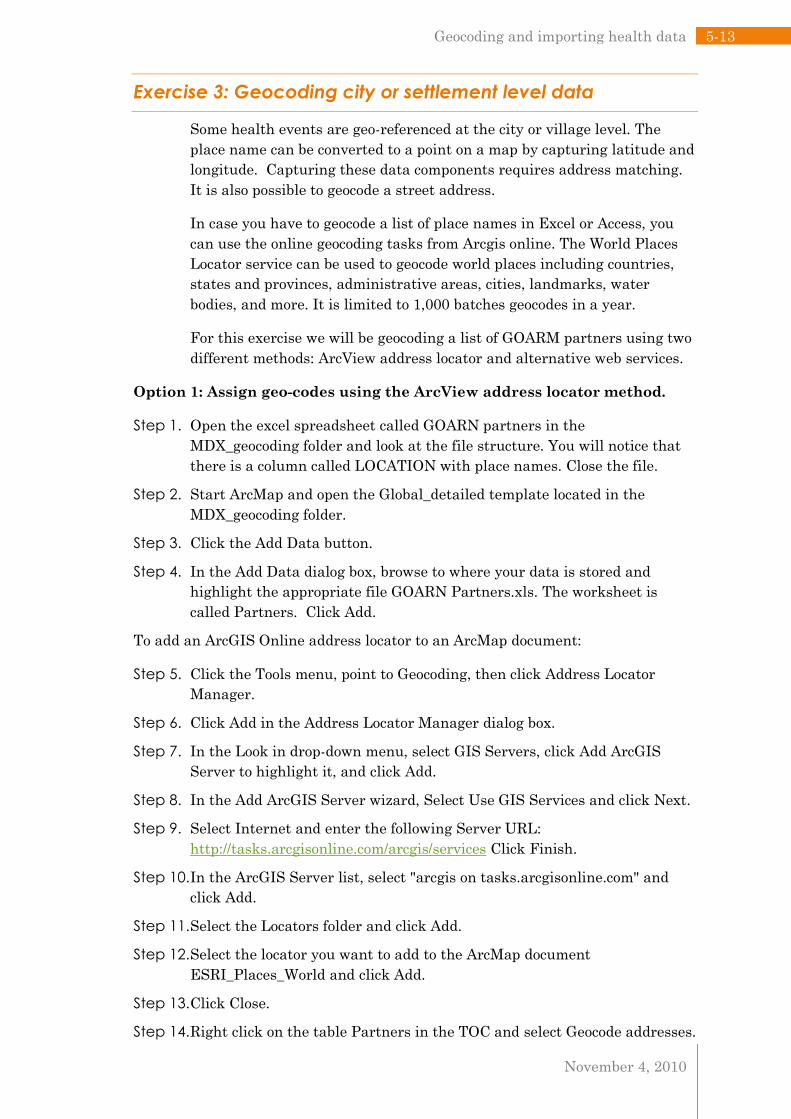
Exercise 3: Geocoding city or settlement level data
Some health events are geo-referenced at the city or village level. The
place name can be converted to a point on a map by capturing latitude and
longitude. Capturing these data components requires address matching.
It is also possible to geocode a street address.
In case you have to geocode a list of place names in Excel or Access, you
can use the online geocoding tasks from Arcgis online. The World Places
Locator service can be used to geocode world places including countries,
states and provinces, administrative areas, cities, landmarks, water
bodies, and more. It is limited to 1,000 batches geocodes in a year.
For this exercise we will be geocoding a list of GOARM partners using two
different methods: ArcView address locator and alternative web services.
Option 1: Assign geo-codes using the ArcView address locator method.
Step 1. Open the excel spreadsheet called GOARN partners in the
MDX_geocoding folder and look at the file structure. You will notice that
there is a column called LOCATION with place names. Close the file.
Step 2. Start ArcMap and open the Global_detailed template located in the
MDX_geocoding folder.
Step 3. Click the Add Data button.
Step 4. In the Add Data dialog box, browse to where your data is stored and
highlight the appropriate file GOARN Partners.xls. The worksheet is
called Partners. Click Add.
To add an ArcGIS Online address locator to an ArcMap document:
Step 5. Click the Tools menu, point to Geocoding, then click Address Locator
Manager.
Step 6. Click Add in the Address Locator Manager dialog box.
Step 7. In the Look in drop-down menu, select GIS Servers, click Add ArcGIS
Server to highlight it, and click Add.
Step 8. In the Add ArcGIS Server wizard, Select Use GIS Services and click Next.
Step 9. Select Internet and enter the following Server URL:
http://tasks.arcgisonline.com/arcgis/services Click Finish.
Step 10. In the ArcGIS Server list, select "arcgis on tasks.arcgisonline.com" and
click Add.
Step 11. Select the Locators folder and click Add.
Step 12. Select the locator you want to add to the ArcMap document
ESRI_Places_World and click Add.
Step 13. Click Close.
Step 14. Right click on the table Partners in the TOC and select Geocode addresses.
5-14 GIS Training: Module 5
November 4, 2010
Step 15. Select the Address locator to use Locators/ESRI_Places_World and click
OK.
Step 16. In the PlaceName dropdown list select LOCATION.
Step 17. Select the folder and the name of the output shapefile that will be created
and click OK.
Step 18. A new shapefile should be added in ArcMap.
Step 19. After a table of addresses is geocoded and saved in a geocoded feature
class, you may need to review matched addresses or geocode ones that
went unmatched. When the geocoded feature class is added to the map,
the Review/Rematch Addresses button on the Geocoding toolbar is
enabled. Clicking the button opens the Interactive Rematch dialog box,
where you can review and select records to rematch.
Option 2: Assign geo-codes using a web service.
Step 1. Open the excel file city_web_geocoding and take a look at the fields:
NAME, LATITUDE, AND LONGITUDE. All of the cities need latitude
and longitude coordinates.
Step 2. Open a web browser and open the geocoding web site:
http://www.backups.nl/geocoding/index.html
Step 3. Enter the place name you are looking for and click on search.
Step 4. The geocoding web service will return the geographic location as 'latitude
(lat)' and 'longitude (long).'
Step 5. Copy the value that appears under the latitude box to your data file under
the latitude column.
Step 6. Copy the value that appears under the longitude box your data file under
the longitude column.
Step 7. Repeat for all the cities on your list. Save and close the file when
complete.
Step 8. Start ArcMap and open the detailed template located in the
MDX_geocoding folder.
Step 9. Click the Add Data button.
Step 10. In the Add Data dialog box, browse to where the city_web_geocoding file
and highlight then click Add.
Step 11. Right click on the data table you have added and select Display XY data.
Step 12. Indicate the longitude column for the X field.
Step 13. Indicate the latitude column for the Y field.
Step 14. Click OK.
Step 15. The places should be displayed on the map.