gitman_286618_im_ch02 - test bank and solution...
TRANSCRIPT

Chapter 2Financial Statements and Analysis
Instructor’s ResourcesOverviewThis chapter examines four key components of the stockholders’ report: the income statement, balance sheet, statement of retained earnings, and the statement of cash flows. On the income statement and balance sheet, the major accounts/balances are reviewed for the student. The rules for consolidating a company’s foreign and domestic financial statements (FASB No. 52) are described. Following the financial statement coverage the chapter covers the evaluation of financial statements using the technique of ratio analysis. Ratio analysis is used by prospective shareholders, creditors, and the firm’s own management to measure the firm’s operating and financial health. Three types of comparative analysis are defined: cross-sectional analysis, time-series analysis, and combined analysis. The ratios are divided into five basic categories: liquidity, activity, debt, profitability, and market. Each ratio is defined and calculated using the financial statements of the Bartlett Company. A brief explanation of the implications of deviation from industry standard ratios is offered, with a complete (cross-sectional and time-series) ratio analysis of Bartlett Company ending the chapter. The DuPont system of analysis is also integrated into the example. The importance of understanding financial statements is highlighted through discussions of how such knowledge will help the student be a more efficient business manager and more effectively make personal financial decisions.
Study GuideSuggested Study Guide examples for classroom presentation:
Example Topic
1 Basic ratio calculation2 Common-size income statement3 Evaluating ratios
Answers to Review Questions1. The role of the Financial Accounting Standards Board (FASB) and Public Company Accounting
Oversight Board (PCAOB) regulatory agencies in the financial reporting of businesses is highly significant. The general accepted accounting standards that firms must comply with and the procedures in monitoring those standards are referred to as generally accepted accounting procedures (GAAP) and are established primarily by the FASB. The PCAOB has as one of its primary duties serving as the watchdog over the public accounting profession. Public accounting firms have reports that must be submitted to the PCAOB documenting compliance with auditing standards established by the PCAOB. Both the process of monitoring the accountants and the use of GAAP in financial reporting are necessary to restore and maintain public confidence in the financial information distributed to the public.

19 Gitman • Principles of Managerial Finance, Brief Fifth Edition
2. The purpose of each of the four major financial statements are:
Income Statement—The purpose of the income statement is to provide a financial summary of the firm’s operating results during a specified time period. It includes both the sales for the firm and the costs incurred in generating those sales. Other expenses, such as taxes, are also included on this statement.
Balance Sheet—The purpose of the balance sheet is to present a summary of the assets owned by the firm, the liabilities owed by the firm, and the net financial position of the owners as of a given point in time. The assets are often referred to as investments and the liabilities and owner’s equity as financing.
Statement of Retained Earnings—This statement reconciles the net income earned during the year, and any cash dividends paid, with the change in retained earnings during the year.
Statement of Cash Flows—This statement provides a summary of the cash inflows and the cash outflows experienced by the firm during the period of concern. The inflows and outflows are grouped into the cash flow areas of operations, investment, and financing.
3. The notes to the financial statements are important because they provide detailed information not directly available in the financial statements. The footnotes provide information on accounting policies, procedures, calculation, and transactions underlying entries in the financial statements.
4. Financial Accounting Standards Board Statement No. 52 describes the rules for consolidating a company’s foreign and domestic financial statements. It requires U.S.-based companies to translate foreign-currency-denominated assets and liabilities into U.S. dollars using the current rate (translation) method. This method uses the exchange rate prevailing on the date the fiscal year ends (the current rate). Income statement items can be translated using either the current rate or an average exchange rate for the period covered by the statement. Equity accounts are converted at the exchange rate on the date of the investment. In the retained earnings account any gains and losses from currency fluctuations are stated separately in an equity reserve accountthe cumulative translation adjustment accountand not realized until the parent company sells or closes the foreign operations.
5. Current and prospective shareholders place primary emphasis on the firm’s current and future level of risk and return as measures of profitability, while creditors are more concerned with short-term liquidity measures of debt. Stockholders are, therefore, most interested in income statement measures, and creditors are most concerned with balance sheet measures. Management is concerned with all ratio measures, since they recognize that stockholders and creditors must see good ratios in order to keep the stock price up and raise new funds.
6. Cross-sectional comparisons are made by comparing similar ratios for firms within the same industry, or to an industry average, as of some point in time. Time-series comparisons are made by comparing similar ratios for a firm measured at various points in time. Benchmarking is the term used to describe this cross-sectional comparison with competitor firms.
7. The analyst should devote primary attention to any significant deviations from the norm, whether above or below. Positive deviations from the norm are not necessarily favorable. An above-normal inventory turnover ratio may indicate highly efficient inventory management but may also reveal excessively low inventory levels resulting in stockouts. Further examination into the deviation would be required.

Full file at http://testbank360.eu/solution-manual-principles-of-managerial-finance-brief-5th-edition-gitman
8. Comparing financial statements from different points in the year can result in inaccurate and misleading analysis due to the effects of seasonality. Levels of current assets can fluctuate significantly, depending on a company’s business, so statements from the same month or year end should be used in the analysis to ensure valid comparisons of performance.
9. The current ratio proves to be the better liquidity measure when all of the firm’s current assets are reasonably liquid. The quick ratio would prove to be the superior measure if the inventory of the firm is considered to lack the ability to be easily converted into cash.
10. Additional information is necessary to assess how well a firm collects receivables and meets payables. The average collection period of receivables should be compared to a firm’s own credit terms. The average payment period should be compared to the creditors’ credit terms.
11. Financial leverage is the term used to describe the magnification of risk and return introduced through the use of fixed-cost financing, such as debt and preferred stock.
12. The debt ratio and the debt-equity ratio may be used to measure the firm’s degree of indebtedness. The times-interest-earned and the fixed-payment coverage ratios can be used to assess the firm’s ability to meet fixed payments associated with debt.
13. Three ratios of profitability found on a common-size income statement are: (1) the gross profit margin, (2) the operating profit margin, and (3) the net profit margin.
14. Firms that have high gross profit margins and low net profit margins have high levels of expenses other than cost of goods sold. In this case, the high expenses more than compensate for the low cost of goods sold (i.e., high gross profit margin) thereby resulting in a low net profit margin.
15. The owners are probably most interested in the return on equity (ROE) since it indicates the rate of return they earn on their investment in the firm. ROE is calculated by taking earnings available to common shareholder and dividing by stockholders’ equity.
16. The price-earnings ratio (P/E) is the market price per share of common stock divided by the earnings per share. It indicates the amount the investor is willing to pay for each dollar of earnings. It is used to assess the owner’s appraisal of the value of the firm’s earnings. The level of the P/E ratio indicates the degree of confidence that investors have in the firm’s future. The market/book (M/B) ratio is the market price per of common stock divided by the firm’s book value per share. Firms with high M/B ratios are expected to perform better than firms with lower relative M/B values.
17. Liquidity ratios measure how well the firm can meet its current (short-term) obligations when they come due.
Activity ratios are used to measure the speed with which various accounts are converted (or could be converted) into cash or sales.
Debt ratios measure how much of the firm is financed with other people’s money and the firm’s ability to meet fixed charges.
Profitability ratios measure a firm’s return with respect to sales, assets, or equity.
Market ratios give insight into how well investors in the marketplace feel the firm is doing in terms of return and risk.

21 Gitman • Principles of Managerial Finance, Brief Fifth Edition
The liquidity and debt ratios are most important to present any prospective creditors.
Full file at http://testbank360.eu/solution-manual-principles-of-managerial-finance-brief-5th-edition-gitman
18. The analyst may approach a complete ratio analysis on either a cross-sectional or time-series basis by summarizing the ratios into their five key areas: liquidity, activity, debt, profitability, and market. Each of the key areas could then be summarized, highlighting specific ratios that should be investigated.
19. The DuPont system of analysis combines profitability (the net profit margin), asset efficiency (the total asset turnover) and leverage (the debt ratio). The division of ROE among these three ratios allows the analyst to the segregate the specific factors that are contributing to the ROE into profitability, asset efficiency, or the use of debt.
Suggested Answer to Critical Thinking Questionfor Focus on Practice Box
In addition to investors, who else might be benefiting directly from the implementation of the Sarbanes-Oxley Act?
The passage of Sarbanes-Oxley has brought increased business for major accounting firms, which have seen their billings rise as companies comply with the new rules. Software providers such as Microsoft, SAP, Oracle, and IBM have also benefited by creating a variety of software products to help firms comply. In addition, direct beneficiaries are consultants who were able to become specialists in Sarbanes-Oxley compliance.
Answers to Warm-Up ExercisesE2-1. Prepare an income statement.
Answer:a.
Name of CompanyIncome Statement ($000,000)
Sales revenue $345.0Less: Cost of goods sold 155.0 Gross profits $190.0Less: Operating expenses
Sales expense $ 18.0General and administrative expenses 22.0Lease expense 4.0Depreciation expense 25.0
Total operating expense $ 69.0Operating profits (EBIT) $ 121.0Less: Interest expense 3.0 Net profit before taxes $ 118.0Less: Taxes (rate 35%) 41.3 Net profits after taxes $ 76.7Less preferred stock dividend 4.675 Earnings available for common stockholders $ 72.025
b. See income statement

23 Gitman • Principles of Managerial Finance, Brief Fifth Edition
c. Additions to retained earnings ($2.75 – $1.10) 4,250,000 $7,012.500
E2-2. Income statements and balance statements
Answer: From the table in a, the reader can see that the calculations begin with sales revenue and end with net profits after taxes. Had there been a loss for the year, the final result would have been a net loss after taxes.
The balance statement balances the firm’s assets against its financing, which can be either debt or equity. The total value of all of the firm’s assets should equal the sum of its short- and long-term debt plus stockholder’s equity including preferred stock, common stock at par value, paid in capital in excess of par on common stock and retained earnings from previous profitable years in which some of the earnings were held back and not paid out as dividends.
E2-3. Statement of retained earnings
Answer:
Cooper Industries, Inc.Statement of Retained Earnings ($000)for the Year Ended December 31, 2009
Retained earnings balance (January 1, 2009) $25,320Plus: Net profits after taxes (for 2009) 5,150Less: Cash dividends (paid during 2009)
Preferred stock 750Common stock 3,850
Total dividends paid 4,600Retained earnings balance (December 31, 2009) $25,870
E2-4. Current ratios and quick ratios
Answer: The current ratio is increasing but the quick ratio is declining. Since inventory is included in the calculation of the current ratio, but not in the quick ratio, the ratios indicate that inventory is increasing and Bluestone is not operating in a lean manufacturing mode. As with any analysis using ratios, you should investigate other financial ratios for Bluestone to further assess its financial health.
E2-5. The Dupont method of calculating ROE
Answer: ROE 4.5% 0.72 1.43 4.63%
The advantage of using the Dupont system to calculate ROE over the direct calculation of earnings available for common stockholders ÷ common stock equity is that ROE, the most common measure for stockholders, is broken into three distinct components. Starting at the right we see how financial leverage has increased assets over the owners’ original equity. Next, moving to the left, we see how efficiently the firm used its assets to generate sales. Finally, the net profit margin shows the measure of profitability on sales. Each component can be compared with industry standards to see if the firm is underperforming or over performing in any one of the three areas.

Full file at http://testbank360.eu/solution-manual-principles-of-managerial-finance-brief-5th-edition-gitman
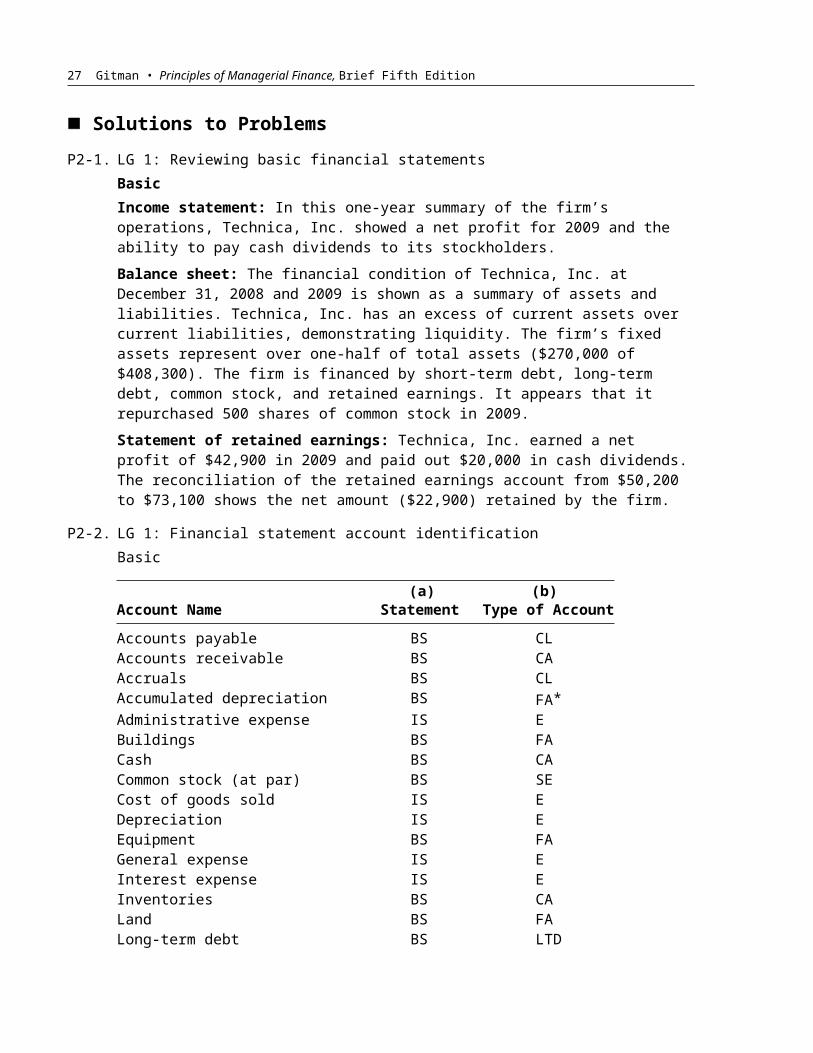
Solutions to ProblemsP2-1. LG 1: Reviewing basic financial statements
BasicIncome statement: In this one-year summary of the firm’s operations, Technica, Inc. showed a net profit for 2009 and the ability to pay cash dividends to its stockholders.Balance sheet: The financial condition of Technica, Inc. at December 31, 2008 and 2009 is shown as a summary of assets and liabilities. Technica, Inc. has an excess of current assets over current liabilities, demonstrating liquidity. The firm’s fixed assets represent over one-half of total assets ($270,000 of $408,300). The firm is financed by short-term debt, long-term debt, common stock, and retained earnings. It appears that it repurchased 500 shares of common stock in 2009.
Statement of retained earnings: Technica, Inc. earned a net profit of $42,900 in 2009 and paid out $20,000 in cash dividends. The reconciliation of the retained earnings account from $50,200 to $73,100 shows the net amount ($22,900) retained by the firm.
P2-2. LG 1: Financial statement account identificationBasic
(a) (b)Account Name Statement Type of Account
Accounts payable BS CLAccounts receivable BS CAAccruals BS CLAccumulated depreciation BS FA*Administrative expense IS EBuildings BS FACash BS CACommon stock (at par) BS SECost of goods sold IS EDepreciation IS EEquipment BS FAGeneral expense IS EInterest expense IS EInventories BS CALand BS FALong-term debt BS LTDMachinery BS FAMarketable securities BS CANotes payable BS CLOperating expense IS EPaid-in capital in excess of par BS SEPreferred stock BS SEPreferred stock dividends IS ERetained earnings BS SESales revenue IS RSelling expense IS ETaxes IS EVehicles BS FA

25 Gitman • Principles of Managerial Finance, Brief Fifth Edition
* This is really not a fixed asset, but a charge against a fixed asset, better known as a contra-asset.
Full file at http://testbank360.eu/solution-manual-principles-of-managerial-finance-brief-5th-edition-gitman
P2-3. LG 1: Income statement preparationIntermediatea.
Cathy Chen, CPAIncome Statement
for the Year Ended December 31, 2009
Sales revenue $360,000Less: Operating expenses
Salaries 180,000 Employment taxes and benefits 34,600 Supplies 10,400 Travel & entertainment 17,000 Lease payment 32,400 Depreciation expense 15,600 Total operating expense 290,000
Operating profits $ 70,000Less: Interest expense 15,000 Net profits before taxes $ 55,000Less: Taxes (30%) 16,500 Net profits after taxes $ 38,500
b. In her first year of business, Cathy Chen covered all her operating expenses and earned a net profit of $38,500 on revenues of $360,000.
P2-4. Personal finance: Income statement preparation
a.Adam’s salary $45,000 Arin’s salary 30,000 Interest received 500 Dividends received 150 Total Income $75,650
ExpensesMortgage payments 14,000 Utility expense 3,200 Groceries 2,200 Auto loan payment 3,300 Home insurance 750 Auto insurance 600 Medical expenses 1,500 Property taxes 1,659 Income tax and social security 13,000 Clothes and accessories 2,000 Gas and auto repair 2,100 Entertainment 2,000 Total Expenses $46,309
27 Gitman • Principles of Managerial Finance, Brief Fifth Edition
Cash Surplus or (Deficit) $29,341
b. Since income exceeds expenses, the Adams have a cash surplus.c. The cash surplus can be used for a variety of purposes. In the short-term, they may replace
their car, buy better furniture, or more quickly pay off their home. Alternatively, they may purchase stocks and bonds, or increase their savings for future needs. Investments in the stock market are generally designed to increase an individual’s future wealth, the purchase of bonds typically allows one to at least retain their purchasing power, while investment in savings accounts provide liquidity.
P2-5. LG 1: Calculation of EPS and retained earningsIntermediate
a. Earnings per share:
Net profit before taxes $218,000Less: Taxes at 40% 87,200 Net profit after tax $130,800Less: Preferred stock dividends 32,000Earnings available to common stockholders $ 98,800
b. Amount to retained earnings:85,000 shares $0.80 $68,000 common stock dividendsEarnings available to common shareholders $98,800Less: Common stock dividends 68,000 To retained earnings $30,800
P2-6. LG 1: Income statement preparationIntermediate
Owen Davis CompanyBalance Sheet
December 31, 2009
AssetsCurrent assets: Cash $ 215,000 Marketable securities 75,000 Accounts receivable 450,000 Inventories 375,000 Total current assets $1,115,000Gross fixed assets Land and buildings $ 325,000 Machinery and equipment 560,000 Furniture and fixtures 170,000 Vehicles 25,000 Total gross fixed assets $1,080,000

Full file at http://testbank360.eu/solution-manual-principles-of-managerial-finance-brief-5th-edition-gitman
Less: Accumulated depreciation 265,000 Net fixed assets $ 815,000Total assets $1,930,000
Continued
Owen Davis CompanyBalance Sheet
December 31, 2009
Liabilities and stockholders’ equityCurrent liabilities: Accounts payable $ 220,000 Notes payable 475,000 Accruals 55,000 Total current liabilities $ 750,000 Long-term debt 420,000 Total liabilities $1,170,000Stockholders’ equity Preferred stock $ 100,000 Common stock (at par) 90,000 Paid-in capital in excess of par 360,000 Retained earnings 210,000 Total stockholders’ equity $ 760,000Total liabilities and stockholders’ equity $1,930,000
P2-7. LG 1: Personal finance: Balance sheet preparationBasic
Adam and Arin AdamsBalance Sheet
December 31, 2009
Assets Liabilities and Net WorthCash $ 300 Utility bills $ 150 Checking 3,000 Medical bills 250 Savings 1,200 Credit card balance 2,000 Money market funds 1,200 Total Current Liabilities $ 2,400 Total Liquid Assets $ 5,700
Mortgage 100,000 IBM stock 2,000 Auto loan 8,000 Retirement funds, IRA 2,000 Personal loan 3,000 Total Investments $ 4,000 Total Long-term Liabilities $111,000
Total Real Estate $150,000 Total Liabilities $113,400
2008 Sebring 15,000 Total Net Worth 76,500 2007 Jeep 8,000 Household furnishings 4,200 Total Liabilities and Net Worth $189,900

29 Gitman • Principles of Managerial Finance, Brief Fifth Edition
Jewelry and artwork 3,000 Total Personal Property $ 30,200
Total Assets $189,900
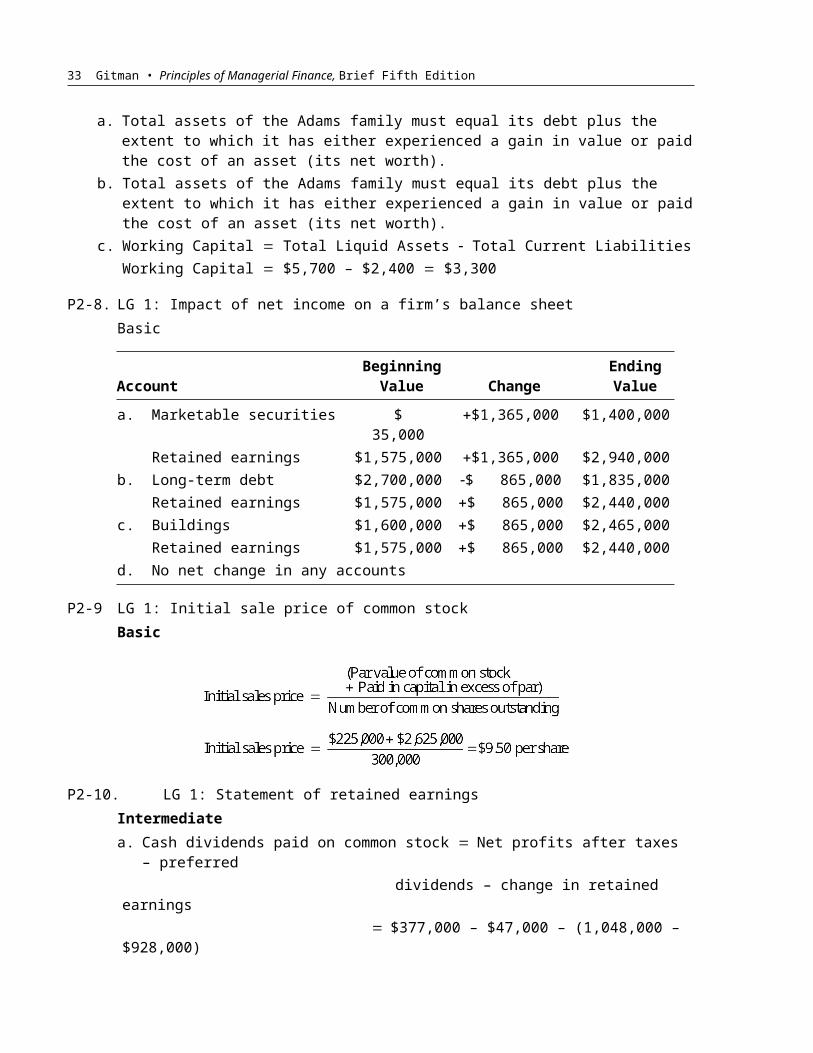
a. Total assets of the Adams family must equal its debt plus the extent to which it has either experienced a gain in value or paid the cost of an asset (its net worth).
b. Total assets of the Adams family must equal its debt plus the extent to which it has either experienced a gain in value or paid the cost of an asset (its net worth).
c. Working Capital Total Liquid Assets Total Current LiabilitiesWorking Capital $5,700 – $2,400 $3,300
P2-8. LG 1: Impact of net income on a firm’s balance sheetBasic
AccountBeginning
Value ChangeEndingValue
a. Marketable securities $ 35,000 $1,365,000 $1,400,000Retained earnings $1,575,000 $1,365,000 $2,940,000
b. Long-term debt $2,700,000 $ 865,000 $1,835,000Retained earnings $1,575,000 $ 865,000 $2,440,000
c. Buildings $1,600,000 $ 865,000 $2,465,000Retained earnings $1,575,000 $ 865,000 $2,440,000
d. No net change in any accounts
P2-9 LG 1: Initial sale price of common stockBasic
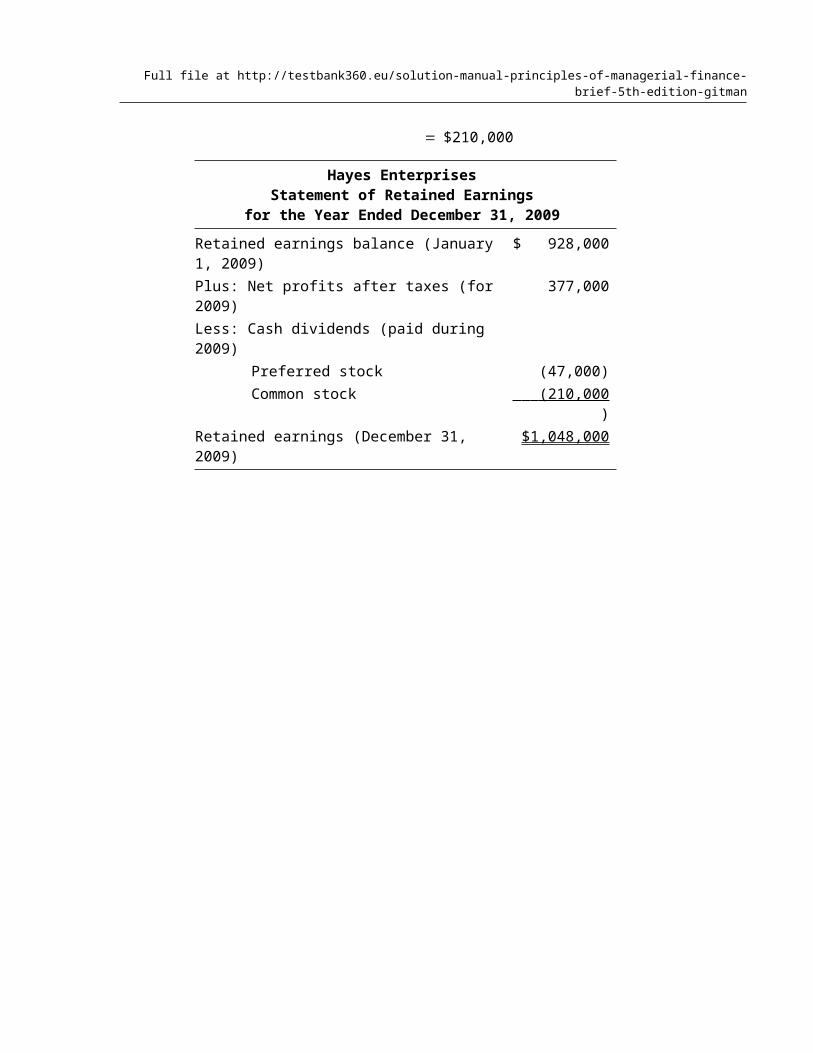
P2-10. LG 1: Statement of retained earningsIntermediatea. Cash dividends paid on common stock Net profits after taxes – preferred
dividends – change in retained earnings$377,000 – $47,000 – (1,048,000 – $928,000)$210,000
Hayes EnterprisesStatement of Retained Earnings
for the Year Ended December 31, 2009
Retained earnings balance (January 1, 2009) $ 928,000Plus: Net profits after taxes (for 2009) 377,000

Full file at http://testbank360.eu/solution-manual-principles-of-managerial-finance-brief-5th-edition-gitman
Less: Cash dividends (paid during 2009) Preferred stock (47,000) Common stock (210,000 )
Retained earnings (December 31, 2009) $1,048,000

31 Gitman • Principles of Managerial Finance, Brief Fifth Edition
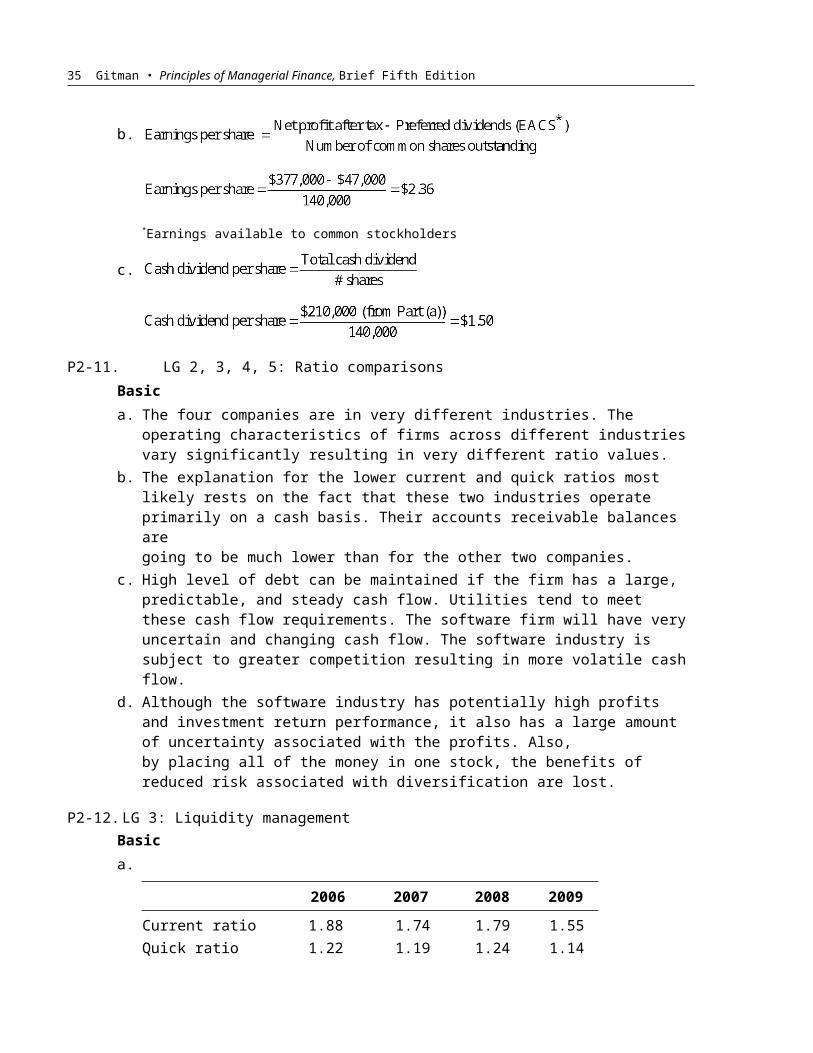
b.
*Earnings available to common stockholders
c.
P2-11. LG 2, 3, 4, 5: Ratio comparisonsBasica. The four companies are in very different industries. The operating characteristics of firms
across different industries vary significantly resulting in very different ratio values.b. The explanation for the lower current and quick ratios most likely rests on the fact that these
two industries operate primarily on a cash basis. Their accounts receivable balances are going to be much lower than for the other two companies.
c. High level of debt can be maintained if the firm has a large, predictable, and steady cash flow. Utilities tend to meet these cash flow requirements. The software firm will have very uncertain and changing cash flow. The software industry is subject to greater competition resulting in more volatile cash flow.
d. Although the software industry has potentially high profits and investment return performance, it also has a large amount of uncertainty associated with the profits. Also, by placing all of the money in one stock, the benefits of reduced risk associated with diversification are lost.
P2-12. LG 3: Liquidity managementBasica.
2006 2007 2008 2009
Current ratio 1.88 1.74 1.79 1.55Quick ratio 1.22 1.19 1.24 1.14Net working capital $7,950 $9,300 $9,900 $9,600
b. The pattern indicates a deteriorating liquidity position. The decline is most pronounced for the current ratio which includes inventory.
c. The low inventory turnover suggests that liquidity is even worse than the declining liquidity measures indicate. Slow inventory turnover may indicate obsolete inventory.

Full file at http://testbank360.eu/solution-manual-principles-of-managerial-finance-brief-5th-edition-gitman
P2-13. LG 3: Personal finance: Liquidity ratio
a.
b. Since Josh’s liquidity ratio exceeds 1.8, Josh has more liquidity than his friends.
P2-14. LG 3: Inventory managementBasic
a. Sales $4,000,000 100%Less: Gross profit $1,600,000 40%Cost of goods sold $2,400,000 60%
b. The Wilkins Manufacturing inventory turnover ratio significantly exceeds the industry. Although this may represent efficient inventory management, it may also represent low inventory levels resulting in stockouts.
P2-15. LG 3: Accounts receivable managementBasica. Average collection period accounts receivable average sales per day
Since the average age of receivables is over 15 days beyond the net date, attention should be directed to accounts receivable management.
b. This may explain the lower turnover and higher average collection period. The December accounts receivable balance of $300,000 may not be a good measure of the average accounts receivable, thereby causing the calculated average collection period to be overstated. It also suggests the November figure (0–30 days overdue) is not a cause for great concern. However,13% of all accounts receivable (those arising in July, August and September) are sixty days or more overdue and may be a sign of poor receivables management.
33 Gitman • Principles of Managerial Finance, Brief Fifth Edition
P2-16. LG 4: Debt analysisBasic
Ratio Definition Calculation Creek Industry
Debt0.73 0.51
TimesInterest earned
3.00 7.30
FixedPaymentCoverage
{[(principal preferred stockDividends)] [1 (1 – t)]}
{[($800,000 $100,000)] [1 (1 – 0.4)]}
1.19 1.85
Because Creek Enterprises has a much higher degree of indebtedness and much lower abilityto service debt than the average firm in the industry, the loan should be rejected.
P2-17. LG 5: Common-size statement analysisIntermediate
Creek EnterprisesCommon-Size Income Statement
for the years Ended December 31, 2008 and 20092009 2008
Sales revenue 100.0% 100.0%Less: Cost of goods sold 70 .0% 65 .9% Gross profits 30.0% 34.1%Less: Operating expenses:
Selling 10.0% 12.7%General 6.0% 6.3%Lease expense 0.7% 0.6%Depreciation 3 .3% 20 .0% 3 .6% 23 .2%
Operating profits 10.0% 10.9%Less: Interest expense 3 .3% 1 .5% Net Profits before taxes 6.7% 9.4%Less: Taxes 2 .7% 3 .8% Net profits after taxes 4 .0% 5 .6%
Full file at http://testbank360.eu/solution-manual-principles-of-managerial-finance-brief-5th-edition-gitman
Sales have declined and cost of goods sold has increased as a percentage of sales, probably due to a loss of productive efficiency. Operating expenses have decreased as a percent of sales; this appears favorable unless this decline has contributed toward the fall in sales. The level of interest as a percentage of sales has increased significantly; this is verified by the high debt measures in Problem 15, and suggests that the firm has too much debt.
Further analysis should be directed at the increased cost of goods sold and the high debt level.
P2-18. LG 6: Ratio proficiencyBasic
a.
b.
c.
d.
e.
f.
g.
h.
P2-19. LG 6: Cross-sectional ratio analysisIntermediatea.
Fox Manufacturing CompanyRatio Analysis
Industry Average2009
Actual2009
Current ratio 2.35 1.84Quick ratio 0.87 0.75Inventory turnover 4.55 times 5.61 timesAverage collection period 35.8 days 20.5 daysTotal asset turnover 1.09 1.47Debt ratio 0.30 0.55
35 Gitman • Principles of Managerial Finance, Brief Fifth Edition
Times interest earned 12.3 8.0Gross profit margin 0.202 0.233Operating profit margin 0.135 0.133Net profit margin 0.091 0.072Return on total assets 0.099 0.105Return on common equity 0.167 0.234Earnings per share $3.10 $2.15
Liquidity: The current and quick ratios show a weaker position relative to the industry average.
Activity: All activity ratios indicate a faster turnover of assets compared to the industry. Further analysis is necessary to determine whether the firm is in a weaker or stronger position than the industry. A higher inventory turnover ratio may indicate low inventory, resulting in stockouts and lost sales. A shorter average collection period may indicate extremely efficient receivables management, an overly zealous credit department, or credit terms that prohibit growth in sales.
Debt: The firm uses more debt than the average firm, resulting in higher interest obligations that could reduce its ability to meet other financial obligations.
Profitability: The firm has a higher gross profit margin than the industry, indicating either a higher sales price or a lower cost of goods sold. The operating profit margin is in line with the industry, but the net profit margin is lower than industry, an indication that expenses other than cost of goods sold are higher than the industry. Most likely, the damaging factor is high interest expenses due to a greater than average amount of debt. The increased leverage, however, magnifies the return the owners receive, as evidenced by the superior ROE.
b. Fox Manufacturing Company needs improvement in its liquidity ratios and possibly a reduction in its total liabilities. The firm is more highly leveraged than the average firm in its industry and, therefore, has more financial risk. The profitability of the firm is lower than average but is enhanced by the use of debt in the capital structure, resulting in a superior ROE.
P2-20. LG 6: Financial statement analysisIntermediatea.
Zach IndustriesRatio Analysis
IndustryAverage
Actual2008
Actual2009
Current ratio 1.80 1.84 1.04Quick ratio 0.70 0.78 0.38Inventory turnover 2.50 2.59 2.33Average collection period 37.5 days 36.5 days 57 daysDebt ratio 65% 67% 61.3%Times interest earned 3.8 4.0 2.8Gross profit margin 38% 40% 34%Net profit margin 3.5% 3.6% 4.1%Return on total assets 4.0% 4.0% 4.4%

Full file at http://testbank360.eu/solution-manual-principles-of-managerial-finance-brief-5th-edition-gitman
Return on common equity 9.5% 8.0% 11.3%Market/book ratio 1.1 1.2 1.3
b. Liquidity: Zach Industries’ liquidity position has deteriorated from 2008 to 2009 and is inferior to the industry average. The firm may not be able to satisfy short-term obligations as they come due.
Activity: Zach Industries’ ability to convert assets into cash has deteriorated from 2008 to 2009. Examination into the cause of the 20.5-day increase in the average collection period is warranted. Inventory turnover has also decreased for the period under review and is fair compared to industry. The firm may be holding slightly excessive inventory.Debt: Zach Industries’ debt position has improved since 2008 and is below average. Zach Industries’ ability to service interest payments has deteriorated and is below the industry average.
Profitability: Although Zach Industries’ gross profit margin is below its industry average, indicating high cost of goods sold, the firm has a superior net profit margin in comparison to average. The firm has lower than average operating expenses. The firm has a superior return on investment and return on equity in comparison to the industry and shows an upward trend.
Market: Zach Industries’ increase in their market price relative to their book value per share indicates that the firm’s performance has been interpreted as more positive in 2009 than in 2008 and it is a little higher than the industry.
Overall, the firm maintains superior profitability at the risk of illiquidity. Investigation into the management of accounts receivable and inventory is warranted.
P2-21. LG 6: DuPont system of analysisIntermediatea.
Margin (%) Turnover ROA (%) FL Multiple ROE (%)2009Johnson 4.9 2.34 11.47 1.85 21.21Industry 4.1 2.15 8.82 1.64 14.462008Johnson 5.8 2.18 12.64 1.75 22.13Industry 4.7 2.13 10.01 1.69 16.922007Johnson 5.9 2.11 12.45 1.75 21.79Industry 5.4 2.05 11.07 1.67 18.49
b. Profitability: Industry net profit margins are decreasing; Johnson’s net profit margins have fallen less.
Efficiency: Both industry’s and Johnson’s asset turnover have increased.
Leverage: Only Johnson shows an increase in leverage from 2008 to 2009, while the industry has had less stability. Between 2007 and 2008, leverage for the industry increased, while it decreased between 2008 and 2009.As a result of these changes, the ROE has fallen for both Johnson and the industry, but Johnson has experienced a much smaller decline in its ROE.

37 Gitman • Principles of Managerial Finance, Brief Fifth Edition
c. Areas which require further analysis are profitability and debt. Since the total asset turnover is increasing and is superior to that of the industry, Johnson is generating an appropriate sales level for the given level of assets. But why is the net profit margin falling for both industry and Johnson? Has there been increased competition causing downward pressure on prices? Is the cost of raw materials, labor, or other expenses rising? A common-size income statement could be useful in determining the cause of the falling net profit margin.Note: Some management teams attempt to magnify returns through the use of leverage to offset declining margins. This strategy is effective only within a narrow range. A high leverage strategy may actually result in a decline in stock price due to the increased risk.

Full file at http://testbank360.eu/solution-manual-principles-of-managerial-finance-brief-5th-edition-gitman
P2-22. LG 1: Ethics problemIntermediateThis is a perfect example of a conflict of interest on the part of the auditor. In the past, there has been very little incentive to carefully scrutinize the company’s accounting or to challenge a company’s accounting assumptions. Why “bite the hand that feeds you”? Audit practices at Arthur Andersen, the firm that audited Enron and several other headline-grabbing companies, drove Andersen out of business. On their part, auditors claim to have been misled by corporate audit clients, and note that they are unable to check all accounting transactions in an audit engagement.
CaseAssessing Martin Manufacturing’s Current Financial PositionMartin Manufacturing Company is an integrative case study addressing financial analysis techniques. The company is a capital-intensive firm that has poor management of accounts receivable and inventory. The industry average inventory turnover can fluctuate from 10 to 100 depending on the market.
1. Ratio calculations
Financial Ratio 2009
Current ratio $1,531,181 $616,000 2.5%Quick ratio ($1,531,181 – $700,625) $616,000
1.3%Inventory turnover (times) $3,704,000 $700,625 5.3%Average collection period (days) $805,556 ($5,075,000 365) 58.0%Total asset turnover (times) $5,075,000 $3,125,000 1.6%Debt ratio $1,781,250 $3,125,000 57%Times interest earned $153,000 $93,000 1.6%Gross profit margin $1,371,000 $5,075,000 27%Net profit margin $36,000 $5,075,000 0.71%Return on total assets $36,000 $3,125,000 1.2%Return on equity $36,000 $1,343,750 2.7%
Historical RatiosMartin Manufacturing Company
RatioActual2007
Actual2008
Actual2009
IndustryAverage
Current ratio 1.7 1.8 2.5 1.5Quick ratio 1.0 0.9 1.3 1.2Inventory turnover (times) 5.2 5.0 5.3 10.2Average collection period (days) 50.7 55.8 58.0 46.0Total asset turnover (times) 1.5 1.5 1.6 2.0Debt ratio 45.8% 54.3% 57% 24.5%Times interest earned 2.2 1.9 1.6 2.5Gross profit margin 27.5% 28.0% 27.0% 26.0%Net profit margin 1.1% 1.0% 0.71% 1.2%Return on total assets 1.7% 1.5% 1.2% 2.4%Return on equity 3.1% 3.3% 2.7% 3.2%

39 Gitman • Principles of Managerial Finance, Brief Fifth Edition
Price/earnings ratio 33.5 38.7 34.48 43.4Market/book 1.0 1.1 0.89 1.2
2. Liquidity: The firm has sufficient current assets to cover current liabilities. The trend is upward and is much higher than the industry average. This is an unfavorable position, since it indicates too much inventory.
Activity: The inventory turnover is stable but much lower than the industry average. This indicates the firm is holding too much inventory. The average collection period is increasing and much higher than the industry average. These are both indicators of a problem in collecting payment.
The total asset turnover ratio is are stable but significantly lower than the industry average. This indicates that the sales volume is not sufficient for the amount of committed assets.
Debt: The debt ratio has increased and is substantially higher than the industry average. This places the company at high risk. Typically industries with heavy capital investment and higher operating risk try to minimize financial risk. Martin Manufacturing has positioned itself with both heavy operating and financial risk. The times-interest-earned ratio also indicates a potential debt service problem. The ratio is decreasing and is far below the industry average.
Profitability: The gross profit margin is stable and quite favorable when compared to the industry average. The net profit margin, however, is deteriorating and far below the industry average. When the gross profit margin is within expectations but the net profit margin is too low, high interest payments may be to blame. The high financial leverage has caused the low profitability.Market: The market price of the firm’s common stock shows weakness relative to both earnings and book value. This result indicates a belief by the market that Martin’s ability to earn future profits faces more and increasing uncertainty as perceived by the market.
3. Martin Manufacturing clearly has a problem with its inventory level, and sales are not at an appropriate level for its capital investment. As a consequence, the firm has acquired a substantial amount of debt which, due to the high interest payments associated with the large debt burden, is depressing profitability. These problems are being picked up by investors as shown in their weak market ratios.
Spreadsheet ExerciseThe answer to Chapter 2’s Dayton, Inc., financial statements spreadsheet problem is located in the Instructor’s Resource Center at www.prenhall.com/irc.
A Note on Web ExercisesA series of chapter-relevant assignments requiring Internet access can be found at the book’s Companion Website at http://www.prenhall.com/gitman. In the course of completing the assignments students access information about a firm, its industry, and the macro economy, and conduct analyses consistent with those found in each respective chapter.