glacial rebound and sea-level change in the british...
TRANSCRIPT

TEmARESEARCH
Glacial rebound and sea-level change in the British Isles
Kurt Lambeck Research School of Earth Sciences, The Australian National University, Canberra ACT 2601, Australia
ABSTRACT
Observations of sea levels around the coastline of the British Isles for the past 10,000-15,000 years exhibit a major regional variation and provide an important data base for testing models of glacial rebound as well as models of the Late Devensian ice sheet. A high-resolution rebound model has been developed which is consistent with both the spatial and temporal patterns of sea-level change and which demonstrates that the observations are the result of (i) the glacio- isostatic crustal rebound in response to the unloading of the ice sheet over Britain and, to a lesser degree, of the ice sheet over Fennoscandia, and (ii) the rise in sea-level from the melting Late Pleistocene ice sheets, including the response of the crust to the water loading (the hydro-isostatic effect). The agreement between model and observations is such that there is no need to invoke vertical crustal movements for Great Britain and Ireland of other than glacio-hydro- isostatic origin. The rebound contributions are important throughout the region and nowhere is it sufficiently small for the sea-level change to approximate the eustatic sea-level rise. The observational data distribution around the periphery as well as from sites near the centre of the former ice sheet is sufficient to permit constraints to be established on both earth model parameters specifying the mantle viscosity and lithospheric thickness and the extent and volume of the ice sheet at the time of the last glaciation. Preliminary solutions are presented which indicate an upper mantle viscosity of (3-5)1eoPa s, a lithospheric thickness of about 100 km or less, and an ice model that was not confluent with the Scandinavian ice sheet during the last glaciation and whose maximum thickness over Scotland is unlikely to have exceeded about 1500 m.
Terra Nova, 3,379-389
I NTRO D UCTl ON
Complex temporal and spatial patterns of sea-level change have been recorded throughout Great Britain and Ireland during Late Devensian and Holocene time and the observations illustrated in Fig. 1 are characteristic of this regional variability. This pattern has been qual- itatively understood in terms of the crustal rebound in response to the re- treat of the Late Devensian ice sheet over Britain and to the rise in sea-level resulting from the concomitant melting of distant major ice sheetsover northern
Europe, North America and Antarctica (e.g. Donner, 1970; Cullingford et al., 1981). The Scottish results, from sites near the centre of rebound, exhibit this spatial variability even within restricted areas such as the Forth, Tay, and Moray Firths of eastern Scotland and this is perhaps best illustrated by the shoreline gradient diagrams of Sissons (1983a) and others. The characteristic temporal patterns of the Scottish observations are the combined result of these two con- tributions: in Late Devensian time the glaao-isostatic rebound contribution
dominates over the rise in sea-level from the meltwater of the distant ice sheets, whereas in early Holocene time the contributions from the meltwater of the distant ice sheets begins to dom- inate. In the late Holocene time, after about 6000 yr BP, it is the crustal rebound that again is the dominant cause of sea- level change. Further away from the centre of rebound, in NW England (Fig. 2a), the balance between the two con- tributions is primarily in favour of the second contribution except in Latest De- vensian time when the rebound compo- nent dominates. The observations from sites in southern England (Fig. 2b-d) exhibit less spatial variability and the sea-level change here is controlled mainly, but not wholly, by the melt- water from the major ice sheets.
There has been little quantitative modelling of the rebound of Britain and the associated sea-level fluctuations, despite a number of geophysical, glaci- ological and geomorphological reasons for doing so. The rebound models can provide constraints on (i) the Earth's response to surface loading; (5) the ice sheet dimensions and the timing of the retreat of the ice sheets; and (iii) the ages of some of the erosional fea- tures, such as the rock platforms of western Scotland (e.g. Dawson, 1984) or the older elevated beaches of eastern and northeastern Scotland (e.g. Firth, 1989), where conventional dating methods have failed. Also, such model- ling is desirable in order to establish whether sea-level observations from different sites can be combined to form representative sea-level curves for a given region. This question, in particu- lar, is addressed in this paper.
The solution of the glacial rebound and sea-level problem for the Great Brit- ain region requires a knowledge of the Earths rheology (E) and of this history of the global ice sheets (I). This ice sheet includes the small but important British ice sheet ZB, as well as the more volumin- ous Fennoscandian ice sheet lF and
379

KURT LAMBECK
.lo
.a
Arnprlor Uppsr Farth Valley -
. * --_.,.
. ..._._.-
10 J 0
-LO ' J IS 10 J 0
a
Lochpll head Western &oUand .
-. .- -_. I
IS 10 J 0 C
Brldge d EPrn Firth of Tag .
'. .. ,- ,._, -10 IS 10 I 0
e
4 0 , . I
m :I 0
-10
Beaulg Flrlh Northeastern Scotland .
.___.--
Beaulg Flrlh Northeastern Scotland p . .
I ,
.___.-- I
Ardyne Firth of Clyde .
._._.--._
0 -.- I
. . .~
Fig. 1. Observed sea-level heights (with error bars where available, and reduced to mean sea-level) and predicted l m l s at a number of sites in Scotland. The predicted lml s are based on the Scotland rebound model (Table 1 ) and the dashed lines represent the range of values predicted by the upper and lower limits for the muntleviscosity. (See Fig. 5 for location map.) (a) Arnprior, upper Forth Valley. Thedataarefrom Sissonsand Brooks (1971); (b) BridgeofEarth, FirthofTay, nearPerth ineastern Scotland. Theobservations arefrom Cullingford et al. (2980) and Paterson et al. (7980)for the two oldest data points (c) Beauly Firth, northeastern Scotland. The data are from Firth and Haggart (2989) for the Holocene timeandfrom Firth (1989)for Late Devensian time; f d ) Lochgilphead, Loch Fyne, western Scotland. Data are from Peacock et a1.(1978); (e) Ardyne, Firth of Clyde, western Scotland. Data arefrom Pencock et a1 (2978); f f ) Northern shoreofthe Solway Firth, southwestern Scotland, between Dumfries and Kirkcudbright. Data are from Iardine (1982).
the far-field ice sheets 1-1 for Laurentia, Antarctica and the BarentsKara Seas region. In glaciological studies it has generally been assumed that E is known and ice models are constructed using a formulation relating the forces acting on and within the ice sheet and the ice rheology. In most geophysical studies it has been assumed that I is known and earth models are inferred from the sea- level observations. It may be asked
380
whether, in view of the uncertainties as- sociated with both the € and I models and with incomplete data sets for past positions of sea-level, it is indeed pos- sible to establish independent improve- ments on both the € and 1 model parameters as well as resolve some of the ambiguities in the observational data. Preliminary modelling of the re- bound of Great Britain has, how- ever, indicated that some separation
of the various parameters is possible here (Lambeck, 1991) and that, in con- sequence, the observation of sea-level change in the recent past can contribute to several areas of earth science.
FORM U LATl ON
The formulation of Nakada and Lam- beck (1987, 1989) is used and the sea- level equation is written as
Al(cp,A:t) = A&(t)+Ap(cp, A:t)
+Af(cp,A:t)+A{r-'(cp,A:t) (1)
A{(cp,A:t) is the position of mean sea- level at latitude Q, longitude A and at time t relative to the present position at the same location. The term A&(t) is the equivalent sea-level function (or eu- static sea-level) defined as
A&(t) = (change in uolume of meltwater)/ (surface area ofocenns)
It includes the time dependence of the totality of all ice sheets. The three re- maining terms on the right-hand-side of (1) include the contributions, for each of the three ice models I B , IF and f-f separately, from (i) the loading-unload- ing of the crust by the ice sheets, (ii) the loading-unloading of the crust by the meltwater deposited into or removed from the oceans, and (iii) the gravita- tional self-attraction of the water and ice that ensures that the ocean surface re- mains an equipotential surface at all times. These 'corrective terms' are func- tions of position and time. Their evalua- tion requires a knowledge of the ice models I(cp,A:t), of the earth model E, and of the mean geometry (which will itself be a function of time). The earth model parameters include the effective thickness of the lithosphere He as well as the effective viscosity of the mantle q, where 7 will be a function of earth radius. Furthermore, both He and qmay exhibit lateral variation.
The observation model is
where AS, = observed sea-level (re- duced to mean sea-level) at location (cp,A) and at time t; E~ = Observation

GLACIAL REBOUND AND SEA-LEVEL CHANGE
0
Moreearnbe Bay Norlhwest England
a 5 0
Thamea Estuary Southeast Eneland
* . 40t . / '
10 8 6 4 2 0 C time (x 1032 y u n BP)
10 , I
0
-10 .
-m .
Avonmoutb Upper Brlstol Channel
.XI .
40
b lo 0
10 .
0 ' 1
Fenland . East Anglla
10 8 6 4 2 0 d lime (x1ooO y u n BP)
Fig. 2. Sameas Fig. 1 but for sites in England. (a) Morecambe Bay, northwest England. Observations are from Tooley (1978); (b) Upper Bristol Channel, near Avonmouth and Weston-super-Mare. Observations are from Heyworth and Kidson (1982); Ic) Thames Estuary, southeast England, between London and as far east as Margate. (data are from Devoy, 1982); (d) Fenland, East Anglia. Data are from Shennan (1986).
error; A& = equivalent sea-level func- tion for the totality of the ice model used in evaluating the corrective terms; && = correction term to the equivalent sea-level function; = a constant scale parameter which is applied uniformly in space and time to the height of the British ice sheet model ZB; and @ = a similar scale parameter applied to the Fennoscandian ice sheet model IF.
The unknown parameters in (2) are (i) the function &&(t), (ii) the scale factors @ and F, and (iii) the earth model parameters Ht and q(r) contained within the functions Af.8, A f and A f t . The equation is non-linear in these latter parameters and a formal inverse solu- tion has not been attempted. Instead, the parameter estimation procedure used is to predict the sea-level change for a given earth model and to estimate the a&, @ and @ parameters that result in a minimum variance for that model. A search through the earth model space is then conducted to search for the over- all minimum variance. The model (2) implies that the extent and rate of re- treat of the ice models for Great Britain and Fennoscandia are well constrained by the observational data base and that
only the model-dependent ice heights are inadequately known. This is gener- ally a reasonable assumption over land but not where the ice sheet extends over the sea-floor. The use of the constant scale factors also implies that the factors controlling the ice height remain un- changed and this also may not be valid when the ice sheet retreats from the continental margins to land. However, as a first approximation model, these simpllfylng assumptions are adopted and any subsequent discrepancies be- tween observations and model predic- tions can be interpreted in terms of further ice sheet modifications.
THE INPUT MODELS
The earth model E . The following as- sumptions concerning € are made:
the model is radially symmetrical over the region examined, in this case Great Britain and north- western Europe. the response to surface loading is approximated by a linear visco- elastic Maxwell body with a realis- tic radial dependence of elastic parameters and density.
(iii) the lithosphere, of thickness Hp, is of high (165 Pa s) viscosity and overlies an upper mantle (extend- ing to a depth of 650 km) with a viscosity qvm and a lower mantle of viscosity qfm.
The earth model parameters are there- fore effective parameters only that de- scribe the average regional response of the Earth to surface loading on time scales of ld-lo4 years. The ice model 1. The major ice sheets in the northern hemisphere are the Laurentide and Fennoscandian ice sheets and the model of Peltier and Andrews (1976) has been adopted al- though it was been interpolated to give a 1" spatial resolution (the ARC3 model of Nakada and Lambeck, 1989). The British part of this model has been re- placed by a high-resolution (V.25 latitude by V.5 longitude) model based on a maximum reconstruction by Bod- ton et al. (1977) for the ice sheet at the time of maximum glaciation, and on the isochrones of ice retreat over Britain and surrounding areas given by Anderson (1981) (see Lambeck, 1991, Fig. 10). The maximum glaciation is assumed to have occurred at 23,OOO yr BP and the ice sheet at this time extended over the North Sea to be confluent with the Fennoscandian ice sheet consistent with the Boulton et al. model. The growth of the ice sheet is assumed to have started at 60,000 years ago with a brief phase of glacial condi- tions over Scotland. Ice free conditions are assumed to have existed during the subsequent Upton Warren Interstadial and the main phase of ice accumulation is assumed not to have started until after about 30 kyr BP. The adopted model is given by Lambeck (1991, Fig. 12) and is based on estimates of the timing of ice movements across the North Sea and the NW shelf of Scotland according to Eden et aJ. (1978). Trial cal- culations have also been camed out for a minimum ice model based on the minimum reconstruction by Boulton et al . (19aS) of the ice sheet at maximum glaciation. In this model the North Sea remained ice free throughout and the ice heights are sigruficantly reduced compared with the maximum model. The volume is only about 15% of that of the maximum model.
The distant, far-field ice sheet model Zf-r includes contributions from North
381

KURT LAMBECK
America, Antarctica and the Barents Kara Seas. The crustal adjustment con- tributions from unloading of these ice sheets is generally small in the Great Britain region and their principal con- tribution to the regional variation is from the water loading effect. Hence of primary interest is the equivalent sea- level function for these ice sheets and this has been constrained by the Late Pleistocene and Holocene sea-level ob- servations from sites far from all the major ice sheets (Nakada and Lambeck, 1988; Lambeck and Nakada, 1990).
All age estimates for the ice sheet growth and decay, as well as the age control for the sea-level change, refer to the conventional radiocarbon time-scale, and provided that this scale does not de- part in a significant non-linear way from the sidereal time-scale then the con- sistent use of the CI4 time scale is adequate. Coastline geometry. In order to evaluate the contributions to sea-level change from the deformation of the Earth in re- sponse to the meltwater loading, a high resolution for the coast line is required and a 0.15" definition has been adopted. The effect of the time dependence of this coastline, as sea-level rises, should also be taken into consideration (Lam- becket al., 1990), including the retreat of ice sheet margins over shallow sea- floor. These time dependency effects are functions of sea-level change itself and an iterative procedure is required.
AN INITIAL MODEL
Preliminary solutions of equation (2) have been obtained by examining the observational data in two steps. In the first, observations from sites in north-
western Europe have been used to es- timate the earth model parameters as well as Sgp and p' (Lambeck et al. , 1990) based on the low resolution ARC3 ice model for Fennoscandia and Great Brit- ain. The sea-level observations used are from sites either well within the interior of the former ice sheet at maximum extent (Angerman River in the Gulf of Bothnia), or outside the ice limits (Southend-on-Sea, Thames Es- tuary; Zuid Holland; and Le Havre), for which the sea-level response is strongly dependent on neither a detailed know- ledge of the Fennoscandian ice sheet margins nor on the detailed assump- tions about the spatial extent and vol- ume of the British ice sheet.
The two optimum solutions that satisfy this data set are summarized in Table 1. These models also predict sea- levels for sites nearer to the former ice sheets margins that are in general agree- ment with the observations (see Lam- beck et al., 1990, fig. 17), even though the adopted Fennoscandian ice model only approximately represents the dis- tribution and movement of ice in the vicinity of the sites. The resolution for the lower mantle viscosity is relatively poor, particularly as observations for only the past 8000 years have been used (see, for example, fig. 12 of Lambeck, 1990). The correction Sge to the equival- ent sea-level function (equation 2) for the past 6000 years is very similar to that obtained from the analysis of Late Holocene sea-levels in the Australian and Pacific regions (Nakada and Lam- beck, 1989; Lambeck and Nakada, 1990) and implies that a small amount of melt- water has continued to be added into the oceans during the past 6OOO years.
In the second step, observations from Scotland have been used to further
Table 1. Solutions for mantle parameters and the Fennoscandian ice model scale factor @'for models 2 and 3 from the northwestern Europe data (from Lambeck et al., 1990) and for the model deduced from the Scotland data (column 4). The @parameter for this model corresponds to the British ice sheet.
Model 2 Model 3 Scotland Model ~~
H t (km) 100 150 100
t),m(xldlPas) 4.752.3 3.4k0.9 10 t)um(xlOmPas) 3.550.3 3.8k0.3 (4k1)
B 0.89 0.95 0.70
refine both the earth model parameters and the model of the British ice sheet (Lambeck, 1991). The predicted sea- level variations at these sites are relat- ively insensitive to the ice sheet over Fennoscandia but they are strongly de- pendent on the extent and thickness of the Late Pleistocene ice over northern Britain. Because the horizontal dimen- sions of this ice sheet are small, the pre- dicted rebound is not sensitive to the lower mantle viscosity over the range from 10" to los Pa s and a value of ld2 Pa s has been adopted throughout. Other simplifications made are (i) the earth model parameter search has been restricted in the first instance to the upper mantle viscosity only with H e = 100 km, (ii) the correction term to the equivalent sea-level function de- rived in step 1 has been adopted, and (iii) the time-dependence of the ocean function has been ignored.
Table 1 includes the optimum solu- tion for this restricted solution and Fig. 1 compares the model predictions with some of the observations from Scotland that have been used to constrain the so- lution. These predictions illustrate the extreme sensitivity of the sea-level change to upper mantle viscosity and the potentially high resolution that can be obtained for this parameter provided that the ice models are well known. Comparisons between the model and observations at four English sites not used in the solution are illustrated in Fig. 2 and agreement is again satisfact- ory for at least the past 8000-9000 years of the observational record used here.
Some trade-off between the various parameters is possible but one consist- ent result is that the ice volume in the model IB needs to be significantly re- duced. A number of tests with modified ice sheets have been carried out. Ice sheet models in which the ice extended over the North Sea up to 18,000 years ago, as proposed by Denton and Hughes (1981) or Boulton et al. (1977) are ruled out because they predict a centre of rebound located over east- ern Scotland rather than over western Scotland, and because they predict shoreline gradients for the Forth, Tay and Moray Firths that are much less than observed. The model adopted here in which the ice retreat from the North Sea occurred earlier than 18,OOO years ago is also inadequate for modelling the
382
GLACIAL REBOUND A N D SEA-LEVEL CHANGE
gradients of the older shoreline features such as the Main Perth and East Fife shorelines (Lambeck, 1991). Even for models in which the maximum glacia- tion does not extend into the North Sea beyond the Wee Bankie Moraine near the entrance of the Firth of Forth, the predicted gradients are insufficient to match the observed gradients of the East Fife sequences and this suggests that a reduced lithospheric thickness may be appropriate and that 50 < He < 100 km. A characteristic result of all plausible solutions is that the thickness of the ice sheet at the time of maximum glaciation must be signific- antly reduced compared to the Denton and Hughes (1981) and Boulton et al. (1977) models; from 1800-2200 m to about 1200-1400 m for the maximum thickness, and this is largely consistent with recent inferences from trim lines in the Scottish Highlands and elsewhere that the higher peaks in Scotland, Outer Hebrides and Ireland stood out as nunataks during the last glacial maximum (e.g. Ballantyne, 1984; Peacock, 1980; Watts, 1977).
For the minimum ice model of Boul- ton et al. (1985) and the earth models in Table 1, the glacial rebound term is al- ways less than the global equivalent sea-level and the predicted sea-levels for the past 18,000 years have remained below the present level throughout the British Isles. For this model to match the observed sea-levels the corresponding @ scaling factor is of the order of 2-2.4 and the resulting optimum ice model is similar to that inferred above by starting with the maximum model of Boulton et al . (1977).
While there remains much scope for further improvement upon this prelim- inary rebound model, the agreement between observation and prediction is adequate for examining the spatial vari- ability of sea-level around the coast of Great Britain and for assessing to what extent regionally representative sea- level curves can be constructed.
SEA-LEVEL CHANGE AROUND THE COASTLINES OF GREAT BRITAIN AND IRELAND
England and Wales
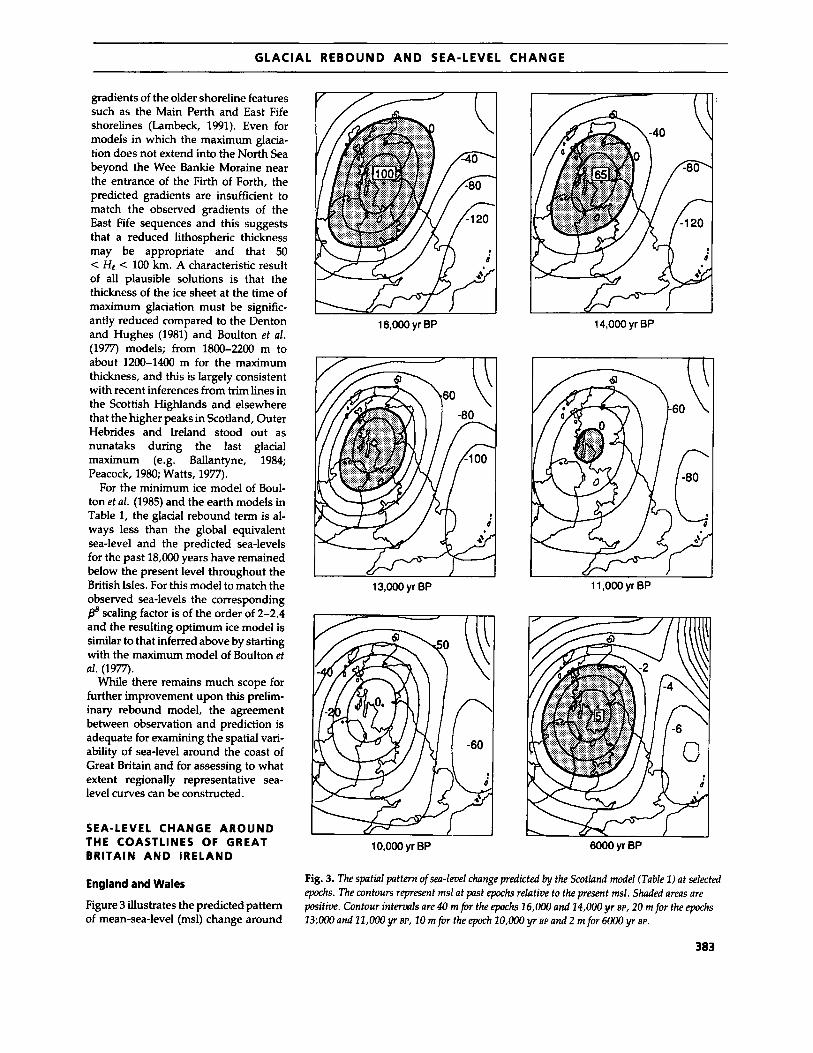
Figure 3 illustrates the predicted pattern of mean-sea-level (msl) change around
16,000 yr BP
13,000 yr BP
14,000 yr BP
10,000 yr BP 6000 yr BP
Fig. 3. The spatial pattern of sea-level change predicted by the Scotland model (Table 1) at selected epochs. The contours represent rnsl at past epochs relative to the present msl. Shaded areas are positive. Contour intervals are 40 m f ir the epochs 16,000 and 14,000 yr BP, 20 m for the epochs 13;000and 11,OOOyr BP, 10 m(or the epoch 10,OOOyr and 2 mfor 6000yr BP.
383

KURT LAMBECK
Britain and Ireland at several epochs after the initiation of deglaciation and expressed relative to the present msl and based on the Scotland model of Table 1. Positive heights (within the shaded areas) indicate past sea-levels that now lie above the present level and indicate the region in which raised shorelines can be expected to be found if such shorelines could have formed and been preserved. (Because shorelines form at levels above m.s.l., generally near mean-high-water-spring (MHWS) tide at 2-3 m above Ordnance Datum (OD) around much of the British coastline, the region in which raised beaches and shorelines can be expected to occur will be somewhat larger than the shaded areas illustrated here.) Negative heights indicate past sea- levels below the present msl. During the Lateglacial phase the areal extent of the zone of raised shorelines contracts rapidly from covering much of northern Britain at 16,000 yr BP to a stage at 10,000 yr BP where all former shorelines are near or below present sea-level. After 1o,O(Kl yr BP the extent of the uplift area again expands to reach a maximum at about 6000 yr BP before retreating back to the presents levels.
The predicted sea-level curves at sites around the coast of England are illus- trated in Fig. 4. In the northwest (Fig. 4a), from Maryport on the southern shore of the Solway Firth to Crosby near the Mersey River estuary (see Fig. 5 for locations), the characteristic sea-level curve is initially one of an apparent low- ering of sea-level as crustal rebound exceeds the eustatic rise. Any Late De- vensian raised shorelines could have formed only in a relatively short time in- terval between the ice retreat and the time that sea-levels dropped below the present level. Along the Southern shore of the Solway Firth, the ice retreat in the adopted model occurred by about 14,000-13,500 yr BP and if any raised beaches occur they would have formed between this time and about 12,000- 12,500 yr BP. Further south, near Morecambe Bay and Millom, any such raised shorelines would have formed between about 15,000 and 14,000 yr BP. In this interval the predicted maximum elevations of shorelinesalong the north- ern margins of Morecambe Bay are about 15-20 m compared with ob- served, but undated, marine erosion
384
features at 15-30 m above msl (e.g. Tooley, 1985). Several authors (e.g. Gale, 1985) have suggested that the Cumbria region may have been ice free earlier than assumed in the isochrone map of Andersen (1981) in which case the predicted maximum sea-levels will be higher than the above values. The period of falling sea-level is followed by
Northwest England
I 20 I J 10 5 0
Sl -
PmTalbM
1 -140 IS 10 S 0 c 2o
0
-20
Fenlrndr k Norfolk Cons1
.I40 I m IS 10 5 0
B umc ( x l M O y w B P )
a period of rising level from about 13,OOO-10,000 yr BP to about 6000 yr BP.
The maximum depths reached below present sea-level and the times at which these depths were attained are progress- ively greater in amplitude and earlier in time from’north to south and the time of occurrence of the minimum level is not synchronous along this section of the
.140 ’ I I 5 10 5 0 d m
I 20 1J 10 5 0
f
60
4 0 [ - \
-80 1 s e u ” H ” d ? -im
Northeast England 1 m I 5 10 5 0
umt (x IWO ycnn BP) h
Fig. 4. Predicted mean sea-level at sites around the coast of Great Britain and Ireland. The locations ofsites ure illustrated in Fig. 5 . The equivalent sea-leuel (esl ) function is given (c) and Id).

GLACIAL REBOUND A N D SEA-LEVEL CHANGE
coast. Only north of about Maryport, are sea-levels at 6000 yr BP predicted to lie above the present levels. A single sea-level curve for this region is clearly inappropriate and even within smaller regions such as Morecambe Bay the predicted spatial variation for the past 10,000 years between sites along the eastern shore and at the entrance to the bay and offshore is greater than the frequently quoted observational accuracies of past sea-level position.
The pattern of the spatial variation seen along the northwest coast con- tinues southwards for sites along the coast of Wales (Fig. 4b) and again no single representative sea-level curve can be constructed for areas such as Car- digan Bay. The predictions are consis- tent with the Holocene observations of Tooley (1982) along the southern shore of Liverpool Bay and North Wales and of Heyworth and Kidson (1982) from the Borth Bog area north of Aberystwyth as well as for the upper Bristol Channel (Fig. 2b). Along the Bristol Channel's southern shoreline and the north coast of Cornwall, the eustatic component be- comes increasingly dominant but the re- bound component continues to remain significant. In particular, the meltwater loading effect makes a significant con- tribution to the regional variability as the response changes from that of a nearly oceanic site for the scilly Isles to the effectively inland site for Arlingham on the Severn River. Only along the south coast of England, from the Scilly Isles to Margate (Fig. 4d and 4e), is the predicted sea-level curve nearly con- stant (for the period for which observa- tions exist) although different from the equivalent sea-level function, particu- larly during the past 10,OOO years (see Fig. 4d). Only here does it become per- missible to combine the observations from widely separated points into a single sea-level curve. Predicted sea- levels for the Thames Estuary and Essex coast to Hanvich are also similar to those predicted for the south coast within observational uncertainty, al- though the variability along the Thames Estuary itself is not unimportant. Ag- reement between observations and pre- dictions is satisfactory for both the Thames Estuary (Fig. 2c) and for the south coast sites examined by Devoy (1982) and Heyworth and Kidson (1 982).
A. Shetland 6. Orkney C. Caimness D. Cuter t i e h i i s E. Wester Rosa F. Jura 0. lslay H. Clyde Firth 1. Firth of Forth J. Firth OfTay K. SokayFlrth L. Cardigan Bay y. Brisrol Channel
N. THamesEstuary 0. Fenland P. Humber Est
a. DonegalBay R AnMm
Westward Ho /
Scilly , Isles
Fig. 5 . Location map of sites for which predicted sea-level curves are given in Figs 4 , 6 and 7.
Northwards in East Anglia, along the Norfolk Coast and the Fenlands, the in- fluence of crustal rebound once again becomes more significant and the maximum sea-levels attained at the glacial maximum are progressively reduced from south to north (Fig. 4g). Differmces between the Fenland (Pe- terborough, Skegness, Hunstanton) and Norfolk (Waveney, Cromer) sites gen- erally exceed plausible error estimates of the observed sea-levels and these re- gions should be treated separately in any sea-level study. Predictions for sites within the Fenlands do exhibit some re-
gional variations amounting to about 1 m at 6 kyr BP and about 5 m at 10 yr BP. The model predictions are consistent with the observations reported by Shen- nan (1986) for the Fenlands (Fig. 2d) and by Shennan (1987) and Devoy (1982) for Norfolk. Further to the north again, along the NE coast of England, from Skegness to the Scottish border, the pat- tern is once more one of rapid spatial variability similar to that observed in NW England. Even within restricted areas such as the Humber Estuary and adjacent lowlands, this variability can be significant for the past 10,000 years.
385

KURT LAMBECK
-10 - IS 10
Eastern Scotland Flrth of Forth .
-10 ’ IS 10 S 0
a
m I
Wester Roi l Pmln*c(Rou) k Outer Hebrldts
_: SL0mrm.y WW
Fl8Nl.n IS. -___.-- II) -
I S 10 S 0
C l im(x1WOyunBP)
I S 10 S b
M.
Pan 6 1 h (Islay)
Western Scotland (Jura Sound, Loch Fyne
& Flrth of Clyde)
IS 10 S d llme(x1WOycarrBP)
Fig. 6. Same as Fig. 4 but for sites in Scotland.
South of about Hartlepool, the sea- levels at 6OOO yr BP lie at sufficient depth for shorelines formed at MHWS tide to lie below present sea-level but to the north mid-Holocene shorelines are pre- dicted to occur at increasing height above present mean sea-level, largely consistent with the trends noted by Tooley (1978) and others.
Scotland
Many of the features of sea-level change in Eastern Scotland are exemplified by the predictions of the Firth of Forth and the upper Forth River valley (Fig. 6a). MHWS tides in this region presently occur at 2-3 rn above mean sea-level and the predicted heights of past shoreline features will lie above msl by this amount. A distinctive feature of the results is the highstand in late Holocene time, at a nominal age of about 6000 yr BP and corresponding to the Main Post- glacial ( M P g ) Shoreline of Sissons (1967). This highstand is predicted to occur progressively higher and earlier from east to west up the Forth estuary and valley and is generally consistent with observations. Another distinctive feature is the predicted relative low stand at about 9ooo-10,OOO yr BP cor- responding to the Main Lateglacial Shoreline (MLg) whose depth and time of occurrence also varies systematically
386
from east to west. Both the MPg and the MLg shorelines are, therefore, pre- dicted to be diachronous, even within restricted areas and this has indeed been suggested by the observational evidence in the Tay Firth and East Fife (e.g. Morrison et a l . , 1981). The pre- dicted gradients of the MLg and MPg shorelines along the southern margin of the Forth Firth and defined by the ex-
6 0 1 ’ .. 1
’:.- , lrcls .
treme levels attained, are 0.10 and 0.06 m km-’ respectively, compared with observed gradients of about 0.14 and 0.07 m km-’ along the same section. For a given ice model these gradients are less sensitive to viscosity than to litho- spheric thickness and the somewhat smaller predicted values suggest that a reduction in lithospheric thickness may be appropriate (see table 3 of Lambecket a!., 1990) although the possible trade-off with the ice model has not yet been fully explored (see Lambeck, 1990). Insofar as in these models the ice extended into the upper Forth Valley as recently as about 13,000 yr BP, no shoreline features higher than about 40 m above present sea-level are predicted to have been pre- served, consistent with the observed absence of higher marine features in the region (e.g. Sissons, 1981).
The sea-level predictions along the Firth of Tay and upper Tay River valley are very similar to those for the Forth valley. Further north (Fig. 6b), the pat- tern is similar to that for NW England. The highstand, corresponding to the MPg shoreline is predicted to occur as far north as the southern part of Caith- ness whereas in Orkney and Shetland sea-levels continue to rise up to the present levels from the time that the minimum levels were attained at 14,000-13,ooO yr BP. This is consistent with the occurrence in Shetland of sub-
i $.-
I W I5 10 S IS 10 5 0
a b
m IS 10 S 0 C timc(x1ooOycrnBP)
I IS 10 S 0
d w 1irne(x1000yearsBP)
Fig. 7. Same as Fig. 4 but for sites in Ireland.

GLACIAL REBOUND A N D SEA-LEVEL CHANGE
merged peats dated at 6700-6900 yr BP (Jardine, 1979) and with an absence of raised beaches (Sissons, 1967). The pre- dicted spatial variation across Orkney and Shetland is significant (compare the predictions for Sumburgh Head in southernmost Shetland with that for Muckle Flugga in the northernmost part of the island group) and no single rep- resentative sea-level curve can be estab- lished for the region. In Northwestem Scotland from Wester Ross to the Outer Hebrides, a similar regional pattern is predicted (Fig. 6c). The Holocene MPg shoreline is predicted to occur at a few metres above the present sea-level and somewhat lower than observed (Sissons and Dawson, 1981) but the predicted gradient of 0.05 m km-' agrees with the observed value. The prediction for the Outer Hebrides is consistent with an absence of a raised shoreline there 0. von Weymam, 1974, quoted in Dawson, 1984; Jardine 1977). Further south in Jura Sound, Loch Fyne and the Clyde Firth the MPg shoreline is predicted to exhibit very small gradients because of the nearness of these locations to the centre of rebound (see Fig. 3 and Fig. 6d).
The sea-level relative minimum at about 9O00-10,OOO yr BP in western Scot- land lies well above the present sea- level at heights that are largely consist- ent with the elevation of the Main Rock Platform of Gray (1974) which is be- lieved to have formed during the Loch Lomond Stadia1 (Sutherland, 1984; Dawson, 1984). The predicted levels of this relative minimum remain above present sea-level as far north as about Fort William, and are well below pres- ent sea-level in the Wester Ross region and this is consistent with an absence of this rock platform in northwestern Scot- land. Some of the undated shorelines identified by Dawson (1984), such as the L1 annd L2 shorelines, have steeper ob- served gradients than any Late Deven- sian gradients predicted by the model and this requires major modifications in the early decay of the ice sheet if these shorelines are indeed of Late Devensian age and not relics of older glacial events.
Ireland
The evidence for Late Devensian and Holocene sea-level change around the Irish coast is abundant yet mostly qual-
itative and few detailed time series are available for any locality. At best, the published sea-level curves are based on data brought together from different localities collected by different invest- igators and corresponding to indicators with different responses to changing levels (e.g. Carter, 1982). Nevertheless, despite these shortcomings the spatial variability of the sea-level curves has been recognized and qualitative re- gional patterns have been established (e.g. Carter et al., 1989; see also Devoy, 1983). Figure 7 illustrates the predicted sea-levels for a number of sites around the Irish coast.
North of a line drawn approximately through Donegal Bay in the west and Wicklow in the east, the sea-level curves are similar to those predicted for NW England and Northern Scotland. A late Holocene highstand is predicted to occur which reaches a maximum eleva- tion of about 7 m above its present level along the coast of Antrim (e.g. the Waterford result in Fig. 7d). The minimum sea-level during the Lategla- aal stage is well developed but the time of occurrence is not synchronous and ranges from about 9ooo to 14,000 yr BP. The spatial variation is significant throughout even for sites within 50 km of each other. Compare, for example, the predictions for Malin More with those for Donegal and Sligo (Fig. 7c), and even for a region such as Donegal Bay no representative sea-level curve exists. South of this line the predicted sea-level curves are similar to those for southern England but the regional vari- ation remains significant throughout as for the Southern Ireland predictions for Skibbereen, The Bull Light House and Mil town.
CONCLUSIONS
The considerable regional variation of sea-level change observed around the coast of Great Britain and Ireland is well represented as the combined effect of the rebound of the crust in response to the deglaciation of the Late Devensian ice sheet over the region and by the eu- static sea-level rise from the concomitant melting of the other ice sheets. Minor contributions to the variability come from the crustal rebound associated with the Fennoscandian ice sheet decay, and from the loading effect of the
sea-floor by the meltwater. Within and beyond the limits of the ice sheet the crustal rebound is the dominant con- tribution but nowhere is this so small that the predicted sea-level can be assumed to approximate the eustatic sea-level rise. Hence, the esl function cannot be inferred from the sea-level observations for the region, or from anywhere in Northwestern Europe, as sometimes claimed (Morner, 1980; Shennan, 1987), unless the additional contributory terms in Equation 2 are computed from the rebound model. Certainly, the sea-level predictions for the east coasts of England and Scotland, as well as for The Netherlands and Heligoland Bight (Lambeck et al., 1990) do not support Morner's argument that sea-level over the North Sea area re- sponds uniformly during the Holocene. A preliminary definition of the esl func- tion, Ale(t)+6(cb(t) (Equation 2), is given in Fig. 4c and d.
While several improvements can still be made, including further improve- ments in the modelling methods and in the model of the ice sheet for Great Britain, the generally good agreement between observations and predictions means that there is no need to invoke significant tectonic movements of the crust of other than glacial rebound ori- gin. If any such movements did occur they are likely to have been second- order effects.
The sea-level observations, particu- larly those for Scotland, rule out the ice models proposed by Denton and Hughes (1981) or Boulton et al. (197'7) in which the British ice sheet merged with the Fennoscandian ice sheet to form a thick ice sheet over the North Sea in Late Devensian time unless this oc- curred much earlier than assumed in these models. The ice thickness of these models over Britain also appears to be excessive and maximum values are un- likely to have exceeded 1500 m during the last glacial maximum. The minimum reconstruction of Boulton et al . (1985), however, contains insufficient ice and an intermediate model appears appro- priate. Ice models in which the ice sheet terminated at the Wee Bankie Moraine, off the east Scotland coastline, produce rebound results along the Forth and Tay Firths that are more consistent with the observations. The comparisons of the model and observed sea-levels in
387

KURT LAMBECK
western Scotland also suggest that these ice sheet models contain exces- sive amounts of ice over the western isles and continental shelf; consistent with geomorphological arguments by Sissons (1980), Peacock (1980) and others that the ice over the Outer Heb- rides at the time of the last glacial maximum was much less extensive than assumed.
REFERENCES
Andersen B.G. (1981) Late Weichselian ice sheets in Eurasia and Greenland. In: The last Great Ice Sheets (ed. by G.H. Denton and T.J. Hughes), pp. 1-65. Wiley, New York.
Ballantyne C.K. (1984) The Late Deven- sian Periglaciation of Upland Scotland,
Ballantyne C.K. and Gray J.M. (1984) The quaternary geomorphology of Scotland: The research contributions of J.B. Sis- sons, Quat. Sci. Rev., 3,259-289.
Boulton G.S., Jones A.S., Clayton K.M. and Kenning M.J. (1977) A British ice- sheet model and patterns of glacial ero- sion and deposition in Britain. In: British Quaternury Studies: Recent Advances (ed. by R.W. Shotton), pp. 231-246. Clarendon Press, Oxford.
Boulton G.S., Smith G.D., Jones A S . and Newsome J. (1985) Glacial geology and glaciology of the last mid-latitude ice sheets, 1. Geol. Soc. London, 142, 447- 474.
Carter R.W.G. (1982) Sea-level changes in Northern Ireland, Proc. Geol. Ass . , 93(1),
Carter R.W.G., Devoy R.J.N. and Shaw J. (1989) Late Holocene sea levels in Ire- land, 1. Quat. Sci., 4, 7-24.
Cullingford R.A., Caseldine C.J. and Gotts P.E. (1980) Early Flandrian land and sea-level changes in Lower Strath- earn, Nature, 13,159-161.
Dawson A.G. (1984) Quaternary sea-level changes in western Scotland, Quat. Sci. Rev., 3,345-368.
Denton G.H. and Hughes T.J. (eds) (1981) The Last Great Ice Sheets. Wiley, New York.
Devoy R.J. (1982) Analysis of the geo- logical evidence for Holocene sea-level movements in southeast England, Proc. Geol. Ass., 93, 65-90
Devoy R.J. (1983) Late Quaternary shorelines in Ireland: an assessment of their implications for isostatic land
Q m t . Sci. Rev., 3,311-343.
7-23.
388
movement and relative sea-level changes. In: Shorelines and Isostasy (ed. by D.E. Smith and A.G. Dawson), pp. 227-254. Academic Press, London.
Donner J.J. (1970) LandlSea Level Changes in Scotland. In: Studies in the Vegetational History of the British Isles (ed. by D. Walker and R.G. West), pp. 23-39. Cambridge University Press, Cambridge.
Eden R. A., Holmes R. and Fannin N.G.T. (1978) Depositional environment of offshore Quaternary deposits of the Continental Shelf around Scotland, Report 72/15 Inst. Geol. Sci. Edinburgh,
Firth C.R. (1989) Late Devensian raised shorelines and ice limits in the inner Moray Firth area, northern Scotland, Boreas, 18,5521.
Firth C.R. and Haggart B.A. (1989) Loch Lomond Stadia1 and Flandrian Shore- lines in the inner Moray Firth area, Scotland, 1. Quat. Sci., 4,37-59.
Gale S.J. (1985) The late- and post-glacial environmental history of the southern Cumbrian massif and its surrounding lowlands. In: The Geomorphology of Northwest England (ed. by R.H. Johnson), pp. 282-298. Manchester University Press, Manchester.
Gray J.M. (1974) Lateglacial and post glacial shorelines in western Scotland, Boreas, 3 129-138.
Heyworth A. and Kidson C. (1982) Sea- level changes in southwest England and Wales, Proc. Geol. Ass., 93,91-111.
Jardine W.G. (197'7) The Quaternary Marine record in southwest Scotland and the Scottish Hebrides, In: The Quaternary History of the Irish Sea (ed. by C. Kidson and M.J. Tooley). Geol. 1.
Jardine W.G. (1979) The western (United Kingdom) shore of the North Sea in Late Pleistocene and Holocene times. In: The Quaternary History ofthe North Sea (ed. by E. Oele, R.T.E. Shuttenhelm and A.J. Wiggers). Acta Univ. Symp. Univ. Ups. Annum Quinq. Cel., 2,159-174.
Jardine W.G. (1982) Sea-level changes in Scotland during the last 18,000 years. Proc. Geol. Ass., 93,25-41.
Lambeck K. (1990) Glacial rebound, sea- level change and mantle viscosity, Q. ]. R. astr. Soc., 21,1-30.
Lambeck K. (1991) A model for Devensian and Flandrian Glacial Rebound and Sea- Level Change in Scotland. In: Glacial Isotasy, Sea Level and Mantle Rheology (ed.
18 PP.
SPC. I S S U P , 7,99-118
by R. Sabadini, K. Lambeck and E. b s - chi), pp. 33-62. Kluwer, Dordrecht.
Lambeck K. and Nakada M.. (1990) Late Pleistocence and Holocene Sea-Level Change along the Australian Coast, Palueogeogr. Palueoclim. Palaeoecol. (Global and Planetary Change Section), 89, 143- 176.
Lambeck K., Johnston P. and Nakada M. (1990) Holocene glacial rebound and sea-level change in NW Europe, Geophys. 1. Int., 103,451-468.
Morner N.A. (1980) The northwest Euro- pean sea-level laboratory and regional Holocene eustasy, Palueogeogr. Palaeo- climatol. Palaeoecol., 29,281-300.
Momson J., Smith D.E., Cullingford R.A. and Jones R.L. (1981) The culmination of the main postglacial transgression in the Firth of Tay area, Scotland, Proc.
Nakada M. and Lambeck K. (1987) Glacial rebound and relative sealevel vari- ations: A new appraisal, Geophys. 1. R. astr. Soc., 90,171-224.
Nakada M. and Lambeck K. (1988) The melting history of the Late Pleistocene Antarctic ice sheet, Nature, 333,3640.
Nakada M. and Lambeck K. (1989) Late Pleistocene and Holocene sea-level change in the Australian region and mantle rheology, Geophys. I., %, 497- 517.
Paterson I.B., Armstrong M. and Browne M.A.E. (1981) Quaternary estuarine de- posits in the Tay-Earn areas, Scotland, Report 8117, Inst. Geol. Sci. London.
Peacock J.D. (1980) Glaciation of the Outer Hebrides: A reply, Scott. 1. Geol., 16,
Peacock J.D., Graham D.K. and Wilkinson J.P. (1978) Late glacial and post-glacial marine environments at Ardyne, Scot- land, and their significance in the in- terpretations of the history of the Clyde sea, area, Report 78/12, Inst. G w l . Sci. London, 1-25.
Peltier W.R. and Andrews J.T. (1976) Gla- cial isostatic adjustment - I: The for- ward problem, Geophys. ]., 46,605-646.
Shennan I. (1986) Flandrian sea-level changes in the Fenland, 11: Tendencies of sea-level movement, altitudinal changes, and local and regional factors, 1. Quat. Sci., 1,155-179.
Shennan I. (1987) Holocene sea-level changes in the North Sea region. In: Sea- level Changes (ed. by J. Tooley and l. Shennan), pp. 109-151. Blackwell Sci- entific Publications, Oxford.
Ged. ASS., 92(3), 197-209.
87-89.

GLACIAL REBOUND AND SEA-LEVEL CHANGE
Sissons J.B. (1967) The Evolution of Scot- land’s Scenery, Oliver and Boyd, Edin- burgh, 259 pp.
Sissons J.B. (1980) The glaciation of the Outer Hebrides, Scot. 1. Geol., 16, 881-884.
Sissons J.B. (1981) The last Scottish ice sheet facts and speculative discussion, Boreas, 10, 1-17.
Sissons J.B. (1983a) Shorelines and isotasy in Scotland. In: Shorelines and lsostasy (ed. by D.E. Smith and A.G. Dawson), pp. 209-225. Academic Press, London.
Sissons J.B. (1983b) The Quaternary geomorphology of the Inner Hebrides: a
review and reassessment, Proc. Geol.
Sissons J.B. and Brooks C.L. (1971) Dating of Early Postglacial Land and Sea Level Changes in the Western Forth Valley, Nature Phys. Sci., 234,124-127.
Sissons J.B. and Dawson A.G. (1981) Former sea-levels and ice limits in part of Wester Ross, northwest Scotland, Proc. Gal . A s s . , 92,115-124.
Sutherland D.G. (1984) The quaternary deposits and landforms of Scotland and the neighbouring shelves: a review, Quat. Sci. Rev., 3,157-254.
Tooley M.J. (1978) Sea-level Change in
ASS., 94,165-175. North-west England During the Flandrian Stage. Clarendon Press, Oxford.
Tooley M.J. (1982) Sea-level changes in northern England, Proc. Geol. Ass.,
Tooley M.J. (1985) Sea-level changes and coastal morphology in north-west Eng- land. In: The Geomorphology of North- west England (ed. by R.H. Johnson), pp. 94-121. Manchester University Press, Manchester .
Watts W.A. (1977) The Late Devensian vegetation of Ireland, Phil. Trans. R . Soc.
93(1), 43-51.
h n d . , 8280,273-293.
389