glenn hegar texas comptroller of public accounts biennial · texas comptroller of public accounts....
TRANSCRIPT
Glenn Hegar Texas Comptroller of Public Accounts
Biennial Property Tax Report
Tax Years 2016 and 2017Texas Property Tax
Glenn Hegar Texas Comptroller of Public Accounts
Comptroller.Texas.Gov
P.O. Box 13528
Austin, Texas 78711-3528
512-463-4444
Toll Free: 1-800-531-5441 ext: 3-4444
Fax: 512-463-4902
December 2018
The Honorable Greg Abbott, GovernorThe Honorable Dan Patrick, Lieutenant GovernorThe Honorable Joe Straus, Speaker of the HouseMembers of the 85th Legislature
Ladies and Gentlemen:
We are pleased to present the Biennial Property Tax Report for 2016 and 2017, as required by Tax Code Section 5.09. The report provides tax rate and value information for tax years 2016 and 2017.
We are committed to assisting taxpayers, appraisal districts, appraisal review boards, tax assessor-collectors and elected officials with property tax administration. This report is designed to provide data that is both useful and informative.
If you need further explanation of the findings or more extensive data and analysis, please contact Korry Castillo, Property Tax Assistance Division Director, at [email protected] or 512-463-3806.
Sincerely,
Glenn Hegar
cc: Korry Castillo
Biennial Property Tax Report – Tax Years 2016 and 2017 — i
Table of Contents
Overview . . . . . . . . . . . . . . . . . . . . . . . . . . . . . . . . . . . . . . . . . . . . . . . 1Local Property Tax. . . . . . . . . . . . . . . . . . . . . . . . . . . . . . . . . . . . . . . . . . . . . . . . . 2
Appraisal District Operations . . . . . . . . . . . . . . . . . . . . . . . . . . . . . . . . . . . . . . . . . . 2
Local Property Values . . . . . . . . . . . . . . . . . . . . . . . . . . . . . . . . . . . . . . . 4Property Classifications . . . . . . . . . . . . . . . . . . . . . . . . . . . . . . . . . . . . . . . . . . . . . 4
Market and Taxable Values . . . . . . . . . . . . . . . . . . . . . . . . . . . . . . . . . . . . . . . . . . . 4
Tax Rates and Levies by County . . . . . . . . . . . . . . . . . . . . . . . . . . . . . . . . . 6Local Property Tax Levies . . . . . . . . . . . . . . . . . . . . . . . . . . . . . . . . . . . . . . . . . . . . 6
Tax Rates and Levies by County . . . . . . . . . . . . . . . . . . . . . . . . . . . . . . . . . . . . . . . . 8
Keeping Check on Local Property Tax Increases . . . . . . . . . . . . . . . . . . . . . . . . . . . . . . 8
ii — Biennial Property Tax Report – Tax Years 2016 and 2017
Biennial Property Tax Report – Tax Years 2016 and 2017 — 1
Texas Property Tax
OverviewThe Tax Code directs the Comptroller’s office to publish a biennial report of the appraised and taxable values of properties by category and the tax rates of counties, cities and school districts for a two-year period. This report provides the governor, the lieutenant governor and each member of the Legislature a single point of reference for appraised values, tax-able values and tax levies and rates of Texas taxing units.1 The complete market and tax-able values and tax rates for all school dis-tricts, counties and cities data is available on our Property Tax Survey Data and Reports webpage.
The data for this report, including total market and taxable values and tax rates for all school districts, counties and cit-ies, is available in downloadable electronic spreadsheets on our Tax Rates and Levies webpage.
Texas cities, counties, school districts and other taxing units rely on property tax to fund their operations. In addition to property tax, taxing units may also impose, levy and collect other taxes and fees as authorized by law.
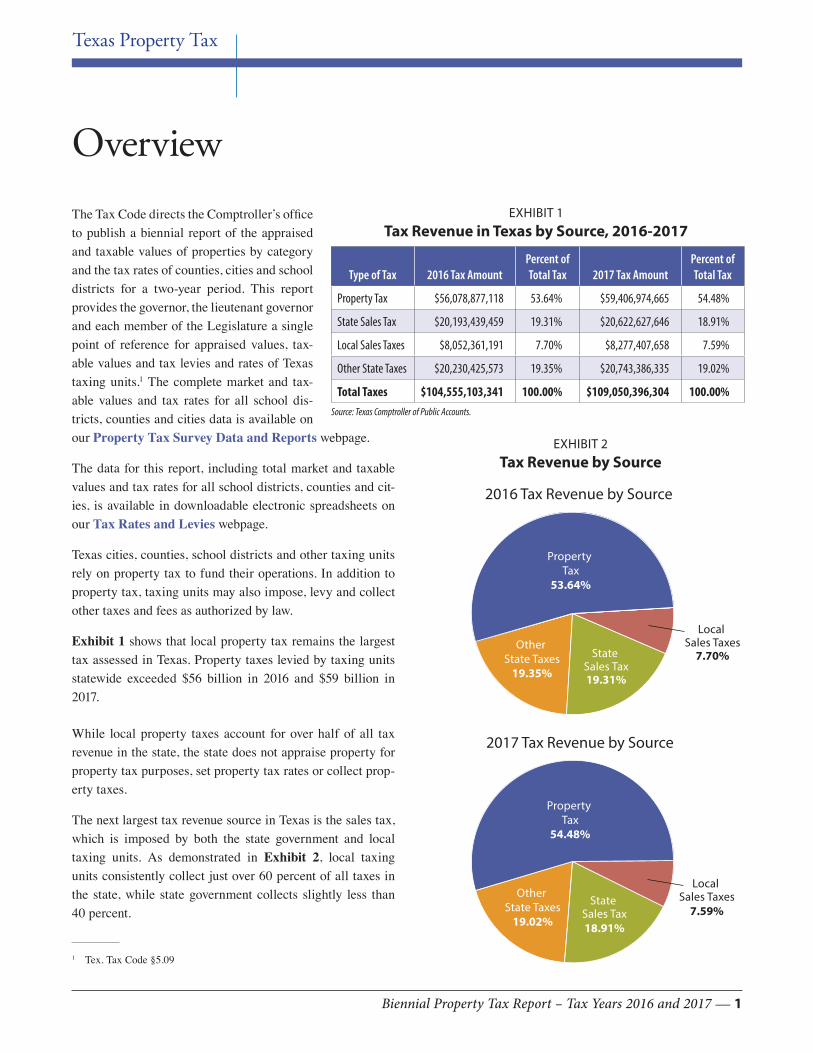
Exhibit 1 shows that local property tax remains the largest tax assessed in Texas. Property taxes levied by taxing units statewide exceeded $56 billion in 2016 and $59 billion in 2017.
While local property taxes account for over half of all tax revenue in the state, the state does not appraise property for property tax purposes, set property tax rates or collect prop-erty taxes.
The next largest tax revenue source in Texas is the sales tax, which is imposed by both the state government and local taxing units. As demonstrated in Exhibit 2, local taxing units consistently collect just over 60 percent of all taxes in the state, while state government collects slightly less than 40 percent.
EXHIBIT 1Tax Revenue in Texas by Source, 2016-2017
Type of Tax 2016 Tax AmountPercent of Total Tax 2017 Tax Amount
Percent of Total Tax
Property Tax $56,078,877,118 53.64% $59,406,974,665 54.48%
State Sales Tax $20,193,439,459 19.31% $20,622,627,646 18.91%
Local Sales Taxes $8,052,361,191 7.70% $8,277,407,658 7.59%
Other State Taxes $20,230,425,573 19.35% $20,743,386,335 19.02%
Total Taxes $104,555,103,341 100.00% $109,050,396,304 100.00%Source: Texas Comptroller of Public Accounts.
1 Tex. Tax Code §5.09
EXHIBIT 2Tax Revenue by Source
2016 Tax Revenue by Source
2017 Tax Revenue by Source
Property Tax
53.64%
Local Sales Taxes
7.70%Other
State Taxes19.35%
State Sales Tax19.31%
Property Tax
54.48%
Other State Taxes
19.02%
State Sales Tax18.91%
Local Sales Taxes
7.59%

2 — Biennial Property Tax Report – Tax Years 2016 and 2017
Local Property TaxThe Texas Constitution sets out five basic rules for property taxes.
The first requirement is that taxation must be equal and uni-form.2 Local officials must base property taxes on values de-termined by appraisal districts.
Second, property must be assessed at no more than fair cash market value – the price for which it would sell when both buyer and seller seek the best price and neither is under pres-sure to buy or sell.3 Except as provided by the Texas Consti-tution, all real and tangible personal property shall be taxed in proportion to its value, which shall be ascertained as pro-vided by law.4 The Texas Constitution provides certain excep-tions to this rule, such as the use of productivity values for agricultural and timber land.
Third, each property in a county must have a single appraised value.5 This means that the various taxing units that collect property taxes cannot assign different values to the same property – all must use the same value.
Fourth, all property is taxable unless federal or state law exempts it from the tax. These ex-emptions may exclude all or part of a property’s value from taxation.6
Finally, property owners have a right to reason-able notice of increases in the appraised value of their property.7
Taxing units can assess and collect property taxes for two primary uses. First, they can col-lect a maintenance and operations (M&O) tax that is used primarily to pay for the day-to-day functions of the government. An interest and sinking (I&S) tax is collected to pay bonds, in-cluding interest, to finance capital projects such as buildings, facilities or other infrastructure. While I&S property taxes are not the only way for taxing units to pay for infrastructure, it is one of the primary tools available for this purpose.
2 Tex. Const. art. VIII, §1(a)3 Tex. Const. art. VIII, §204 Tex. Const. art. VIII, §1(b)5 Tex. Const. art. VIII, §186 Tex. Const. art. VIII, §1(b)7 Tex. Const. art. VIII, §21(c)
Appraisal District OperationsBefore the Legislature created appraisal districts in 1981, thousands of taxing units appraised property and imposed taxes independently, resulting in wide disparities in value. As property tax levies increased and the state began to base more aid to school districts on property values, centralized local appraisal became necessary.
Each year, the Comptroller’s office surveys the state’s 253 ap-praisal districts for information about their operations.8 They provide historical data from the prior tax year and projected data based on budgets and plans for the current tax year. In 2016, 96 percent of the appraisal districts responded to the survey and 99 percent responded in 2017.
The wide range of responses reported in the annual survey reflect the diversity among appraisal districts. Exhibit 3 shows a huge variance in staffing, with about 40 percent of the appraisal districts reporting less than five staff members.
Appraisal districts report a wide range in the amount budget resources available. Many appraisal districts also do collec-tions functions, reportedly 109 districts in 2016 and 2017.
8 Although Texas has 254 counties, Potter and Randall counties operate a consolidated appraisal district.
5 or less 6 to 10 11 to 20 21 to 50 51 to 100 Over 1000
20
40
60
80
100
120
2016 2017
EXHIBIT 3Full Time Employees (FTEs), 2016-2017
Biennial Property Tax Report – Tax Years 2016 and 2017 — 3
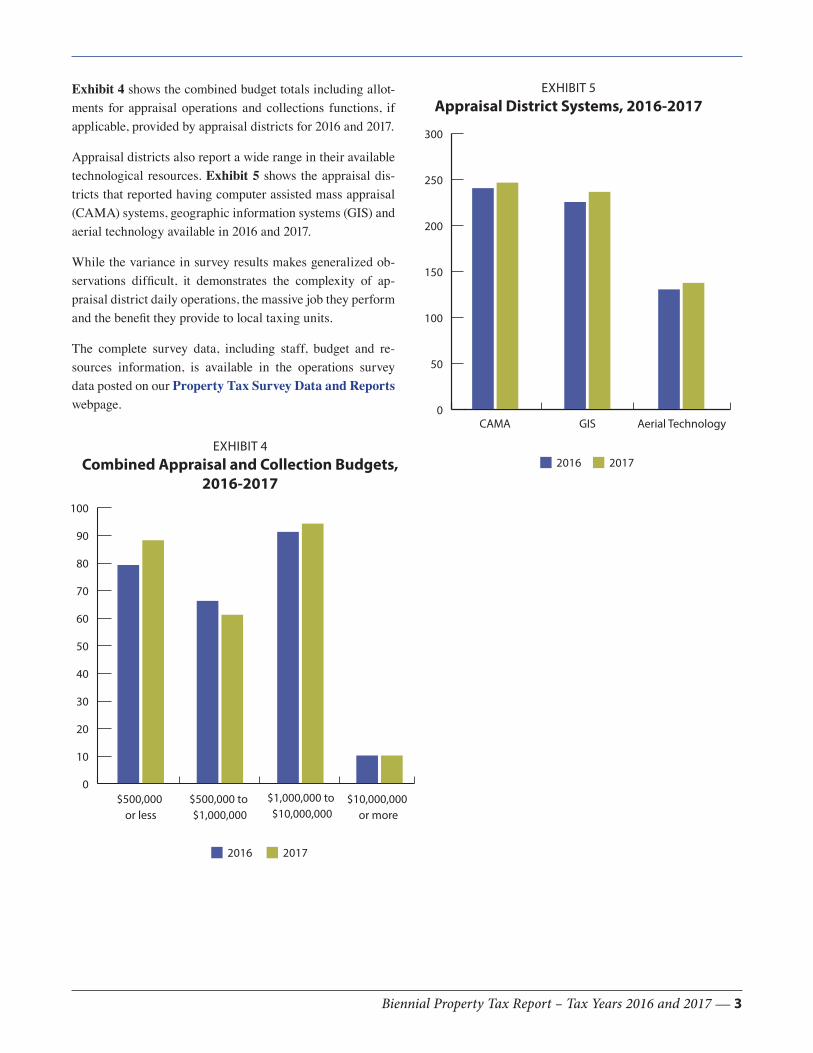
Exhibit 4 shows the combined budget totals including allot-ments for appraisal operations and collections functions, if applicable, provided by appraisal districts for 2016 and 2017.
Appraisal districts also report a wide range in their available technological resources. Exhibit 5 shows the appraisal dis-tricts that reported having computer assisted mass appraisal (CAMA) systems, geographic information systems (GIS) and aerial technology available in 2016 and 2017.
While the variance in survey results makes generalized ob-servations difficult, it demonstrates the complexity of ap-praisal district daily operations, the massive job they perform and the benefit they provide to local taxing units.
The complete survey data, including staff, budget and re-sources information, is available in the operations survey data posted on our Property Tax Survey Data and Reports webpage.
EXHIBIT 5Appraisal District Systems, 2016-2017
EXHIBIT 4Combined Appraisal and Collection Budgets,
2016-2017
$500,000 or less
$500,000 to $1,000,000
0
10
20
30
40
50
60
70
80
90
100
$1,000,000 to $10,000,000
$10,000,000 or more
2016 2017
CAMA GIS0
50
100
150
200
250
300
Aerial Technology
2016 2017

4 — Biennial Property Tax Report – Tax Years 2016 and 2017
Texas Property Tax
Local Property Valuescalculating taxable value by category, the Comptroller’s of-fice uses data submitted by appraisal districts to determine the allocation.
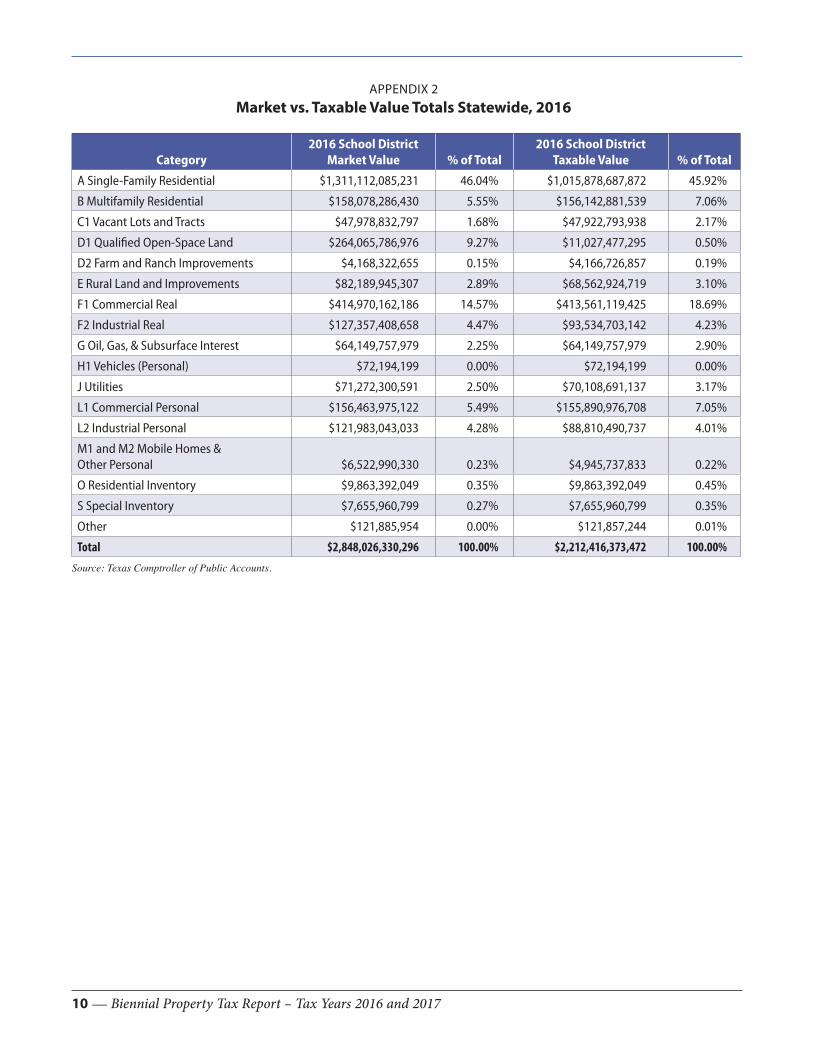
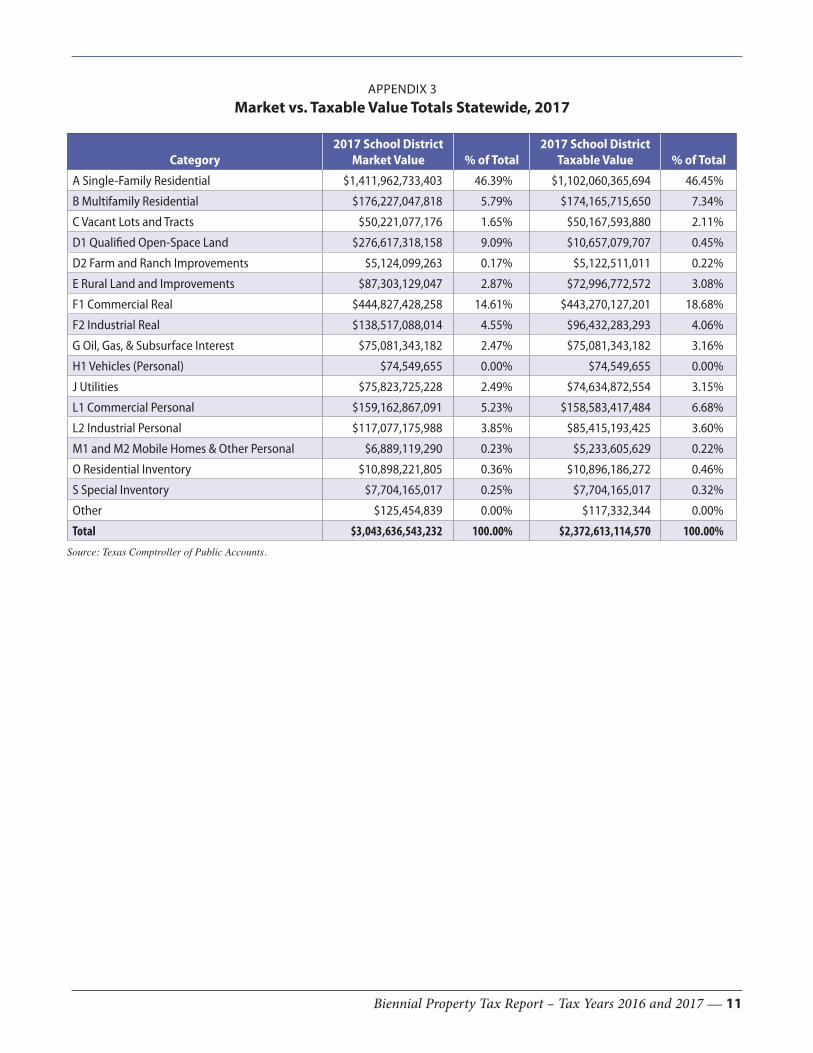
Appraisal districts reported that the 2016 market value of tax-able property in school districts statewide was over $2.8 tril-lion (Appendix 2) and the 2016 taxable value was over $2.2 trillion, a difference of over $635 billion. In 2017, appraisal districts reported that the market value of taxable property in school districts statewide was over $3 trillion (Appendix 3) and the 2017 taxable value was over $2.3 trillion, a difference of more than $671 billion. Exhibit 6 shows an increase in both market and taxable value from 2016 to 2017.
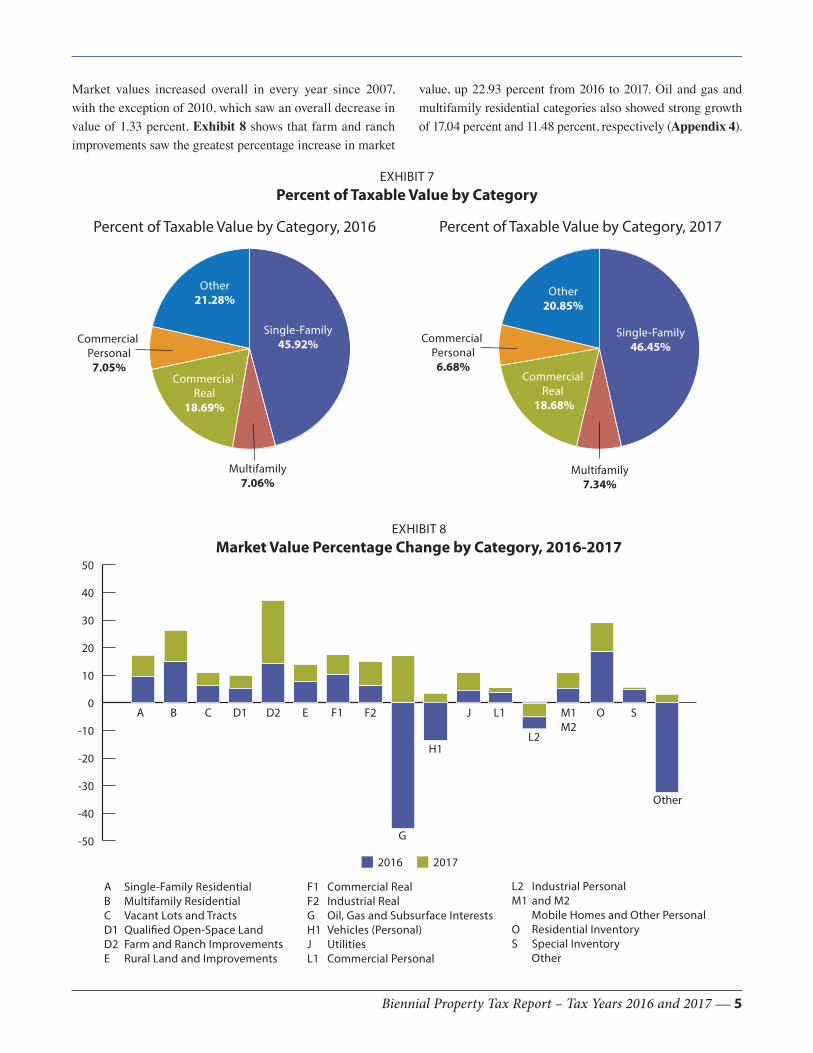
Exhibit 7 shows that single-family residential made up around 46 percent of the total taxable value with commercial real property just under 18.7 percent of the total in both 2016 and 2017.
The biennial report must include the total appraised values and taxable values of property by category for two years pre-ceding the report year.
With a few exceptions, the appraised value of property is based on an appraiser’s opinion regarding a property’s mar-ket value as of a certain date. Generally, the Tax Code defines appraised value as market value as of Jan. 1.9 Appraised value means the value as determined by Tax Code Chapter 23.10
Taxable value means the amount determined by deduct-ing from appraised value the amount of any applicable exemptions.11
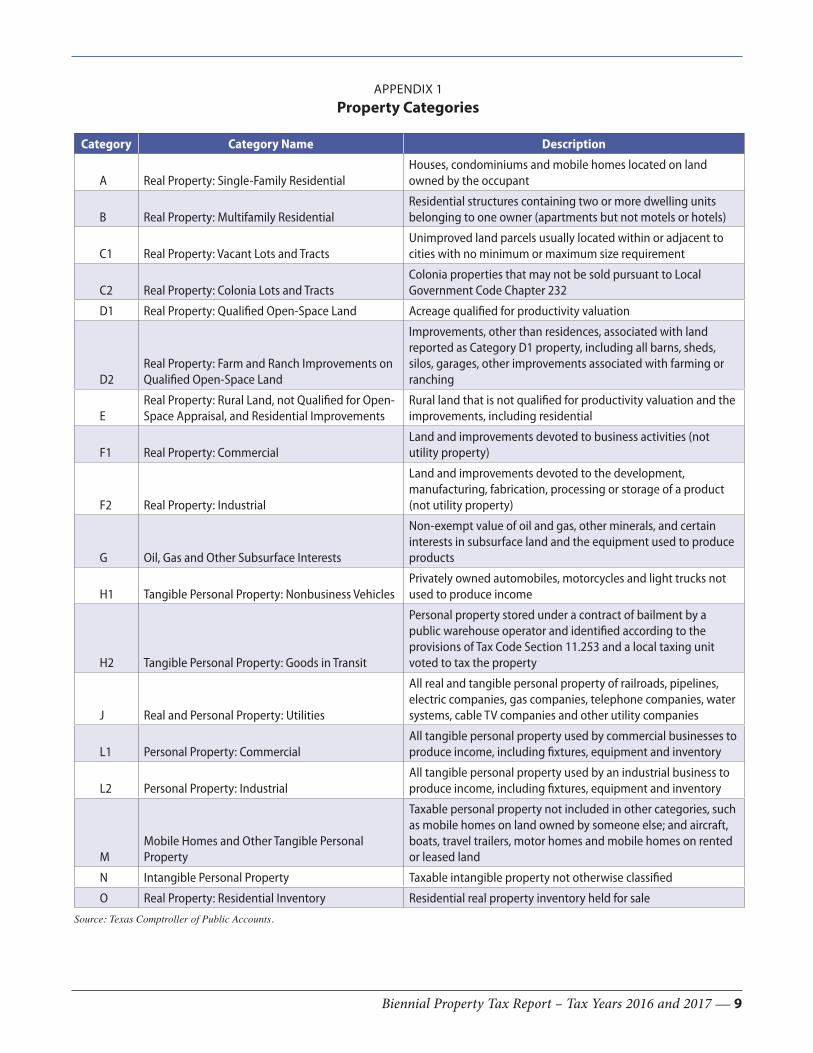
Property ClassificationsAt least once every two years, the Comptroller’s office must conduct a ratio study in each appraisal district to determine the degree of uniformity of and the median level of appraisals by the appraisal district within each major category of prop-erty.12 Pursuant to this requirement, the Comptroller’s office develops the Property Classification Guide with categories described in Appendix 1. When reporting information to the Comptroller’s office, appraisal districts are required to use the broad property classification categories, such as single-family residential, multifamily residential, commercial real, etc., as listed and defined in the guide.
Market and Taxable ValuesMarket value as defined by Tax Code Section 1.04(7) is the price a property would sell for in the current market between a knowledgeable buyer and seller each trying to maximize gain and neither in a position to take advantage of the other. Taxable value accounts for any special appraisal provisions, value limitation agreements and applicable exemptions. In
9 Tex. Tax Code §§1.04(8) and 23.01 and the International Association of Assessing Officers, Property Appraisal and Assessment Administration, edited by Joseph K. Eckert, Ph.D. (Chicago, Illinois, 1990), p. 15.
10 Tex. Tax Code §1.04(8)11 Tex. Tax Code §1.04(10)12 Tex. Tax Code §5.10(a)
EXHIBIT 6Market Value and Taxable Value, 2016-2017
Market Value0
500
1,000
1,500
2,000
2,500
3,000
$3,500
Taxable Value
2016 2017
Biennial Property Tax Report – Tax Years 2016 and 2017 — 5
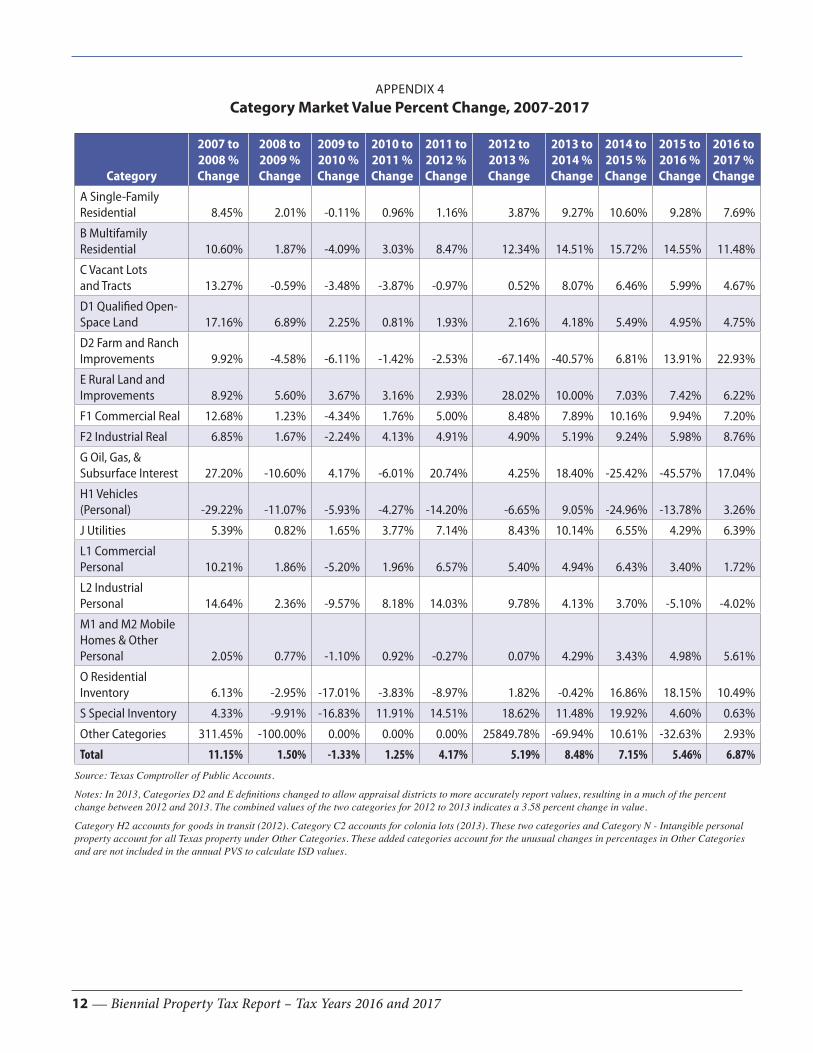
Market values increased overall in every year since 2007, with the exception of 2010, which saw an overall decrease in value of 1.33 percent. Exhibit 8 shows that farm and ranch improvements saw the greatest percentage increase in market
EXHIBIT 7Percent of Taxable Value by Category
Percent of Taxable Value by Category, 2016 Percent of Taxable Value by Category, 2017
Commercial Personal
7.05%
Multifamily7.06%
Other21.28%
Single-Family45.92%
Commercial Real
18.69%
Single-Family46.45%
Commercial Real
18.68%
Other20.85%
Commercial Personal
6.68%
Multifamily7.34%
value, up 22.93 percent from 2016 to 2017. Oil and gas and multifamily residential categories also showed strong growth of 17.04 percent and 11.48 percent, respectively (Appendix 4).
EXHIBIT 8Market Value Percentage Change by Category, 2016-2017
-50
-40
-30
-20
-10
0
10
20
30
40
50
BA C D1 D2 E F1 F2
H1
J L1
L2
M1M2
O S
Other
G
A Single-Family ResidentialB Multifamily ResidentialC Vacant Lots and TractsD1 Qualified Open-Space LandD2 Farm and Ranch ImprovementsE Rural Land and Improvements
L2 Industrial PersonalM1 and M2 Mobile Homes and Other PersonalO Residential InventoryS Special Inventory Other
2016 2017
F1 Commercial RealF2 Industrial RealG Oil, Gas and Subsurface InterestsH1 Vehicles (Personal)J UtilitiesL1 Commercial Personal
6 — Biennial Property Tax Report – Tax Years 2016 and 2017
Texas Property Tax
Tax Rates and Levies by CountyIn addition to the required tax rates for counties, cities and school districts, this report includes online data on property tax rates and levies for special purpose districts.
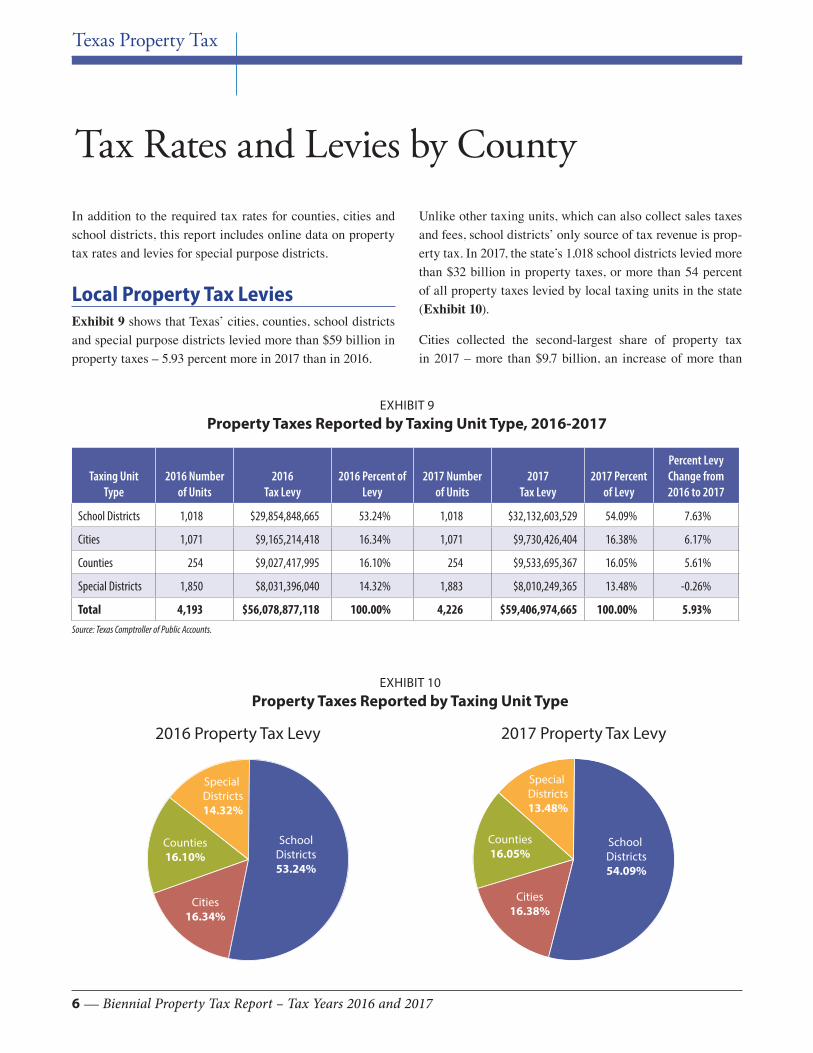
Local Property Tax LeviesExhibit 9 shows that Texas’ cities, counties, school districts and special purpose districts levied more than $59 billion in property taxes – 5.93 percent more in 2017 than in 2016.
Unlike other taxing units, which can also collect sales taxes and fees, school districts’ only source of tax revenue is prop-erty tax. In 2017, the state’s 1,018 school districts levied more than $32 billion in property taxes, or more than 54 percent of all property taxes levied by local taxing units in the state (Exhibit 10).
Cities collected the second-largest share of property tax in 2017 – more than $9.7 billion, an increase of more than
EXHIBIT 9Property Taxes Reported by Taxing Unit Type, 2016-2017
Taxing Unit Type
2016 Number of Units
2016 Tax Levy
2016 Percent of Levy
2017 Number of Units
2017 Tax Levy
2017 Percent of Levy
Percent Levy Change from 2016 to 2017
School Districts 1,018 $29,854,848,665 53.24% 1,018 $32,132,603,529 54.09% 7.63%
Cities 1,071 $9,165,214,418 16.34% 1,071 $9,730,426,404 16.38% 6.17%
Counties 254 $9,027,417,995 16.10% 254 $9,533,695,367 16.05% 5.61%
Special Districts 1,850 $8,031,396,040 14.32% 1,883 $8,010,249,365 13.48% -0.26%
Total 4,193 $56,078,877,118 100.00% 4,226 $59,406,974,665 100.00% 5.93%Source: Texas Comptroller of Public Accounts.
EXHIBIT 10Property Taxes Reported by Taxing Unit Type
2016 Property Tax Levy 2017 Property Tax Levy
SchoolDistricts53.24%
Cities16.34%
Special Districts14.32%
Counties16.10%
School Districts54.09%
Cities16.38%
Special Districts13.48%
Counties16.05%
Biennial Property Tax Report – Tax Years 2016 and 2017 — 7
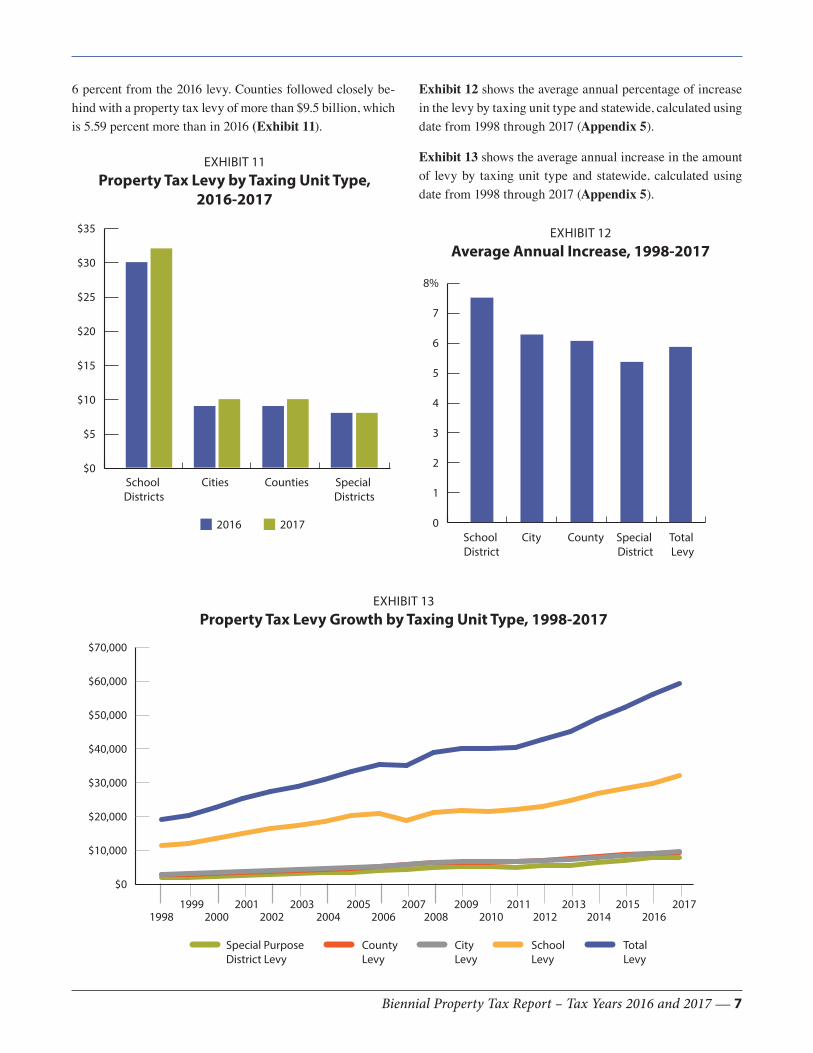
6 percent from the 2016 levy. Counties followed closely be-hind with a property tax levy of more than $9.5 billion, which is 5.59 percent more than in 2016 (Exhibit 11).
EXHIBIT 11Property Tax Levy by Taxing Unit Type,
2016-2017
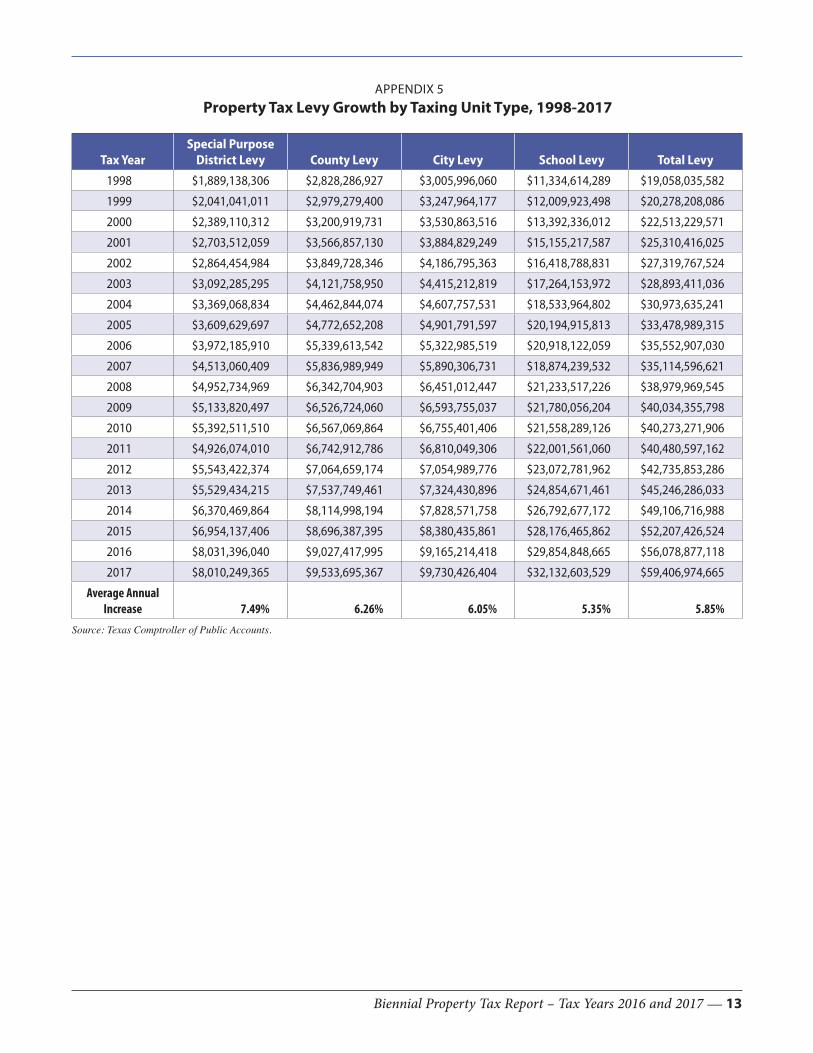
Exhibit 12 shows the average annual percentage of increase in the levy by taxing unit type and statewide, calculated using date from 1998 through 2017 (Appendix 5).
Exhibit 13 shows the average annual increase in the amount of levy by taxing unit type and statewide, calculated using date from 1998 through 2017 (Appendix 5).
EXHIBIT 12Average Annual Increase, 1998-2017
School Districts
Cities$0
$5
$10
$15
$20
$25
$30
$35
Counties Special Districts
2016 2017School District
City0
1
2
3
4
5
6
7
8%
County Special District
Total Levy
$0
$10,000
$20,000
$30,000
$40,000
$50,000
$60,000
$70,000
Special Purpose District Levy
County Levy
Total Levy
City Levy
School Levy
19981999
20002001
20022003
20042005
20062007
20082009
20102011
20122013
20142015
20162017
EXHIBIT 13Property Tax Levy Growth by Taxing Unit Type, 1998-2017

8 — Biennial Property Tax Report – Tax Years 2016 and 2017
For information about levy growth for cities, counties, school districts and special purpose districts, see Appendix 5.
Tax Rates and Levies by CountyTax rates and levies for taxing units within each county are accessible on the Comptroller’s Tax Rates and Levies webpage.
Keeping Check on Local Property Tax IncreasesTaxpayers have a mechanism to limit the tax rate that a tax-ing unit may adopt. If taxing units, other than school districts, adopt tax rates above a calculated rollback tax rate, taxpayers can petition for a rollback election.
A school district exceeding the rollback tax rate must hold an election automatically without any need for a petition pro-cess, known as a tax rate ratification election. This allows its voters to decide whether to approve the adopted tax rate or to roll back the tax rate.
A school district that adopts a tax rate above the rollback tax rate must hold a rollback election between 30 and 90 days after its board of trustees adopts the tax rate. The school dis-trict’s election differs from that of other taxing units in that the school district must ask voters to ratify the school dis-trict’s adopted tax rate. If a simple majority of votes cast in the election favors the adopted tax rate, it stands. If the voters disapprove the adopted tax rate, the school district’s rollback tax rate becomes the adopted tax rate.
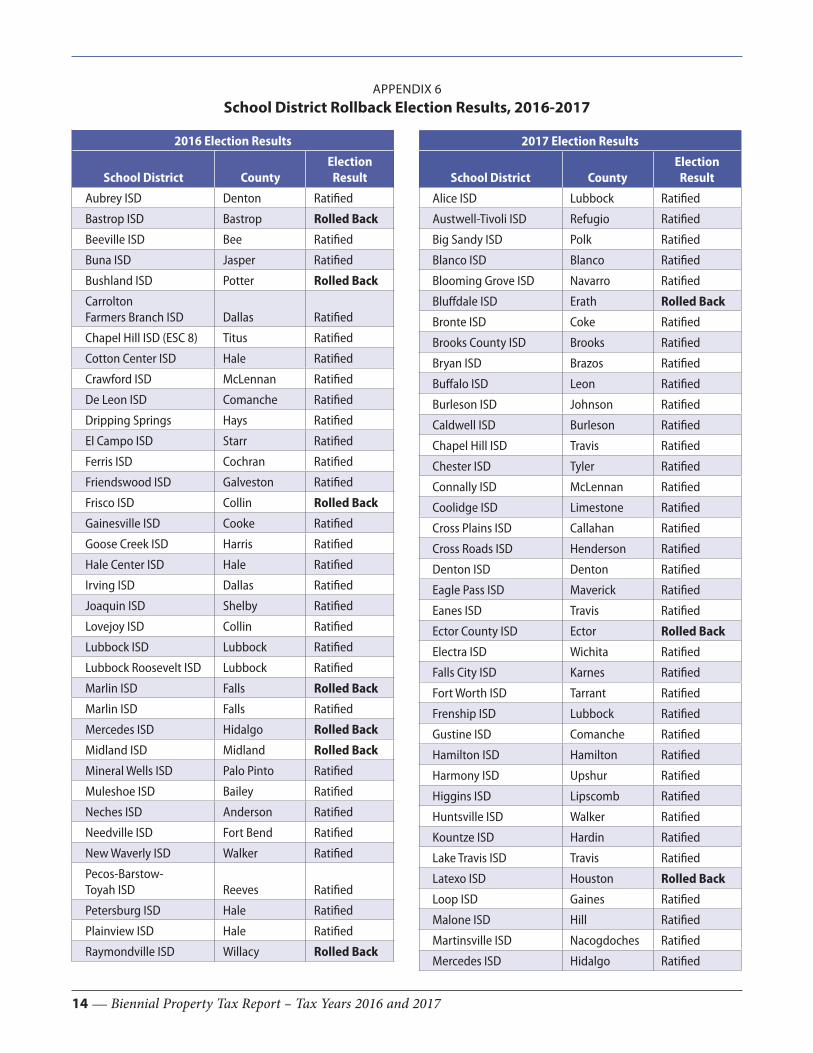
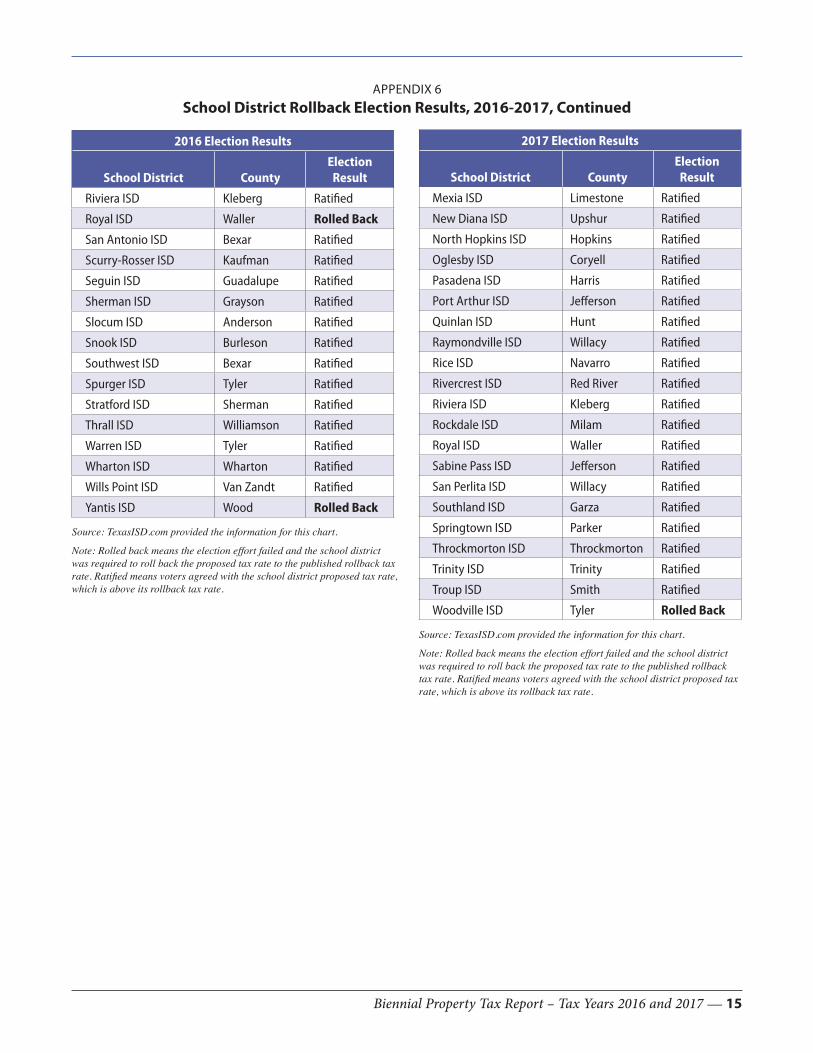
In 2016, 52 school districts exceeded the rollback tax rate, compared with 59 in 2017. As seen in Exhibit 14, a signifi-cant number of the elections on tax rate increases passed in
2016 and 2017. Voters in nine school districts rejected the tax rate proposed by school boards in 2016, and in 2017, four elections rejected proposed tax rate increases (Appendix 6).
We hope you find this report useful. If you need further ex-planation of the findings or more extensive data and analysis, please contact the Property Tax Assistance Division at [email protected].
EXHIBIT 14Tax Rate Ratification Elections,
2016-2017
2016 2017
Rejected Ratified
0
10
20
30
40
50
60
70
Biennial Property Tax Report – Tax Years 2016 and 2017 — 9
APPENDIX 1Property Categories
Category Category Name Description
A Real Property: Single-Family ResidentialHouses, condominiums and mobile homes located on land owned by the occupant
B Real Property: Multifamily ResidentialResidential structures containing two or more dwelling units belonging to one owner (apartments but not motels or hotels)
C1 Real Property: Vacant Lots and TractsUnimproved land parcels usually located within or adjacent to cities with no minimum or maximum size requirement
C2 Real Property: Colonia Lots and TractsColonia properties that may not be sold pursuant to Local Government Code Chapter 232
D1 Real Property: Qualified Open-Space Land Acreage qualified for productivity valuation
D2Real Property: Farm and Ranch Improvements on Qualified Open-Space Land
Improvements, other than residences, associated with land reported as Category D1 property, including all barns, sheds, silos, garages, other improvements associated with farming or ranching
EReal Property: Rural Land, not Qualified for Open-Space Appraisal, and Residential Improvements
Rural land that is not qualified for productivity valuation and the improvements, including residential
F1 Real Property: CommercialLand and improvements devoted to business activities (not utility property)
F2 Real Property: Industrial
Land and improvements devoted to the development, manufacturing, fabrication, processing or storage of a product (not utility property)
G Oil, Gas and Other Subsurface Interests
Non-exempt value of oil and gas, other minerals, and certain interests in subsurface land and the equipment used to produce products
H1 Tangible Personal Property: Nonbusiness VehiclesPrivately owned automobiles, motorcycles and light trucks not used to produce income
H2 Tangible Personal Property: Goods in Transit
Personal property stored under a contract of bailment by a public warehouse operator and identified according to the provisions of Tax Code Section 11.253 and a local taxing unit voted to tax the property
J Real and Personal Property: Utilities
All real and tangible personal property of railroads, pipelines, electric companies, gas companies, telephone companies, water systems, cable TV companies and other utility companies
L1 Personal Property: CommercialAll tangible personal property used by commercial businesses to produce income, including fixtures, equipment and inventory
L2 Personal Property: IndustrialAll tangible personal property used by an industrial business to produce income, including fixtures, equipment and inventory
MMobile Homes and Other Tangible Personal Property
Taxable personal property not included in other categories, such as mobile homes on land owned by someone else; and aircraft, boats, travel trailers, motor homes and mobile homes on rented or leased land
N Intangible Personal Property Taxable intangible property not otherwise classified
O Real Property: Residential Inventory Residential real property inventory held for sale
Source: Texas Comptroller of Public Accounts.
10 — Biennial Property Tax Report – Tax Years 2016 and 2017
APPENDIX 2Market vs. Taxable Value Totals Statewide, 2016
Category2016 School District
Market Value % of Total2016 School District
Taxable Value % of Total
A Single-Family Residential $1,311,112,085,231 46.04% $1,015,878,687,872 45.92%
B Multifamily Residential $158,078,286,430 5.55% $156,142,881,539 7.06%
C1 Vacant Lots and Tracts $47,978,832,797 1.68% $47,922,793,938 2.17%
D1 Qualified Open-Space Land $264,065,786,976 9.27% $11,027,477,295 0.50%
D2 Farm and Ranch Improvements $4,168,322,655 0.15% $4,166,726,857 0.19%
E Rural Land and Improvements $82,189,945,307 2.89% $68,562,924,719 3.10%
F1 Commercial Real $414,970,162,186 14.57% $413,561,119,425 18.69%
F2 Industrial Real $127,357,408,658 4.47% $93,534,703,142 4.23%
G Oil, Gas, & Subsurface Interest $64,149,757,979 2.25% $64,149,757,979 2.90%
H1 Vehicles (Personal) $72,194,199 0.00% $72,194,199 0.00%
J Utilities $71,272,300,591 2.50% $70,108,691,137 3.17%
L1 Commercial Personal $156,463,975,122 5.49% $155,890,976,708 7.05%
L2 Industrial Personal $121,983,043,033 4.28% $88,810,490,737 4.01%
M1 and M2 Mobile Homes & Other Personal $6,522,990,330 0.23% $4,945,737,833 0.22%
O Residential Inventory $9,863,392,049 0.35% $9,863,392,049 0.45%
S Special Inventory $7,655,960,799 0.27% $7,655,960,799 0.35%
Other $121,885,954 0.00% $121,857,244 0.01%
Total $2,848,026,330,296 100.00% $2,212,416,373,472 100.00%
Source: Texas Comptroller of Public Accounts.
Biennial Property Tax Report – Tax Years 2016 and 2017 — 11
APPENDIX 3Market vs. Taxable Value Totals Statewide, 2017
Category2017 School District
Market Value % of Total2017 School District
Taxable Value % of Total
A Single-Family Residential $1,411,962,733,403 46.39% $1,102,060,365,694 46.45%
B Multifamily Residential $176,227,047,818 5.79% $174,165,715,650 7.34%
C Vacant Lots and Tracts $50,221,077,176 1.65% $50,167,593,880 2.11%
D1 Qualified Open-Space Land $276,617,318,158 9.09% $10,657,079,707 0.45%
D2 Farm and Ranch Improvements $5,124,099,263 0.17% $5,122,511,011 0.22%
E Rural Land and Improvements $87,303,129,047 2.87% $72,996,772,572 3.08%
F1 Commercial Real $444,827,428,258 14.61% $443,270,127,201 18.68%
F2 Industrial Real $138,517,088,014 4.55% $96,432,283,293 4.06%
G Oil, Gas, & Subsurface Interest $75,081,343,182 2.47% $75,081,343,182 3.16%
H1 Vehicles (Personal) $74,549,655 0.00% $74,549,655 0.00%
J Utilities $75,823,725,228 2.49% $74,634,872,554 3.15%
L1 Commercial Personal $159,162,867,091 5.23% $158,583,417,484 6.68%
L2 Industrial Personal $117,077,175,988 3.85% $85,415,193,425 3.60%
M1 and M2 Mobile Homes & Other Personal $6,889,119,290 0.23% $5,233,605,629 0.22%
O Residential Inventory $10,898,221,805 0.36% $10,896,186,272 0.46%
S Special Inventory $7,704,165,017 0.25% $7,704,165,017 0.32%
Other $125,454,839 0.00% $117,332,344 0.00%
Total $3,043,636,543,232 100.00% $2,372,613,114,570 100.00%
Source: Texas Comptroller of Public Accounts.
12 — Biennial Property Tax Report – Tax Years 2016 and 2017
APPENDIX 4Category Market Value Percent Change, 2007-2017
Category
2007 to 2008 % Change
2008 to 2009 % Change
2009 to 2010 % Change
2010 to 2011 % Change
2011 to 2012 % Change
2012 to 2013 % Change
2013 to 2014 % Change
2014 to 2015 % Change
2015 to 2016 % Change
2016 to 2017 % Change
A Single-Family Residential 8.45% 2.01% -0.11% 0.96% 1.16% 3.87% 9.27% 10.60% 9.28% 7.69%
B Multifamily Residential 10.60% 1.87% -4.09% 3.03% 8.47% 12.34% 14.51% 15.72% 14.55% 11.48%
C Vacant Lots and Tracts 13.27% -0.59% -3.48% -3.87% -0.97% 0.52% 8.07% 6.46% 5.99% 4.67%
D1 Qualified Open-Space Land 17.16% 6.89% 2.25% 0.81% 1.93% 2.16% 4.18% 5.49% 4.95% 4.75%
D2 Farm and Ranch Improvements 9.92% -4.58% -6.11% -1.42% -2.53% -67.14% -40.57% 6.81% 13.91% 22.93%
E Rural Land and Improvements 8.92% 5.60% 3.67% 3.16% 2.93% 28.02% 10.00% 7.03% 7.42% 6.22%
F1 Commercial Real 12.68% 1.23% -4.34% 1.76% 5.00% 8.48% 7.89% 10.16% 9.94% 7.20%
F2 Industrial Real 6.85% 1.67% -2.24% 4.13% 4.91% 4.90% 5.19% 9.24% 5.98% 8.76%
G Oil, Gas, & Subsurface Interest 27.20% -10.60% 4.17% -6.01% 20.74% 4.25% 18.40% -25.42% -45.57% 17.04%
H1 Vehicles (Personal) -29.22% -11.07% -5.93% -4.27% -14.20% -6.65% 9.05% -24.96% -13.78% 3.26%
J Utilities 5.39% 0.82% 1.65% 3.77% 7.14% 8.43% 10.14% 6.55% 4.29% 6.39%
L1 Commercial Personal 10.21% 1.86% -5.20% 1.96% 6.57% 5.40% 4.94% 6.43% 3.40% 1.72%
L2 Industrial Personal 14.64% 2.36% -9.57% 8.18% 14.03% 9.78% 4.13% 3.70% -5.10% -4.02%
M1 and M2 Mobile Homes & Other Personal 2.05% 0.77% -1.10% 0.92% -0.27% 0.07% 4.29% 3.43% 4.98% 5.61%
O Residential Inventory 6.13% -2.95% -17.01% -3.83% -8.97% 1.82% -0.42% 16.86% 18.15% 10.49%
S Special Inventory 4.33% -9.91% -16.83% 11.91% 14.51% 18.62% 11.48% 19.92% 4.60% 0.63%
Other Categories 311.45% -100.00% 0.00% 0.00% 0.00% 25849.78% -69.94% 10.61% -32.63% 2.93%
Total 11.15% 1.50% -1.33% 1.25% 4.17% 5.19% 8.48% 7.15% 5.46% 6.87%
Source: Texas Comptroller of Public Accounts.
Notes: In 2013, Categories D2 and E definitions changed to allow appraisal districts to more accurately report values, resulting in a much of the percent change between 2012 and 2013. The combined values of the two categories for 2012 to 2013 indicates a 3.58 percent change in value.
Category H2 accounts for goods in transit (2012). Category C2 accounts for colonia lots (2013). These two categories and Category N - Intangible personal property account for all Texas property under Other Categories. These added categories account for the unusual changes in percentages in Other Categories and are not included in the annual PVS to calculate ISD values.
Biennial Property Tax Report – Tax Years 2016 and 2017 — 13
APPENDIX 5Property Tax Levy Growth by Taxing Unit Type, 1998-2017
Tax YearSpecial Purpose
District Levy County Levy City Levy School Levy Total Levy
1998 $1,889,138,306 $2,828,286,927 $3,005,996,060 $11,334,614,289 $19,058,035,582
1999 $2,041,041,011 $2,979,279,400 $3,247,964,177 $12,009,923,498 $20,278,208,086
2000 $2,389,110,312 $3,200,919,731 $3,530,863,516 $13,392,336,012 $22,513,229,571
2001 $2,703,512,059 $3,566,857,130 $3,884,829,249 $15,155,217,587 $25,310,416,025
2002 $2,864,454,984 $3,849,728,346 $4,186,795,363 $16,418,788,831 $27,319,767,524
2003 $3,092,285,295 $4,121,758,950 $4,415,212,819 $17,264,153,972 $28,893,411,036
2004 $3,369,068,834 $4,462,844,074 $4,607,757,531 $18,533,964,802 $30,973,635,241
2005 $3,609,629,697 $4,772,652,208 $4,901,791,597 $20,194,915,813 $33,478,989,315
2006 $3,972,185,910 $5,339,613,542 $5,322,985,519 $20,918,122,059 $35,552,907,030
2007 $4,513,060,409 $5,836,989,949 $5,890,306,731 $18,874,239,532 $35,114,596,621
2008 $4,952,734,969 $6,342,704,903 $6,451,012,447 $21,233,517,226 $38,979,969,545
2009 $5,133,820,497 $6,526,724,060 $6,593,755,037 $21,780,056,204 $40,034,355,798
2010 $5,392,511,510 $6,567,069,864 $6,755,401,406 $21,558,289,126 $40,273,271,906
2011 $4,926,074,010 $6,742,912,786 $6,810,049,306 $22,001,561,060 $40,480,597,162
2012 $5,543,422,374 $7,064,659,174 $7,054,989,776 $23,072,781,962 $42,735,853,286
2013 $5,529,434,215 $7,537,749,461 $7,324,430,896 $24,854,671,461 $45,246,286,033
2014 $6,370,469,864 $8,114,998,194 $7,828,571,758 $26,792,677,172 $49,106,716,988
2015 $6,954,137,406 $8,696,387,395 $8,380,435,861 $28,176,465,862 $52,207,426,524
2016 $8,031,396,040 $9,027,417,995 $9,165,214,418 $29,854,848,665 $56,078,877,118
2017 $8,010,249,365 $9,533,695,367 $9,730,426,404 $32,132,603,529 $59,406,974,665
Average Annual Increase 7.49% 6.26% 6.05% 5.35% 5.85%
Source: Texas Comptroller of Public Accounts.
14 — Biennial Property Tax Report – Tax Years 2016 and 2017
2016 Election Results
School District CountyElection
Result
Aubrey ISD Denton Ratified
Bastrop ISD Bastrop Rolled Back
Beeville ISD Bee Ratified
Buna ISD Jasper Ratified
Bushland ISD Potter Rolled Back
Carrolton Farmers Branch ISD Dallas Ratified
Chapel Hill ISD (ESC 8) Titus Ratified
Cotton Center ISD Hale Ratified
Crawford ISD McLennan Ratified
De Leon ISD Comanche Ratified
Dripping Springs Hays Ratified
El Campo ISD Starr Ratified
Ferris ISD Cochran Ratified
Friendswood ISD Galveston Ratified
Frisco ISD Collin Rolled Back
Gainesville ISD Cooke Ratified
Goose Creek ISD Harris Ratified
Hale Center ISD Hale Ratified
Irving ISD Dallas Ratified
Joaquin ISD Shelby Ratified
Lovejoy ISD Collin Ratified
Lubbock ISD Lubbock Ratified
Lubbock Roosevelt ISD Lubbock Ratified
Marlin ISD Falls Rolled Back
Marlin ISD Falls Ratified
Mercedes ISD Hidalgo Rolled Back
Midland ISD Midland Rolled Back
Mineral Wells ISD Palo Pinto Ratified
Muleshoe ISD Bailey Ratified
Neches ISD Anderson Ratified
Needville ISD Fort Bend Ratified
New Waverly ISD Walker Ratified
Pecos-Barstow- Toyah ISD Reeves Ratified
Petersburg ISD Hale Ratified
Plainview ISD Hale Ratified
Raymondville ISD Willacy Rolled Back
2017 Election Results
School District CountyElection
Result
Alice ISD Lubbock Ratified
Austwell-Tivoli ISD Refugio Ratified
Big Sandy ISD Polk Ratified
Blanco ISD Blanco Ratified
Blooming Grove ISD Navarro Ratified
Bluffdale ISD Erath Rolled Back
Bronte ISD Coke Ratified
Brooks County ISD Brooks Ratified
Bryan ISD Brazos Ratified
Buffalo ISD Leon Ratified
Burleson ISD Johnson Ratified
Caldwell ISD Burleson Ratified
Chapel Hill ISD Travis Ratified
Chester ISD Tyler Ratified
Connally ISD McLennan Ratified
Coolidge ISD Limestone Ratified
Cross Plains ISD Callahan Ratified
Cross Roads ISD Henderson Ratified
Denton ISD Denton Ratified
Eagle Pass ISD Maverick Ratified
Eanes ISD Travis Ratified
Ector County ISD Ector Rolled Back
Electra ISD Wichita Ratified
Falls City ISD Karnes Ratified
Fort Worth ISD Tarrant Ratified
Frenship ISD Lubbock Ratified
Gustine ISD Comanche Ratified
Hamilton ISD Hamilton Ratified
Harmony ISD Upshur Ratified
Higgins ISD Lipscomb Ratified
Huntsville ISD Walker Ratified
Kountze ISD Hardin Ratified
Lake Travis ISD Travis Ratified
Latexo ISD Houston Rolled Back
Loop ISD Gaines Ratified
Malone ISD Hill Ratified
Martinsville ISD Nacogdoches Ratified
Mercedes ISD Hidalgo Ratified
APPENDIX 6School District Rollback Election Results, 2016-2017
Biennial Property Tax Report – Tax Years 2016 and 2017 — 15
2016 Election Results
School District CountyElection
Result
Riviera ISD Kleberg Ratified
Royal ISD Waller Rolled Back
San Antonio ISD Bexar Ratified
Scurry-Rosser ISD Kaufman Ratified
Seguin ISD Guadalupe Ratified
Sherman ISD Grayson Ratified
Slocum ISD Anderson Ratified
Snook ISD Burleson Ratified
Southwest ISD Bexar Ratified
Spurger ISD Tyler Ratified
Stratford ISD Sherman Ratified
Thrall ISD Williamson Ratified
Warren ISD Tyler Ratified
Wharton ISD Wharton Ratified
Wills Point ISD Van Zandt Ratified
Yantis ISD Wood Rolled Back
Source: TexasISD.com provided the information for this chart.
Note: Rolled back means the election effort failed and the school district was required to roll back the proposed tax rate to the published rollback tax rate. Ratified means voters agreed with the school district proposed tax rate, which is above its rollback tax rate.
APPENDIX 6School District Rollback Election Results, 2016-2017, Continued
2017 Election Results
School District CountyElection
Result
Mexia ISD Limestone Ratified
New Diana ISD Upshur Ratified
North Hopkins ISD Hopkins Ratified
Oglesby ISD Coryell Ratified
Pasadena ISD Harris Ratified
Port Arthur ISD Jefferson Ratified
Quinlan ISD Hunt Ratified
Raymondville ISD Willacy Ratified
Rice ISD Navarro Ratified
Rivercrest ISD Red River Ratified
Riviera ISD Kleberg Ratified
Rockdale ISD Milam Ratified
Royal ISD Waller Ratified
Sabine Pass ISD Jefferson Ratified
San Perlita ISD Willacy Ratified
Southland ISD Garza Ratified
Springtown ISD Parker Ratified
Throckmorton ISD Throckmorton Ratified
Trinity ISD Trinity Ratified
Troup ISD Smith Ratified
Woodville ISD Tyler Rolled Back
Source: TexasISD.com provided the information for this chart.
Note: Rolled back means the election effort failed and the school district was required to roll back the proposed tax rate to the published rollback tax rate. Ratified means voters agreed with the school district proposed tax rate, which is above its rollback tax rate.
For more information or additional copies, visit our website:
comptroller.texas.gov/taxes/property-tax
In compliance with the Americans with Disabilities Act, this document may be requested in alternative formats
by calling toll free 800-252-5555.
Sign up to receive email updates on the Comptroller topics of your choice at comptroller.texas.gov/subscribe/.
Texas Comptroller of Public AccountsPublication #96-1728
December 2018