global ab reliability report 2021
TRANSCRIPT

Reliability Report Spring 2021IMPLANTABLE COCHLEAR STIMULATORSAND SOUND PROCESSORS

2 Reliability Report Spring 2021

3Implantable Cochlear Stimulators
POWERFULCONNECTIONSSTART HEREOur Mission 4
Reporting on Reliability 5
Implantable Cochlear Stimulators 6
HiRes Ultra 3D (V2) cochlear implant 8
HiRes Ultra (V2) cochlear implant 10
HiRes Ultra 3D (V1) cochlear implant 12
HiRes Ultra (V1) cochlear implant 14
HiRes 90K Advantage cochlear implant 16
HiRes 90K cochlear implant 18
CII Bionic Ear cochlear implant 26
Clarion 1.2 cochlear implant 28
Clarion 1.0 cochlear implant 30
Sound Processor Stimulators 32
Naída CI M and Sky CI M sound processors 32
Naída CI Q90 sound processor 33
Neptune sound processor 34
Chorus sound processor 35
Harmony sound processor 35
Annex 36

4 Reliability Report Spring 2021
OUR MISSION
Advanced Bionics is proud to have been part of the Sonova Hearing Group for over 10 years, carrying on the Sonova vision of a world where everyone enjoys the delight of hearing and lives a life without limitations. Along with our sister company Phonak, we have strived to bring the latest in hearing instrument technology to our cochlear implant users and professionals.
Our goal is to offer the best hearing performance and to provide reliable and high quality products that exceed your expectations. This reliability report is an example of our commitment to an open and transparent communication to you.

5Implantable Cochlear Stimulators
1. ISO 5841-2 (2014) Implants for Surgery – Cardiac Pacemakers. International Organization for Standardization (ISO), Geneva, Switzerland.2. European Consensus Statement on Cochlear Implant Failures and Explanations. (2005) Otology and Neurology, 26(6): 1097-1099.3. ANSI/AAMI CI86. Cochlear Implant Systems: Requirements for Safety, Functional Verification, Labeling and Reliability Reporting. (2017). Arlington, VA: American
National Standards Institute.
REPORTING ON RELIABILITY
Advanced Bionics remains committed to providing you with clear and accurate information on the quality and reliability of our cochlear implant system.
This report contains information presented in a format that adheres to ISO 5841-2:20141, the principles outlined in the European Consensus on Cochlear Implant Failures and Explantations2 and ANSI/AAMI CI86 Standard – Cochlear Implant Systems: Requirements for Safety, Functional Verification, Labeling and Reliability Reporting3. All methodologies are presented for all Cochlear Implant Stimulators (commonly referred to as the implant or device) and the current sound processors.

6 Reliability Report Spring 2021
Graph title shows the implant name and any additional identifying information.
100.00%
99.00%
98.00%
1 2 3 4 5 6 7 8
CS
R
YEARS
97.00%
96.00%
95.00%
94.00%
93.00%
92.00%
91.00%
90.00%Adults Combined Children
The black vertical bars on each data point are confidence intervals. These are displayed to indicate the accuracy of statistical calculations.
CSR values are plotted with a marker for each year. Adults, children, and the combined data are plotted separately.
Cumulative Survival Rate (CSR) shows the percentage of implant that are still functional after the time in years indicated in the table and on the graph. You may also see this described as Cumulative Survival Percentage.
HiRes 90K AdvantageISO 5841-2:2014
IMPLANTABLE COCHLEAR STIMULATORS
For each implant type and any significant variant of that implant type, there will be a table showing the number of registered users and graphs showing cumulative survival rate. The table will include data for adults, children, and a combined number in accordance with the reporting methodologies.
There will be separate graphs presenting the data in accordance with ISO 5841-2:2014 and ANSI/AAMI CI86 Standard.
Number of registered HiRes 90K Advantage implantsAs of March 29, 2021.Date of first commercial introduction‡: 2012
STANDARD ADULTS CHILDREN COMBINED
ISO 5841-2:2014 15283 19937 37183†
ANSI/AAMI CI86 19292* 17891 37183
‡ Dates provided are those for major markets covered by FDA and TUV regulation. Some implants may be pending approval in a subset of additional regions.* The adult number also includes users whose personal information is not available or may not be obtainable due to certain privacy laws in certain countries. † The combined number also includes any registered users for whom we do not have date of birth information.
HIRES 90K ADVANTAGE CUMULATIVE SURVIVAL PERCENTAGE
Years in use 1 2 3 4 5 6 7 8
ADULTS 99.93% 99.91% 99.85% 99.80% 99.77% 99.73% 99.73% 99.68%
COMBINED 99.87% 99.78% 99.66% 99.56% 99.48% 99.39% 99.31% 99.25%
CHILDREN 99.80% 99.65% 99.46% 99.30% 99.17% 99.03% 98.82% 98.76%
Detailed CSR percentages are shown for each year in the table. Results are broken up into adults, children, and shown as a combined total.
INTERPRETING TABLES AND GRAPHS

7Implantable Cochlear Stimulators
1 2 3 4 5 6 87
CR
P
YEARS
0.00%
1.00%
2.00%
3.00%
4.00%
5.00%
6.00%
7.00%
8.00%
9.00%
10.00%Adults Combined Children
REMOVAL RATES ANALYSIS FOR ALL ANALYSIS CATEGORIES
AND DIFFERENT PATIENT POPULATIONS
Graph title shows the implant name and any additional identifying information.
The black vertical bars on each data point are confidence intervals. These are displayed to indicate the accuracy of statistical calculations.
CRP values are plotted with a marker for each year. Adults, children, and the combined data are plotted separately
Cumulative Removal Percentage (CRP) shows the percentage of implants that have been removed after the time in years indicated in the table and on the graph.
HiRes 90K AdvantageANSI/AAMI CI86 STANDARD
Throughout the report, we will present the data and graphs to represent the conditions for: all analysis categories combined; by analysis category for adults and children; removal rates by analysis category for adults; and removal rates by analysis category for children.
Not all data may be shown alongside the graphs due to space limitations. Please see the appendix at the end of the report for a complete data set.
COMBINED ADULT AND CHILDREN
Year Medical CRP Device CRP Inconclusive CRP Total All Categories Total
CI Up CI Down
1 0.72% 0.14% 0.02% 0.88% 0.98% 0.78%
2 1.14% 0.23% 0.04% 1.41% 1.54% 1.29%
3 1.42% 0.36% 0.05% 1.83% 1.97% 1.69%
4 1.67% 0.46% 0.07% 2.20% 2.36% 2.04%
5 1.83% 0.54% 0.10% 2.48% 2.65% 2.30%
6 2.01% 0.62% 0.11% 2.73% 2.92% 2.55%
7 2.09% 0.71% 0.13% 2.93% 3.14% 2.72%
8 2.17% 0.79% 0.13% 3.10% 3.34% 2.85%
Detailed CRP values are shown for each year in the table. Results are broken up into adults, children, and shown as a combined total.
The ANSI/AAMI CI86 Standard requires that all removed devices are classified into three categories, namely those related to device failure, to medical reasons for explant, or those whose reason for explant cannot be determined.
8 Reliability Report Spring 2021
ISO 5841-2:2014
1
Adults Combined Children
100.00%
99.80%
99.60%
CS
R
99.40%
99.20%
99.00%
Years in use 1
ADULTS 100.00%
COMBINED 100.00%
CHILDREN 100.00%
CUMULATIVE SURVIVAL
PERCENTAGE
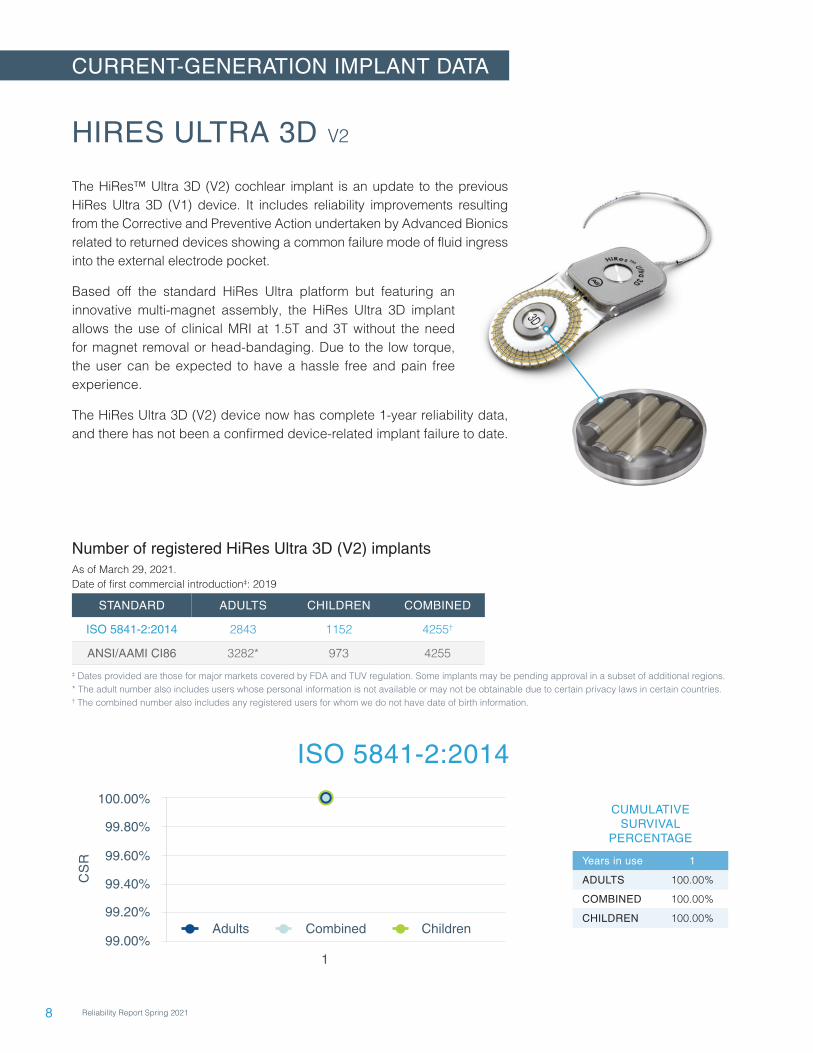
Number of registered HiRes Ultra 3D (V2) implantsAs of March 29, 2021.Date of first commercial introduction‡: 2019
STANDARD ADULTS CHILDREN COMBINED
ISO 5841-2:2014 2843 1152 4255†
ANSI/AAMI CI86 3282* 973 4255
‡ Dates provided are those for major markets covered by FDA and TUV regulation. Some implants may be pending approval in a subset of additional regions.* The adult number also includes users whose personal information is not available or may not be obtainable due to certain privacy laws in certain countries. † The combined number also includes any registered users for whom we do not have date of birth information.
CURRENT-GENERATION IMPLANT DATA
HIRES ULTRA 3D V2
The HiRes™ Ultra 3D (V2) cochlear implant is an update to the previous HiRes Ultra 3D (V1) device. It includes reliability improvements resulting from the Corrective and Preventive Action undertaken by Advanced Bionics related to returned devices showing a common failure mode of fluid ingress into the external electrode pocket.
Based off the standard HiRes Ultra platform but featuring an innovative multi-magnet assembly, the HiRes Ultra 3D implant allows the use of clinical MRI at 1.5T and 3T without the need for magnet removal or head-bandaging. Due to the low torque, the user can be expected to have a hassle free and pain free experience.
The HiRes Ultra 3D (V2) device now has complete 1-year reliability data, and there has not been a confirmed device-related implant failure to date.

9Implantable Cochlear Stimulators
COMBINED ADULTS AND CHILDREN
Year Medical CRP Device CRP Inconclusive CRP Total All Categories
1 0.50% 0.00% 0.00% 0.50%
Not all data may be shown alongside the graphs due to space limitations. Please see the Appendix at the end of the report for a complete data set.
0.80%
0.40%
0.00%
CR
P
1.60%
1.20%
0.60%
0.20%
1.00%
1.40%
1.80%
2.00%
1
REMOVAL RATES ANALYSIS CATEGORY
FOR ADULTS AND CHILDREN
All categories Medical Device Inconclusive
0.80%
0.40%
0.00%
CR
P
1.60%
1.20%
0.60%
0.20%
1.00%
1.40%
1.80%
2.00%
1
REMOVAL RATES ANALYSIS CATEGORY
FOR ADULTS
All categories Medical Device Inconclusive
0.80%
0.40%
0.00%C
RP
1.60%
1.20%
0.60%
0.20%
1.00%
1.40%
1.80%
2.00%
1
Adults Combined Children
REMOVAL RATES ANALYSIS FOR ALL ANALYSIS CATEGORIES
AND DIFFERENT PATIENT POPULATIONS
0.80%
0.40%
0.00%
CR
P
1.60%
1.20%
0.60%
0.20%
1.00%
1.40%
1.80%
2.00%
1
REMOVAL RATES ANALYSIS CATEGORY
FOR CHILDREN
All categories Medical Device Inconclusive
ANSI/AAMI CI86

10 Reliability Report Spring 2021
HIRES ULTRA V2
The HiRes™ Ultra (V2) cochlear implant has the same reliability improvements as the HiRes Ultra 3D (V2) device.
Featuring the proven performance platform as the HiRes 90K™ Advantage, the HiRes Ultra (V2) offers a robust, thin, and discreet mechanical design that is suitable for adults and children.
The HiRes Ultra (V2) device has a limited number of devices that have completed the 1-year data point and the data presented may not reach statistical significance. There has not been a confirmed device-related failure to date.
Number of registered HiRes Ultra (V2) implantsAs of March 29, 2021.Date of first commercial introduction‡: 2019
STANDARD ADULTS CHILDREN COMBINED*
ISO 5841-2:2014 181 449 802†
ANSI/AAMI CI86 375* 427 802
‡ Dates provided are those for major markets covered by FDA and TUV regulation. Some implants may be pending approval in a subset of additional regions.* The adult number also includes users whose personal information is not available or may not be obtainable due to certain privacy laws in certain countries. † The combined number also includes any registered users for whom we do not have date of birth information.
ISO 5841-2:2014
1
Adults Combined Children
100.00%
99.80%
99.60%
CS
R
99.40%
99.20%
99.00%
Years in use 1
ADULTS 100.00%
COMBINED 100.00%
CHILDREN 100.00%
CUMULATIVE SURVIVAL
PERCENTAGE

11Implantable Cochlear Stimulators
COMBINED ADULTS AND CHILDREN
Year Medical CRP Device CRP Inconclusive CRP Total All Categories
1 0.00% 0.00% 0.00% 0.00%
0.40%
0.30%
0.20%
0.10%
0.00%
CR
P
0.80%
0.60%
0.50%
0.70%
0.90%
1.00%
1
REMOVAL RATES ANALYSIS CATEGORY
FOR ADULTS AND CHILDREN
All categories Medical Device Inconclusive
0.40%
0.30%
0.20%
0.10%
0.00%
CR
P
0.80%
0.60%
0.50%
0.70%
0.90%
1.00%
1
REMOVAL RATES ANALYSIS CATEGORY
FOR ADULTS
All categories Medical Device Inconclusive
0.40%
0.30%
0.20%
0.10%
0.00%C
RP
0.80%
0.60%
0.50%
0.70%
0.90%
1.00%Adults Combined Children
REMOVAL RATES ANALYSIS FOR ALL ANALYSIS CATEGORIES
AND DIFFERENT PATIENT POPULATIONS
1
0.40%
0.30%
0.20%
0.10%
0.00%
CR
P
0.80%
0.60%
0.50%
0.70%
0.90%
1.00%
1
REMOVAL RATES ANALYSIS CATEGORY
FOR CHILDREN
All categories Medical Device Inconclusive
ANSI/AAMI CI86
Not all data may be shown alongside the graphs due to space limitations. Please see the Appendix at the end of the report for a complete data set.

12 Reliability Report Spring 2021
CUMULATIVE SURVIVAL PERCENTAGE
Years in use 1 1.5 2
ADULTS 99.89% 99.60% 98.99%
COMBINED 99.81% 99.39% 98.27%
CHILDREN 99.55% 98.71% 95.90%
HIRES ULTRA 3D V1
The HiRes™ Ultra 3D (V1) cochlear implant was subject to a Voluntary Field Action initiated by Advanced Bionics on February 18, 2020, and was withdrawn from sale worldwide. This was due to recognition of a common failure mode for a small number of devices, resulting in loss of clinical benefit.
Advanced Bionics will continue to provide regular reliability updates on the HiRes Ultra platform as new data and information becomes available.
Number of registered HiRes Ultra 3D (V1) implantsAs of March 29, 2021.Last year of distribution‡: subject to voluntary field action February 18, 2020
STANDARD ADULTS CHILDREN COMBINED
ISO 5841-2:2014 4539 1575 6371†
ANSI/AAMI CI86 5029* 1342 6371
‡ Dates provided are those for major markets covered by FDA and TUV regulation. Some implants may be pending approval in a subset of additional regions.* The adult number also includes users whose personal information is not available or may not be obtainable due to certain privacy laws in certain countries. † The combined number also includes any registered users for whom we do not have date of birth information.
PREVIOUS-GENERATION IMPLANT DATA
1 1.5 2
YEARS
Adults Combined Children
100.00%
98.00%
CS
R
96.00%
94.00%
90.00%
92.00%
88.00%
86.00%
84.00%
82.00%
80.00%
78.00%
76.00%
74.00%
72.00%
70.00%
ISO 5841-2:2014

13Implantable Cochlear Stimulators
COMBINED ADULTS AND CHILDREN
Year Medical CRP Device CRP Inconclusive CRP Total All Categories Total
CI Up CI Down
1 0.91% 0.19% 0.02% 1.12% 1.38% 0.86%
2 1.32% 1.65% 0.04% 3.01% 3.50% 2.52%
8.00%
6.00%
4.00%
2.00%
0.00%
CR
P
16.00%
12.00%
10.00%
14.00%
18.00%
20.00%All categories Medical Device Inconclusive
REMOVAL RATES ANALYSIS CATEGORY
FOR ADULTS AND CHILDREN
1 2YEARS
8.00%
6.00%
4.00%
2.00%
0.00%
CR
P
16.00%
12.00%
10.00%
14.00%
18.00%
20.00%All categories Medical Device Inconclusive
REMOVAL RATES ANALYSIS CATEGORY
FOR ADULTS
1 2YEARS
16.00%
12.00%
8.00%
4.00%
0.00%C
RP
32.00%
24.00%
20.00%
28.00%
36.00%
40.00%Adults Combined Children
REMOVAL RATES ANALYSIS FOR ALL ANALYSIS CATEGORIES
AND DIFFERENT PATIENT POPULATIONS
1 2YEARS
16.00%
12.00%
8.00%
4.00%
0.00%
CR
P
32.00%
24.00%
20.00%
28.00%
36.00%
40.00%All categories Medical Device Inconclusive
REMOVAL RATES ANALYSIS CATEGORY
FOR CHILDREN
1 2YEARS
ANSI/AAMI CI86
Not all data may be shown alongside the graphs due to space limitations. Please see the Appendix at the end of the report for a complete data set.

14 Reliability Report Spring 2021
HIRES ULTRA V1
The HiRes™ Ultra (V1) cochlear implant was subject to a Voluntary Field Action initiated by Advanced Bionics on February 18, 2020, and was withdrawn from sale worldwide. This was due to recognition of a common failure mode for a small number of devices, resulting in loss of clinical benefit.
Advanced Bionics will continue to provide regular reliability updates on the HiRes Ultra platform as new data and information becomes available.
CUMULATIVE SURVIVAL PERCENTAGE
Years in use 1 2 3 4
ADULTS 99.97% 99.61% 97.79% 94.66%
COMBINED 99.95% 99.57% 97.42% 92.60%
CHILDREN 99.91% 99.44% 96.33% 87.23%
1 2 3 4
Adults Combined Children
100.00%
98.00%
CS
R
96.00%
94.00%
90.00%
92.00%
88.00%
86.00%
84.00%
82.00%
80.00%
78.00%
76.00%
74.00%
72.00%
70.00%
YEARS
ISO 5841-2:2014
Number of registered HiRes Ultra (V1) implantsAs of March 29, 2021.Last year of distribution‡: subject to voluntary field action February 18, 2020
STANDARD ADULTS CHILDREN COMBINED
ISO 5841-2:2014 7075 4263 12131†
ANSI/AAMI CI86 8376* 3755 12131
‡ Dates provided are those for major markets covered by FDA and TUV regulation. Some implants may be pending approval in a subset of additional regions.* The adult number also includes users whose personal information is not available or may not be obtainable due to certain privacy laws in certain countries. † The combined number also includes any registered users for whom we do not have date of birth information.

15Implantable Cochlear Stimulators
COMBINED ADULTS AND CHILDREN
Year Medical CRP Device CRP Inconclusive CRP Total All Categories Total
CI Up CI Down
1 0.69% 0.05% 0.02% 0.75% 0.90% 0.60%
2 1.06% 0.44% 0.04% 1.54% 1.76% 1.31%
3 1.34% 2.68% 0.08% 4.10% 4.51% 3.69%
4 1.52% 7.72% 0.11% 9.34% 10.16% 8.51%
1 3 4YEARS
2
8.00%
6.00%
4.00%
2.00%
0.00%
CR
P
16.00%
12.00%
10.00%
14.00%
18.00%
20.00%All categories Medical Device Inconclusive
REMOVAL RATES ANALYSIS CATEGORY
FOR ADULTS AND CHILDREN
1 3 4YEARS
2
8.00%
6.00%
4.00%
2.00%
0.00%
CR
P
16.00%
12.00%
10.00%
14.00%
18.00%
20.00%All categories Medical Device Inconclusive
REMOVAL RATES ANALYSIS CATEGORY
FOR ADULTS
1 3 4YEARS
2
16.00%
12.00%
8.00%
4.00%
0.00%C
RP
32.00%
24.00%
20.00%
28.00%
36.00%
40.00%Adults Combined Children
REMOVAL RATES ANALYSIS FOR ALL ANALYSIS CATEGORIES
AND DIFFERENT PATIENT POPULATIONS
1 3 4YEARS
2
16.00%
12.00%
8.00%
4.00%
0.00%
CR
P
32.00%
24.00%
20.00%
28.00%
36.00%
40.00%All categories Medical Device Inconclusive
REMOVAL RATES ANALYSIS CATEGORY
FOR CHILDREN
ANSI/AAMI CI86
Not all data may be shown alongside the graphs due to space limitations. Please see the Appendix at the end of the report for a complete data set.

16 Reliability Report Spring 2021
HIRES 90K ADVANTAGE
The HiRes 90K™ Advantage cochlear implant offers mechanical improvements over its predecessor, the HiRes 90K cochlear implant. It has the capability to offer advanced sound coding strategies, together with the security of a deep bone bed.
CUMULATIVE SURVIVAL PERCENTAGE
Years in use 1 2 3 4 5 6 7 8
ADULTS 99.93% 99.91% 99.85% 99.80% 99.77% 99.73% 99.73% 99.68%
COMBINED 99.87% 99.78% 99.66% 99.56% 99.48% 99.39% 99.31% 99.25%
CHILDREN 99.80% 99.65% 99.46% 99.30% 99.17% 99.03% 98.82% 98.76%
100.00%
99.00%
98.00%
1 2 3 4 5 6 7 8
CS
R
YEARS
97.00%
96.00%
95.00%
94.00%
93.00%
92.00%
91.00%
90.00%Adults Combined Children
ISO 5841-2:2014
Number of registered HiRes 90K Advantage implantsAs of March 29, 2021.Date of first commercial introduction‡: 2012. Still available in selected markets.
STANDARD ADULTS CHILDREN COMBINED
ISO 5841-2:2014 15283 19937 37183†
ANSI/AAMI CI86 19292* 17891 37183
‡ Dates provided are those for major markets covered by FDA and TUV regulation. Some implants may be pending approval in a subset of additional regions.* The adult number also includes users whose personal information is not available or may not be obtainable due to certain privacy laws in certain countries. † The combined number also includes any registered users for whom we do not have date of birth information.

17Implantable Cochlear Stimulators
4.00%
3.00%
2.00%
1.00%
0.00%1 2 3 4 5 6 7 8
CR
P
YEARS
8.00%
6.00%
5.00%
7.00%
9.00%
10.00%All categories Medical Device Inconclusive
REMOVAL RATES ANALYSIS CATEGORY
FOR ADULTS AND CHILDREN
4.00%
3.00%
2.00%
1.00%
0.00%1 2 3 4 5 6 7 8
CR
P
YEARS
8.00%
6.00%
5.00%
7.00%
9.00%
10.00%All categories Medical Device Inconclusive
REMOVAL RATES ANALYSIS CATEGORY
FOR ADULTS
4.00%
3.00%
2.00%
1.00%
0.00%1 2 3 4 5 6 7 8
CR
P
YEARS
8.00%
6.00%
5.00%
7.00%
Adults Combined Children
REMOVAL RATES ANALYSIS FOR ALL ANALYSIS CATEGORIES
AND DIFFERENT PATIENT POPULATIONS
9.00%
10.00%
4.00%
3.00%
2.00%
1.00%
0.00%1 2 3 4 5 6 7 8
CR
P
YEARS
8.00%
6.00%
5.00%
7.00%
9.00%
10.00%
REMOVAL RATES ANALYSIS CATEGORY
FOR CHILDREN
All categories Medical Device Inconclusive
ANSI/AAMI CI86
Not all data may be shown alongside the graphs due to space limitations. Please see the Appendix at the end of the report for a complete data set.
COMBINED ADULT AND CHILDREN
Year Medical CRP Device CRP Inconclusive CRP Total All Categories Total
CI Up CI Down
1 0.72% 0.14% 0.02% 0.88% 0.98% 0.78%
2 1.14% 0.23% 0.04% 1.41% 1.54% 1.29%
3 1.42% 0.36% 0.05% 1.83% 1.97% 1.69%
4 1.67% 0.46% 0.07% 2.20% 2.36% 2.04%
5 1.83% 0.54% 0.10% 2.48% 2.65% 2.30%
6 2.01% 0.62% 0.11% 2.73% 2.92% 2.55%
7 2.09% 0.71% 0.13% 2.93% 3.14% 2.72%
8 2.17% 0.79% 0.13% 3.10% 3.34% 2.85%

18 Reliability Report Spring 2021
HIRES 90K vendor A post-mod
The HiRes 90K™ cochlear implant offers access to advanced sound coding technologies. It has undergone manufacturing modifications that are listed separately below, with the version currently available being designated as the HiRes 90K (vendor A post-mod) implant.
CUMULATIVE SURVIVAL PERCENTAGE
Years in use 1 2 3 4 5 6 7 8 9 10 11 12 13 14 15
ADULTS 99.95% 99.93% 99.89% 99.83% 99.79% 99.72% 99.71% 99.67% 99.63% 99.56% 99.50% 99.49% 99.49% 99.49% 99.49%
COMBINED 99.88% 99.74% 99.60% 99.45% 99.32% 99.22% 99.16% 99.06% 99.01% 98.89% 98.85% 98.81% 98.78% 98.77% 98.74%
CHILDREN 99.82% 99.60% 99.37% 99.14% 98.94% 98.80% 98.70% 98.55% 98.49% 98.33% 98.30% 98.23% 98.18% 98.15% 98.08%
1 2 3 4 5 6 7 8 9 10 11 12 13 14 15
CS
R
YEARS
Adults Combined Children
100.00%
99.00%
98.00%
97.00%
96.00%
95.00%
94.00%
93.00%
92.00%
91.00%
90.00%
ISO 5841-2:2014
Number of registered HiRes 90K implants (vendor A post-mod)As of March 29, 2021.Last year of distribution‡. Still available in selected markets.
STANDARD ADULTS CHILDREN COMBINED
ISO 5841-2:2014 31417 44578 78531†
ANSI/AAMI CI86 39337* 39194 78531
‡ Dates provided are those for major markets covered by FDA and TUV regulation. Some implants may be pending approval in a subset of additional regions.* The adult number also includes users whose personal information is not available or may not be obtainable due to certain privacy laws in certain countries. † The combined number also includes any registered users for whom we do not have date of birth information.

19Implantable Cochlear Stimulators
COMBINED ADULTS AND CHILDREN
Year Medical CRP Device CRP Inconclusive CRP Total All Categories Total
CI Up CI Down
1 0.81% 0.14% 0.02% 0.96% 1.03% 0.90%2 1.23% 0.29% 0.04% 1.56% 1.65% 1.48%3 1.52% 0.45% 0.06% 2.03% 2.14% 1.93%4 1.76% 0.62% 0.09% 2.47% 2.58% 2.36%5 1.96% 0.75% 0.11% 2.82% 2.94% 2.70%6 2.11% 0.87% 0.13% 3.12% 3.24% 2.99%7 2.24% 0.94% 0.14% 3.33% 3.46% 3.19%8 2.35% 1.05% 0.16% 3.56% 3.70% 3.41%9 2.45% 1.11% 0.17% 3.72% 3.87% 3.57%
10 2.61% 1.22% 0.19% 4.02% 4.18% 3.86%11 2.69% 1.27% 0.20% 4.16% 4.33% 3.99%12 2.83% 1.31% 0.21% 4.36% 4.54% 4.17%13 2.96% 1.33% 0.24% 4.53% 4.72% 4.33%14 3.08% 1.36% 0.24% 4.67% 4.88% 4.46%15 3.17% 1.39% 0.27% 4.82% 5.07% 4.57%
Adults Combined Children
REMOVAL RATES ANALYSIS FOR ALL ANALYSIS CATEGORIESAND DIFFERENT PATIENT POPULATIONS
6.00%
5.00%
4.00%
3.00%
2.00%
1.00%
0.00%1 2 3 4 5 6 7 8 9 10 11 12 13 14 15
CR
P
YEARS
7.00%
8.00%
9.00%
10.00%
11.00%
12.00%
13.00%
14.00%
6.00%
5.00%
4.00%
3.00%
2.00%
1.00%
0.00%1 2 3 4 5 6 7 8 9 10 11 12 13 14 15
CR
P
YEARS
7.00%
8.00%
9.00%
10.00%
11.00%
12.00%
13.00%
14.00%
REMOVAL RATES ANALYSISCATEGORY FOR CHILDREN
All categories Medical Device Inconclusive
6.00%
5.00%
4.00%
3.00%
2.00%
1.00%
0.00%1 2 3 4 5 6 7 8 9 10 11 12 13 14 15
CR
P
YEARS
7.00%
8.00%
9.00%
10.00%
11.00%
12.00%
13.00%
14.00%
REMOVAL RATES ANALYSIS CATEGORYFOR ADULTS AND CHILDREN
All categories Medical Device Inconclusive
6.00%
5.00%
4.00%
3.00%
2.00%
1.00%
0.00%1 2 3 4 5 6 7 8 9 10 11 12 13 14 15
CR
P
YEARS
7.00%
8.00%
9.00%
10.00%
11.00%
12.00%
13.00%
14.00%
REMOVAL RATES ANALYSISCATEGORY FOR ADULTS
All categories Medical Device Inconclusive
ANSI/AAMI CI86
Not all data may be shown alongside the graphs due to space limitations. Please see the Appendix at the end of the report for a complete data set.

20 Reliability Report Spring 2021
CUMULATIVE SURVIVAL PERCENTAGE
Years in use 1 2 3 4 5 6 7 8 9 10 11 12 13 14 15 16 17
ADULTS 99.93% 99.90% 99.86% 99.77% 99.73% 99.64% 99.62% 99.56% 99.46% 99.37% 99.27% 99.20% 99.17% 99.08% 98.98% 98.80% 98.70%
COMBINED 99.87% 99.72% 99.58% 99.41% 99.28% 99.16% 99.08% 98.95% 98.85% 98.72% 98.63% 98.53% 98.46% 98.34% 98.21% 98.02% 97.90%
CHILDREN 99.81% 99.58% 99.35% 99.11% 98.90% 98.74% 98.62% 98.42% 98.33% 98.16% 98.10% 97.94% 97.84% 97.67% 97.51% 97.28% 97.13%
HIRES 90K vendor A all
1 2 3 4 5 6 7 8 9 10 11 12 13 14 15 16 17
YEARS
Adults Combined Children
CS
R
100.00%
99.00%
98.00%
97.00%
96.00%
95.00%
94.00%
93.00%
92.00%
91.00%
90.00%
89.00%
88.00%
87.00%
86.00%
85.00%
ISO 5841-2:2014
Number of registered HiRes 90K implants (vendor A all)As of March 29, 2021.Last year of distribution‡. Still available in selected markets.
STANDARD ADULTS CHILDREN COMBINED
ISO 5841-2:2014 32867 45672 81086†
ANSI/AAMI CI86 40383* 39156 79539
‡ Dates provided are those for major markets covered by FDA and TUV regulation. Some implants may be pending approval in a subset of additional regions.* The adult number also includes users whose personal information is not available or may not be obtainable due to certain privacy laws in certain countries. † The combined number also includes any registered users for whom we do not have date of birth information.

21Implantable Cochlear Stimulators
COMBINED ADULTS AND CHILDREN
Year Medical CRP Device CRP Inconclusive CRP Total All Categories Total
CI Up CI Down1 0.81% 0.15% 0.02% 0.98% 1.05% 0.91%2 1.23% 0.32% 0.05% 1.59% 1.68% 1.50%3 1.52% 0.49% 0.07% 2.08% 2.18% 1.98%4 1.76% 0.68% 0.10% 2.54% 2.65% 2.43%5 1.96% 0.83% 0.13% 2.91% 3.03% 2.79%6 2.11% 0.97% 0.15% 3.23% 3.36% 3.10%7 2.25% 1.06% 0.17% 3.47% 3.61% 3.34%8 2.37% 1.20% 0.18% 3.75% 3.90% 3.61%9 2.46% 1.30% 0.19% 3.95% 4.10% 3.80%10 2.62% 1.44% 0.22% 4.28% 4.45% 4.12%11 2.72% 1.53% 0.23% 4.48% 4.65% 4.30%12 2.86% 1.65% 0.24% 4.75% 4.94% 4.56%13 2.97% 1.71% 0.27% 4.95% 5.15% 4.75%14 3.12% 1.87% 0.27% 5.26% 5.48% 5.03%15 3.22% 2.02% 0.29% 5.52% 5.79% 5.26%16 3.25% 2.21% 0.29% 5.76% 6.06% 5.45%17 3.25% 2.33% 0.29% 5.88% 6.22% 5.53%
ANSI/AAMI CI86
6.00%
5.00%
4.00%
3.00%
2.00%
1.00%
0.00%1 2 3 4 5 6 7 8 9 10 11 12 13 14 15 16 17
CR
P
YEARS
7.00%
8.00%
9.00%
10.00%
Adults Combined Children
REMOVAL RATES ANALYSIS FOR ALL ANALYSIS CATEGORIESAND DIFFERENT PATIENT POPULATIONS
11.00%
12.00%
13.00%
14.00%
6.00%
5.00%
4.00%
3.00%
2.00%
1.00%
0.00%1 2 3 4 5 6 7 8 9 10 11 12 13 14 15 16 17
CR
P
YEARS
7.00%
8.00%
9.00%
10.00%
11.00%
12.00%
13.00%
14.00%
REMOVAL RATES ANALYSISCATEGORY FOR CHILDREN
All categories Medical Device Inconclusive
6.00%
5.00%
4.00%
3.00%
2.00%
1.00%
0.00%1 2 3 4 5 6 7 8 9 10 11 12 13 14 15 16 17
CR
P
YEARS
7.00%
8.00%
9.00%
10.00%
11.00%
12.00%
13.00%
14.00%
REMOVAL RATES ANALYSISCATEGORY FOR ADULTS
All categories Medical Device Inconclusive
6.00%
5.00%
4.00%
3.00%
2.00%
1.00%
0.00%1 2 3 4 5 6 7 8 9 10 11 12 13 14 15 16 17
CR
P
YEARS
7.00%
8.00%
9.00%
10.00%
11.00%
12.00%
13.00%
14.00%All categories Medical Device Inconclusive
REMOVAL RATES ANALYSISCATEGORY FOR ADULTS AND CHILDREN
Not all data may be shown alongside the graphs due to space limitations. Please see the Appendix at the end of the report for a complete data set.

22 Reliability Report Spring 2021
CUMULATIVE SURVIVAL PERCENTAGE
Years in use 1 2 3 4 5 6 7 8 9 10 11 12 13 14 15 16 17
ADULTS 99.58% 99.31% 99.09% 98.60% 98.46% 98.10% 97.95% 97.52% 96.94% 96.65% 96.22% 95.78% 95.63% 95.27% 95.04% 94.90% 94.79%
COMBINED 99.53% 99.17% 98.85% 98.29% 97.96% 97.51% 97.18% 96.48% 95.91% 95.62% 95.16% 94.58% 94.33% 93.86% 93.61% 93.44% 93.32%
CHILDREN 99.45% 98.98% 98.51% 97.85% 97.28% 96.71% 96.13% 95.06% 94.48% 94.18% 93.79% 93.01% 92.61% 92.02% 91.72% 91.51% 91.37%
HIRES 90K vendor A pre-mod
YEARS
1 2 3 4 5 6 7 8 9 10 11 12 13 14 15 16 17
Adults Combined Children
100.00%
98.00%
CS
R
96.00%
94.00%
90.00%
92.00%
88.00%
86.00%
84.00%
82.00%
80.00%
78.00%
76.00%
74.00%
72.00%
70.00%
ISO 5841-2:2014
Number of registered HiRes 90K implants (vendor A pre-mod)As of March 29, 2021.Last year of distribution‡: 2005.
STANDARD ADULTS CHILDREN COMBINED
ISO 5841-2:2014 1450 1094 2555†
ANSI/AAMI CI86 1661* 894 2555
‡ Dates provided are those for major markets covered by FDA and TUV regulation. Some implants may be pending approval in a subset of additional regions.* The adult number also includes users whose personal information is not available or may not be obtainable due to certain privacy laws in certain countries. † The combined number also includes any registered users for whom we do not have date of birth information.

23Implantable Cochlear Stimulators
COMBINED ADULTS AND CHILDREN
Year Medical CRP Device CRP Inconclusive CRP Total All Categories Total
CI Up CI Down1 0.90% 0.55% 0.00% 1.45% 1.92% 0.99%2 1.18% 1.03% 0.20% 2.41% 3.00% 1.81%3 1.58% 1.47% 0.40% 3.45% 4.15% 2.74%4 1.86% 2.31% 0.44% 4.61% 5.42% 3.80%5 1.98% 2.87% 0.52% 5.38% 6.25% 4.51%6 2.15% 3.44% 0.61% 6.19% 7.12% 5.26%7 2.47% 3.88% 0.73% 7.09% 8.08% 6.10%8 2.72% 4.62% 0.73% 8.07% 9.12% 7.03%9 2.76% 5.19% 0.73% 8.69% 9.77% 7.60%10 2.89% 5.60% 0.82% 9.31% 10.42% 8.19%11 3.10% 6.01% 0.86% 9.97% 11.12% 8.82%12 3.27% 6.63% 0.86% 10.76% 11.95% 9.57%13 3.31% 6.91% 0.91% 11.14% 12.34% 9.93%14 3.53% 7.49% 0.91% 11.93% 13.17% 10.69%15 3.66% 7.78% 0.91% 12.35% 13.61% 11.09%16 3.70% 7.95% 0.91% 12.56% 13.83% 11.29%17 3.70% 8.07% 0.91% 12.68% 13.96% 11.40%
ANSI/AAMI CI86
18.00%
15.00%
12.00%
9.00%
6.00%
3.00%
0.00%
CR
P
YEARS
21.00%
24.00%
27.00%
30.00%Adults Combined Children
REMOVAL RATES ANALYSIS FOR ALL ANALYSIS CATEGORIESAND DIFFERENT PATIENT POPULATIONS
1 2 3 4 5 6 7 8 9 10 11 12 13 14 15 16 17
18.00%
15.00%
12.00%
9.00%
6.00%
3.00%
0.00%
CR
P
YEARS
21.00%
24.00%
27.00%
30.00%
1 2 3 4 5 6 7 8 9 10 11 12 13 14 15 16 17
REMOVAL RATES ANALYSISCATEGORY FOR CHILDREN
All categories Medical Device Inconclusive
18.00%
15.00%
12.00%
9.00%
6.00%
3.00%
0.00%
CR
P
YEARS
21.00%
24.00%
27.00%
30.00%
1 2 3 4 5 6 7 8 9 10 11 12 13 14 15 16 17
REMOVAL RATES ANALYSISCATEGORY FOR ADULTS
All categories Medical Device Inconclusive
18.00%
15.00%
12.00%
9.00%
6.00%
3.00%
0.00%
CR
P
YEARS
21.00%
24.00%
27.00%
30.00%
1 2 3 4 5 6 7 8 9 10 11 12 13 14 15 16 17
REMOVAL RATES ANALYSISCATEGORY FOR ADULTS AND CHILDREN
All categories Medical Device Inconclusive
Not all data may be shown alongside the graphs due to space limitations. Please see the Appendix at the end of the report for a complete data set.

24 Reliability Report Spring 2021
HIRES 90K vendor B
YEARS
1 2 3 4 5 6 7 8 9 10 11 12 13 14 15 16
Adults Combined Children
100.00%
95.00%
CS
R
90.00%
85.00%
75.00%
80.00%
70.00%
65.00%
60.00%
55.00%
50.00%
45.00%
40.00%
35.00%
30.00%
25.00%
ISO 5841-2:2014
CUMULATIVE SURVIVAL PERCENTAGE
Years in use 1 2 3 4 5 6 7 8 9 10 11 12 13 14 15 16
ADULTS 97.89% 91.83% 87.54% 83.70% 80.50% 78.17% 75.22% 73.16% 71.77% 70.36% 69.42% 68.06% 67.05% 66.26% 65.78% 65.40%
COMBINED 97.79% 91.55% 86.24% 81.86% 78.44% 75.69% 72.69% 70.49% 68.66% 67.05% 66.11% 64.97% 63.73% 63.07% 62.37% 62.00%
CHILDREN 97.64% 91.17% 84.59% 79.50% 75.77% 72.53% 69.45% 67.03% 64.67% 62.79% 61.84% 60.95% 59.42% 58.90% 57.93% 57.56%
Number of registered HiRes 90K implants (vendor B)As of March 29, 2021.Last year of distribution‡. Subject to voluntary recall in 2006.
STANDARD ADULTS CHILDREN COMBINED
ISO 5841-2:2014 2204 1837 4065†
ANSI/AAMI CI86 2561* 1504 4065
‡ Dates provided are those for major markets covered by FDA and TUV regulation. Some implants may be pending approval in a subset of additional regions.* The adult number also includes users whose personal information is not available or may not be obtainable due to certain privacy laws in certain countries. † The combined number also includes any registered users for whom we do not have date of birth information.

25Implantable Cochlear Stimulators
COMBINED ADULTS AND CHILDREN
Year Medical CRP Device CRP Inconclusive CRP Total All Categories Total
CI Up CI Down
1 0.98% 3.14% 0.00% 4.12% 4.73% 3.51%
2 1.32% 11.11% 0.08% 12.52% 13.53% 11.50%
3 1.58% 17.53% 0.14% 19.26% 20.46% 18.05%
4 1.74% 22.69% 0.17% 24.60% 25.92% 23.28%
5 1.90% 26.67% 0.24% 28.81% 30.20% 27.42%
6 2.04% 29.65% 0.24% 31.93% 33.36% 30.50%
7 2.12% 32.76% 0.24% 35.12% 36.58% 33.65%
8 2.39% 34.95% 0.24% 37.58% 39.07% 36.09%
9 2.42% 36.79% 0.24% 39.45% 40.96% 37.95%
10 2.55% 38.43% 0.24% 41.21% 42.73% 39.69%
11 2.63% 39.44% 0.24% 42.31% 43.84% 40.79%
12 2.80% 40.60% 0.33% 43.72% 45.25% 42.19%
13 2.84% 41.83% 0.33% 45.00% 46.54% 43.46%
14 2.98% 42.52% 0.37% 45.86% 47.40% 44.32%
15 3.02% 43.26% 0.37% 46.65% 48.19% 45.11%
16 3.02% 43.67% 0.44% 47.13% 48.68% 45.58%
ANSI/AAMI CI86
Not all data may be shown alongside the graphs due to space limitations. Please see the Appendix at the end of the report for a complete data set.
60.00%
50.00%
40.00%
30.00%
20.00%
10.00%
0.00%1 2 3 4 5 6 7 8 9 10 11 12 13 14 15 16
CR
P
YEARS
70.00%
80.00%
90.00%
100.00%
REMOVAL RATES ANALYSISCATEGORY FOR CHILDREN
All categories Medical Device Inconclusive
60.00%
50.00%
40.00%
30.00%
20.00%
10.00%
0.00%1 2 3 4 5 6 7 8 9 10 11 12 13 14 15 16
CR
P
YEARS
70.00%
80.00%
90.00%
100.00%
REMOVAL RATES ANALYSISCATEGORY FOR ADULTS
All categories Medical Device Inconclusive
60.00%
50.00%
40.00%
30.00%
20.00%
10.00%
0.00%1 2 3 4 5 6 7 8 9 10 11 12 13 14 15 16
CR
P
YEARS
70.00%
80.00%
90.00%
100.00%
REMOVAL RATES ANALYSISCATEGORY FOR ADULTS AND CHILDREN
All categories Medical Device Inconclusive
60.00%
50.00%
40.00%
30.00%
20.00%
10.00%
0.00%1 2 3 4 5 6 7 8 9 10 11 12 13 14 15 16
CR
P
YEARS
70.00%
80.00%
90.00%
100.00%Adults Combined Children
REMOVAL RATES ANALYSIS FOR ALL ANALYSIS CATEGORIESAND DIFFERENT PATIENT POPULATIONS
26 Reliability Report Spring 2021
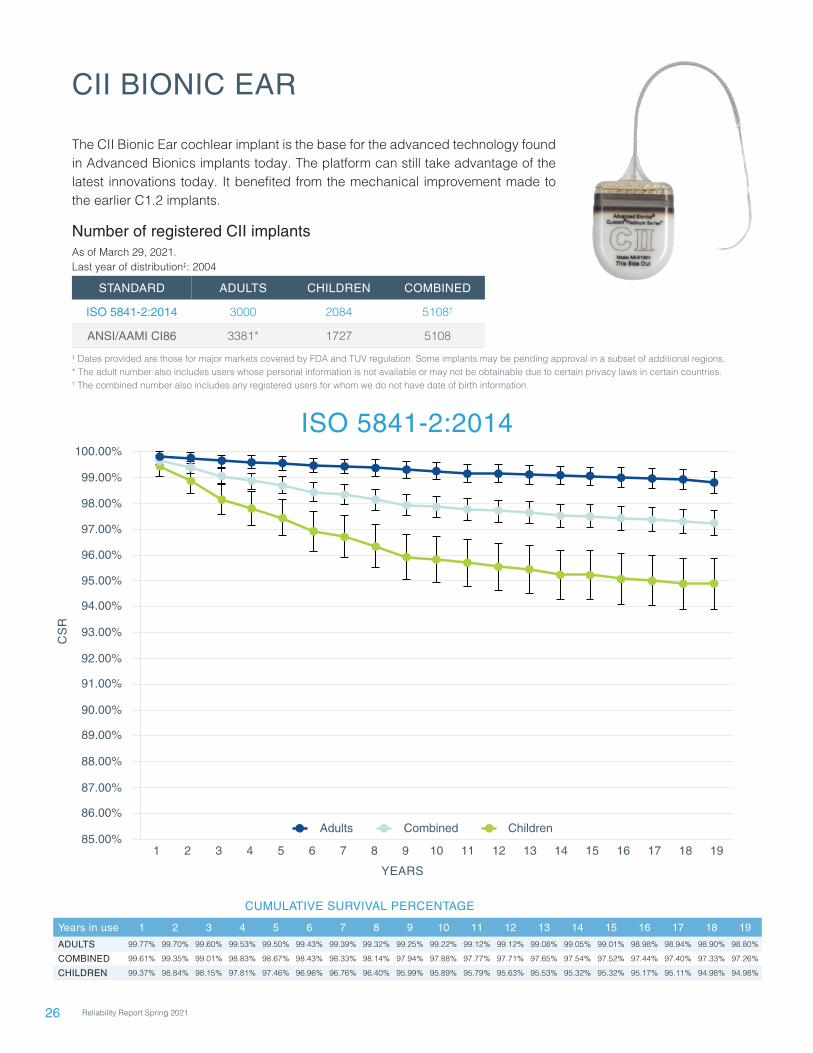
CII BIONIC EAR
The CII Bionic Ear cochlear implant is the base for the advanced technology found in Advanced Bionics implants today. The platform can still take advantage of the latest innovations today. It benefited from the mechanical improvement made to the earlier C1.2 implants.
1 2 3 4 5 6 7 8 9 10 11 12 13 14 15 16 17 18
YEARS
19
Adults Combined Children
100.00%
99.00%
CS
R
98.00%
97.00%
95.00%
96.00%
94.00%
93.00%
92.00%
91.00%
90.00%
89.00%
88.00%
87.00%
86.00%
85.00%
ISO 5841-2:2014
CUMULATIVE SURVIVAL PERCENTAGE
Years in use 1 2 3 4 5 6 7 8 9 10 11 12 13 14 15 16 17 18 19
ADULTS 99.77% 99.70% 99.60% 99.53% 99.50% 99.43% 99.39% 99.32% 99.25% 99.22% 99.12% 99.12% 99.08% 99.05% 99.01% 98.98% 98.94% 98.90% 98.80%
COMBINED 99.61% 99.35% 99.01% 98.83% 98.67% 98.43% 98.33% 98.14% 97.94% 97.88% 97.77% 97.71% 97.65% 97.54% 97.52% 97.44% 97.40% 97.33% 97.26%
CHILDREN 99.37% 98.84% 98.15% 97.81% 97.46% 96.96% 96.76% 96.40% 95.99% 95.89% 95.79% 95.63% 95.53% 95.32% 95.32% 95.17% 95.11% 94.98% 94.98%
Number of registered CII implantsAs of March 29, 2021.Last year of distribution‡: 2004
STANDARD ADULTS CHILDREN COMBINED
ISO 5841-2:2014 3000 2084 5108†
ANSI/AAMI CI86 3381* 1727 5108
‡ Dates provided are those for major markets covered by FDA and TUV regulation. Some implants may be pending approval in a subset of additional regions.* The adult number also includes users whose personal information is not available or may not be obtainable due to certain privacy laws in certain countries. † The combined number also includes any registered users for whom we do not have date of birth information.

27Implantable Cochlear Stimulators
Adults Combined Children
REMOVAL RATES ANALYSIS FOR ALL ANALYSIS CATEGORIESAND DIFFERENT PATIENT POPULATIONS
12.00%
10.00%
8.00%
6.00%
4.00%
2.00%
0.00%1 2 3 4 5 6 7 8 9 10 11 12 13 14 15 16 17 18 19
CR
P
YEARS
14.00%
16.00%
18.00%
20.00%
22.00%
24.00%
26.00%
28.00%
1 2 3 4 5 6 7 8 9 10 11 12 13 14 15 16 17 18 19
YEARS
CR
P
12.00%
10.00%
8.00%
6.00%
4.00%
2.00%
0.00%
14.00%
16.00%
18.00%
20.00%
22.00%
24.00%
26.00%
28.00%
REMOVAL RATES ANALYSISCATEGORY FOR CHILDREN
All categories Medical Device Inconclusive
1 2 3 4 5 6 7 8 9 10 11 12 13 14 15 16 17 18 19
YEARS
6.00%
5.00%
4.00%
3.00%
2.00%
1.00%
0.00%
CR
P
7.00%
8.00%
9.00%
10.00%
11.00%
12.00%
13.00%
14.00%
REMOVAL RATES ANALYSISCATEGORY FOR ADULTS AND CHILDREN
All categories Medical Device Inconclusive
1 2 3 4 5 6 7 8 9 10 11 12 13 14 15 16 17 18 19
YEARS
6.00%
5.00%
4.00%
3.00%
2.00%
1.00%
0.00%
CR
P
7.00%
8.00%
9.00%
10.00%
11.00%
12.00%
13.00%
14.00%
REMOVAL RATES ANALYSISCATEGORY FOR ADULTS
All categories Medical Device Inconclusive
ANSI/AAMI CI86
COMBINED ADULTS AND CHILDREN
Year Medical CRP Device CRP Inconclusive CRP Total All Categories Total
CI Up CI Down1 0.47% 0.55% 0.06% 1.08% 1.36% 0.80%2 0.89% 0.81% 0.22% 1.91% 2.29% 1.54%3 1.24% 1.22% 0.32% 2.79% 3.24% 2.34%4 1.50% 1.42% 0.42% 3.35% 3.84% 2.86%5 1.74% 1.66% 0.54% 3.95% 4.48% 3.42%6 1.93% 2.03% 0.68% 4.64% 5.21% 4.06%7 2.05% 2.25% 0.85% 5.15% 5.75% 4.54%8 2.17% 2.45% 1.01% 5.63% 6.26% 5.01%9 2.37% 2.66% 1.10% 6.13% 6.78% 5.47%10 2.54% 2.84% 1.10% 6.47% 7.14% 5.80%11 2.64% 2.94% 1.18% 6.76% 7.44% 6.08%12 2.89% 3.00% 1.22% 7.11% 7.81% 6.41%13 3.03% 3.09% 1.24% 7.36% 8.07% 6.65%14 3.13% 3.23% 1.26% 7.63% 8.35% 6.91%15 3.24% 3.29% 1.26% 7.79% 8.52% 7.06%16 3.32% 3.35% 1.28% 7.96% 8.69% 7.22%17 3.47% 3.40% 1.33% 8.19% 8.94% 7.45%18 3.56% 3.47% 1.37% 8.40% 9.16% 7.65%19 3.76% 3.57% 1.37% 8.70% 9.47% 7.92%
Not all data may be shown alongside the graphs due to space limitations. Please see the Appendix at the end of the report for a complete data set.

28 Reliability Report Spring 2021
CLARION 1.2
The Clarion 1.2 (C1.2) implant offers mechanical improvements over its predecessor the C1.0 implant, which first introduced independent current-sources, a key technology differentiator for Advanced Bionics implants.
YEARS
1 2 3 4 5 6 7 8 9 10 11 12 13 14 15 16 17 18 19 20 21 22 23 24
Adults Combined Children
100.00%
95.00%
CS
R
90.00%
85.00%
75.00%
80.00%
70.00%
65.00%
60.00%
55.00%
50.00%
45.00%
40.00%
35.00%
ISO 5841-2:2014
CUMULATIVE SURVIVAL PERCENTAGE
Years in use 1 2 3 4 5 6 7 8 9 10 11 12
ADULTS 99.81% 99.56% 98.83% 97.76% 96.57% 95.66% 94.77% 93.73% 93.08% 92.30% 91.51% 90.97%
COMBINED 99.42% 98.72% 97.36% 95.75% 94.10% 92.51% 91.34% 89.93% 89.01% 87.94% 87.09% 86.49%
CHILDREN 99.00% 97.83% 95.80% 93.61% 91.46% 89.14% 87.66% 85.83% 84.63% 83.24% 82.30% 81.63%
Number of registered C1.2 implantsAs of March 29, 2021.Last year of distribution‡: 2004
STANDARD ADULTS CHILDREN COMBINED
ISO 5841-2:2014 4315 4149 8501†
ANSI/AAMI CI86 4964* 3537 8501
‡ Dates provided are those for major markets covered by FDA and TUV regulation. Some implants may be pending approval in a subset of additional regions.* The adult number also includes users whose personal information is not available or may not be obtainable due to certain privacy laws in certain countries. † The combined number also includes any registered users for whom we do not have date of birth information.
Years in use 13 14 15 16 17 18 19 20 21 22 23 24
ADULTS 90.55% 90.13% 89.80% 89.48% 89.07% 88.77% 88.45% 88.23% 88.13% 87.98% 87.82% 87.67%
COMBINED 85.95% 85.54% 84.84% 84.30% 83.80% 83.34% 82.98% 82.71% 82.45% 82.18% 82.00% 81.84%
CHILDREN 80.95% 80.55% 79.42% 78.64% 78.02% 77.38% 76.97% 76.63% 76.17% 75.74% 75.53% 75.35%

29Implantable Cochlear Stimulators
20.00%
10.00%
0.00%
CR
P
30.00%
40.00%
50.00%
60.00%
70.00%
80.00%
90.00%
100.00%
YEARS
1 2 3 4 5 6 7 8 9 10 11 12 13 14 15 16 17 18 19 20 21 22 23 24
Adults Combined Children
REMOVAL RATES ANALYSIS FOR ALL ANALYSIS CATEGORIESAND DIFFERENT PATIENT POPULATIONS
20.00%
10.00%
0.00%
CR
P
30.00%
40.00%
50.00%
60.00%
70.00%
80.00%
90.00%
100.00%
YEARS
1 2 3 4 5 6 7 8 9 10 11 12 13 14 15 16 17 18 19 20 21 22 23 24
REMOVAL RATES ANALYSISCATEGORY FOR CHILDREN
All categories Medical Device Inconclusive
ANSI/AAMI CI86
COMBINED ADULTS AND CHILDREN
Year Medical CRP Device CRP Inconclusive CRP Total All Categories Total
CI Up CI Down1 0.36% 0.97% 0.13% 1.45% 1.71% 1.20%2 0.50% 1.80% 0.24% 2.54% 2.87% 2.20%3 0.68% 3.26% 0.41% 4.35% 4.78% 3.92%4 0.88% 4.98% 0.58% 6.45% 6.97% 5.93%5 1.07% 6.67% 0.84% 8.58% 9.17% 7.99%6 1.37% 8.34% 1.01% 10.72% 11.37% 10.07%7 1.57% 9.65% 1.17% 12.38% 13.08% 11.69%8 1.80% 11.24% 1.38% 14.42% 15.16% 13.68%9 2.01% 12.22% 1.66% 15.89% 16.66% 15.12%10 2.25% 13.46% 1.99% 17.70% 18.50% 16.90%11 2.46% 14.36% 2.21% 19.03% 19.85% 18.20%12 2.72% 14.93% 2.44% 20.09% 20.94% 19.25%13 2.97% 15.49% 2.57% 21.03% 21.88% 20.17%14 3.22% 15.97% 2.67% 21.86% 22.73% 20.99%15 3.59% 16.70% 2.80% 23.09% 23.97% 22.20%16 4.08% 17.28% 2.97% 24.33% 25.23% 23.43%17 4.57% 17.83% 3.18% 25.58% 26.50% 24.67%18 5.45% 18.29% 3.31% 27.05% 27.98% 26.12%19 6.22% 18.67% 3.42% 28.31% 29.25% 27.37%20 7.10% 18.92% 3.56% 29.58% 30.54% 28.62%21 7.60% 19.17% 3.69% 30.46% 31.43% 29.48%22 8.21% 19.51% 3.82% 31.54% 32.54% 30.54%23 8.85% 19.69% 3.87% 32.41% 33.45% 31.37%24 9.77% 19.85% 3.97% 33.59% 34.73% 32.45%
20.00%
10.00%
0.00%
CR
P
30.00%
40.00%
50.00%
60.00%
70.00%
80.00%
90.00%
100.00%
YEARS
1 2 3 4 5 6 7 8 9 10 11 12 13 14 15 16 17 18 19 20 21 22 23 24
REMOVAL RATES ANALYSISCATEGORY FOR ADULT AND CHILDREN
All categories Medical Device Inconclusive
20.00%
10.00%
0.00%
CR
P
30.00%
40.00%
50.00%
60.00%
70.00%
80.00%
90.00%
100.00%
YEARS
1 2 3 4 5 6 7 8 9 10 11 12 13 14 15 16 17 18 19 20 21 22 23 24
REMOVAL RATES ANALYSISCATEGORY FOR ADULT
All categories Medical Device Inconclusive
Not all data may be shown alongside the graphs due to space limitations. Please see the Appendix at the end of the report for a complete data set.

30 Reliability Report Spring 2021
CLARION 1.0
The Clarion 1.0 (C1.0) implant was Advanced Bionics first device, the start of a technology-forward lineage that continues today. As the number of children implanted with the C1.0 is below the level required for statistical analysis, the data is included with the adult data.
1 2 3 4 5 6 7 8 9 10 11 12 13 14 15 16 17 22
YEARS
18 19 20 21 23 24 25
Adults Combined
100.00%
95.00%
CS
R
90.00%
85.00%
75.00%
80.00%
70.00%
65.00%
60.00%
55.00%
50.00%
45.00%
40.00%
35.00%
ISO 5841-2:2014
CUMULATIVE SURVIVAL PERCENTAGE
Years in use 1 2 3 4 5 6 7 8 9 10 11 12 13
ADULTS 97.78% 97.47% 96.19% 95.56% 94.28% 93.32% 93.32% 92.68% 91.72% 91.39% 90.42% 90.42% 90.42%
COMBINED 98.09% 96.73% 95.63% 95.08% 93.99% 92.89% 92.89% 92.34% 91.50% 91.23% 90.39% 90.11% 89.55%
Years in use 14 15 16 17 18 19 20 21 22 23 24 25
ADULTS 89.77% 89.11% 88.45% 88.12% 88.12% 88.12% 88.12% 87.78% 87.44% 87.11% 86.42% 85.72%
COMBINED 88.98% 88.42% 87.85% 87.28% 87.28% 87.28% 87.28% 87.00% 86.71% 86.13% 85.54% 84.94%
Number of registered C1.0 implantsAs of March 29, 2021.Last year of distribution‡: 2004
STANDARD ADULTS CHILDREN COMBINED
ISO 5841-2:2014 316 49 367†
ANSI/AAMI CI86 - - -
‡ Dates provided are those for major markets covered by FDA and TUV regulation. Some implants may be pending approval in a subset of additional regions.† The combined number also includes any registered users for whom we do not have date of birth information.

31Implantable Cochlear Stimulators
The ANSI/AAMI CI86 Standard does not require reporting for devices older than 20 years after the last implantation of that device type. Please refer to the ISO data for information.
ANSI/AAMI CI86

32 Reliability Report Spring 2021
SOUND PROCESSOR STIMULATORS
For each currently-available sound processor, there will be a simple reliability number based on the average global yearly return rate and graphical data in compliance with ANSI/AAMI CI86 Standard that shows the monthly failure rate.
Where possible this monthly data is further categorized into failure mechanisms, if known, to include mechanical, electronic, moisture damage, and other. In specification processors, commonly referred to as no-fault-found, are also included. Where available, the number of registered users is shown, categorized into adult, children, and combined.
NAÍDA CI M AND SKY CI M
The Naída™ CI M sound processor for adults and Sky CI™ M sound processor for children are the newest Advanced Bionics products integrated with the latest advancements from Phonak, the Marvel platform. With built-in connectivity solutions and the ability to automatically sense and adapt to every situation, the Naída CI M and Sky CI M processors are designed to give you the best hearing experience.
As field data becomes available we will present the reliability metrics on these processors in future reports.

33Sound Processors
* Reliability is 1 minus the return rate. The return rate is the average global monthly return rate over a 12-month period from February 2020 to February 2021.
Mechanical Moisture Electrical Other
2020Feb Mar Apr May Jun Jul Aug Sep Oct Nov Dec Jan Feb
2021
2.00%
1.00%
0.00%
5.00%
4.00%
3.00%
NAÍDA CI Q90
The Naída CI Q90 sound processor features state-of-the-art technologies exclusively available from Advanced Bionics and Phonak for the best possible hearing experience.
RELIABILITY: 99.51%*
‡The number per month represents the unit that complete failure analisys in that month.
FAILED COMPONENT RETURN RATE‡
Cause Feb 2020 Mar 2020 Apr 20202 May 2020 Jun 2020 Jul 2020 Aug 2020 Sep 2020 Oct 2020 Nov 2020 Dec 2020 Jan 2021 Feb 2021
Mechanical 0.16% 0.15% 0.14% 0.13% 0.19% 0.27% 0.23% 0.20% 0.22% 0.11% 0.15% 0.15% 0.15%
Moisture 0.18% 0.21% 0.09% 0.15% 0.26% 0.23% 0.23% 0.26% 0.20% 0.20% 0.17% 0.18% 0.13%
Electrical 0.12% 0.06% 0.08% 0.06% 0.09% 0.10% 0.10% 0.06% 0.07% 0.08% 0.04% 0.08% 0.07%
Other 0.04% 0.06% 0.05% 0.07% 0.05% 0.10% 0.07% 0.09% 0.04% 0.03% 0.02% 0.00% 0.01%
34 Reliability Report Spring 2021
Mechanical Moisture Electrical Other
2020Feb Mar Apr May Jun Jul Aug Sep Oct Nov Dec Jan Feb
2021
2.00%
1.00%
0.00%
5.00%
4.00%
3.00%
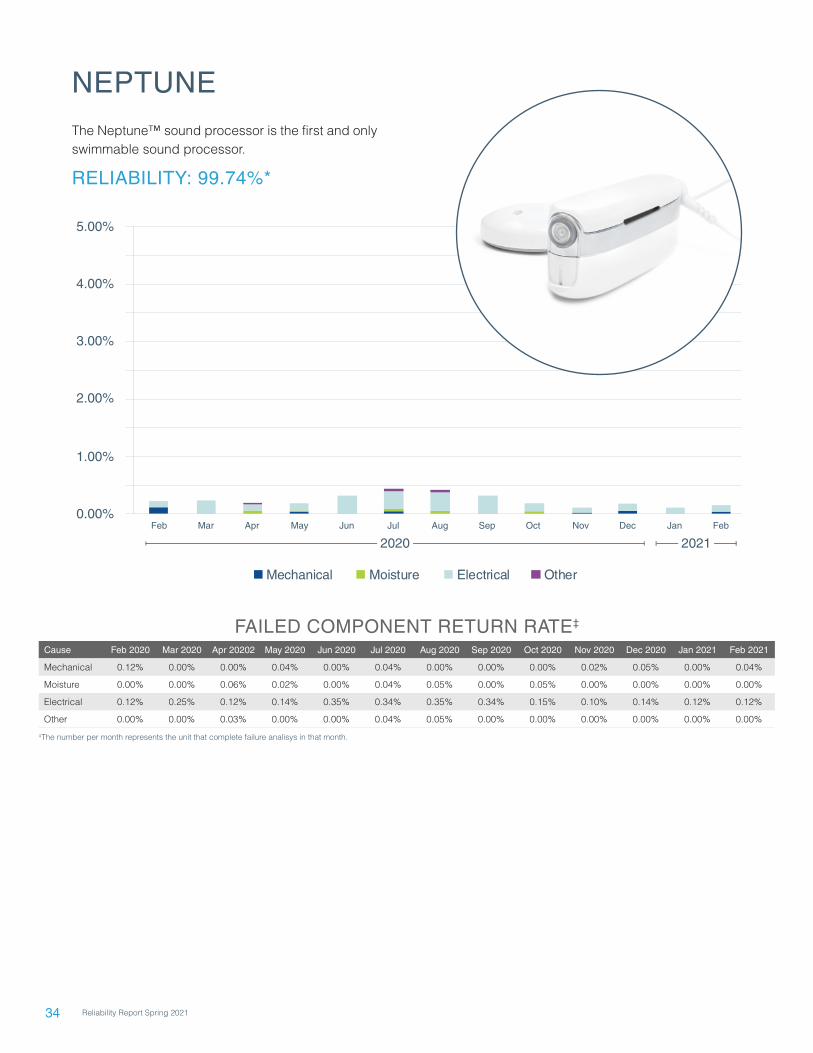
NEPTUNE
The Neptune™ sound processor is the first and only swimmable sound processor.
RELIABILITY: 99.74%*
‡The number per month represents the unit that complete failure analisys in that month.
FAILED COMPONENT RETURN RATE‡
Cause Feb 2020 Mar 2020 Apr 20202 May 2020 Jun 2020 Jul 2020 Aug 2020 Sep 2020 Oct 2020 Nov 2020 Dec 2020 Jan 2021 Feb 2021
Mechanical 0.12% 0.00% 0.00% 0.04% 0.00% 0.04% 0.00% 0.00% 0.00% 0.02% 0.05% 0.00% 0.04%
Moisture 0.00% 0.00% 0.06% 0.02% 0.00% 0.04% 0.05% 0.00% 0.05% 0.00% 0.00% 0.00% 0.00%
Electrical 0.12% 0.25% 0.12% 0.14% 0.35% 0.34% 0.35% 0.34% 0.15% 0.10% 0.14% 0.12% 0.12%
Other 0.00% 0.00% 0.03% 0.00% 0.00% 0.04% 0.05% 0.00% 0.00% 0.00% 0.00% 0.00% 0.00%

35Sound Processors
HARMONY
The Harmony™ sound processor is compatible with C1.0 and C1.2 cochlear implants, providing performance-driven technology. Harmony processor is no longer commercially marketed in the United States. It is only provided as an upgrade processor for C1 users, and therefore is out of the scope for the CI86 reporting.
RELIABILITY: 99.83%*
CHORUS
The Chorus™ sound processor is compatible with C1.0 and C1.2 cochlear implants, and offers integrated Roger™ technology for connectivity and performance.
RELIABILITY: 99.65%*
* Reliability is 1 minus the return rate. The return rate is the average global monthly return rate over a 12-month period from February 2020 to February 2021.
Mechanical Moisture Electrical Other
2020Feb Mar Apr May Jun Jul Aug Sep Oct Nov Dec Jan Feb
2021
2.00%
1.00%
0.00%
5.00%
4.00%
3.00%
‡The number per month represents the unit that complete failure analisys in that month.
FAILED COMPONENT RETURN RATE‡
Cause Feb 2020 Mar 2020 Apr 20202 May 2020 Jun 2020 Jul 2020 Aug 2020 Sep 2020 Oct 2020 Nov 2020 Dec 2020 Jan 2021 Feb 2021
Mechanical 0.00% 0.16% 0.00% 0.00% 0.00% 0.00% 0.22% 0.41% 0.64% 0.00% 0.38% 0.00% 0.00%
Moisture 0.00% 0.00% 0.00% 0.00% 0.00% 0.00% 0.00% 0.00% 0.00% 0.00% 0.00% 0.00% 0.00%
Electrical 0.35% 0.00% 0.16% 0.15% 0.44% 0.13% 0.43% 0.62% 0.00% 0.00% 0.00% 0.00% 0.13%
Other 0.00% 0.17% 0.00% 0.00% 0.00% 0.13% 0.00% 0.00% 0.00% 0.00% 0.00% 0.00% 0.00%

36 Reliability Report Spring 2021
ANNEX
STANDARD ANSI/AAMI CI86
HIRES ULTRA 3D V2
Year Medical CRP Device CRP Inconclusive CRP Total All Categories
ADULTS 1 0.54% 0.00% 0.00% 0.54%CHILDREN 1 0.36% 0.00% 0.00% 0.36%
HIRES ULTRA V2
Year Medical CRP Device CRP Inconclusive CRP Total All Categories
ADULTS 1 0.00% 0.00% 0.00% 0.00%CHILDREN 1 0.00% 0.00% 0.00% 0.00%
HIRES ULTRA 3D V1
Year Medical CRP Device CRP Inconclusive CRP Total All Categories Total
CI Up CI Down
ADULTS1 0.88% 0.12% 0.02% 1.02% 1.29% 0.74%2 1.26% 0.95% 0.05% 2.26% 2.73% 1.79%
CHILDREN1 1.05% 0.45% 0.00% 1.50% 2.15% 0.85%2 1.54% 4.35% 0.00% 5.89% 7.41% 4.37%
HIRES ULTRA V1
Year Medical CRP Device CRP Inconclusive CRP Total All Categories Total
CI Up CI Down
ADULTS
1 0.75% 0.02% 0.02% 0.80% 0.99% 0.61%2 1.21% 0.34% 0.04% 1.58% 1.86% 1.31%3 1.53% 2.17% 0.07% 3.78% 4.24% 3.31%4 1.65% 5.64% 0.11% 7.40% 8.23% 6.57%
CHILDREN
1 0.53% 0.11% 0.00% 0.64% 0.90% 0.39%2 0.72% 0.67% 0.03% 1.43% 1.83% 1.03%3 0.87% 4.05% 0.08% 5.01% 5.90% 4.12%4 1.24% 13.72% 0.08% 15.04% 17.14% 12.94%

37Implantable Cochlear Stimulators
HIRES 90K ADVANTAGEYear Medical CRP Device CRP Inconclusive CRP Total All Categories
TotalCI Up CI Down
ADULTS
1 0.68% 0.07% 0.02% 0.76% 0.89% 0.64%2 1.19% 0.09% 0.03% 1.30% 1.47% 1.14%3 1.46% 0.14% 0.04% 1.64% 1.82% 1.45%4 1.74% 0.17% 0.04% 1.96% 2.16% 1.76%5 1.94% 0.21% 0.04% 2.20% 2.42% 1.98%6 2.10% 0.23% 0.06% 2.39% 2.62% 2.16%7 2.21% 0.23% 0.07% 2.51% 2.76% 2.26%8 2.33% 0.28% 0.07% 2.68% 2.99% 2.38%
CHILDREN
1 0.76% 0.21% 0.03% 1.01% 1.15% 0.86%2 1.09% 0.40% 0.05% 1.53% 1.72% 1.35%3 1.38% 0.62% 0.06% 2.06% 2.28% 1.84%4 1.57% 0.81% 0.11% 2.49% 2.74% 2.24%5 1.68% 0.95% 0.19% 2.82% 3.09% 2.54%6 1.88% 1.11% 0.19% 3.18% 3.49% 2.87%7 1.94% 1.34% 0.22% 3.50% 3.86% 3.14%8 1.94% 1.49% 0.22% 3.65% 4.06% 3.23%
HIRES 90K vendor A post-mod
Year Medical CRP Device CRP Inconclusive CRP Total All Categories Total
CI Up CI Down
ADULTS
1 0.80% 0.06% 0.02% 0.88% 0.97% 0.78%2 1.32% 0.11% 0.04% 1.48% 1.59% 1.36%3 1.64% 0.16% 0.06% 1.86% 2.00% 1.73%4 1.92% 0.23% 0.08% 2.24% 2.39% 2.09%5 2.15% 0.28% 0.09% 2.52% 2.68% 2.36%6 2.30% 0.35% 0.12% 2.77% 2.94% 2.60%7 2.45% 0.37% 0.13% 2.95% 3.12% 2.77%8 2.59% 0.45% 0.14% 3.18% 3.36% 2.99%9 2.68% 0.48% 0.14% 3.31% 3.50% 3.11%10 2.79% 0.56% 0.16% 3.51% 3.72% 3.30%11 2.84% 0.62% 0.16% 3.61% 3.82% 3.40%12 2.96% 0.63% 0.16% 3.74% 3.97% 3.52%13 3.09% 0.64% 0.18% 3.91% 4.15% 3.67%14 3.19% 0.66% 0.18% 4.03% 4.30% 3.77%15 3.29% 0.66% 0.18% 4.13% 4.42% 3.84%
CHILDREN
1 0.81% 0.21% 0.03% 1.05% 1.16% 0.95%2 1.13% 0.48% 0.04% 1.65% 1.78% 1.53%3 1.39% 0.76% 0.06% 2.21% 2.36% 2.06%4 1.59% 1.03% 0.09% 2.71% 2.88% 2.54%5 1.75% 1.26% 0.13% 3.14% 3.33% 2.96%6 1.90% 1.45% 0.15% 3.49% 3.69% 3.30%7 2.02% 1.57% 0.16% 3.74% 3.95% 3.54%8 2.08% 1.71% 0.18% 3.97% 4.19% 3.75%9 2.19% 1.80% 0.19% 4.18% 4.41% 3.95%10 2.43% 1.97% 0.24% 4.63% 4.90% 4.37%11 2.56% 2.00% 0.26% 4.83% 5.11% 4.55%12 2.73% 2.11% 0.29% 5.13% 5.44% 4.82%13 2.86% 2.13% 0.31% 5.30% 5.63% 4.98%14 3.00% 2.17% 0.31% 5.48% 5.85% 5.12%15 3.09% 2.25% 0.40% 5.74% 6.19% 5.28%

38 Reliability Report Spring 2021
HIRES 90K vendor A all
Year Medical CRP Device CRP Inconclusive CRP Total All Categories Total
CI Up CI Down
ADULTS
1 0.79% 0.08% 0.01% 0.89% 0.98% 0.80%2 1.31% 0.14% 0.05% 1.50% 1.62% 1.38%3 1.63% 0.20% 0.08% 1.91% 2.04% 1.77%4 1.91% 0.31% 0.10% 2.32% 2.46% 2.17%5 2.13% 0.37% 0.11% 2.61% 2.77% 2.45%6 2.29% 0.46% 0.14% 2.88% 3.05% 2.72%7 2.44% 0.49% 0.16% 3.09% 3.26% 2.91%8 2.58% 0.61% 0.16% 3.35% 3.54% 3.16%9 2.66% 0.70% 0.17% 3.53% 3.73% 3.34%10 2.78% 0.81% 0.19% 3.77% 3.98% 3.56%11 2.83% 0.90% 0.19% 3.92% 4.14% 3.70%12 2.97% 0.97% 0.19% 4.12% 4.36% 3.89%13 3.09% 1.02% 0.22% 4.33% 4.58% 4.08%14 3.24% 1.15% 0.22% 4.61% 4.89% 4.33%15 3.33% 1.23% 0.22% 4.78% 5.09% 4.47%16 3.38% 1.39% 0.22% 4.98% 5.34% 4.62%17 3.38% 1.47% 0.22% 5.07% 5.47% 4.67%
CHILDREN
1 0.79% 0.22% 0.03% 1.05% 1.15% 0.94%2 1.31% 0.50% 0.04% 1.86% 1.99% 1.73%3 1.63% 0.79% 0.07% 2.49% 2.64% 2.34%4 1.91% 1.08% 0.09% 3.08% 3.25% 2.92%5 2.13% 1.33% 0.14% 3.60% 3.78% 3.41%6 2.29% 1.54% 0.15% 3.98% 4.17% 3.78%7 2.44% 1.69% 0.18% 4.30% 4.51% 4.09%8 2.58% 1.87% 0.20% 4.65% 4.87% 4.43%9 2.66% 1.98% 0.21% 4.85% 5.09% 4.62%10 2.78% 2.17% 0.26% 5.21% 5.47% 4.94%11 2.83% 2.25% 0.29% 5.37% 5.66% 5.09%12 2.97% 2.45% 0.32% 5.74% 6.06% 5.43%13 3.09% 2.53% 0.34% 5.96% 6.29% 5.62%14 3.24% 2.75% 0.34% 6.34% 6.72% 5.95%15 3.33% 3.01% 0.39% 6.72% 7.20% 6.25%16 3.38% 3.29% 0.39% 7.06% 7.63% 6.49%17 3.38% 3.47% 0.39% 7.24% 7.90% 6.58%
HIRES 90K vendor A pre-mod
Year Medical CRP Device CRP Inconclusive CRP Total All Categories Total
CI Up CI Down
ADULTS
1 0.72% 0.42% 0.00% 1.15% 1.66% 0.64%2 1.03% 0.85% 0.24% 2.12% 2.81% 1.43%3 1.33% 1.09% 0.49% 2.92% 3.72% 2.11%4 1.58% 1.89% 0.55% 4.03% 4.97% 3.09%5 1.70% 2.33% 0.62% 4.64% 5.65% 3.64%6 1.89% 2.76% 0.68% 5.33% 6.40% 4.26%7 2.14% 3.01% 0.74% 5.89% 7.01% 4.77%8 2.20% 3.57% 0.74% 6.51% 7.69% 5.34%9 2.27% 4.25% 0.74% 7.26% 8.50% 6.03%10 2.40% 4.63% 0.81% 7.83% 9.11% 6.55%11 2.52% 5.01% 0.81% 8.34% 9.65% 7.02%12 2.78% 5.45% 0.81% 9.04% 10.40% 7.67%13 2.85% 5.70% 0.87% 9.42% 10.81% 8.03%14 3.17% 6.14% 0.87% 10.19% 11.63% 8.75%15 3.24% 6.33% 0.87% 10.44% 11.90% 8.99%16 3.31% 6.46% 0.87% 10.64% 12.11% 9.17%17 3.31% 6.55% 0.87% 10.73% 12.20% 9.25%

39Implantable Cochlear Stimulators
Year Medical CRP Device CRP Inconclusive CRP Total All Categories Total
CI Up CI Down
CHILDREN
1 1.24% 0.79% 0.00% 2.03% 2.95% 1.10%2 1.46% 1.36% 0.12% 2.94% 4.04% 1.83%3 2.04% 2.16% 0.23% 4.43% 5.78% 3.09%4 2.39% 3.09% 0.23% 5.71% 7.22% 4.19%5 2.50% 3.90% 0.35% 6.75% 8.39% 5.12%6 2.62% 4.71% 0.47% 7.81% 9.55% 6.06%7 3.10% 5.53% 0.72% 9.35% 11.24% 7.46%8 3.71% 6.59% 0.72% 11.01% 13.04% 8.98%9 3.71% 6.94% 0.72% 11.36% 13.42% 9.30%10 3.83% 7.42% 0.84% 12.09% 14.20% 9.97%11 4.20% 7.89% 0.97% 13.06% 15.24% 10.88%12 4.20% 8.84% 0.97% 14.01% 16.26% 11.76%13 4.20% 9.20% 0.97% 14.37% 16.64% 12.10%14 4.20% 10.04% 0.97% 15.21% 17.53% 12.88%15 4.45% 10.52% 0.97% 15.94% 18.31% 13.57%16 4.45% 10.76% 0.97% 16.19% 18.57% 13.80%17 4.45% 10.94% 0.97% 16.36% 18.77% 13.96%
HIRES 90K vendor B
Year Medical CRP Device CRP Inconclusive CRP Total All Categories Total
CI Up CI Down
ADULTS
1 1.03% 3.03% 0.00% 4.06% 4.82% 3.30%2 1.33% 10.84% 0.09% 12.25% 13.52% 10.99%3 1.65% 16.16% 0.18% 17.98% 19.46% 16.50%4 1.84% 20.68% 0.23% 22.74% 24.36% 21.12%5 1.94% 24.29% 0.28% 26.51% 28.21% 24.80%6 2.05% 26.73% 0.28% 29.06% 30.82% 27.31%7 2.16% 29.76% 0.28% 32.20% 34.01% 30.39%8 2.45% 31.65% 0.28% 34.38% 36.22% 32.54%9 2.45% 33.21% 0.28% 35.94% 37.80% 34.08%10 2.63% 34.70% 0.28% 37.61% 39.49% 35.74%11 2.63% 35.66% 0.28% 38.57% 40.46% 36.68%12 2.70% 36.99% 0.28% 39.97% 41.87% 38.06%13 2.76% 38.04% 0.28% 41.08% 42.99% 39.16%14 2.90% 38.83% 0.28% 42.01% 43.93% 40.09%15 2.96% 39.46% 0.28% 42.71% 44.63% 40.78%16 2.96% 39.94% 0.28% 43.18% 45.12% 41.24%
CHILDREN
1 0.88% 3.34% 0.00% 4.22% 5.24% 3.21%2 1.31% 11.58% 0.07% 12.96% 14.65% 11.27%3 1.47% 19.87% 0.07% 21.42% 23.48% 19.35%4 1.56% 26.10% 0.07% 27.74% 30.00% 25.48%5 1.84% 30.72% 0.17% 32.73% 35.10% 30.36%6 2.04% 34.59% 0.17% 36.81% 39.25% 34.37%7 2.04% 37.85% 0.17% 40.07% 42.55% 37.58%8 2.27% 40.56% 0.17% 43.00% 45.51% 40.49%9 2.39% 42.86% 0.17% 45.42% 47.95% 42.89%10 2.39% 44.75% 0.17% 47.30% 49.84% 44.77%11 2.63% 45.87% 0.17% 48.67% 51.22% 46.13%12 3.02% 46.71% 0.43% 50.16% 52.71% 47.62%13 3.02% 48.27% 0.43% 51.72% 54.26% 49.17%14 3.15% 48.77% 0.57% 52.49% 55.03% 49.94%15 3.15% 49.69% 0.57% 53.41% 55.96% 50.86%16 3.15% 50.00% 0.77% 53.92% 56.47% 51.36%

40 Reliability Report Spring 2021
CII BIONIC EAR
Year Medical CRP Device CRP Inconclusive CRP Total All Categories Total
CI Up CI Down
ADULTS
1 0.47% 0.39% 0.03% 0.89% 1.21% 0.57%
2 0.83% 0.42% 0.18% 1.43% 1.83% 1.03%
3 1.07% 0.60% 0.30% 1.96% 2.43% 1.50%
4 1.37% 0.66% 0.39% 2.41% 2.93% 1.90%
5 1.55% 0.75% 0.42% 2.72% 3.26% 2.17%
6 1.67% 0.90% 0.48% 3.05% 3.63% 2.47%
7 1.79% 0.96% 0.66% 3.41% 4.02% 2.80%
8 1.91% 1.05% 0.76% 3.72% 4.35% 3.08%
9 2.12% 1.14% 0.82% 4.08% 4.75% 3.42%
10 2.27% 1.20% 0.82% 4.30% 4.98% 3.62%
11 2.37% 1.30% 0.85% 4.51% 5.21% 3.81%
12 2.58% 1.30% 0.88% 4.75% 5.47% 4.04%
13 2.64% 1.36% 0.88% 4.88% 5.60% 4.15%
14 2.70% 1.45% 0.88% 5.03% 5.76% 4.30%
15 2.82% 1.51% 0.88% 5.21% 5.96% 4.47%
16 2.88% 1.57% 0.88% 5.34% 6.09% 4.58%
17 2.95% 1.64% 0.88% 5.46% 6.22% 4.70%
18 3.05% 1.67% 0.91% 5.63% 6.40% 4.86%19 3.14% 1.76% 0.91% 5.82% 6.61% 5.03%
CHILDREN
1 0.47% 0.87% 0.12% 1.45% 2.02% 0.89%2 1.00% 1.57% 0.29% 2.86% 3.65% 2.08%
3 1.59% 2.46% 0.35% 4.40% 5.37% 3.44%
4 1.77% 2.94% 0.48% 5.18% 6.22% 4.14%
5 2.13% 3.47% 0.78% 6.39% 7.53% 5.24%
6 2.44% 4.25% 1.09% 7.79% 9.04% 6.53%
7 2.56% 4.80% 1.22% 8.58% 9.89% 7.27%
8 2.69% 5.22% 1.53% 9.44% 10.81% 8.08%
9 2.87% 5.65% 1.66% 10.18% 11.60% 8.77%
10 3.06% 6.08% 1.66% 10.80% 12.25% 9.36%
11 3.19% 6.20% 1.85% 11.24% 12.72% 9.77%
12 3.51% 6.39% 1.92% 11.81% 13.31% 10.31%
13 3.83% 6.51% 1.98% 12.32% 13.85% 10.79%
14 4.02% 6.76% 2.05% 12.82% 14.38% 11.27%
15 4.08% 6.82% 2.05% 12.95% 14.51% 11.39%
16 4.21% 6.88% 2.11% 13.21% 14.78% 11.63%
17 4.55% 6.88% 2.25% 13.68% 15.28% 12.08%
18 4.62% 7.03% 2.33% 13.99% 15.60% 12.37%19 5.06% 7.14% 2.33% 14.54% 16.20% 12.87%

41Implantable Cochlear Stimulators
CLARION 1.2
Year Medical CRP Device CRP Inconclusive CRP Total All Categories Total
CI Up CI Down
ADULTS
1 0.40% 0.30% 0.14% 0.85% 1.10% 0.59%
2 0.55% 0.65% 0.26% 1.46% 1.79% 1.13%
3 0.75% 1.39% 0.41% 2.54% 2.98% 2.11%
4 0.94% 2.51% 0.60% 4.05% 4.60% 3.50%
5 1.15% 3.79% 0.74% 5.69% 6.33% 5.04%
6 1.41% 4.83% 0.83% 7.06% 7.77% 6.35%
7 1.51% 5.72% 0.92% 8.15% 8.91% 7.40%
8 1.71% 6.91% 1.05% 9.67% 10.49% 8.85%
9 1.84% 7.62% 1.21% 10.67% 11.52% 9.82%
10 2.09% 8.57% 1.41% 12.07% 12.97% 11.17%
11 2.27% 9.31% 1.50% 13.08% 14.01% 12.15%
12 2.55% 9.82% 1.71% 14.08% 15.03% 13.12%
13 2.76% 10.31% 1.75% 14.82% 15.80% 13.84%
14 2.94% 10.70% 1.85% 15.49% 16.48% 14.49%
15 3.22% 11.13% 1.92% 16.27% 17.29% 15.26%
16 3.58% 11.52% 1.99% 17.08% 18.12% 16.05%
17 4.03% 11.93% 2.06% 18.02% 19.08% 16.97%
18 4.78% 12.29% 2.09% 19.15% 20.23% 18.07%
19 5.27% 12.58% 2.17% 20.02% 21.12% 18.92%
20 5.90% 12.78% 2.27% 20.94% 22.06% 19.83%
21 6.27% 12.95% 2.34% 21.56% 22.69% 20.42%
22 6.50% 13.16% 2.43% 22.10% 23.26% 20.94%
23 7.18% 13.30% 2.43% 22.92% 24.14% 21.70%24 7.74% 13.44% 2.43% 23.61% 24.93% 22.29%
CHILDREN
1 0.29% 1.90% 0.11% 2.30% 2.80% 1.81%2 0.43% 3.42% 0.20% 4.05% 4.70% 3.40%
3 0.58% 5.89% 0.41% 6.88% 7.71% 6.05%
4 0.80% 8.45% 0.57% 9.82% 10.80% 8.84%
5 0.96% 10.72% 0.98% 12.65% 13.75% 11.56%
6 1.32% 13.29% 1.28% 15.89% 17.08% 14.69%
7 1.66% 15.18% 1.55% 18.38% 19.65% 17.11%
8 1.94% 17.35% 1.90% 21.18% 22.52% 19.85%
9 2.29% 18.70% 2.36% 23.36% 24.74% 21.97%
10 2.52% 20.37% 2.91% 25.79% 27.22% 24.37%
11 2.78% 21.50% 3.33% 27.60% 29.06% 26.14%
12 3.01% 22.18% 3.59% 28.78% 30.25% 27.30%
13 3.32% 22.83% 3.86% 30.01% 31.50% 28.51%
14 3.67% 23.45% 3.98% 31.10% 32.61% 29.59%
15 4.19% 24.62% 4.22% 33.02% 34.56% 31.49%
16 4.92% 25.48% 4.54% 34.94% 36.49% 33.39%
17 5.50% 26.22% 5.00% 36.72% 38.29% 35.15%
18 6.60% 26.85% 5.30% 38.76% 40.34% 37.17%
19 7.87% 27.35% 5.48% 40.70% 42.31% 39.09%
20 9.25% 27.70% 5.69% 42.63% 44.26% 41.01%
21 9.97% 28.08% 5.94% 43.99% 45.64% 42.34%
22 11.30% 28.66% 6.13% 46.08% 47.79% 44.38%
23 11.88% 28.89% 6.28% 47.05% 48.81% 45.29%24 13.48% 29.11% 6.56% 49.16% 51.13% 47.18%

42 Reliability Report Spring 2021
CONTACT US
This report is intended to provide both professionals and our CI wearers with relevant information on the reliability of our products. If you have any questions, please contact us by emailing [email protected] or visit AdvancedBionics.com for more general information.

43Sound Processors

027-N258-02 Rev C©2021 Advanced Bionics AG and affiliates. All rights reserved.
ADVANCED BIONICS LLC – 28515 Westinghouse Place - Valencia, CA 91355, United StatesT: +1.877.829.0026 - T: +1.661.362.1400 - F: +1.661.362.1500 [email protected]
ADVANCED BIONICS GMBH - Feodor-Lynen-Strasse 35 – 30625 Hannover, Germany
For information on additional AB locations, please visit advancedbionics.com/contact
Advanced Bionics - A Sonova brand
Please contact your local AB representative for regulatory approval and availability in your region.